Article

Surface Plasmon-Enhanced Photoelectrochemical Sensor Based on Au Modified TiO2 Nanotubes

1
Department of Chemistry, Key Laboratory of Advanced Energy Material Chemistry (MOE), Tianjin Key Laboratory of Metal and Molecule Based Material Chemistry, Nankai University, Tianjin 300071, China
2
National Demonstration Center for Experimental Chemistry Education, Nankai University, Tianjin 300071, China
*
Authors to whom correspondence should be addressed.
Nanomaterials 2022, 12(12), 2058; https://doi.org/10.3390/nano12122058
Submission received: 27 May 2022 / Revised: 10 June 2022 / Accepted: 13 June 2022 / Published: 15 June 2022

Abstract

:
Based on the enhanced charge separation efficiency of the one-dimensional structure and strong surface plasmon resonance (SPR) of gold, a gold modified TiO2 nanotube (Au/TiO2NTs) glucose photoelectrochemical (PEC) sensor was prepared. It could be activated by visible red light (625 nm). Under optimal conditions, the Au/TiO2NTs sensor exhibited a good sensitivity of 170.37 μA·mM−1·cm−2 in the range of 1–90 μM (R2 = 0.9993), and a detection limit of 1.3 μM (S/N = 3). Due to its high selectivity, good anti-interference ability, and long-term stability, the fabricated Au/TiO2NTs sensor provides practical detection of glucose. It is expected to be used in the construction of non-invasive PEC biosensors.

1. Introduction

Glucose is one of the body’s primary energy sources and an important biomarker in clinical diabetes diagnosis. Diabetes is a severe disease that can lead to severe complications, such as blindness, lower limb amputations, and cardiovascular disease. Sometimes, it can even lead to death. According to the latest report, the number of adults with diabetes worldwide reached 537 million in 2021, with one person dying from diabetes every five seconds on average. Although there is no effective cure for diabetes, complications associated with the disease can be reduced by tightly controlling blood sugar levels. Therefore, it is significant to explore fast and reliable glucose concentration monitoring methods in the treatment of diabetes [1]. Among the reported methods for detecting glucose, photoelectrochemical (PEC) technology has been widely considered for its simple operation, high sensitivity, low detection limit, high specificity, low cost, and so on [2,3,4]. The PEC process is generally composed of photoelectric conversion and an electrochemical process [5]. The analyte changes the properties of the photosensitive material or the electrolyte environment, resulting in a change in the PEC signal intensity; thereby realizing quantitative analysis of the analyte concentration [6].
As the central part of PEC biosensors, the semiconductor materials play the role of molecular fixation, signal generation, and transmission in the system [7,8]. Therefore, the photoelectric properties of the used semiconductors are vital for the performance of PEC sensors. Many photoactive semiconductors with excellent PEC performance have been investigated and applied [9,10].
TiO2 is considered to be the optimal and typical semiconductor nanomaterial for the construction of PEC biosensors, due to its great photocatalytic performance, good stability, non-toxicity, adjustable morphology, and good biocompatibility [11,12]. It is widely used in photocatalysis [13], solar cells [14], and PEC sensors [15], etc. The nano-morphology of TiO2 includes nanosheet [16], nanocrystal [17], nanoarray [18], nanoparticle [19], nanorod [20], nanowire [21], nanoneedle [22,23], nanoflower [24], nanocube [25], and monocrystal forms [26,27]. Due to the difference in morphology, the materials show different physical and chemical properties, and their applications in bioanalytical sensing are also commonly reported [28]. Among all the structures of TiO2, many reports have indicated that a one-dimensional (1D) TiO2 nanotube structure can accelerate the separation efficiency of e and h+ pairs, due to the transport of electrons along the nanotube axis. Thus, electrons are collected efficiently at the junction, and e and h+ pairs are not easily combined [29,30]. What is more, compared with other 1D nanostructures, TiO2 nanotubes have a larger specific surface area; that is, they can provide more active centers, which gives TiO2 nanotubes better PEC performance.
However, TiO2 nanotubes also have their defects. The bandgap determines the wavelength of the excitation light source. Pure TiO2 can only be excited by light in the ultraviolet region (UV; λ < 387 nm), due to its wide bandgap (3.2 eV) [31]. It is worth noting that ultraviolet light is harmful to most biomolecules [32]. The low penetration depth of shortwave excitation sources to biological tissues also limits the application of PEC biosensors in living organism analysis. In addition, the difficulty of surface charge transfer and the easy recombination of electron-hole pairs are also factors that limit the ultimate sensitivity of PEC sensing. Through different modification methods, the PEC performance of TiO2 can be effectively improved. Based on the unique photoelectronic properties of TiO2, advanced photoelectronic materials with high-performance PEC biosensors have been developed, by forming heterojunctions [33], introducing wide bandgap semiconductors [34], loading noble metals, and defect engineering methods [35].
In recent years, it has been found that noble metal nanoparticles with surface plasmon resonance (SPR) characteristics can improve the optical conversion efficiency of TiO2 [36]. In particular, gold nanoparticles (AuNPs), because of their good stability, biocompatibility, synthetic controllability, and excellent catalytic performance [37], have become the research hotspot of SPR-enhanced optical activity [38,39]. When gold nanoparticles interact with the incident light field, the collective excitation of conduction electrons will lead to local surface plasmon resonance (LSPR). Liu et al. introduced a novel plasmonic device that combined the concepts of a perfect absorber and an LSPR sensor, which remained highly absorptive over a wide range of incident angles for both transverse electric (TE) and transverse magnetic (TM) configurations [40]. Zaman and his team mapped and analyzed the optical forces generated by a right-handed plasmonic Archimedean spiral (PAS), which could be used in the initial design process of complex laboratory-on-a-chip systems [41]. Wu et al. reported that highly dispersed AuNPs were modified on the surface of TiO2 nanotube arrays by pulse electrodeposition technology, which could produce the SPR effect and increase the absorption of visible light, to improve the PEC performance of TiO2 [42]. Melvin and his team reported that Au-Pt alloy was supported on the surface of TiO2, and the bimetal was used as an electron absorbent to weaken the rapid recombination of the carrier [43]. In addition, due to the strong SPR effect of noble metals, modification of AuNPs can broaden TiO2 light response to the visible red light range.
Visible red light has many advantages over ultraviolet and other visible light, due to its long wavelength. Biological samples primarily absorb or scatter short-wavelength light, so long-wavelength excitation can eliminate the interference from biological samples. Ali et al. reported that the transmittance of visible red light through human tissues was about 30 times higher than that of near-infrared light. In addition, the refractive index of the visible red light has a higher sensitivity to changes in glucose concentration, achieving higher linearity, faster response time, and accuracy [44].
In this work, AuNPs were modified on TiO2NTs, to fabricate a sensitive sensor of glucose, which could be excited by visible red light at 625 nm. The introduction of gold improved the optical conversion efficiency of TiO2 and expanded its light absorption range. The Au/TiO2NTs sensor exhibited high sensitivity, excellent linearity, low detection limit, good selectivity, and stability, and it is expected to be used for non-invasive blood glucose detection.

2. Materials and Methods

2.1. Materials

Titanium dioxide power (TiO2) was purchased from Shanghai Aladdin Industrial Corporation, (Shanghai, China). Tetrabutyl titanate (C16H36O4Ti), glucose (C6H12O6∙H2O), and sodium hydroxide (NaOH) were purchased from Tian Jin Jing Dong Tian Zheng, (Tianjin, China). Nitric acid (HNO3) and absolute ethanol were procured from Tianjin Guangfu, (Tianjin, China). Nafion solution (20 wt.%) was procured from Tianjin Yifang Technology Co. Ltd., (Tianjin, China). Chlorauric acid tetrahydrate (HAuCl4·4H2O) was bought from Tianjin Guangfu Fine Chemical Research Institute, (Tianjin, China). Saccharose and fructose (99%) were purchased from Shengfei Biotechnology Service Center, Nankai District, Tianjin, China. Lactose (AR), uric acid (99%), and ascorbic acid (AR) were procured from Tianjin Jiangtian Chemical Technology Co., Ltd., (Tianjin, China). All chemicals in this study were analytical grade and could be used without further purification. All experiments were conducted with ultrapure water.

2.2. Preparation of Titanium Dioxide Nanotubes (TiO2NTs)

The hydrogen titanate nanotubes (HTNTs) and stabilized TiO2NTs were prepared according to our previous work [45]. Briefly, pure anatase TiO2 powder was treated by the hydrothermal method in 10 M NaOH solution at 150 °C for 12 h, and then washed with ultrapure water to pH = 7. Then, 0.1 mol/L HNO3 was added to the solution until pH = 2~3. Then, the obtained HTNTs were washed with ultrapure water until the solution was neutral. After centrifugation, the obtained sample was dried at 80 °C for 10 h.
Stabilized TiO2NTs were synthesized using the sol impregnation method, with HTNTs as the precursors. HTNTs were added in titanium sol and stirred for 4 h. After drying at room temperature, the nanotubes were calcined at 400 °C in the air for 2 h to obtain TiO2NTs.

2.3. Preparation of Au/TiO2NTs

The gold-modified TiO2NTs were prepared by a photoreduction process. First, 0.3 g TiO2NTs were dispersed in a mixed solution of 30 mL anhydrous ethanol and 30 mL deionized water, stirred for 0.5 h, and ultrasonically rinsed for 0.5 h. The above suspension was then bubbled with nitrogen for 15 min, to remove the dissolved oxygen. Then, different volumes of 0.01 mol/L HAuCl4·4H2O solution were added, and the mass percentage of gold was 0.25, 0.50, 0.75, and 1.0 wt.%, respectively. Subsequently, the suspension was irradiated under ultraviolet light (300 W Hg lamp) for 2.5 h. Finally, the prepared samples were centrifugated and washed several times, and then dried at 80 °C for 8 h. According to the mass percentage of Au, the obtained samples were marked as 0.25, 0.50, 0.75, and 1.0 wt.% Au/TiO2NTs, respectively. The actual gold loadings in Au/TiO2NTs were 0.193, 0.356, 0.519, and 0.746 wt.%, respectively. This can be attributed to the gold losses in the preparation process.

2.4. Fabrication of Au/TiO2NTs Photoelectrode

The 4-mg as-prepared samples were first dissolved in the mix solution of 720 μL deionized water, 240 μL anhydrous ethanol, and 40 μL 5% Nafion solution. Then the content was ultrasonicated for 0.5 h, to obtain a homogenous suspension. Then, 10 μL of suspension was dropped on the surface of a glassy carbon electrode (GCE, 4 mm in diameter) and dried at room temperature. The coated GCE was denoted as Au/TiO2NTs photoelectrodes.

2.5. Characterization

X-ray diffraction (XRD) was characterized using a diffractometer (Rigaku SmartLab, Rigaku Corporation, Tokyo, Japan). Transmission electron microscope (TEM) images were observed by a Talos F200X G2 instrument. X-ray Photoelectron Spectroscopy (Kratos Axis Ultra DLD, Kratos Analytical Ltd., Manchester, UK) recorded the chemical composition and oxidation state of the elements of samples. The actual Au loadings on the catalysts were examined using an inductive coupled plasma emission spectrometer (ICP-OES, Spectroblue, Spectro, Kleve, Germany). The UV–Vis diffuse reflection spectra (UV–Vis DRS) were recorded on a UV–Vis spectrophotometer (UV3600-Plus, Shimadzu, Kyoto, Japan). Photoluminescence spectra (PL) were recorded on a spectrophotometer (PTI, New York, NY, USA). Electrochemical measurements were performed on a Zahner Zennium electrochemical workstation (Kronach–Gundelsdorf, Germany). An XPA-7 photocatalytic device was from XuJiang Electromechanical Plant, Nanjing, China, which was used in the photoreduction process.

2.6. Photoelectrochemical Measurements

The photoelectrochemical measurements were performed on a workstation via a three-electrode system at room temperature. The platinum wire electrode and Ag/AgCl electrode were used as counter electrode and reference electrode, respectively, while Au/TiO2NTs nanocomposite modified GCE (4 mm diameter) was utilized as a working electrode. The electrolyte was composed of 0.1 M NaOH solution in a 50-mL electrolytic cell. A LED lamp (625 nm, 30.98 W/m2) was selected as the illumination source during the PEC testing process.

3. Results and Discussion

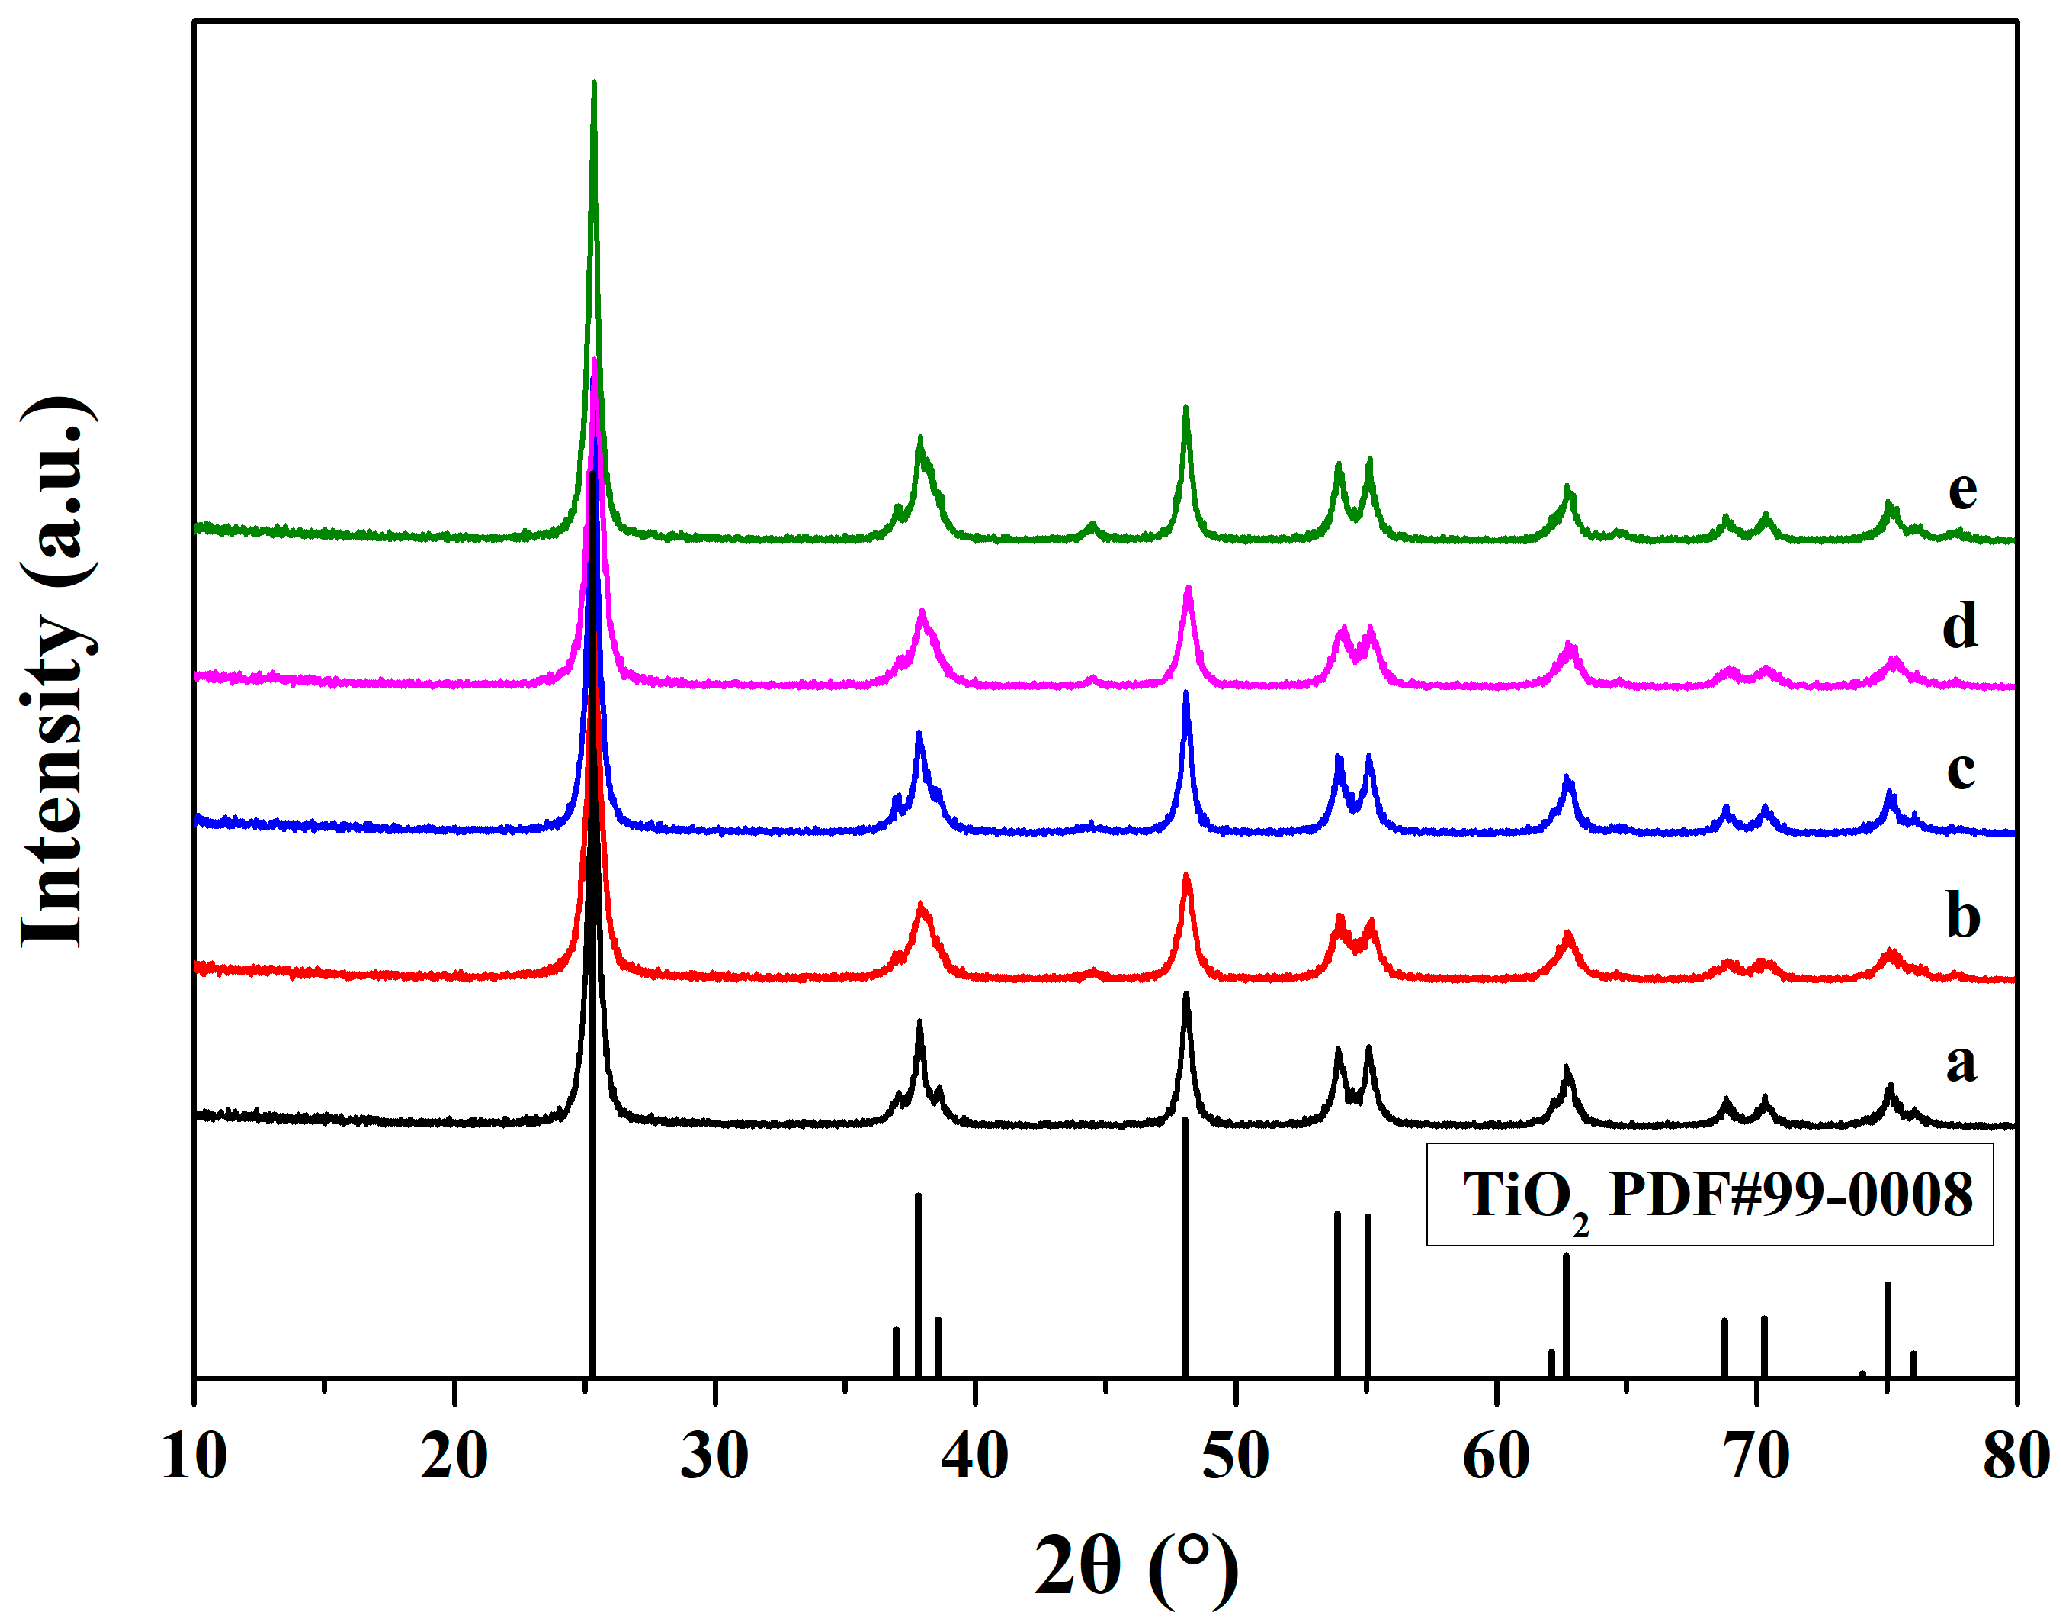
3.1. Structure Characterization by XRD

The XRD measurement was carried out to explore the materials’ phase. Figure 1 shows the XRD patterns of the pure TiO2NTs and the Au/TiO2NTs with different gold contents (0.25, 0.5, 0.75, and 1.0 wt.%). As shown in Figure 1, the as-prepared TiO2NTs were anatase phase, with principal diffraction peaks at 2θ = 25.3°, 36.9°, 37.8°, 38.6°, 48.0°, 53.9°, 55.1°, 62.1°, 62.7°, 68.8°, 70.3°, 74.0°, and 75.0°, which corresponded to the (101), (103), (004), (112), (200), (105), (211), (213), (204), (116), (220), (107), and (215) diffraction planes, respectively (JCPDS NO.99-0008). At the same time, only the diffraction peaks of pure TiO2 were observed, and no diffraction peak related to metal Au was observed, which could be attributed to the relatively low loading of Au and the high dispersion in TiO2NTs. In addition, the diffraction peaks of the photocatalyst were sharp and high, indicating that the samples had good crystallinity. There were no diffraction peaks of other phases in Figure 1, indicating that the synthesized photocatalysts had good purity.

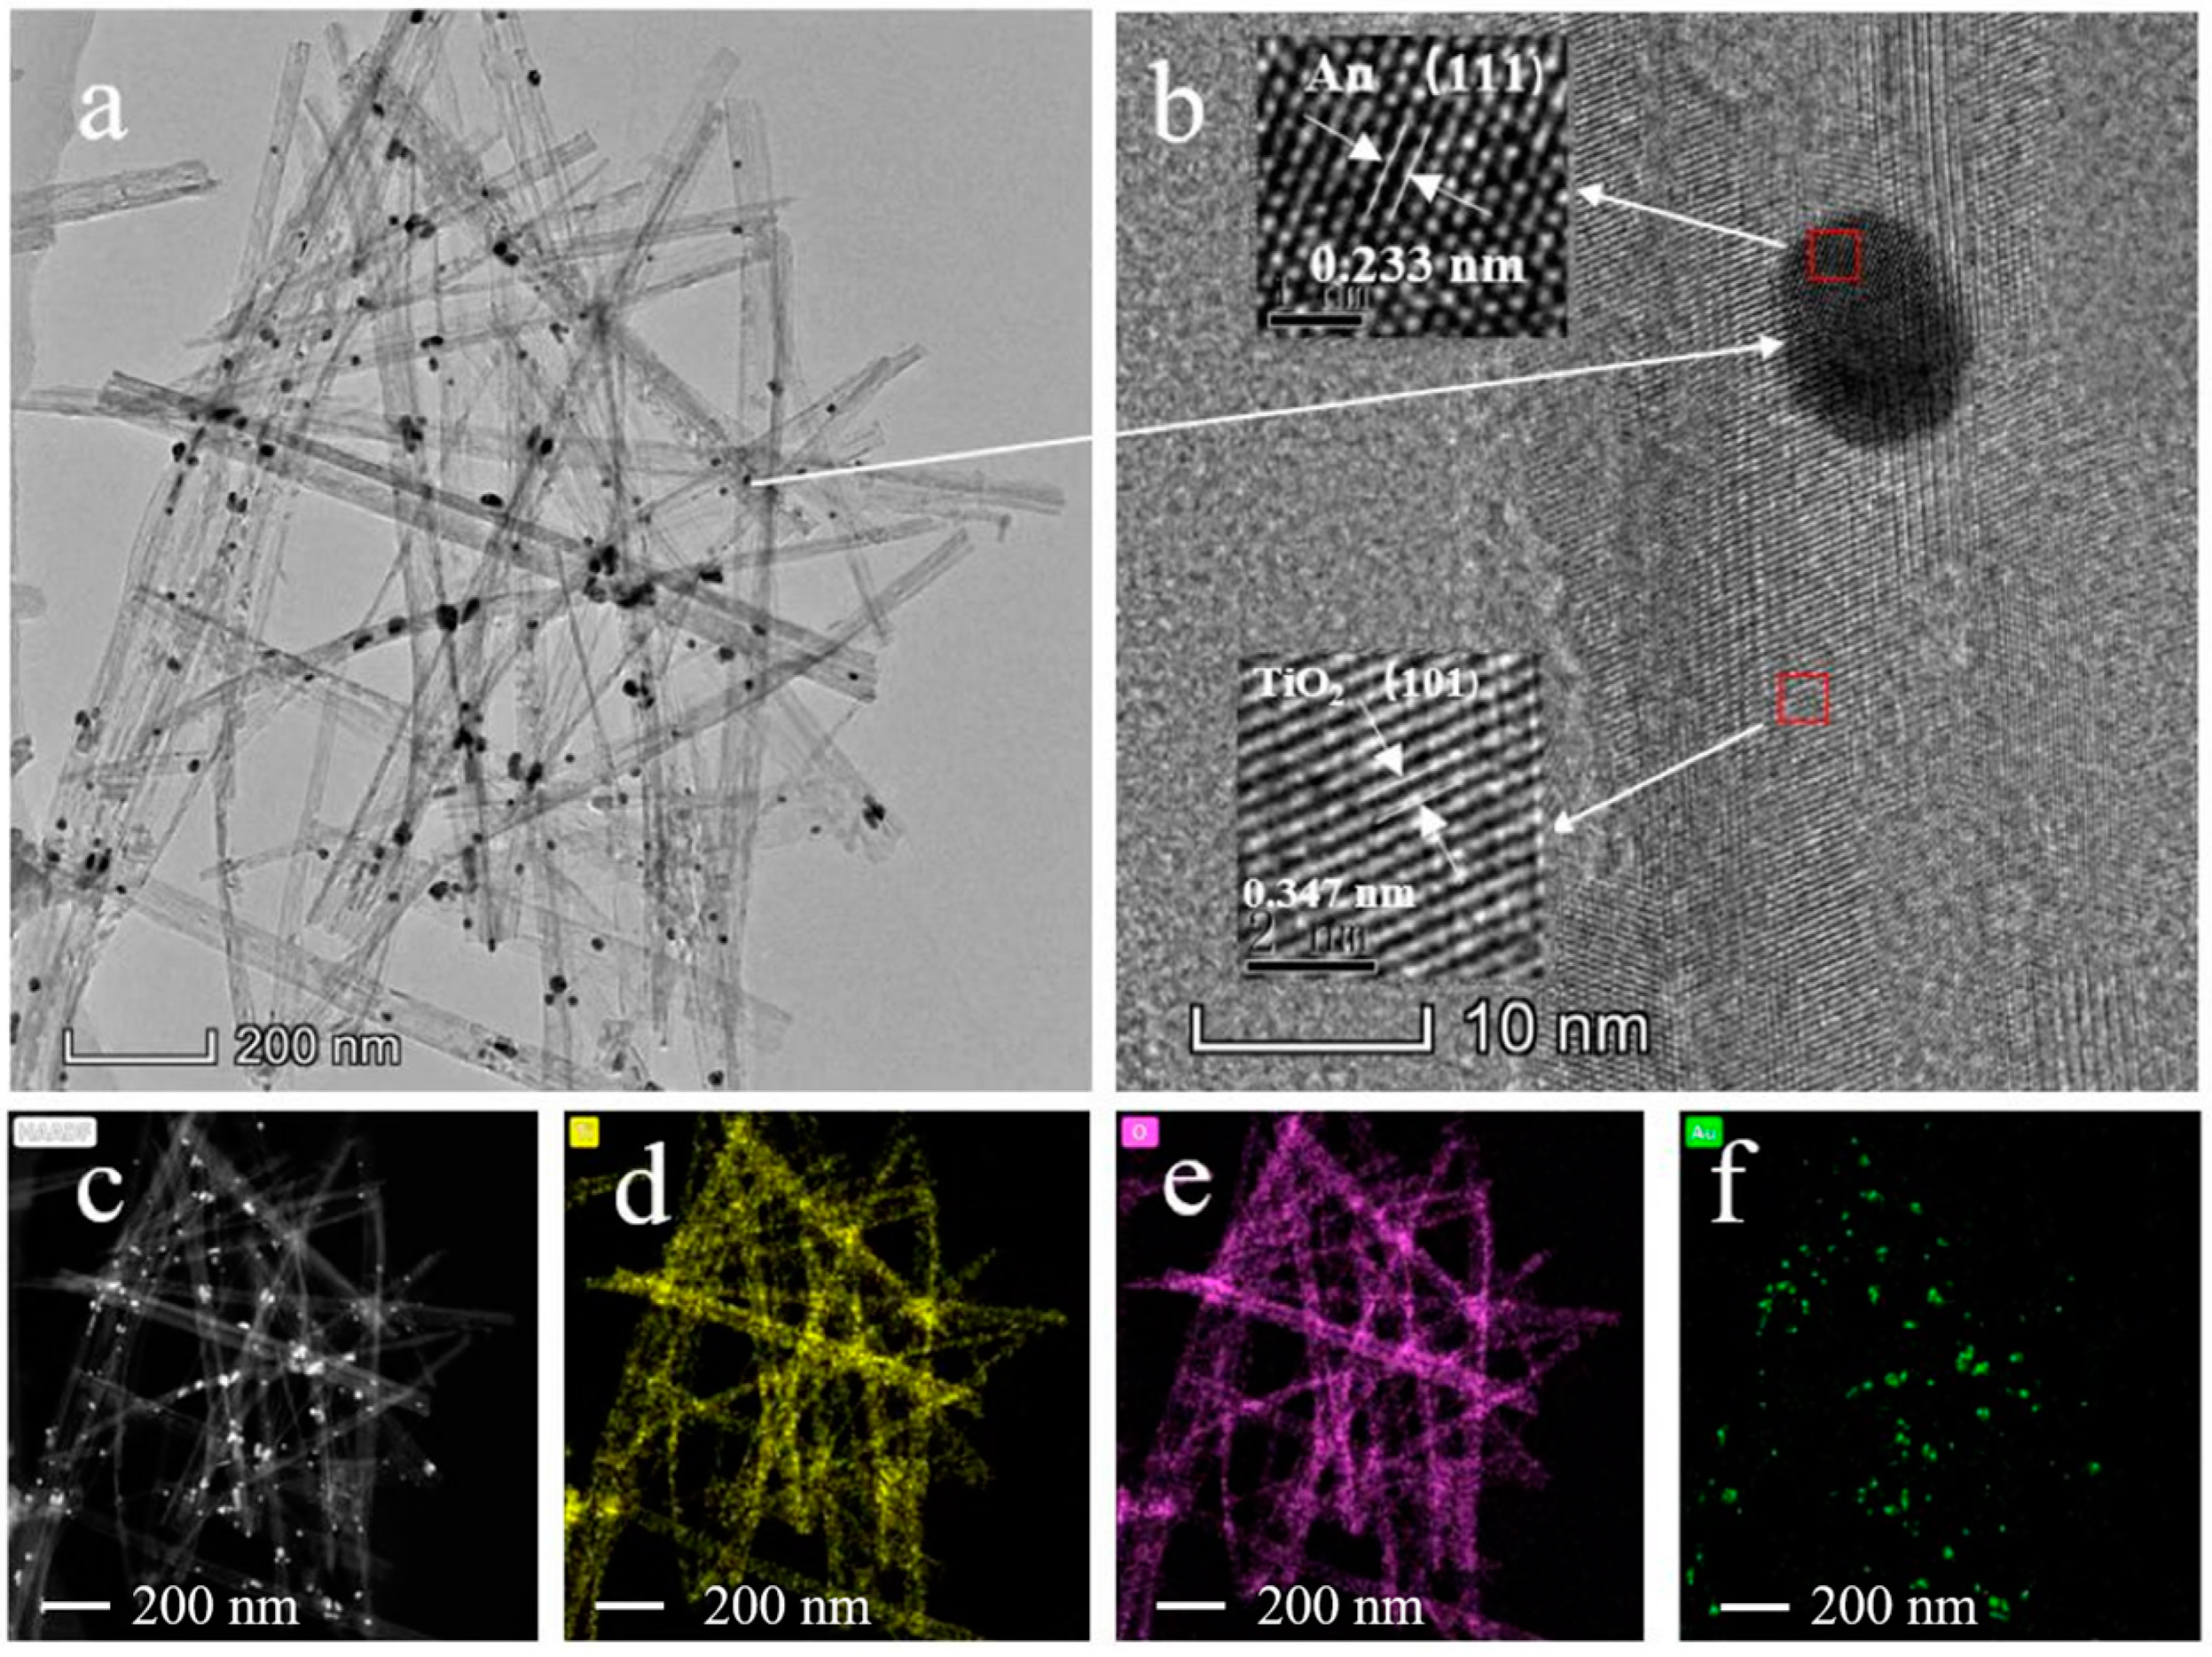
3.2. Morphology Characterization of Samples by TEM

The microstructure of the as-prepared Au/TiO2NTs was characterized by TEM. From the TEM images, nearly uniform nanotube-like structures could be clearly seen. The Au/TiO2NTs were hundreds of nanometers long, and the outer diameter was about 10 nanometers. As seen from Figure 2a, the black dots were confirmed to be AuNPs, with a size of about 8–9 nm. Figure 2b was the high-resolution HRTEM image of Au/TiO2NTs, in which the lattice fringes of 0.347 nm and 0.233 nm correspond well to anatase TiO2 (101) and Au (111) interfaces, respectively. It could be observed that the Au modification did not influence the nanotubes’ structure. Furthermore, EDS element mapping diagrams of Au/TiO2NTs were performed (Figure 2c–f). Except for the large gold particles, large amounts of gold particles with very small sizes can also be observed. They were highly dispersed on the nanotubes. As a result, Au/TiO2NTs with sufficient gold loading were obtained.

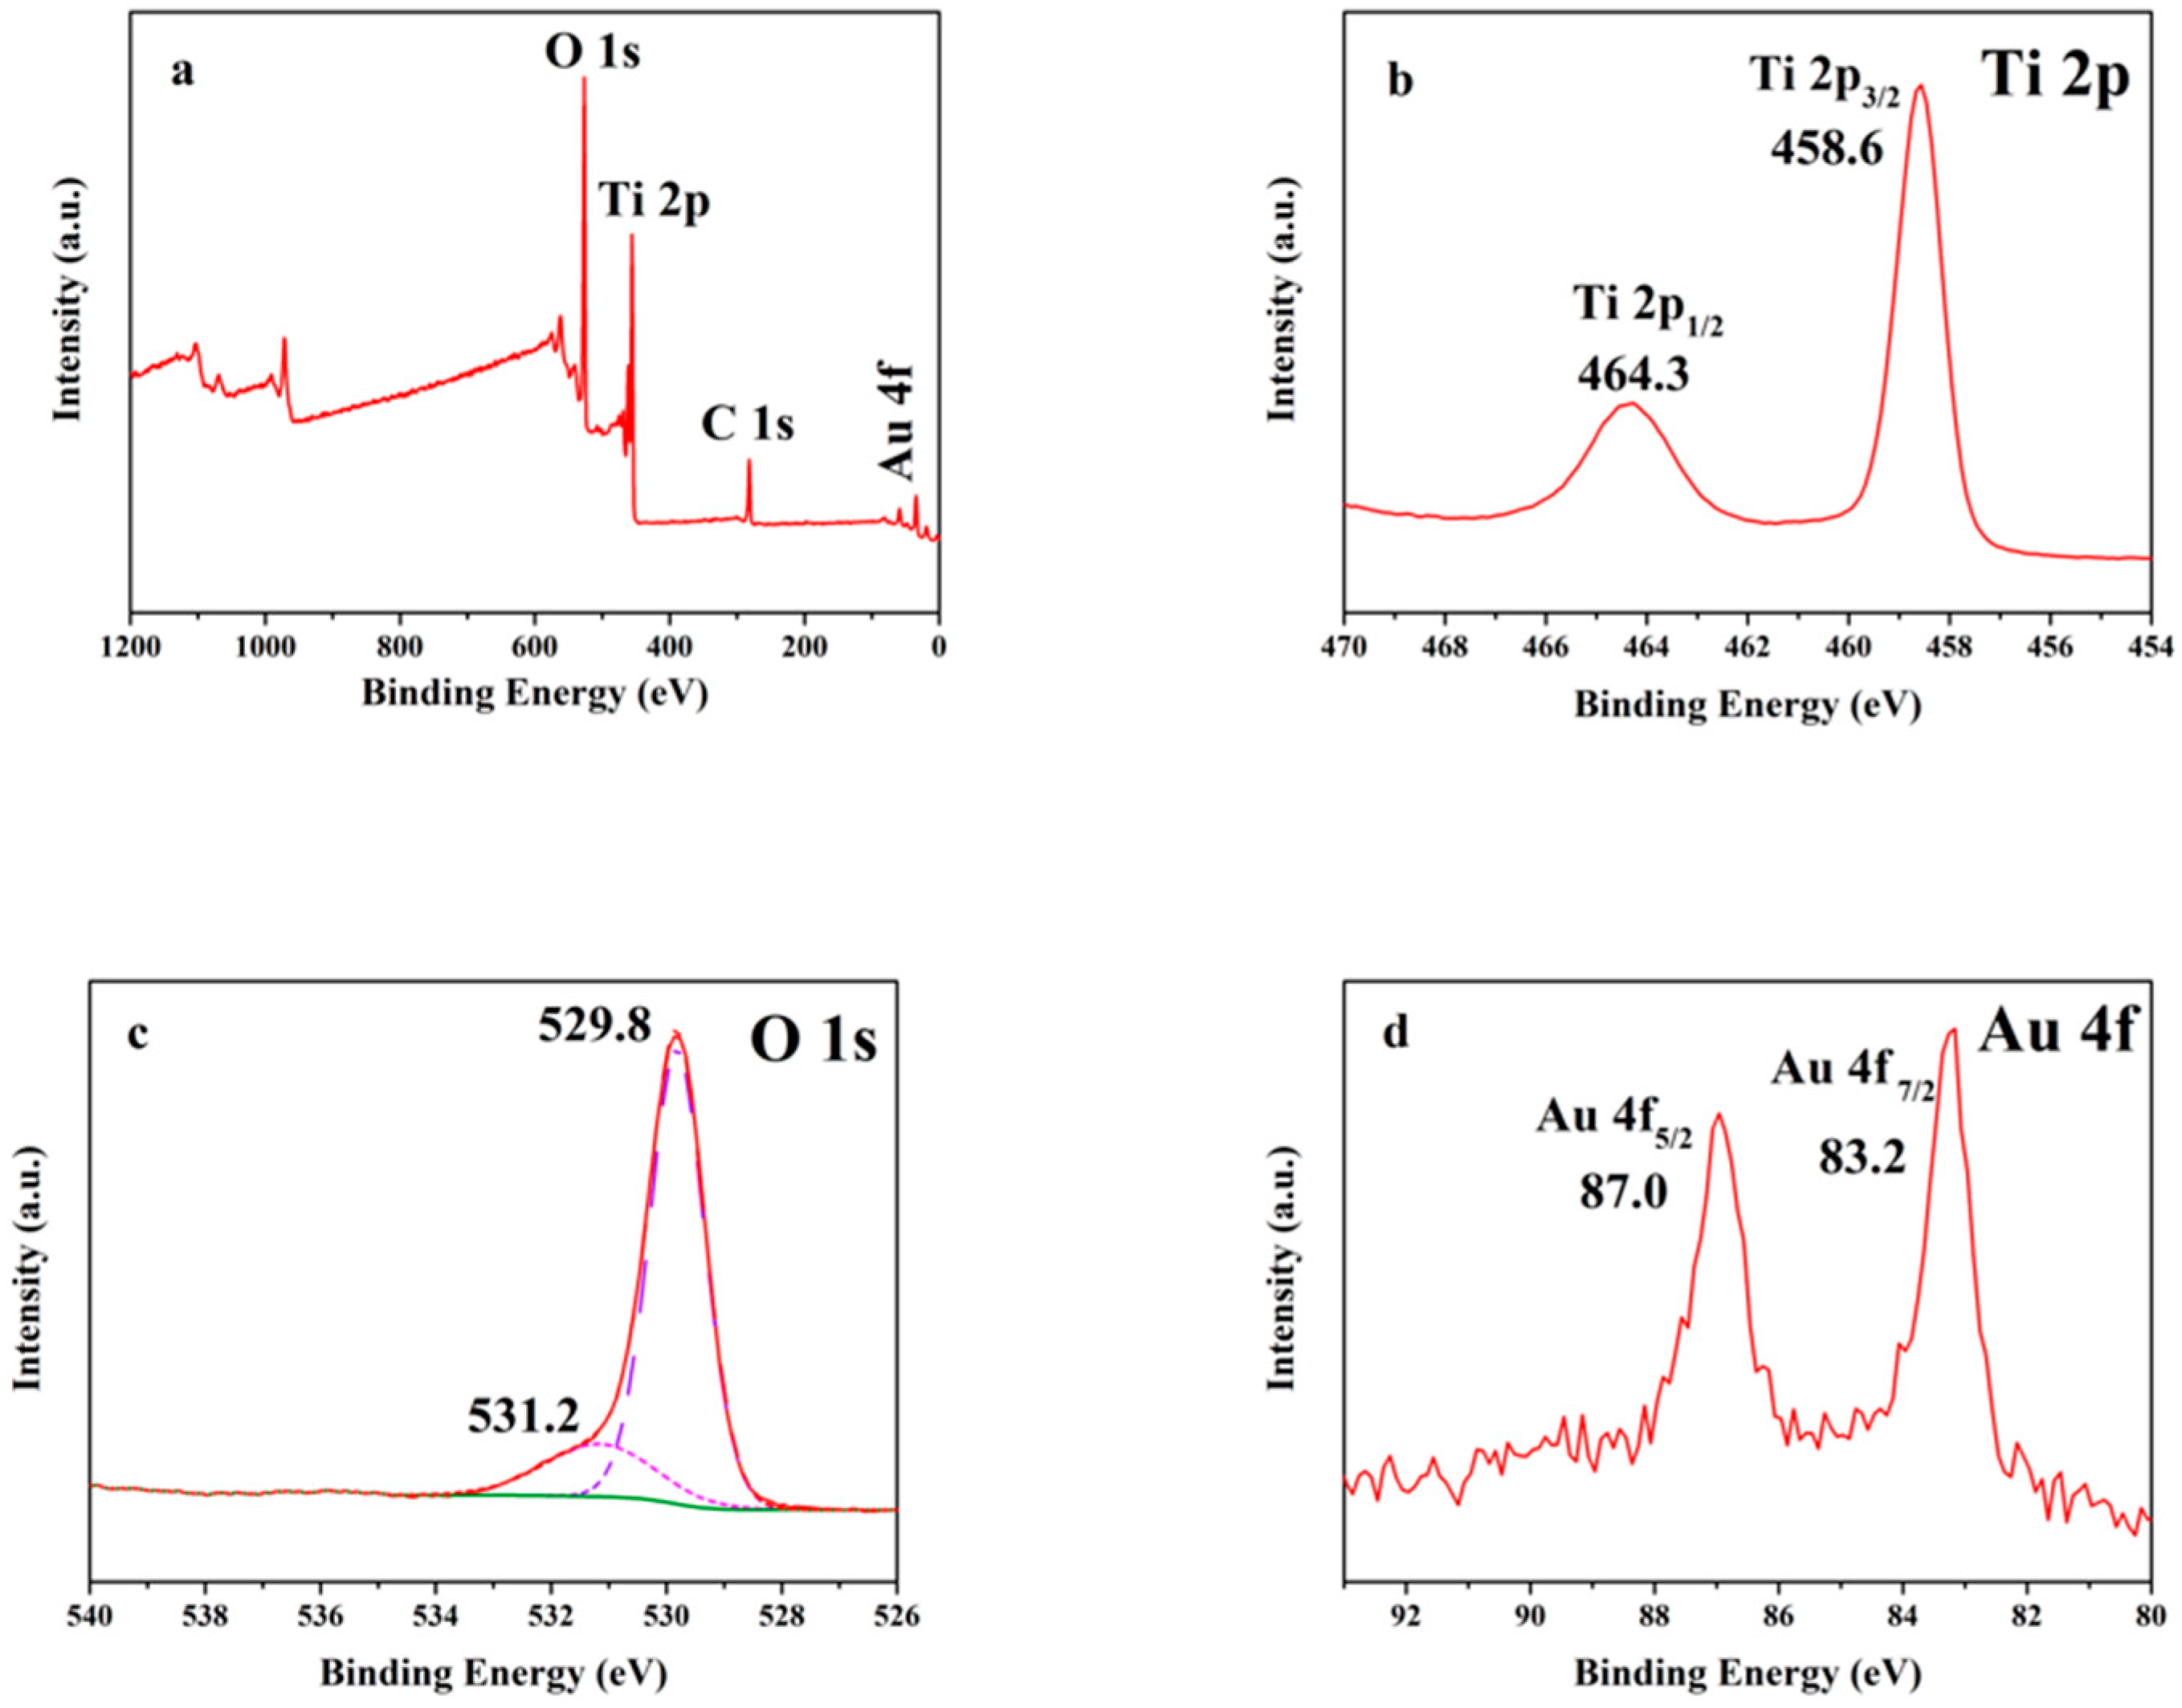
3.3. The Chemical State and Composition Analysis Using XPS

To further study the electronic interaction between TiO2 and Au, XPS was performed. The full XPS spectrum is shown in Figure 3a, in which the electronic states of Ti 2p, O 1s, C 1s, and Au 4f can be observed. The mass percentage of Au in the 0.5 wt.% Au/TiO2NTs was 0.369 wt.%, which is consistent with the result obtained by ICP. The C signal might come from the XPS measurement itself. Figure 3b shows the Ti XPS spectrum. The binding energy of Ti 2p1/2 and Ti 2p3/2 were located at 464.3 eV and 458.6 eV, respectively, indicating that Ti exists in the +4 valence state [46,47]. It corresponded to the existence of stoichiometric TiO2. The O 1s XPS spectrum showed two peaks at a binding energy at 531.2 eV and 529.8 eV (Figure 3c), respectively, and belonging to Ti-OH and lattice oxygen [Ti-O6] species, respectively [48,49]. Figure 3d shows the Au 4f XPS spectrum of Au/TiO2NTs. It can be clearly observed that the samples showed a main Au 4f7/2 peak at 83.2 eV, with an analogous Au 4f5/2 peak at 87.0 eV, which indicated that gold in the Au/TiO2NTs was presented in the metallic state [50]. In addition, the peak of Au 4f was negatively shifted compared with the characteristic peak of standard Au (83.7 eV), indicating that Au was electron-rich, which may have been caused by e transfer from the carrier to gold. This showed that there was a strong interaction between TiO2 and gold. Peaks of oxidized gold species were not observed, which should be around 86.3 and 85.5 eV. It seemed that the trivalent gold in chloroauric acid had been reduced to elemental gold after the photoreduction process.

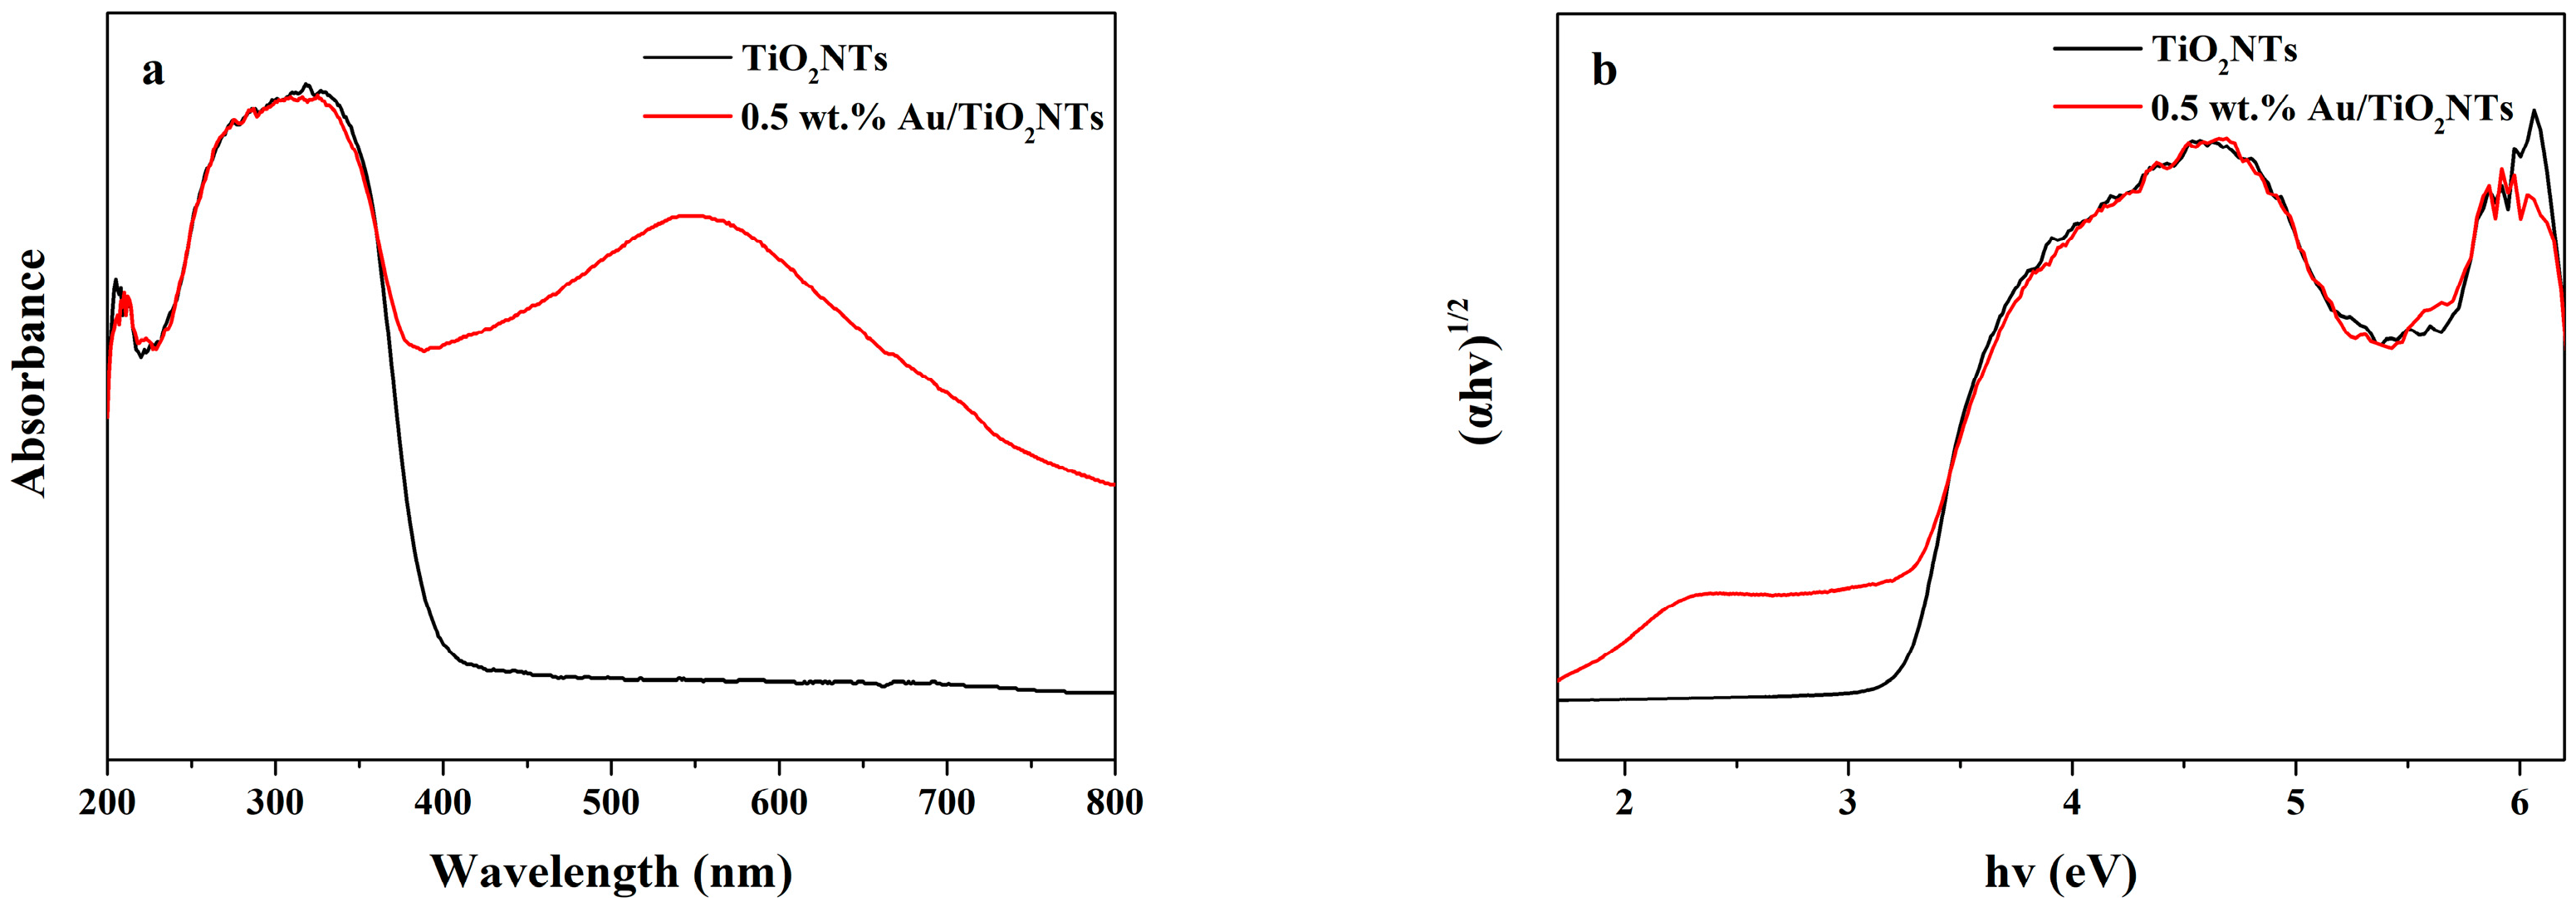
3.4. Optical Absorption Properties Analysis by UV–Vis DRS

To further analyze the optical absorption ability of the material, the UV-Vis DRS test was selected to characterize the samples. It could be clearly seen from the UV-Vis DRS spectrum that both TiO2NTs and Au/TiO2NTs had a strong absorption peak at 230–380 nm. It was confirmed that the loading of noble metals did not change the inherent absorption of TiO2. Combined with Figure 4a,b, it could be seen that the absorption edge of TiO2 nanotubes had a redshift after being loaded with gold. The corresponding bandgap widths of TiO2NTs and Au/TiO2NTs were 3.2 and 3.0 eV, respectively. As the absorption edge expanded, the bandgap decreased; that is, the spectrum range that TiO2NTs could respond to after loading the noble metal became significantly wider. This could improve the deficiency of TiO2 catalyst and help the photocatalyst to capture more wavelengths of light; thus, generating more photogenerated electrons to participate in a photoelectric chemical reaction. Moreover, obvious absorption peaks in the visible light range of 500–600 nm could be observed in Au/TiO2NTs catalysts, which were attributed to the SPR effect of the loaded AuNPs [51]. As a result, the loaded AuNPs could significantly improve the absorption of TiO2NTs under visible light and improve the PEC performance of TiO2NTs.

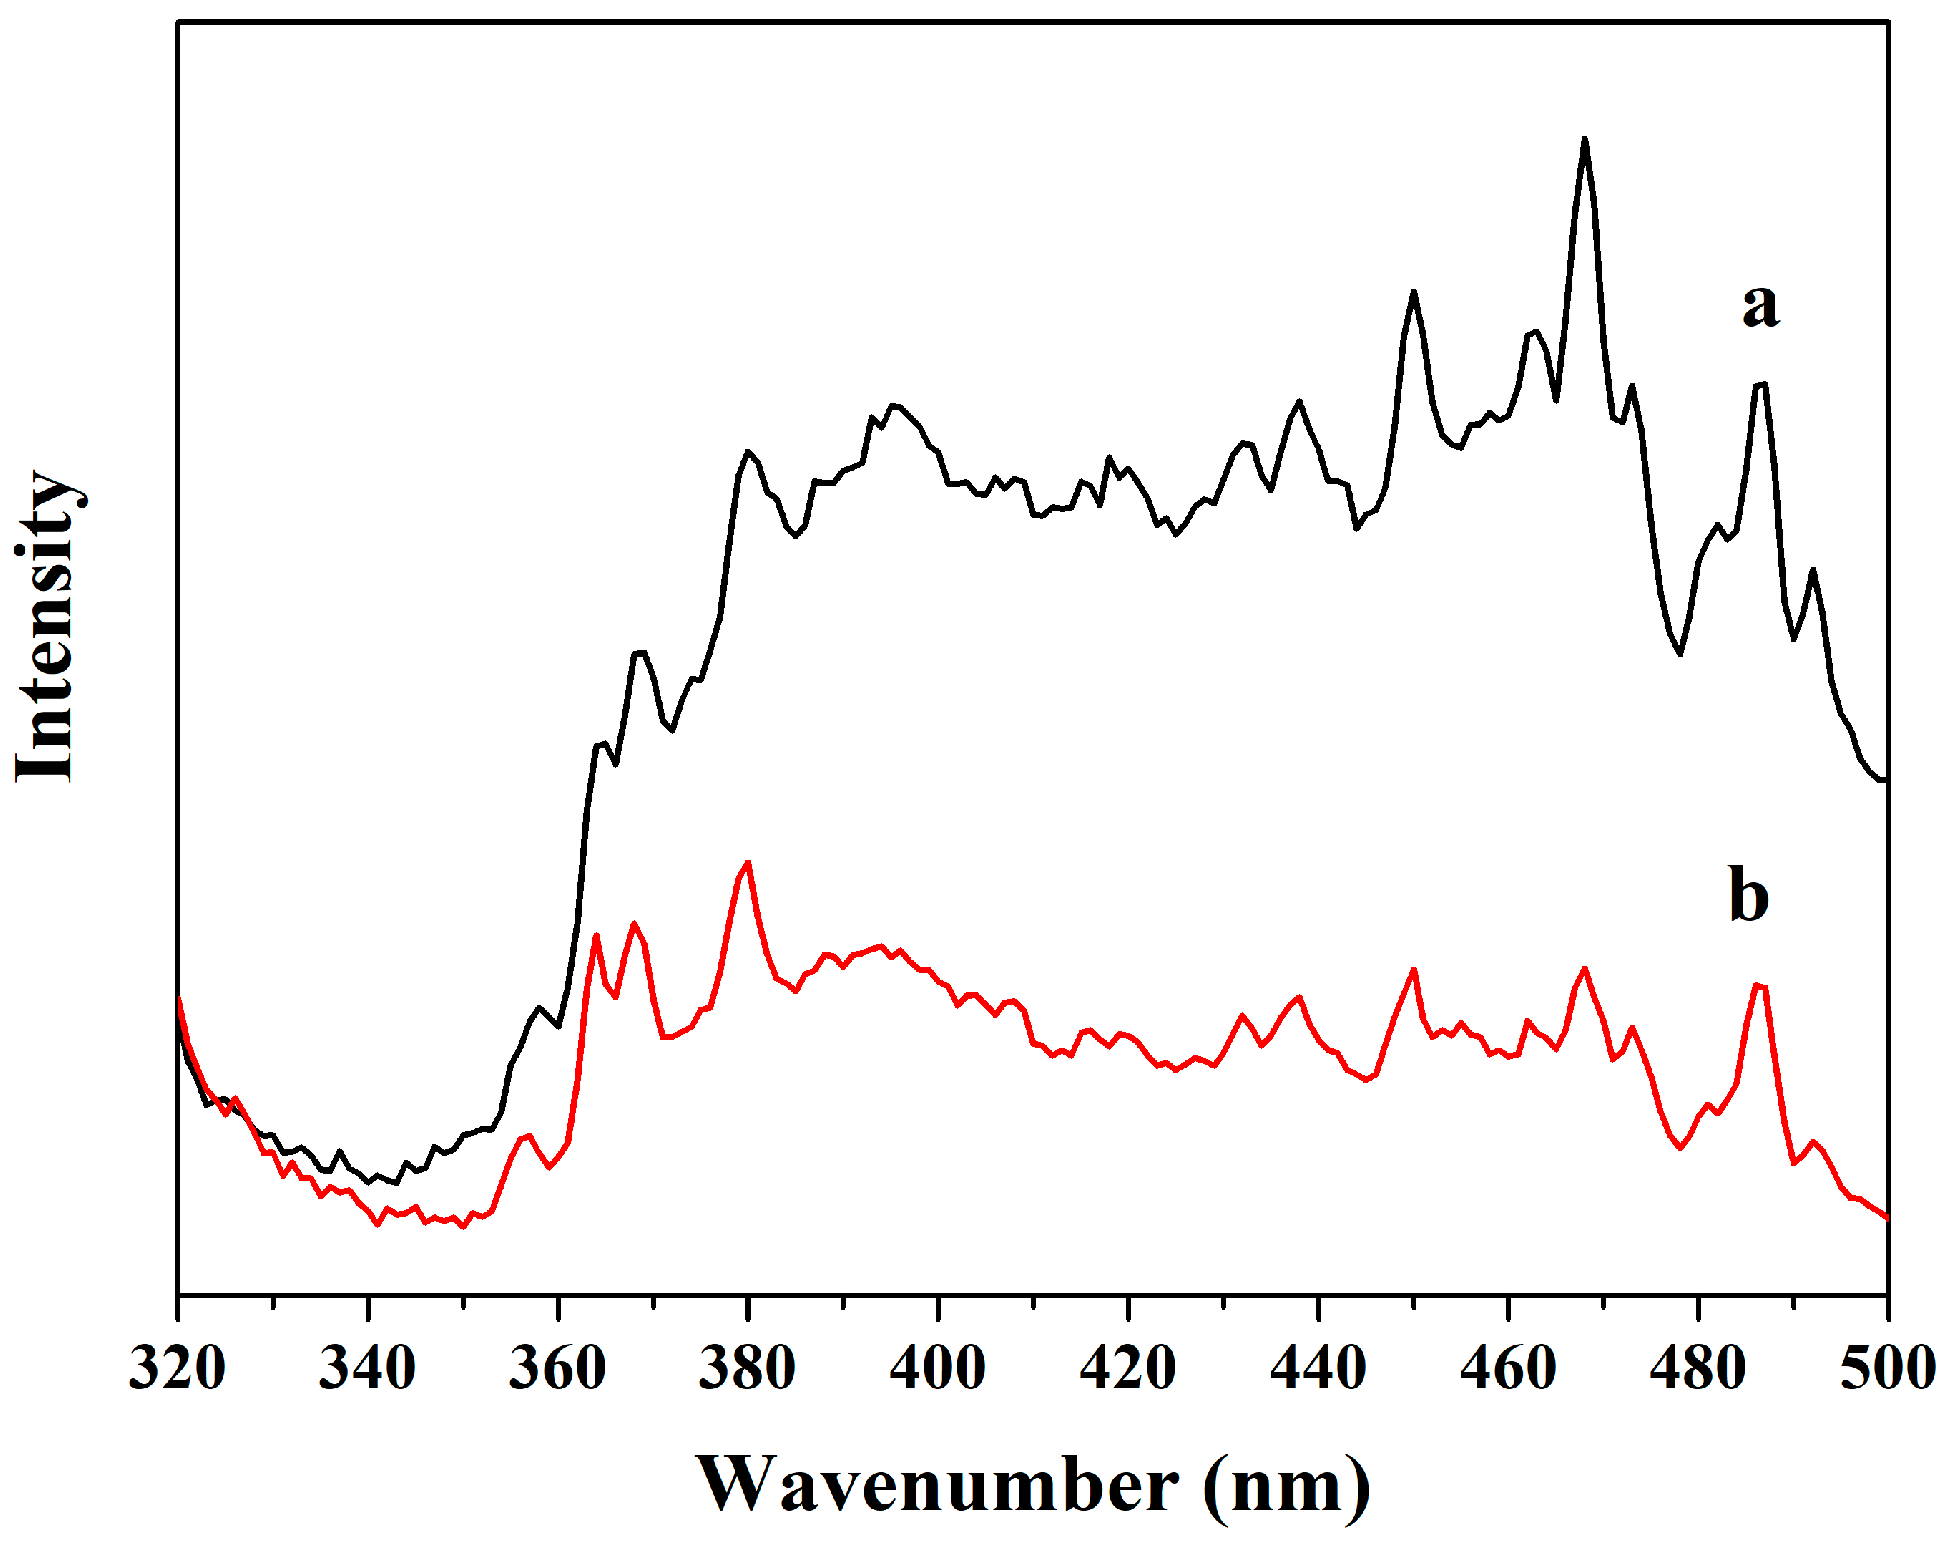
3.5. The Optical Properties Analysis by Photoluminescence (PL) Spectroscopy

The recombination ability of e and h+ was characterized by photoluminescence intensity. As displayed in Figure 5, the photoluminescence spectra of the samples were evaluated at the excitation wavelength of 300 nm. The PL intensity of Au/TiO2NTs was lower than that of pure TiO2NTs, which indicated that the loading of gold was beneficial for inhibiting the recombination of e and h+ and improving the photoelectric performance. As indicated in the XPS spectra, the formation of the Schottky junction enabled the gold to become electron-rich. Thus, the e and h+ pairs could be effectively separated, and the charge recombination could be avoided. Therefore, the 0.5 wt.% Au/TiO2NTs have a higher photogenerated carrier separation rate and mobility than TiO2NTs, which was beneficial for generating more photogenerated e and h+, and exhibiting better PEC performance than the pure TiO2NTs.

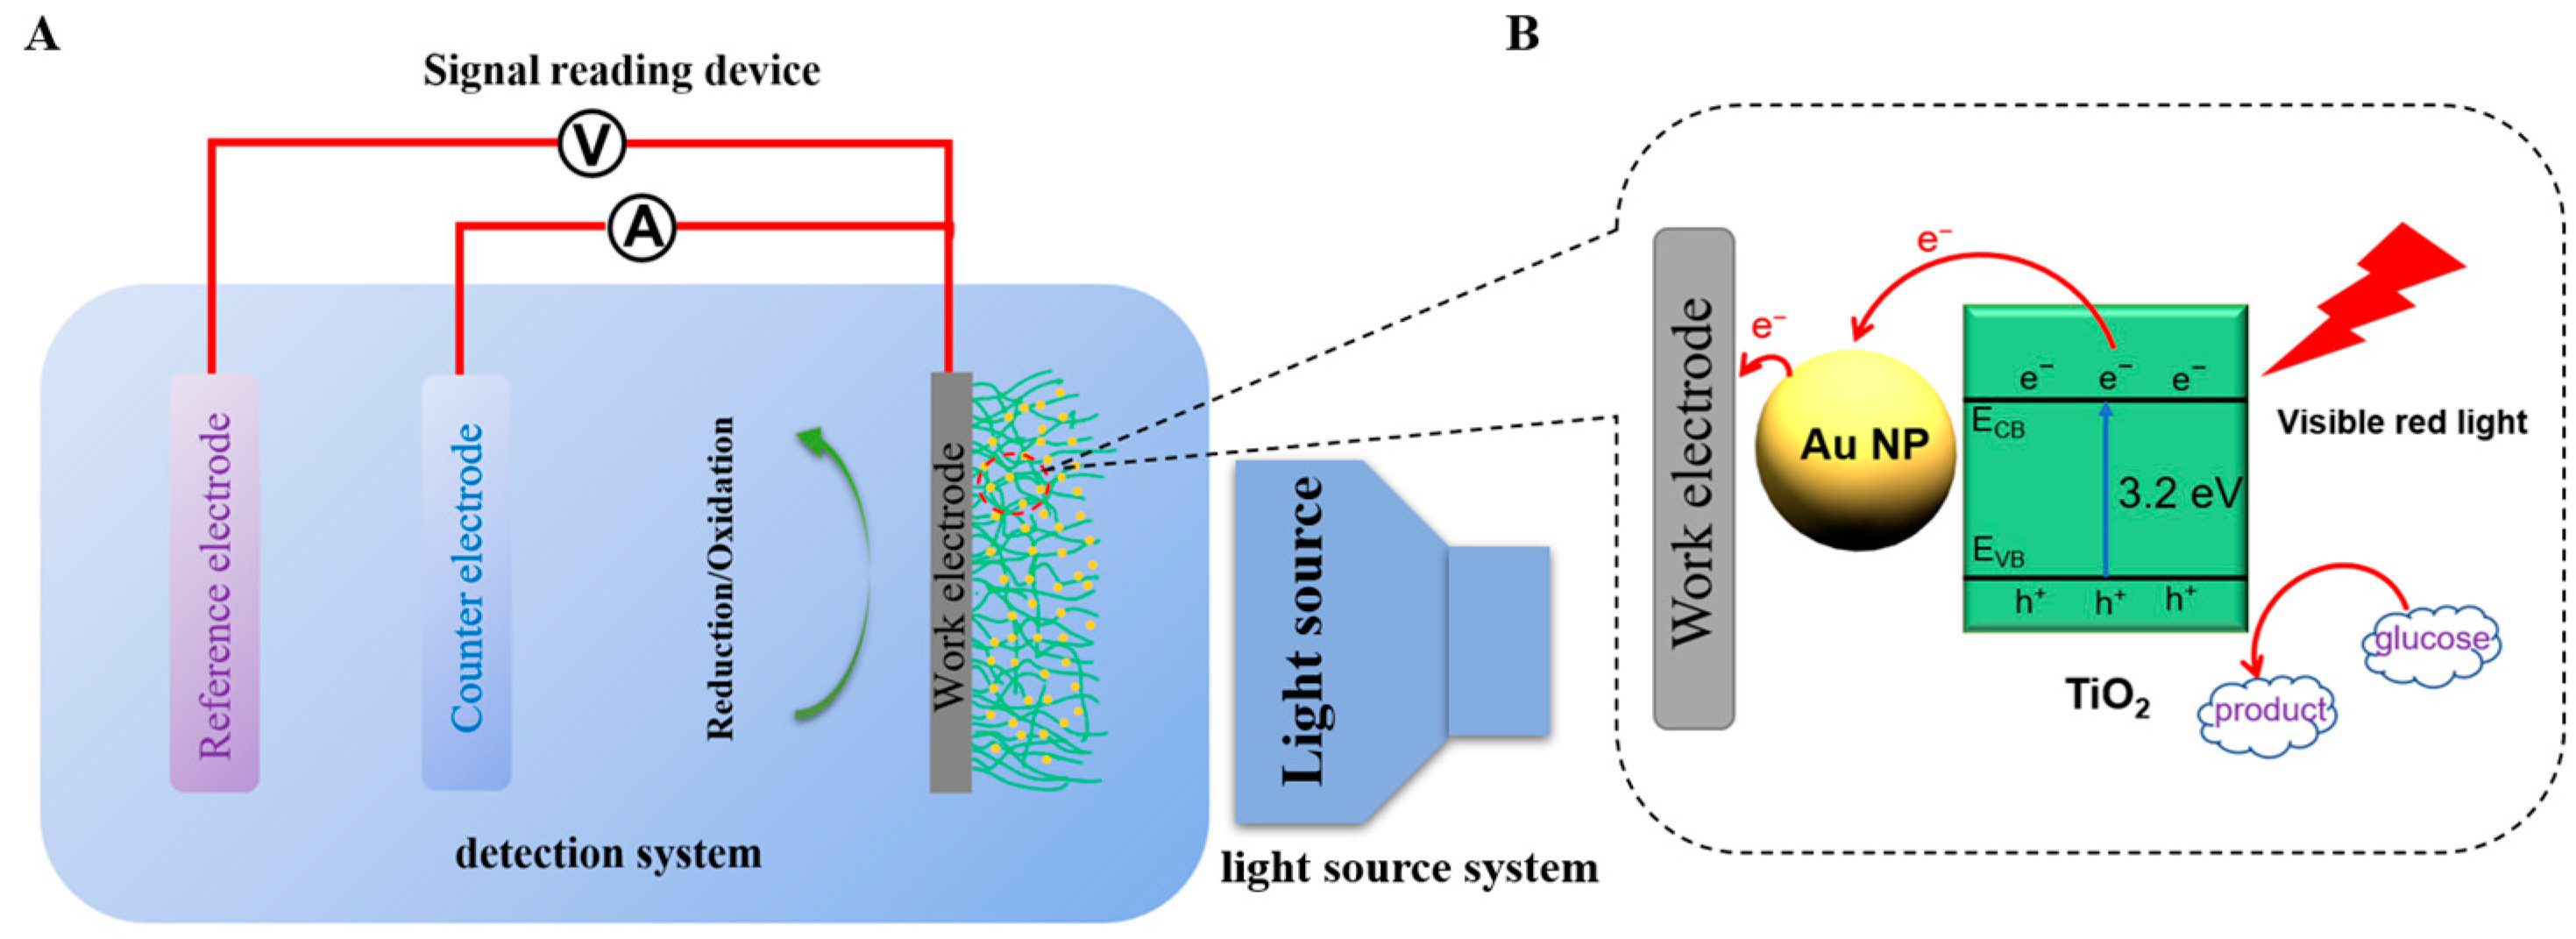
3.6. Photoelectrochemical Measurements

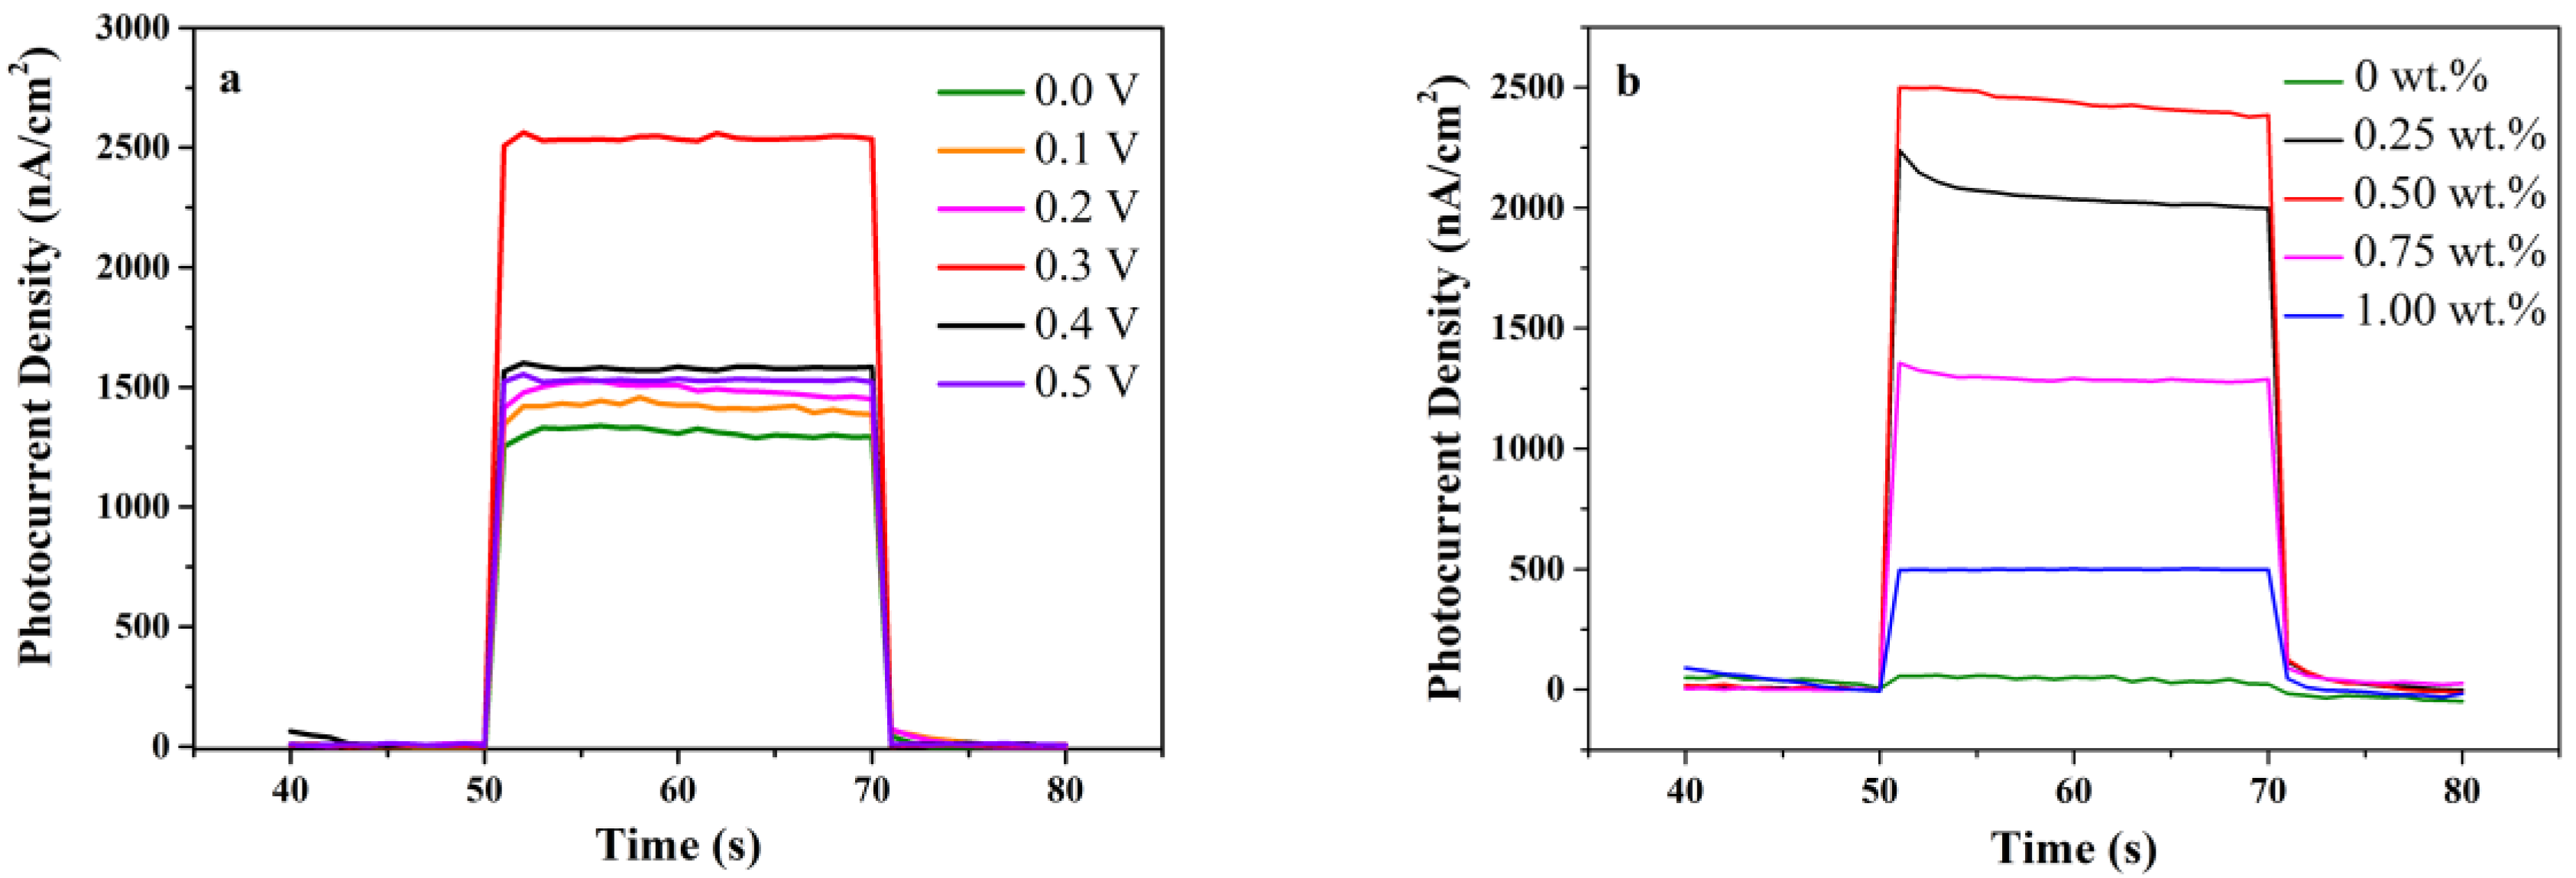
3.6.1. The Influence of Potential and Au Load on the Performance of Biosensing

A photocurrent–time curve can characterize the separation efficiency of the photogenerated carriers. Experimental parameters may affect PEC performance. Thus, the experimental parameters, such as bias voltages and gold contents, must be optimized. The application of bias voltages on the photoelectrode can facilitate the separation of e and h+ and reduce their recombination rate, which can be directly reflected in the enhancement of photocurrent. The influence of voltages on the photocurrent of Au/TiO2NTs electrode under the irradiation of 0.1 M NaOH solution at 625 nm was investigated. In the range of 0–0.5 V, the maximum photocurrent response was at 0.3 V (Figure 6a). Therefore, 0.3 V was determined as the optimum bias voltage. In addition, it is necessary to optimize the effect of gold content on photocurrent response. Under the irradiation of 625 nm, the influence of gold loading content was studied in 0.1 M NaOH solution. It can be seen from Figure 6b that no significant photocurrent was observed on the bare TiO2NTs, while an obvious photocurrent could be observed on the gold-modified ones. Due to its wide bandgap, TiO2 only could absorb short-wavelength ultraviolet light. As the gold contents increased, the photocurrent intensity first increased, reaching a maximum value of 0.5 wt.% Au/TiO2 NTs, and then gradually decreased.
In the Au/TiO2NTs, as a result of the high work function of gold, the electrons migrate from TiO2 to gold. When the Fermi levels of the gold and TiO2 are equal, a Schottky barrier will form. Consequently, the electrons and holes generated after illumination can be localized on gold and TiO2, respectively, be separated, and undergo oxidation-reduction reactions at different positions. When glucose exists in the system, the holes on the electrode surface will react with the glucose in the solution, and glucose is easily oxidized. When the gold content is too low, there are not enough electron receiving centers for effective e and h+ separation. However, when the gold content is too high, the gold coating on the surface of TiO2 has a shielding effect and affects the acceptance of electrons by TiO2. Moreover, the further deposition of gold results in the growth of AuNPs, which leads to the aggregation of gold atoms, the reduction of active sites, and the formation of recombination centers for e and h+ on gold particles. In addition, with too much gold loading, the color of the sample is too dark and this leads to light avoidance, resulting in a decrease in the photocurrent. Therefore, Au/TiO2NTs with 0.5 wt.% gold content exhibited the best PEC performance in this system.

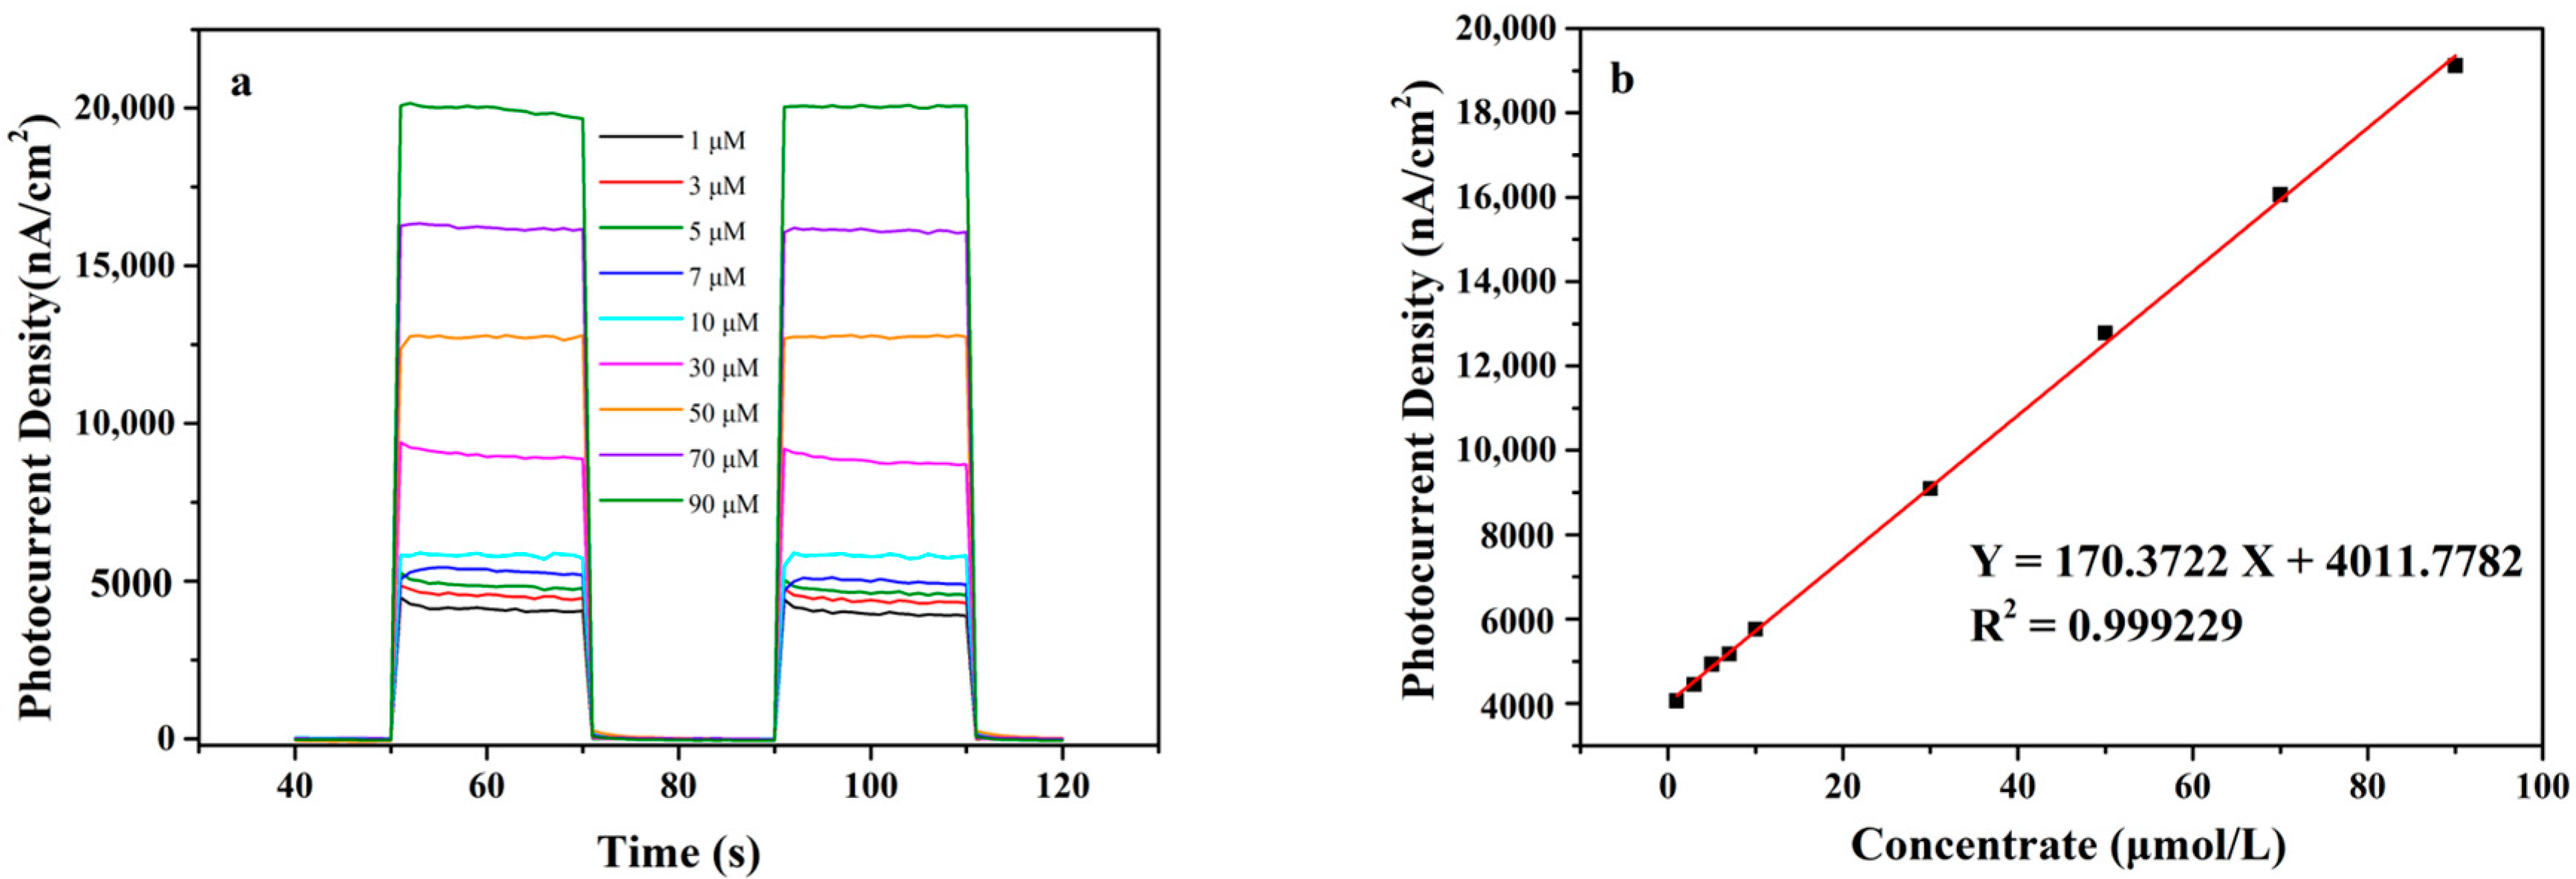
3.6.2. PEC Biosensing Application for Glucose

Figure 7a shows the photocurrent curve on the Au/TiO2NTs electrode in different concentrations of glucose (1–90 μM). It can be observed that the intensity of photocurrent increased with the increase of the concentrations of glucose. In essence, they exhibited a linear regression equation: j (nA/cm2) = 4011.7782 + 170.3722 Cglucose (μM) with a correlation coefficient of 0.9993, where j is photocurrent density, and C is the concentration of the glucose (Figure 7b). The corresponding sensitivity of the Au/TiO2NTs biosensor was 170.37 μA·mM−1·cm−2. The detection limit (LOD) of the biosensor was 1.3 μM, which was obtained from LOD = 3sb/S, (sb represents standard deviation of blank signal, and S represents sensitivity).
Table 1 summarizes the comparison of different glucose biosensors. Compared with the reported PEC sensors, the Au/TiO2NTs in this work exhibited a long excitation wavelength, high sensitivity, and low LOD. Most excitation light sources in PEC sensor research were ultraviolet or visible light with short wavelengths, which could cause cell damage or degeneration. In our work, visible red light with a wavelength of 625 nm was selected as the excitation wavelength. This low-energy long-wavelength light is more conducive to noninvasive blood glucose monitoring than short-wavelength light.
At present, blood analysis is the most commonly used method to monitor blood glucose, which has the characteristics of invasiveness, infection, bleeding, complex operation, and low efficiency. Compared to the traditional blood glucose technique, the high sensitivity and low LOD of the Au/TiO2NTs PEC sensors are beneficial to the realization of in vitro detection and provide the possibility of non-invasive glucose detection for humans, such as using interstitial fluid and sweat.

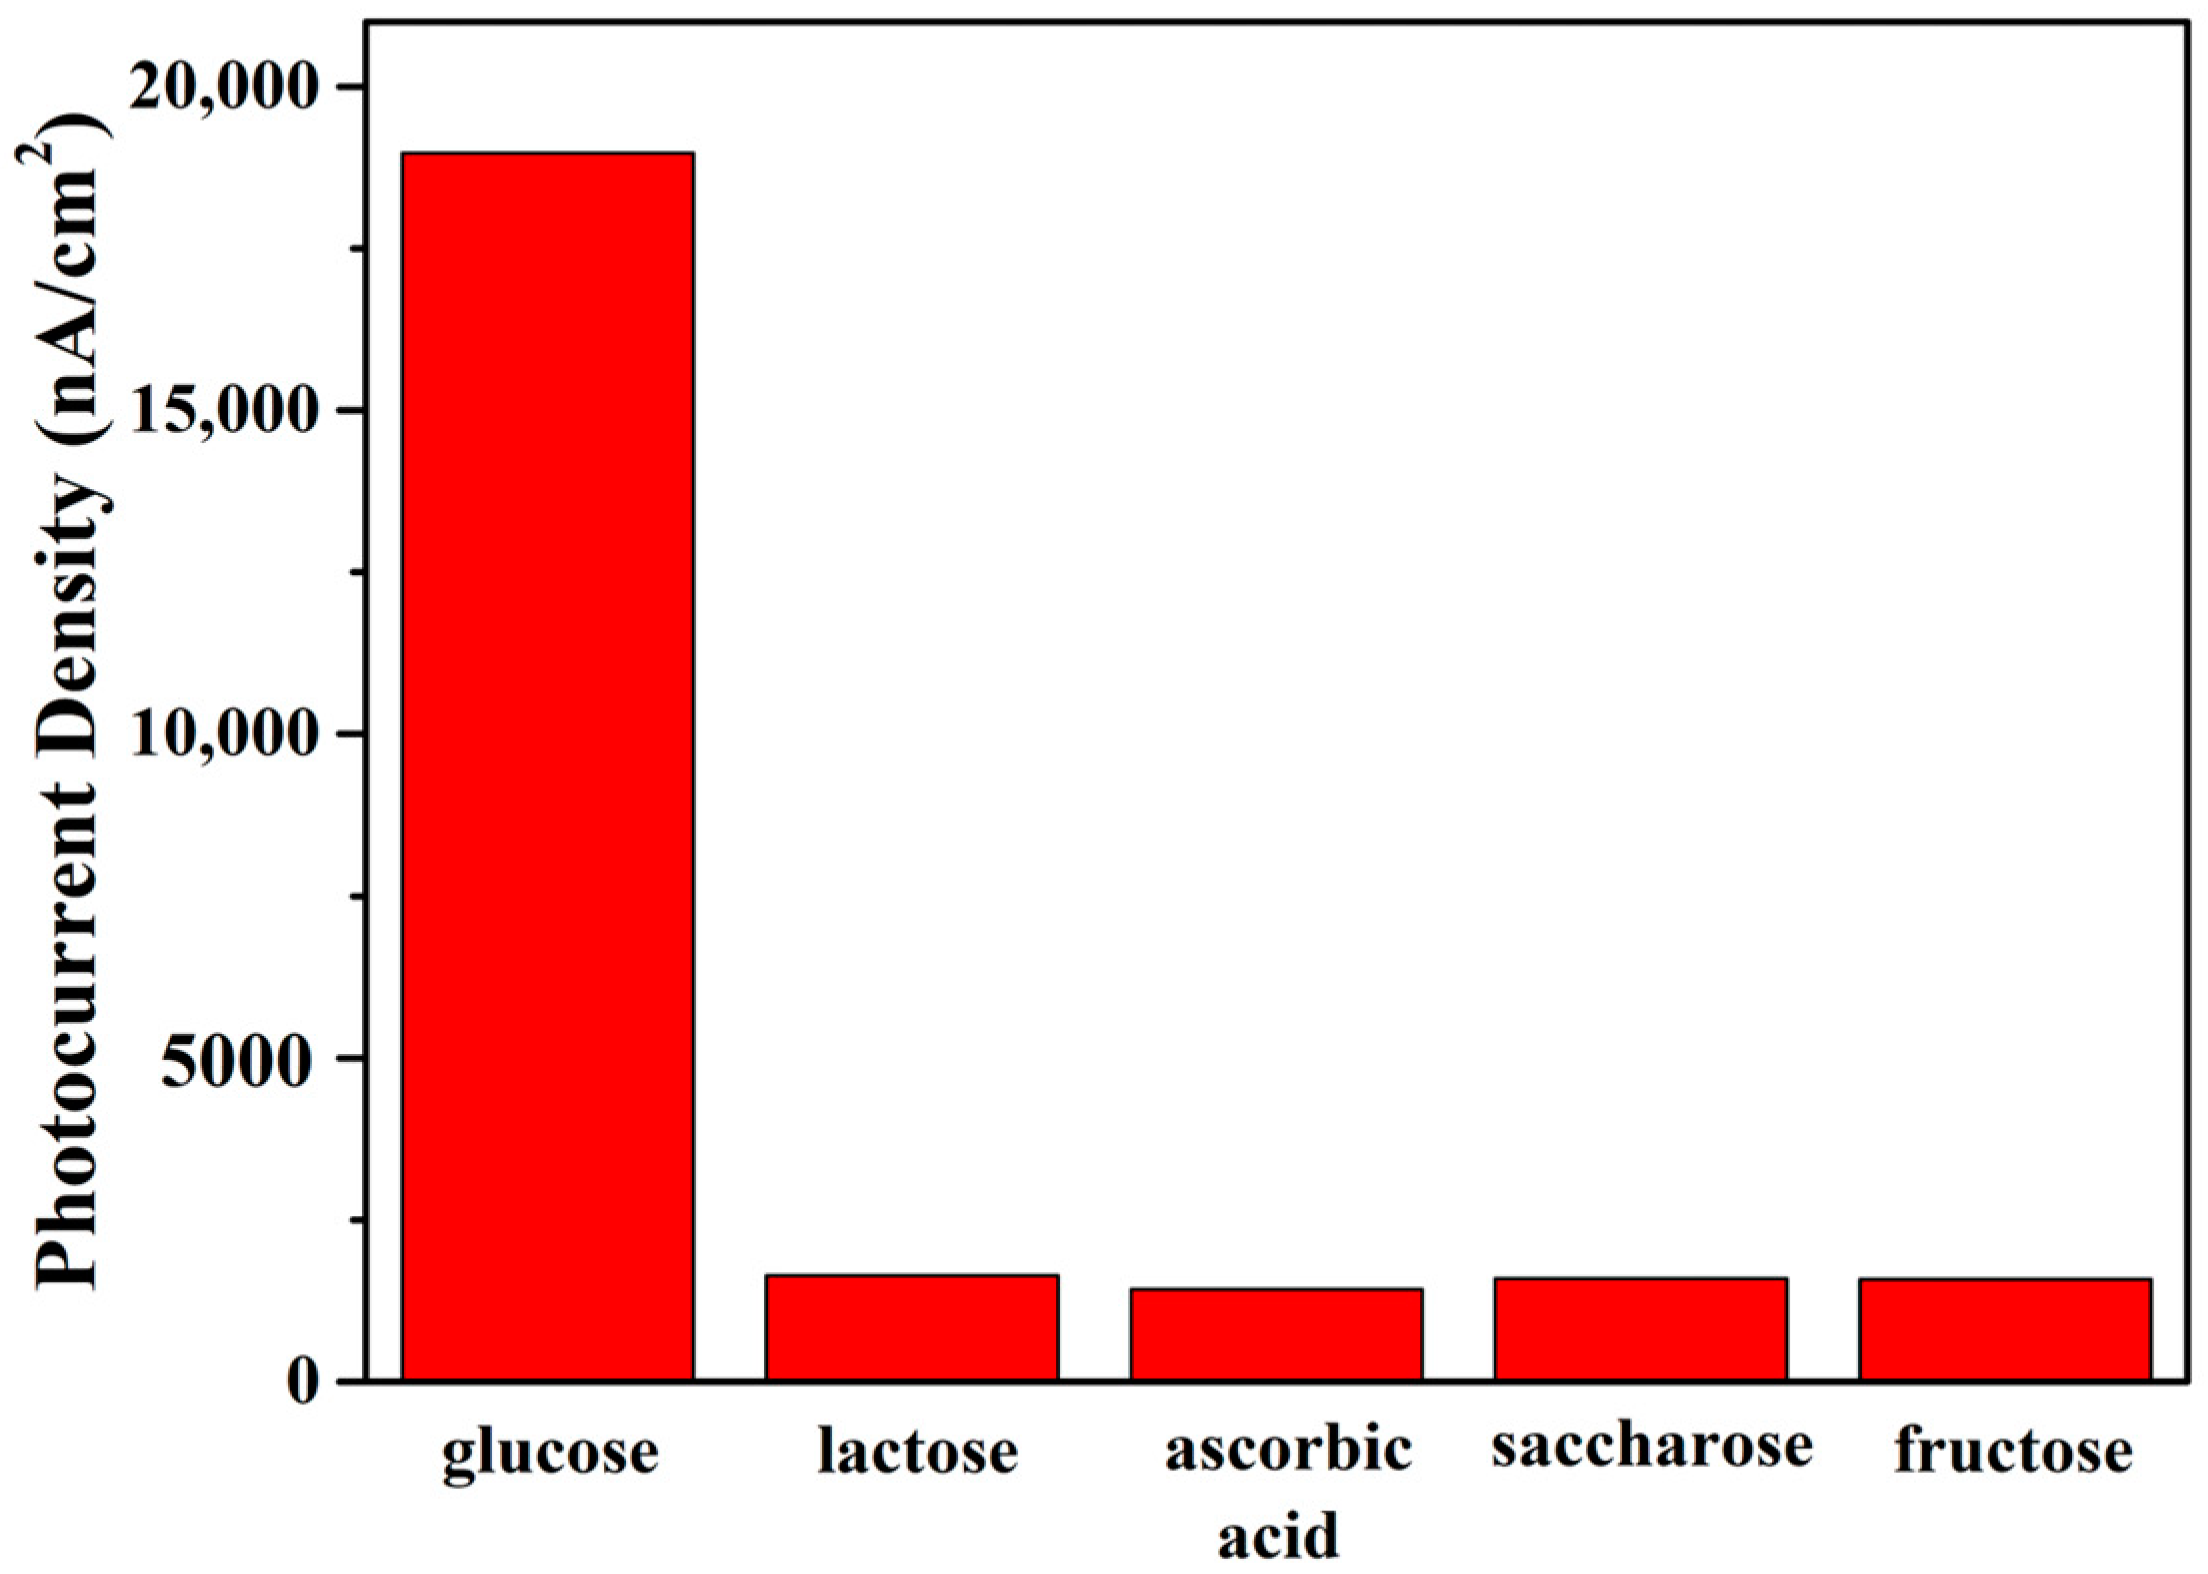
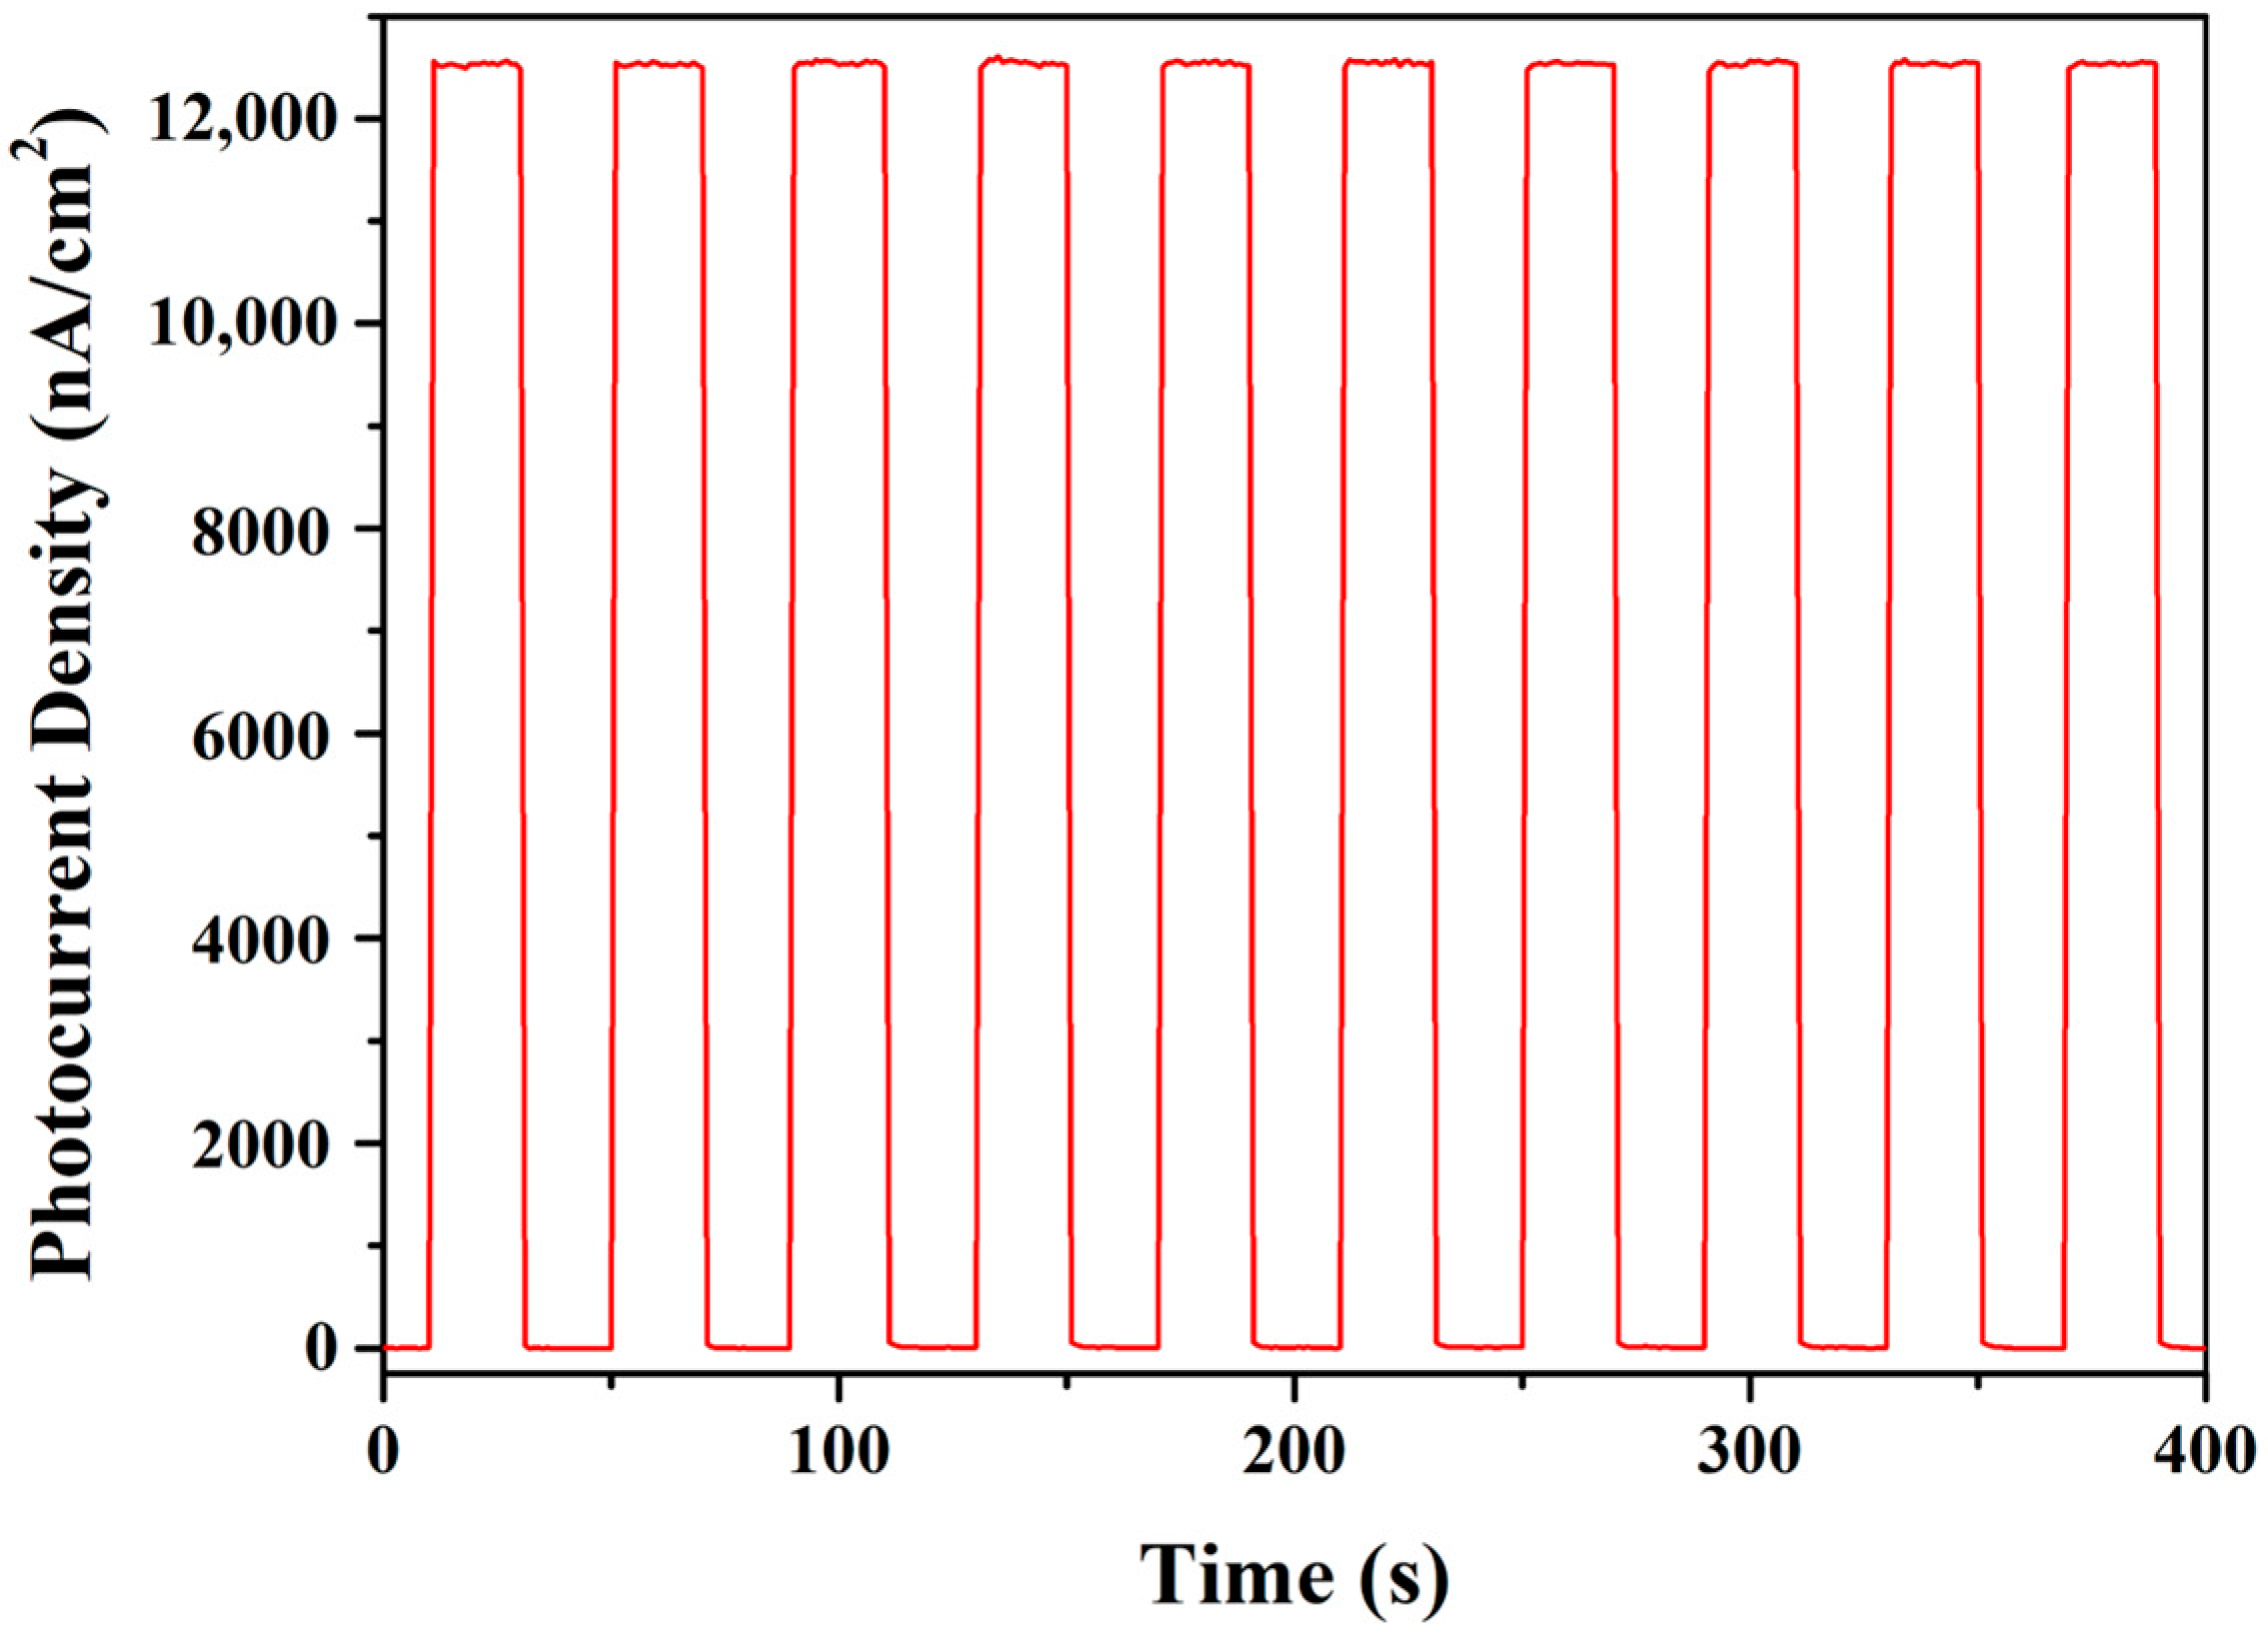
3.6.3. PEC Biosensing Selectivity and Stability Analysis

Selectivity is an important parameter of biosensors. Figure 8 shows the photocurrent comparison of a 0.5 wt.% Au/TiO2NTs electrode in glucose, sucrose, lactose, ascorbic acid, saccharose, and fructose solutions (the concentration of the solution was 90 μM). It was obvious that the photocurrent generated on the Au/TiO2NTs electrode in the glucose solution was much greater than in other solutions, indicating that the Au/TiO2NT PEC sensor had a good selectivity.
Furthermore, the photocurrent response stability of the Au/TiO2NT electrode was investigated by switching the i–t response 10 times. As can be seen from Figure 9, the photocurrent increased rapidly at the moment of turning on the light and became stable within a few seconds. With switching 10 times, the photocurrent remained stable, and the photocurrent intensity had no obvious change in each cycle. The results showed that the Au/TiO2NTs had a good photocurrent response stability.
Long-term stability is another important parameter of sensor performance. The 0.5 wt.% Au/TiO2NT electrode was stored in a room temperature atmosphere, and the photocurrent–time curve was continuously tested every day in a 50 μM glucose solution. Figure 10 shows the data for 25 days. It can be observed that the photocurrent intensity of the Au/TiO2NTs electrode maintained 96% of its original photocurrent intensity, indicating that the Au/TiO2NTs glucose sensor had a good long-term stability.
To clarify the PEC process of Au/TiO2NTs, we elucidate the mechanism of action of the glucose sensor in Scheme 1. The modification of AuNPs plays a key role in the PEC-generated e and h+ in TiO2. The SPR effect of AuNPs enhances the light absorption of TiO2 under visible light. In addition, the large gold work function causes the Au/TiO2NTs interface to form a Schottky barrier. Therefore, the photoinduced electrons are easily transferred to the gold particles, thereby decreasing the recombination of e- and h+ and accelerating the separation efficiency of photoinduced carriers. Assisted by a bias voltage between the counter electrode and the working electrode, electrons are transferred along AuNPs to the glassy carbon electrode and eventually to the counter electrode via an external circuit. The holes on the Au/TiO2NTs electrode directly oxidize the glucose molecules. During this process, the glucose concentration changes, resulting in a change in the photocurrent. Consequently, the linear relation between photocurrent and glucose concentration is presented.

4. Conclusions

To sum up, a high-sensitivity and SPR-enhanced PEC sensor based on TiO2NTs was fabricated, in which Au NPs were decorated on TiO2NTs using the photoreduction method. Via gold modification, the absorption of TiO2 under visible red light was promoted, attributable to the SPR effect, and the separation of e and h+ was promoted through the formation of the Schottky junction. The resultantly enhanced electrochemical performance produced the high sensitivity of the Au/TiO2NTs for glucose under visible red light. In addition, the low detection limit, high selectivity, and long-term stability for glucose provide the possibility of the noninvasive detection of glucose. In addition to glucose, we predict that this PEC sensor has potential applications for other substances, such as glutathione and dopamine.

Author Contributions

Conceptualization and methodology, W.L. and W.D.; software, W.L.; validation, W.L., L.J. and G.Z.; formal analysis, W.L., W.D. and L.J.; investigation, W.L. and W.D.; resources, W.L.; data curation, W.L., S.W. and Y.G.; writing—original draft preparation, W.L.; writing—review and editing, W.L. and W.D.; visualization, W.L.; L.J. and Y.G.; supervision, B.Z., W.H. and S.Z.; project administration, B.Z., W.H. and S.Z.; funding acquisition, B.Z., W.H. and S.Z. All authors have read and agreed to the published version of the manuscript.

Funding

This research was funded by the Natural Science Foundation of Tianjin, China, grant number 21JCYBJC00330.

Data Availability Statement

The data is available on reasonable request from the corresponding author.

Conflicts of Interest

The authors declare no conflict of interest.

References

  1. Li, W.B.; Jiang, D.S.; Yan, P.C.; Dong, J.T.; Qian, J.C.; Chen, J.P.; Xu, L. Graphitic carbon nitride/α-Fe2O3 heterostructures for sensitive photoelectrochemical non-enzymatic glucose sensor. Inorg. Chem. Commun. 2019, 106, 211–216. [Google Scholar] [CrossRef]
  2. Çakıroğlu, B.; Özacar, M. A photoelectrochemical biosensor fabricated using hierarchically structured gold nanoparticle and MoS2 on tannic acid templated mesoporous TiO2. Electroanalysis 2020, 32, 166–177. [Google Scholar] [CrossRef]
  3. He, L.H.; Liu, Q.B.; Zhang, S.J.; Zhang, X.T.; Gong, C.L.; Shu, H.H.; Wang, G.J.; Liu, H.; Wen, S.; Zhang, B.Q. High sensitivity of TiO2 nanorod array electrode for photoelectrochemical glucose sensor and its photo fuel cell application. Electrochem. Commun. 2018, 94, 18–22. [Google Scholar] [CrossRef]
  4. Zhang, Y.; Wang, Q.; Liu, D.; Wang, Q.; Li, T.; Wang, Z. Cu2O-BiOI isotype (pp) heterojunction: Boosted visible-light-driven photoelectrochemical activity for non-enzymatic H2O2 sensing. Appl. Surf. Sci. 2020, 521, 146434. [Google Scholar] [CrossRef]
  5. Zhang, K.; Lv, S.; Zhou, Q.; Tang, D. CoOOH nanosheets coated g-C3N4/CuInS2 nanohybrids for photoelectrochemical biosensor of carcinoembryonic antigen coupling hybridization chain reaction with etching reaction. Sens. Actuators B 2020, 307, 127631. [Google Scholar] [CrossRef]
  6. Sivula, K.; Van De Krol, R. Semiconducting materials for photoelectrochemical energy conversion. Nat. Rev. Mater. 2016, 1, 15010. [Google Scholar] [CrossRef]
  7. Yan, P.C.; Jiang, D.S.; Tian, Y.H.; Xu, L.; Qian, J.C.; Li, H.N.; Xia, J.X.; Li, H.M. A sensitive signal-on photoelectrochemical sensor for tetracycline determination using visible-light-driven flower-like CN/BiOBr composites. Biosens. Bioelectron. 2018, 111, 74–81. [Google Scholar] [CrossRef]
  8. Zhang, S.P.; Xu, G.F.; Gong, L.S.; Dai, H.; Li, Y.L.; Hong, Z.S.; Lin, Y.Y. TiO2-B nanorod based competitive-like non-enzymatic photoelectrochemical sensing platform for noninvasive glucose detection. J. Mater. Chem. B 2015, 3, 7554–7559. [Google Scholar] [CrossRef]
  9. Shu, J.; Tang, D.P. Current advances in quantum-dots-based photoelectrochemical immunoassays. Chem.—Asian J. 2017, 12, 2780–2789. [Google Scholar] [CrossRef]
  10. Liras, M.; Barawi, M.; Víctor, A. Hybrid materials based on conjugated polymers and inorganic semiconductors as photocatalysts: From environmental to energy applications. Chem. Soc. Rev. 2019, 48, 5454–5487. [Google Scholar] [CrossRef]
  11. Zhang, J.J.; Zhou, Y.Z.; Zheng, G.P.; Huang, Q.Y.; Zheng, X.C.; Liu, P.; Zhang, J.M.; Guan, X.X. Novel assembly and electrochemical properties of anatase TiO2-graphene aerogel 3D hybrids as lithium-ion battery anodes. Chem. Phys. Lett. 2016, 662, 214–220. [Google Scholar] [CrossRef]
  12. Zang, Y.; Fan, J.; Ju, Y.; Xue, H.G.; Pang, H. Current advances in semiconductor nanomaterial-based photoelectrochemical biosensing. Chem.-A Eur. J. 2018, 24, 14010–14027. [Google Scholar] [CrossRef] [PubMed]
  13. Li, J.; Li, M.; Gui, P.; Zheng, L.N.; Liang, J.S.; Xue, G. Hydrothermal synthesis of sandwich interspersed LaCO3OH/Co3O4/graphene oxide composite and the enhanced catalytic performance for methane combustion. Catal. Today 2019, 327, 134–142. [Google Scholar] [CrossRef]
  14. Sawicka-Chudy, P.; Sibiński, M.; Wisz, G.; Rybak-Wilusz, E.; Cholewa, M. Numerical analysis and optimization of Cu2O/TiO2, CuO/TiO2, heterojunction solar cells using SCAPS. J. Phys. Conf. Ser. 2018, 1033, 012002. [Google Scholar] [CrossRef] [Green Version]
  15. Wu, R.; Fan, G.C.; Jiang, L.P.; Zhu, J.J. Peptide-based photoelectrochemical cytosensor using a hollow-TiO2/EG/ZnIn2S4 cosensitized structure for ultrasensitive detection of early apoptotic cells and drug evaluation. ACS Appl. Mater. Interfaces 2018, 10, 4429–4438. [Google Scholar] [CrossRef] [PubMed]
  16. Chen, J.; Kong, L.; Sun, X.K.; Feng, J.H.; Chen, Z.W.; Fan, D.W.; Wei, Q. Ultrasensitive photoelectrochemical immunosensor of cardiac troponin I detection based on dual inhibition effect of Ag@Cu2O core-shell submicron-particles on CdS QDs sensitized TiO2 nanosheets. Biosens. Bioelectron. 2018, 117, 340–346. [Google Scholar] [CrossRef]
  17. Pang, X.H.; Bian, H.J.; Wang, W.J.; Liu, C.; Khan, M.S.; Wang, Q.; Qi, J.N.; Wei, Q.; Du, B. A bio-chemical application of N-GQDs and g-C3N4 QDs sensitized TiO2 nanopillars for the quantitative detection of pcDNA3-HBV. Biosens. Bioelectron. 2017, 91, 456–464. [Google Scholar] [CrossRef]
  18. Yang, L.W.; Liu, X.Q.; Li, L.L.; Zhang, S.; Zheng, H.J.; Tang, Y.F.; Ju, H.X. A visible light photoelectrochemical sandwich aptasensor for adenosine triphosphate based on MgIn2S4-TiO2 nanoarray heterojunction. Biosens. Bioelectron. 2019, 142, 111487. [Google Scholar] [CrossRef]
  19. Shu, J.; Qiu, Z.L.; Zhuang, J.Y.; Xu, M.D.; Tang, D.P. In situ generation of electron donor to assist signal amplification on porphyrin-sensitized titanium dioxide nanostructures for ultrasensitive photoelectrochemical immunoassay. ACS Appl. Mater. Interfaces 2015, 7, 23812–23818. [Google Scholar] [CrossRef]
  20. Liu, X.Q.; Huo, X.H.; Liu, P.P.; Tang, Y.F.; Xu, J.; Liu, X.; Zhou, Y.M. Assembly of MoS2 nanosheet-TiO2 nanorod heterostructure as sensor scaffold for photoelectrochemical biosensing. Electrochim. Acta 2017, 242, 327–336. [Google Scholar] [CrossRef]
  21. Da, P.M.; Li, W.J.; Lin, X.; Wang, Y.C.; Tang, J.; Zheng, G.F. Surface plasmon resonance enhanced real-time photoelectrochemical protein sensing by gold nanoparticle-decorated TiO2 nanowires. Anal. Chem. 2014, 86, 6633–6639. [Google Scholar] [CrossRef] [PubMed]
  22. Pang, X.H.; Bian, H.J.; Su, M.H.; Ren, Y.Y.; Qi, J.N.; Ma, H.M.; Wu, D.; Wei, Q. Photoelectrochemical cytosensing of RAW264.7 macrophage cells based on a TiO2 nanoneedls@MoO3 array. Anal. Chem. 2017, 89, 7950–7957. [Google Scholar] [CrossRef] [PubMed]
  23. Zhang, R.; Zhong, X.; Chen, A.Y.; Liu, J.L.; Li, S.K.; Chai, Y.Q.; Zhuo, Y.; Yuan, R. Novel Ru (bpy)2 (cpaphen)2+/TPrA/TiO2 ternary ECL system: An efficient platform for the detection of glutathione with Mn2+ as substitute target. Anal. Chem. 2019, 91, 3681–3686. [Google Scholar] [CrossRef] [PubMed]
  24. Zhou, Y.; Wang, H.J.; Zhuo, Y.; Chai, Y.Q.; Yuan, R. Highly efficient electrochemiluminescent silver nanoclusters/titanium oxide nanomaterials as a signal probe for ferrocene-driven light switch bioanalysis. Anal. Chem. 2017, 89, 3732–3738. [Google Scholar] [CrossRef] [PubMed]
  25. Tang, Y.F.; Liu, X.Q.; Zheng, H.J.; Yang, L.W.; Li, L.L.; Zhang, S.; Zhou, Y.M.; Alwarappan, S. A photoelectrochemical aptasensor for aflatoxin B1 detection based on an energy transfer strategy between Ce-TiO2@MoSe2 and Au nanoparticles. Nanoscale 2019, 11, 9115–9124. [Google Scholar] [CrossRef] [PubMed]
  26. Liu, N.N.; Chen, S.H.; Li, Y.L.; Dai, H.; Lin, Y.Y. Self-enhanced photocathodic matrix based on poly-dopamine sensitized TiO2 mesocrystals for mycotoxin detection assisted by a dual amplificatory nanotag. New J. Chem. 2017, 41, 3380–3386. [Google Scholar] [CrossRef]
  27. Dai, H.; Xu, G.F.; Zhang, S.P.; Hong, Z.S.; Lin, Y.Y. A ratiometric biosensor for metallothionein based on a dual heterogeneous electro-chemiluminescent response from a TiO2 mesocrystalline interface. Chem. Commun. 2015, 51, 7697–7700. [Google Scholar] [CrossRef]
  28. Qiu, Z.L.; Tang, D.P. Nanostructure-based photoelectrochemical sensing platforms for biomedical applications. J. Mater. Chem. B 2020, 8, 2541–2561. [Google Scholar] [CrossRef]
  29. So, S.; Hwang, I.; Schmuki, P. Hierarchical DSSC structures based on “single walled” TiO2 nanotube arrays reach a back-side illumination solar light conversion efficiency of 8%. Energy Environ. Sci. 2015, 8, 849–854. [Google Scholar] [CrossRef] [Green Version]
  30. Fan, K.; Chen, J.N.; Yang, F.; Peng, T.Y. Self-organized film of ultra-fine TiO2 nanotubes and its application to dye-sensitized solar cells on a flexible Ti-foil substrate. J. Mater. Chem. 2012, 22, 4681–4686. [Google Scholar] [CrossRef]
  31. Ma, L.L.; Yue, Z.; Huo, G.N.; Zhang, S.S.; Zhu, B.L.; Zhang, S.M.; Huang, W.P. 3D Hydrogen Titanate Nanotubes on Ti Foil: A Carrier for Enzymatic Glucose Biosensor. Sensors 2020, 20, 1024. [Google Scholar] [CrossRef] [PubMed] [Green Version]
  32. Shen, S.H.; Chen, J.; Wang, M.; Sheng, X.; Chen, X.Y.; Feng, X.J.; Mao, S.S. Titanium dioxide nanostructures for photoelectrochemical applications. Prog. Mater. Sci. 2018, 98, 299–385. [Google Scholar] [CrossRef]
  33. Chen, Y.; Li, X.; Cai, G.N.; Li, M.J.; Tang, D.P. In situ formation of (0 0 1) TiO2/Ti3C2 heterojunctions for enhanced photoelectrochemical detection of dopamine. Electrochem. Commun. 2021, 125, 106987. [Google Scholar] [CrossRef]
  34. Cai, G.N.; Yu, Z.Z.; Ren, R.R.; Tang, D.P. Exciton–plasmon interaction between AuNPs/graphene nanohybrids and CdS quantum dots/TiO2 for photoelectrochemical aptasensing of prostate-specific antigen. ACS Sens. 2018, 3, 632–639. [Google Scholar] [CrossRef]
  35. Shu, J.; Qiu, Z.L.; Lv, S.Z.; Zhang, K.Y.; Tang, D.P. Plasmonic enhancement coupling with defect-engineered TiO2–x: A mode for sensitive photoelectrochemical biosensing. Anal. Chem. 2018, 90, 2425–2429. [Google Scholar] [CrossRef]
  36. Yang, Z.; Xu, W.; Yan, B.D.; Wu, B.Q.; Ma, J.X.; Wang, X.H.; Qiao, B.; Tu, J.C.; Pei, H.; Chen, D.L.; et al. Gold and Platinum Nanoparticle-Functionalized TiO2 Nanotubes for Photoelectrochemical Glucose Sensing. ACS Omega 2022, 7, 2474–2483. [Google Scholar] [CrossRef]
  37. Cui, L.; Shen, J.Z.; Li, C.C.; Cui, P.P.; Luo, X.L.; Wang, X.L.; Zhang, C.Y. Construction of a dye-sensitized and gold plasmon-enhanced cathodic photoelectrochemical biosensor for methyltransferase activity assay. Anal. Chem. 2021, 93, 10310–10316. [Google Scholar] [CrossRef]
  38. Matković, A.; Petritz, A.; Schider, G.; Krammer, M.; Kratzer, M.; Karner-Petritz, E.; Fian, A.; Gold, H.; Gärtner, M.; Terfort, A. Interfacial band engineering of MoS2/gold interfaces using pyrimidine-containing self-assembled monolayers: Toward contact-resistance-free bottom-contacts. Adv. Electron. Mater. 2020, 6, 2000110. [Google Scholar] [CrossRef] [Green Version]
  39. Cui, Z.K.; Zhang, L.X.; Wang, Y.; He, W.W. Plasmon excitation facilitating generation of electrons and reactive oxygen species for broad spectrum photocatalytic activity. Appl. Surf. Sci. 2022, 584, 152655. [Google Scholar] [CrossRef]
  40. Liu, N.; Mesch, M.; Weiss, T.; Hentschel, M.; Giessen, H. Infrared perfect absorber and its application as plasmonic sensor. Nano Lett. 2010, 10, 2342–2348. [Google Scholar] [CrossRef]
  41. Zaman, M.A.; Padhy, P.; Hesselink, L. Solenoidal optical forces from a plasmonic Archimedean spiral. Phys. Rev. A 2019, 100, 013857. [Google Scholar] [CrossRef] [PubMed]
  42. Wu, L.; Li, F.; Xu, Y.Y.; Zhang, J.W.; Zhang, D.Q.; Li, G.S.; Li, H.X. Plasmon-induced photoelectrocatalytic activity of Au nanoparticles enhanced TiO2 nanotube arrays electrodes for environmental remediation. Appl. Catal. B Environ. 2015, 164, 217–224. [Google Scholar] [CrossRef]
  43. Melvin, A.A.; Illath, K.; Das, T.; Raja, T.; Bhattacharyya, S.; Gopinath, C.S. M–Au/TiO2 (M = Ag, Pd, and Pt) nanophotocatalyst for overall solar water splitting: Role of interfaces. Nanoscale 2015, 7, 13477–13488. [Google Scholar] [CrossRef] [PubMed]
  44. Ali, H.; Bensaali, F.; Jaber, F. Novel approach to non-invasive blood glucose monitoring based on transmittance and refraction of visible laser light. IEEE Access 2017, 5, 9163–9174. [Google Scholar] [CrossRef]
  45. An, H.Q.; Zhu, B.L.; Li, J.X.; Zhou, J.; Wang, S.R.; Zhang, S.M.; Wu, S.H.; Huang, W.P. Synthesis and characterization of thermally stable nanotubular TiO2 and its photocatalytic activity. J. Phys. Chem. C 2008, 112, 18772–18775. [Google Scholar] [CrossRef]
  46. Zhang, L.; Yu, W.; Han, C.; Guo, J.; Zhang, Q.H.; Xie, H.Y.; Shao, Q.; Sun, Z.G.; Guo, Z.H. Large scaled synthesis of heterostructured electrospun TiO2/SnO2 nanofibers with an enhanced photocatalytic activity. J. Electrochem. Soc. 2017, 164, H651–H656. [Google Scholar] [CrossRef] [Green Version]
  47. Pustovalova, A.; Boytsova, E.; Aubakirova, D.; Bruns, M.; Tverdokhlebov, S.; Pichugin, V. Formation and structural features of nitrogen-doped titanium dioxide thin films grown by reactive magnetron sputtering. Appl. Surf. Sci. 2020, 534, 147572. [Google Scholar] [CrossRef]
  48. Wang, H.Q.; Wu, D.Y.; Liu, C.Y.; Guan, J.R.; Li, J.Z.; Huo, P.W.; Liu, X.L.; Wang, Q.; Yan, Y.S. Fabrication of Ag/In2O3/TiO2/HNTs hybrid-structured and plasma effect photocatalysts for enhanced charges transfer and photocatalytic activity. J. Ind. Eng. Chem. 2018, 67, 164–174. [Google Scholar] [CrossRef]
  49. Zhou, H.; Zhang, Y.R. Electrochemically self-doped TiO2 nanotube arrays for supercapacitors. J. Phys. Chem. C 2014, 118, 5626–5636. [Google Scholar] [CrossRef]
  50. Han, Q.W.; Zhang, D.Y.; Guo, J.L.; Zhu, B.L.; Huang, W.P.; Zhang, S.M. Improved catalytic performance of Au/α-Fe2O3-like-worm catalyst for low temperature CO oxidation. Nanomaterials 2019, 9, 1118. [Google Scholar] [CrossRef] [Green Version]
  51. Tahir, M.; Tahir, B.; Amin, N.A.S. Synergistic effect in plasmonic Au/Ag alloy NPs co-coated TiO2 NWs toward visible-light enhanced CO2 photoreduction to fuels. Appl. Catal. B Environ. 2017, 204, 548–560. [Google Scholar] [CrossRef]
  52. Ge, L.Y.; Hou, R.; Cao, Y.; Tu, J.C.; Wu, Q. Photoelectrochemical enzymatic sensor for glucose based on Au@C/TiO2 nanorod arrays. RSC Adv. 2020, 10, 44225–44231. [Google Scholar] [CrossRef] [PubMed]
  53. Yan, B.D.; Zhao, X.R.; Chen, D.L.; Cao, Y.; Lv, C.Z.; Tu, J.C.; Wang, X.H.; Wu, Q. Enhanced photoelectrochemical biosensing performance for Au nanoparticle–polyaniline–TiO2 heterojunction composites. RSC Adv. 2020, 10, 43985–43993. [Google Scholar] [CrossRef] [PubMed]
  54. Mai, H.H.; Janssens, E. Au nanoparticle–decorated ZnO nanorods as fluorescent non-enzymatic glucose probe. Microchim. Acta 2020, 187, 577. [Google Scholar] [CrossRef] [PubMed]
  55. Long, M.; Tan, L.; Liu, H.T.; He, Z.; Tang, A.D. Novel helical TiO2 nanotube arrays modified by Cu2O for enzyme-free glucose oxidation. Biosens. Bioelectron. 2014, 59, 243–250. [Google Scholar] [CrossRef]
  56. Yang, W.K.; Xu, W.; Wang, Y.D.; Chen, D.L.; Wang, X.H.; Cao, Y.; Wu, Q.; Tu, J.C.; Zhen, C. Photoelectrochemical glucose biosensor based on the heterogeneous facets of nanocrystalline TiO2/Au/glucose oxidase films. ACS Appl. Nano Mater. 2020, 3, 2723–2732. [Google Scholar] [CrossRef]
  57. Artigues, M.; Abellà, J.; Colominas, S. Analytical parameters of an amperometric glucose biosensor for fast analysis in food samples. Sensors 2017, 17, 2620. [Google Scholar] [CrossRef] [Green Version]
Figure 1. XRD pattern of (a) TiO2NTs and Au/TiO2NTs with different gold contents: (b) 0.25 wt.%, (c) 0.5 wt.%, (d) 0.75 wt.%, and (e) 1.0 wt.%.
Nanomaterials 12 02058 g001
Figure 2. (a) TEM, (b) HRTEM, and (c) EDS mapping, (d) Ti, (e) O, (f) Au images of 0.5 wt.% Au/TiO2NTs.
Nanomaterials 12 02058 g002
Figure 3. (a) XPS full spectrum of 0.5 wt.% Au/TiO2NTs, and high-resolution spectrum for (b) O 1s; (c) Ti 2p; (d) Au 4f.
Nanomaterials 12 02058 g003
Figure 4. (a) UV–Vis DRS, and (b) bandgap energies of TiO2NTs and 0.5 wt.% Au/TiO2NTs.
Nanomaterials 12 02058 g004
Figure 5. Photoluminescence spectra of (a) TiO2NTs and (b) 0.5 wt.% Au/TiO2NTs in the powder form at 300 nm excitation.
Nanomaterials 12 02058 g005
Figure 6. (a) Photocurrent–time responses at different bias voltages in 0.1 M NaOH, and (b) photocurrent–time responses of different gold loading of Au/TiO2NTs in 0.1 M NaOH at 0.3 V.
Nanomaterials 12 02058 g006
Figure 7. (a) Photocurrent curve in different concentrations of glucose, and (b) a corresponding calibration curve of the 0.5 wt.% Au/TiO2NTs electrode for the detection of glucose (1–90 μM).
Nanomaterials 12 02058 g007
Figure 8. Comparison of photocurrent sizes of a 0.5 wt.% Au/TiO2NT electrode in various solutions.
Nanomaterials 12 02058 g008
Figure 9. Photocurrent response stability of the 0.5 wt.% Au/TiO2NT electrode in 50 μM glucose solution.
Nanomaterials 12 02058 g009
Figure 10. Relationship between the times and response of the 0.5 wt.% Au/TiO2NTs in 50 μM glucose solution.
Nanomaterials 12 02058 g010
Scheme 1. (A) Photoelectrochemical measurements via the three-electrode system; (B) the mechanism for PEC detection of glucose on the Au/TiO2NTs.
Nanomaterials 12 02058 sch001
Table 1. Comparison of analytical characteristics of different glucose sensors.
Configuration of BiosensorLinear Range (μM)Sensitivity (μA·mM−1·cm−2)Detection Limit (μM)Ref.
Au/TiO2 NTs/GCE1–90170.371.3This work
GODx/Au@C/TiO2/FTO100–160029.7649[52]
GOx@Au-PANI-TiO22000–360000.8320[53]
ZnO NRs/Au NPs10–20002210[54]
Cu2O/TiO23000–900014.5662[55]
GOx/TiO2500–30009.2515[56]
GOx–Chitosan/TiO2NTAs300–15005.4670[57]
Publisher’s Note: MDPI stays neutral with regard to jurisdictional claims in published maps and institutional affiliations.

