
Depth of Cure, Hardness, Roughness and Filler Dimension of Bulk-Fill Flowable, Conventional Flowable and High-Strength Universal Injectable Composites: An In Vitro Study

 , ,
, ,  ,
, 

Abstract
:1. Introduction
2. Materials and Methods
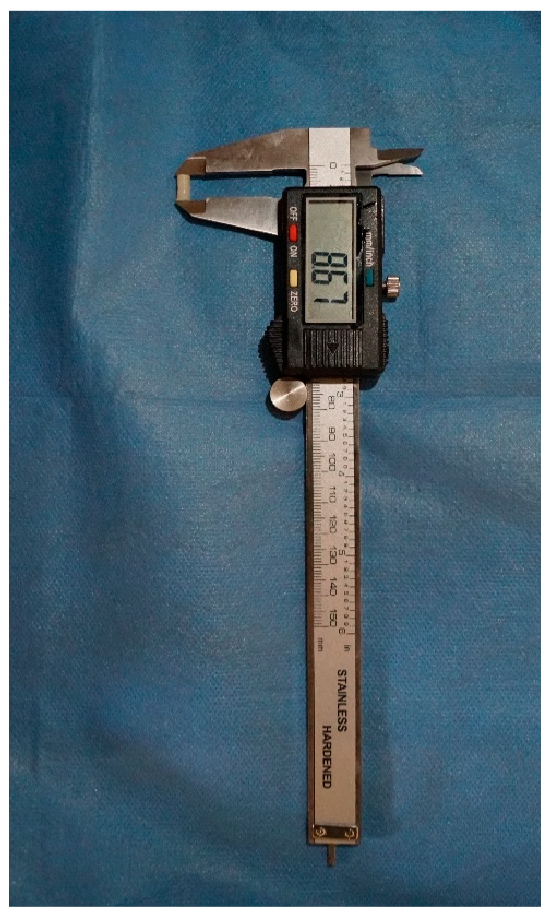
2.1. Depth of Cure
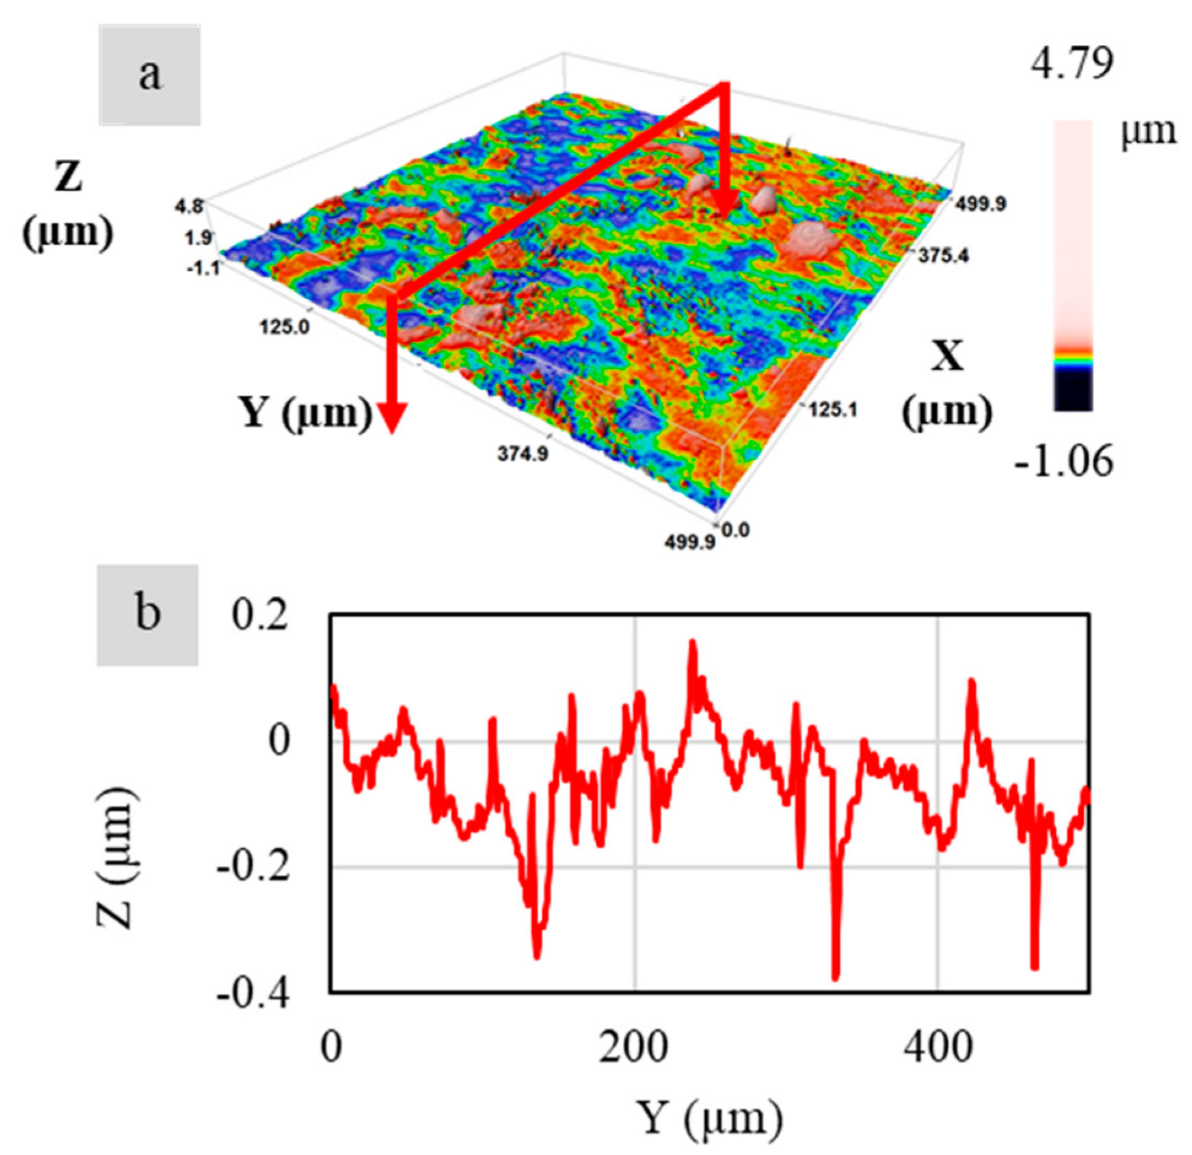
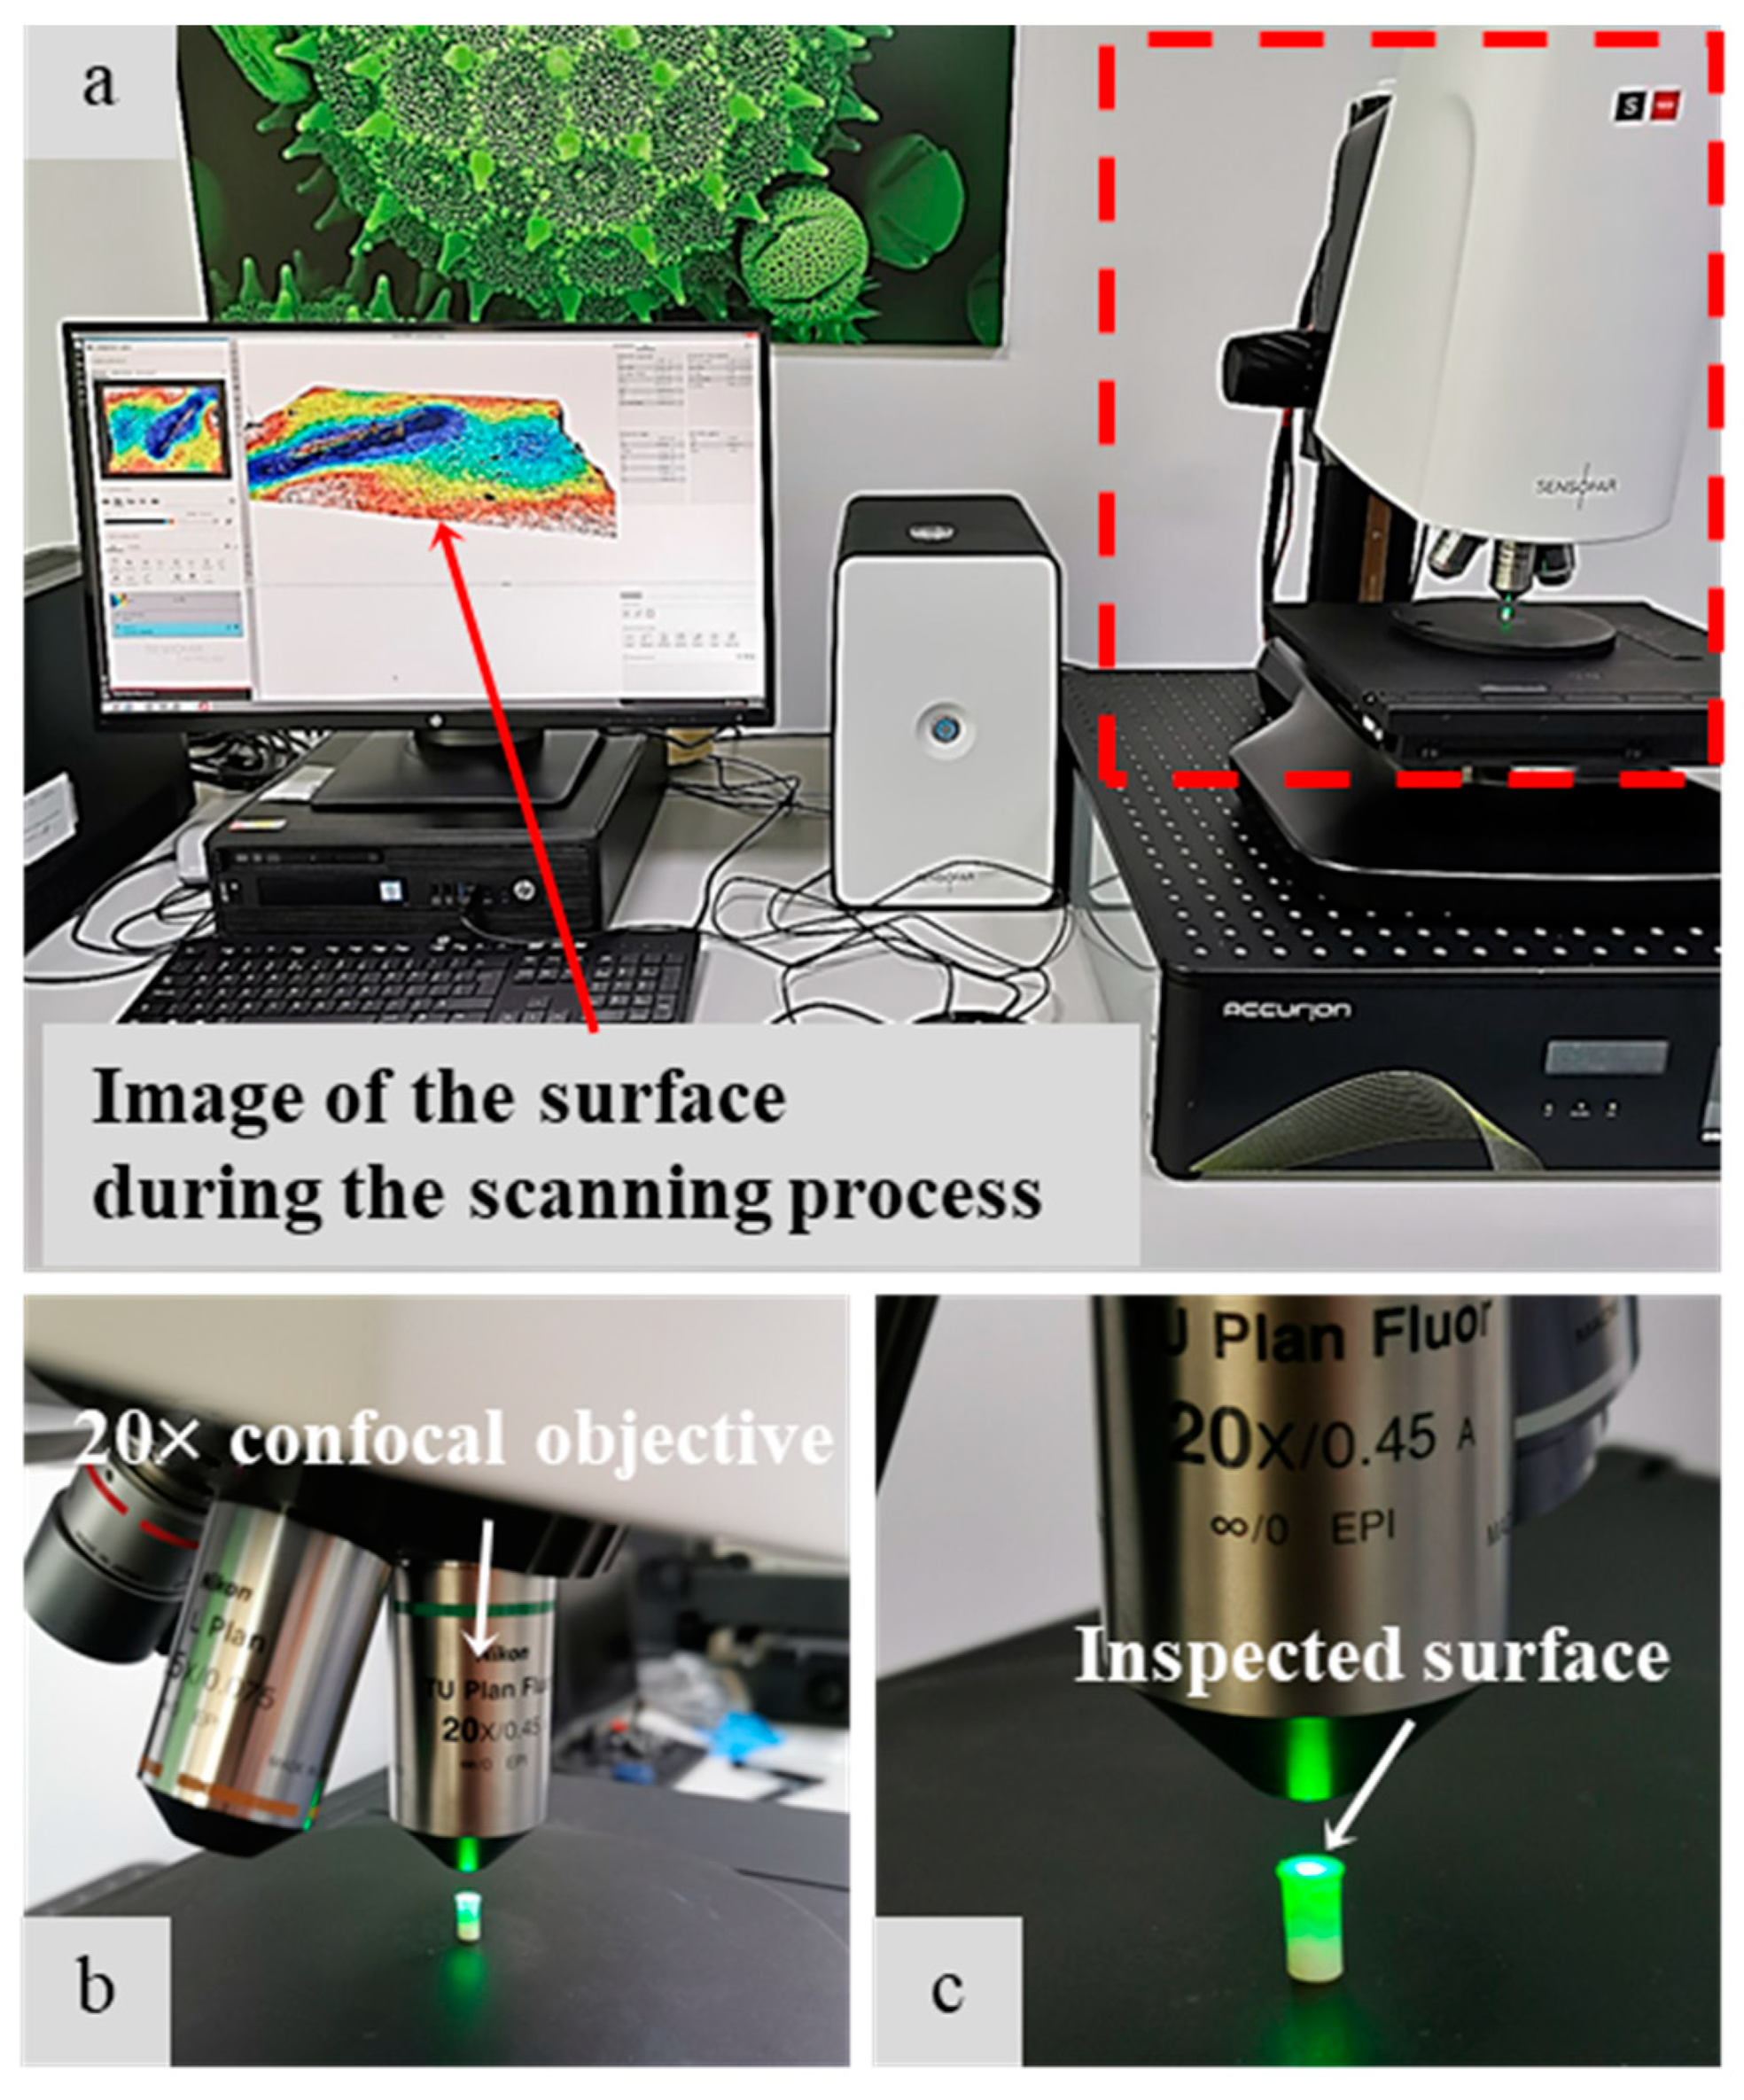
2.2. Roughness
2.3. Microhardness
2.4. Scanning Electron Microscope
3. Results
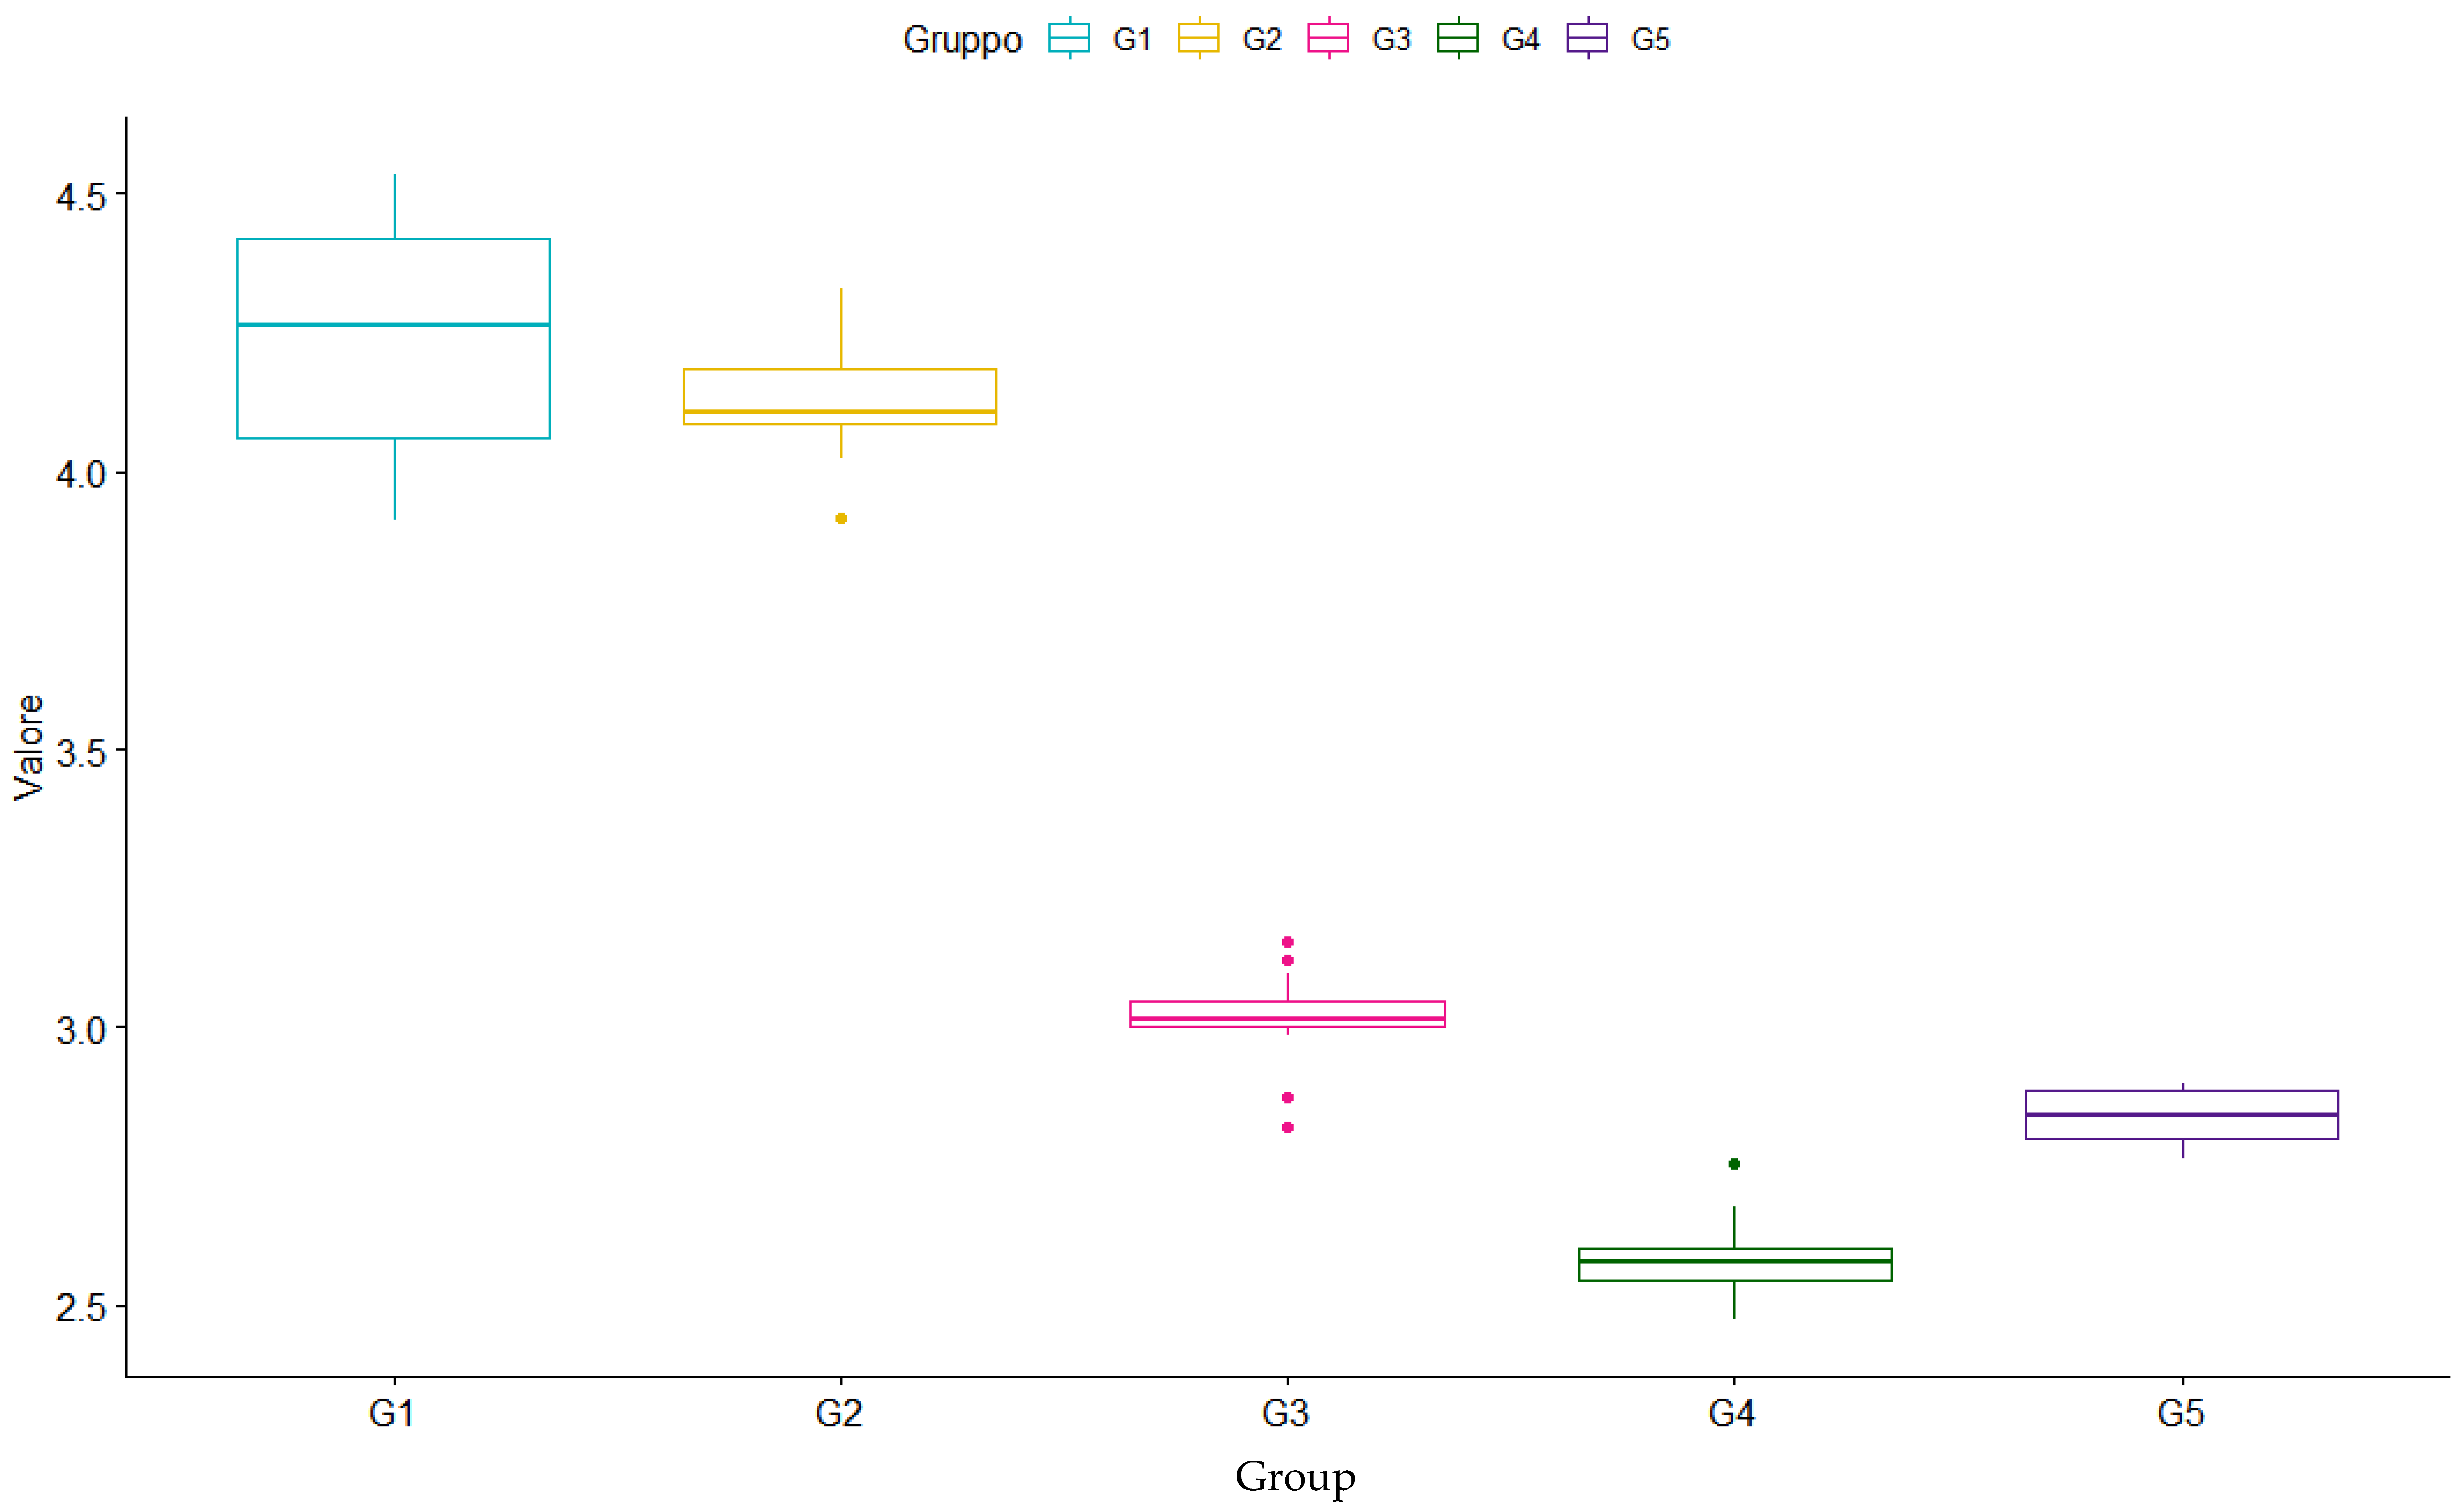
3.1. Depth of Cure
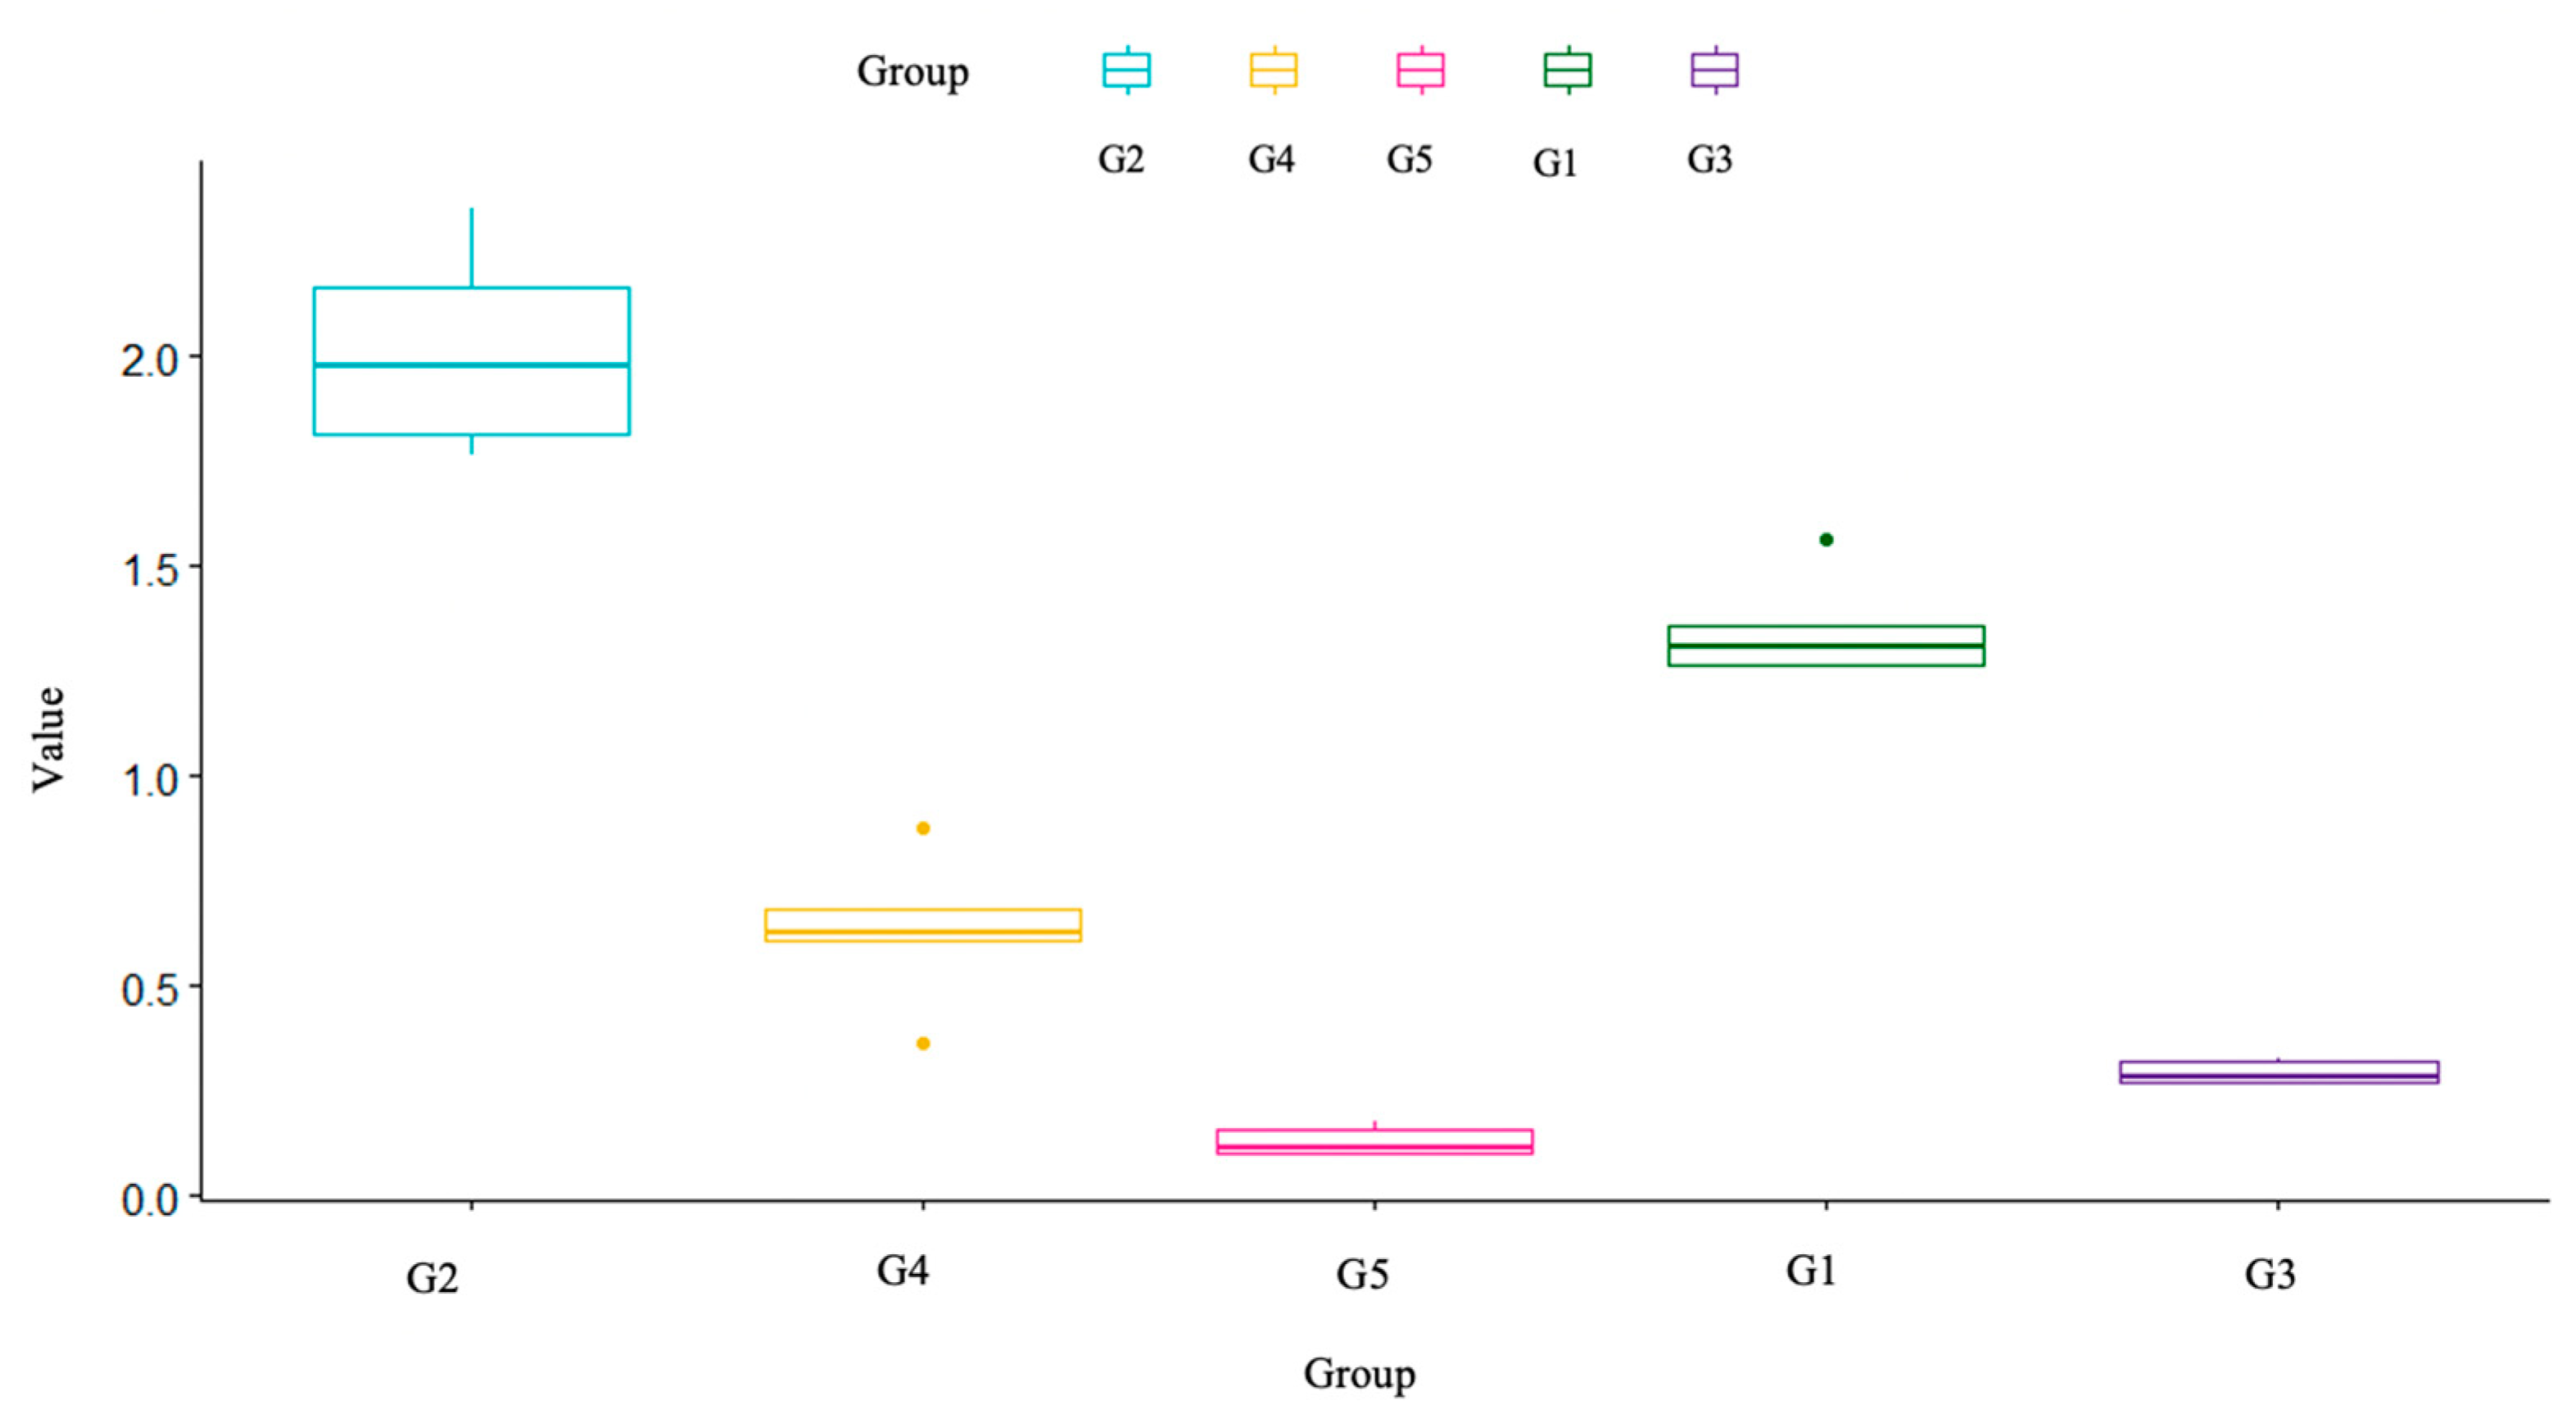
3.2. Roughness
3.3. Microhardness
3.4. Scanning Electron Microscope (SEM)
3.5. Figures, Tables and Schemes
4. Conclusions
Author Contributions
Funding
Data Availability Statement
Acknowledgments
Conflicts of Interest
References
- Yadav, R.; Kumar, M. Dental restorative composite materials: A review. J. Oral Biosci. 2019, 61, 78–83. [Google Scholar] [CrossRef]
- Rodríguez-Lozano, F.J.; Serrano-Belmonte, I.; Pérez Calvo, J.C.; Coronado-Parra, M.T.; Bernabeu-Esclapez, A.; Moraleda, J.M. Effects of two low-shrinkage composites on dental stem cells (viability, cell damaged or apoptosis and mesenchymal markers expression). J. Mater. Sci. Mater. Med. 2013, 24, 979–988. [Google Scholar] [CrossRef]
- Anusavice, K.J. Phillip’s Science of Dental Materials, 11th ed.; Saunders: St. Louis, MO, USA, 2003; pp. 655–719. [Google Scholar]
- Musanje, L.; Darvell, B.W. Curing-light attenuation in filled-resin restorative materials. Dent. Mater. 2006, 22, 804–1722. [Google Scholar] [CrossRef]
- Demarco, F.F.; Corrêa, M.B.; Cenci, M.S.; Moraes, R.R.; Opdam, N.J. Longevity of posterior composite restorations: Not only a matter of materials. Dent. Mater. 2012, 28, 87–101. [Google Scholar] [CrossRef]
- Schneider, L.; Cavalcante, L.; Silikas, N. Shrinkage Stresses Generated during Resin-Composite Applications: A Review. J. Dent. Biomech. 2010, 2020, 131630. [Google Scholar] [CrossRef]
- Feilzer, A.J.; Dooren, L.H.; de Gee, A.J.; Davidson, C.L. Influence of light intensity on polymerization shrinkage and integrity of restoration-cavity interface. Eur. J. Oral Sci. 1995, 103, 322–326. [Google Scholar] [CrossRef]
- Alomari, Q.D.; Reinhardt, J.W.; Boyer, D.B. Effect of liners on cusp deflection and gap formation in composite restorations. Oper. Dent. 2001, 26, 406–411. [Google Scholar]
- Park, J.; Chang, J.; Ferracane, J.; Lee, I.B. How should composite be layered to reduce shrinkage stress: Incremental or bulk filling? Dent. Mater. 2008, 24, 1501–1505. [Google Scholar] [CrossRef]
- Chandrasekhar, V.; Rudrapati, L.; Badami, V.; Tummala, M. Incremental techniques in direct composite restoration. J. Conserv. Dent. 2017, 20, 386–391. [Google Scholar]
- de Araújo, C.S.; Schein, M.T.; Zanchi, C.H.; Rodrigues, S.A., Jr.; Demarco, F.F. Composite resin microhardness: The influence of light curing method, composite shade, and depth of cure. J. Contemp. Dent. Pract. 2008, 9, 43–50. [Google Scholar]
- Chesterman, J.; Jowett, A.; Gallacher, A.; Nixon, P. Bulk-fill resin-based composite restorative materials: A review. Br. Dent. J. 2017, 222, 337–344. [Google Scholar] [CrossRef] [PubMed]
- Aggarwal, N.; Jain, A.; Gupta, H.; Abrol, A.; Singh, C.; Rapgay, T. The comparative evaluation of depth of cure of bulk-fill composites—An in vitro study. J. Conserv. Dent. 2019, 22, 371–375. [Google Scholar]
- Yu, P.; Yap, A.; Wang, X.Y. Degree of Conversion and Polymerization Shrinkage of Bulk-Fill Resin-Based Composites. Oper. Dent. 2017, 42, 82–89. [Google Scholar] [CrossRef] [PubMed] [Green Version]
- Zorzin, J.; Maiera, E.; Harre, S.; Fey, T.; Belli, R.; Lohbauer, U.; Petschelt, A.; Taschner, M. Bulk-fill resin composites: Polymerization properties and extended light curing. Dent. Mater. 2015, 31, 293–301. [Google Scholar] [CrossRef]
- Bucuta, S.; Ilie, N. Light transmittance and micromechanical propertiesof bulk fill vs. conventional resin based composites. Clin. Oral Investig. 2014, 18, 1991–2000. [Google Scholar] [CrossRef] [PubMed]
- Ilie, N.; Bucuta, S.; Draenert, M. Bulk-fill resin-based composites: An in vitro assessment of their mechanical performance. Oper. Dent. 2013, 38, 618–625. [Google Scholar] [CrossRef]
- Lima, R.B.W.; Troconis, C.C.M.; Moreno, M.B.P.; Murillo-Gómez, F.; De Goes, M.F. Depth of cure of bulk fill resin composites: A systematic review. J. Esthet. Restor. Dent. 2018, 30, 492–501. [Google Scholar] [CrossRef]
- Haugen, H.J.; Marovic, D.; Par, M.; Thieu, M.K.L.; Reseland, J.E.; Johnsen, G.F. Bulk Fill Composites Have Similar Performance to Conventional Dental Composites. Int. J. Mol. Sci. 2020, 21, 5136. [Google Scholar] [CrossRef]
- Lee, C.I.; Yi, M.D.; Gage, B.M.; Yarbrough, L.N.; Kirkwood, B.J.; Lien, W. Post-Cure Polymerization and Depth-of-Cure Behaviors of Dental Bulk-Fill Resin-Based Composites. Med. J. 2021, PB, 74–82. [Google Scholar]
- Rocha, M.G.; Roulet, J.F.; Sinhoreti, M.A.C.; Correr, A.B.; Oliveira, D. Light Transmittance and Depth of Cure of a Bulk Fill Composite Based on the Exposure Reciprocity Law. Braz. Dent. J. 2021, 32, 78–84. [Google Scholar] [CrossRef] [PubMed]
- Garcia, D.; Yaman, P.; Dennison, J.; Neiva, G. Polymerization shrinkage and depth of cure of bulk fill flowable composite resins. Oper. Dent. 2014, 39, 441–448. [Google Scholar] [CrossRef] [PubMed]
- ISO-Standards (2009) ISO 4049; Dentistry—Polymer-Based Restorative Materials Geneve. 4th ed. International Organization for Standardization: London, UK, 2019; pp. 1–28.
- Ludovichetti, F.S.; Trindade, F.Z.; Adabo, G.L.; Pezzato, L.; Fonseca, R.G. Effect of grinding and polishing on the roughness and fracture resistance of cemented CAD-CAM monolithic materials submitted to mechanical aging. J. Prosthet. Dent. 2019, 121, 866.e1–866.e8. [Google Scholar] [CrossRef]
- Ludovichetti, F.S.; Zambon, G.; Cimolai, M.; Gallo, M.; Signoriello, A.G.; Pezzato, L.; Bertolini, R.; Mazzoleni, S. Efficacy of Two Toothpaste in Preventing Tooth Erosive Lesions Associated with Gastroesophageal Reflux Disease. Appl. Sci. 2022, 12, 1023. [Google Scholar] [CrossRef]
- Flury, S.; Hayoz, S.; Peutzfeldt, A.; Hüsler, J.; Lussi, A. Depth of cure of resin composites: Is the ISO 4049 method suitable for bulk fill materials? Dent. Mater. 2012, 28, 521–528. [Google Scholar] [CrossRef]
- Moore, B.K.; Platt, J.A.; Borges, G.; Chu, T.M.; Katsilieri, I. Depth of cure of dental resin composites: ISO 4049 depth and microhardness of types of materials and shades. Oper. Dent. 2008, 33, 408–412. [Google Scholar] [CrossRef] [Green Version]
- 3M ESPE. Filtek Bulk Fill Flowable Restorative Technical Product Profile; 3M ESPE: Seefeld, Germany, 2012. [Google Scholar]
- Ivoclar Vivadent, A.G. Report No. 20 Research and Development; 2015; Available online: https://ivodent.hu/__docs/748_13c1b7a8cb7fb256026744e9bb362b76.pdf (accessed on 1 May 2022).
- Anand Yokesh, C.A.; Hemalatha, P.; Muthalagu, M.; Justin, M.R. Comparative Evaluation of the Depth of Cure and Degree of Conversion of Two Bulk Fill Flowable Composites. J. Clin. Diagn. Res. 2017, 11, ZC86–ZC89. [Google Scholar]
- Lee, Y.K. Influence of filler on the difference between the transmitted and reflected colors of experimental resin composites. Dent. Mater. 2008, 24, 1243–1247. [Google Scholar] [CrossRef] [PubMed]
- Shortall, A.C.; Palin, W.M.; Burtscher, P. Refractive index mismatch and monomer reactivity influence composite curing depth. J. Dent. Res. 2008, 87, 84–88. [Google Scholar] [CrossRef]
- Lee, Y.K.; Lu, H.; Powers, J.M. Measurement of opalescence of resin composites. Dent. Mater. 2005, 21, 1068–1074. [Google Scholar] [CrossRef]
- Kim, J.J.; Moon, H.J.; Lim, B.S.; Lee, Y.K.; Rhee, S.H.; Yang, H.C. The effect of nanofiller on the opacity of experimental composites. J. Biomed. Mater. Res. B Appl. Biomater. 2007, 80, 332–338. [Google Scholar] [CrossRef] [PubMed]
- Tsujimoto, A.; Barkmeier, W.W.; Takamizawa, T.; Latta, M.A.; Miyazaki, M. Depth of cure, flexural properties and volumetric shrinkage of low and high viscosity bulk-fill giomers and resin composites. Dent. Mater. J. 2017, 36, 205–213. [Google Scholar] [CrossRef] [Green Version]
- Halvorson, R.H.; Erickson, R.L.; Davidson, C.L. Energy dependent polymerization of resin-based composite. Dent. Mater. 2002, 18, 463–469. [Google Scholar] [CrossRef]
- Price, R.B.; Shortall, A.C.; Palin, W.M. Contemporary issues in light curing. Oper. Dent. 2014, 39, 4–14. [Google Scholar] [CrossRef] [Green Version]
- Erickson, R.L.; Barkmeier, W.W. Curing characteristics of a composite—Part 2: The effect of curing configuration on depth and distribution of cure. Dent. Mater. 2014, 30, 14–145. [Google Scholar] [CrossRef]


| Group | Material | Composition | Filler % (wt%/vol%) | Type | Manufacturer | Shade | Lot |
|---|---|---|---|---|---|---|---|
| 1 | Filtek Bulk Fill Flowable Restorative | Monomers: BisGMA, BisEMA, ;Procrylat, UDMA; filler: zirconia/silica, ;YbF3; photoinitiator: camphoroquinone | 64.5/42.5 | Flowable bulk fill composite | 3M ESPE, Seefeld, Germany | A2 | NC36727 |
| 2 | Tetric EvoFlow Bulk Fill | Monomers: BisGMA, DMA; filler: barium alumino-fluoro-silicate glasses; photoinitiator: Ivocerin | 80/60 | Nanohybrid flowable bulk fill composite | Ivoclar Vivadent, Schaan, Liechtenstein | IVA | Z017XK |
| 3 | G-ænial Universal Injectable | Monomers: dimethacrylate rmonomers; filler: barium glass, silica; photoinitiator | 69/50 | Nanofilled high-strength low-viscosity composite | GC Europe | A2 | 201209A |
| 4 | Filtek Supreme XTE Flowable Restorative | Monomers: BisGMA, TEGMA, Procrylat; filler: zirconia/silica, YbF3; photoinitiator: camphoroquinone | 65/46 | Nanofilled flowable composite | 3M ESPE, Seefeld, Germany | A2 | NC65193 |
| 5 | G-ænial Flo X | Monomers: UDMA, dimethacrylate monomers; filler: barium glass; photoinitiator | 69/50 | Microhybrid flowable composite | GC Europe | A2 | 1811071 |
| Group | Mean | Standard Deviation | Median | Mininum | Maximum | Range |
|---|---|---|---|---|---|---|
| G1 | 4.24 | 0.210 | 4.263 | 3.913 | 4.533 | 0.62 |
| G2 | 4.12 | 0.095 | 4.106 | 3.918 | 4.327 | 0.409 |
| G3 | 3.02 | 0.087 | 3.016 | 2.822 | 3.153 | 0.331 |
| G4 | 2.58 | 0.075 | 2.578 | 2.473 | 2.753 | 0.28 |
| G5 | 2.84 | 0.047 | 2.841 | 2.765 | 2.9 | 0.135 |
| Comparison Groups | p-Value |
|---|---|
| G1-G2 | 0.6461 |
| G1-G3 | 0.0084 |
| G1-G4 | 0.0001 |
| G1-G5 | 0.0006 |
| G2-G3 | 0.0334 |
| G2-G4 | 0.0007 |
| G2-G5 | 0.0002 |
| G3-G4 | 0.0031 |
| G3-G5 | 0.2348 |
| G4-G5 | 0.1687 |
| Group | Mean (µm) | sd | Median (µm) | Min (µm) | Max (µm) | Range (µm) |
|---|---|---|---|---|---|---|
| G1 | 1.351 | 0.128 | 1.308 | 1.259 | 1.568 | 0.309 |
| G2 | 2.015 | 0.243 | 1.976 | 1.766 | 2.350 | 0.584 |
| G3 | 0.293 | 0.029 | 0.286 | 0.262 | 0.326 | 0.064 |
| G4 | 0.633 | 0.183 | 0.629 | 0.367 | 0.878 | 0.511 |
| G5 | 0.130 | 0.034 | 0.114 | 0.100 | 0.175 | 0.075 |
| Group | G2 | G4 | G5 | G1 |
|---|---|---|---|---|
| G4 | 0.2218 | - | - | - |
| G5 | 0.0002 | 0.1901 | - | - |
| G1 | 1.0000 | 0.8482 | 0.0114 | - |
| G3 | 0.0102 | 0.5655 | 0.2827 | 0.1587 |
| Group | Mean | sd | Median | Mininum | Maximum | Range |
|---|---|---|---|---|---|---|
| G1 | 61.4 | 2.51 | 60 | 59 | 65 | 6 |
| G2 | 72 | 1.41 | 72 | 70 | 74 | 4 |
| G3 | 64.4 | 1.14 | 64 | 63 | 66 | 3 |
| G4 | 46 | 1.41 | 46 | 44 | 48 | 4 |
| G5 | 47 | 2.00 | 48 | 44 | 49 | 5 |
| Group | G1 | G2 | G4 | G5 |
|---|---|---|---|---|
| G1 | - | 0.2356 | 0.2827 | 0.4412 |
| G3 | 0.9263 | 0.6322 | 0.0524 | 0.1384 |
| G4 | - | 0.0007 | - | - |
| G5 | - | 0.0031 | 0.6977 | - |
Publisher’s Note: MDPI stays neutral with regard to jurisdictional claims in published maps and institutional affiliations. |
© 2022 by the authors. Licensee MDPI, Basel, Switzerland. This article is an open access article distributed under the terms and conditions of the Creative Commons Attribution (CC BY) license (https://creativecommons.org/licenses/by/4.0/).
Share and Cite
Ludovichetti, F.S.; Lucchi, P.; Zambon, G.; Pezzato, L.; Bertolini, R.; Zerman, N.; Stellini, E.; Mazzoleni, S. Depth of Cure, Hardness, Roughness and Filler Dimension of Bulk-Fill Flowable, Conventional Flowable and High-Strength Universal Injectable Composites: An In Vitro Study. Nanomaterials 2022, 12, 1951. https://doi.org/10.3390/nano12121951
Ludovichetti FS, Lucchi P, Zambon G, Pezzato L, Bertolini R, Zerman N, Stellini E, Mazzoleni S. Depth of Cure, Hardness, Roughness and Filler Dimension of Bulk-Fill Flowable, Conventional Flowable and High-Strength Universal Injectable Composites: An In Vitro Study. Nanomaterials. 2022; 12(12):1951. https://doi.org/10.3390/nano12121951
Chicago/Turabian StyleLudovichetti, Francesco Saverio, Patrizia Lucchi, Giulia Zambon, Luca Pezzato, Rachele Bertolini, Nicoletta Zerman, Edoardo Stellini, and Sergio Mazzoleni. 2022. "Depth of Cure, Hardness, Roughness and Filler Dimension of Bulk-Fill Flowable, Conventional Flowable and High-Strength Universal Injectable Composites: An In Vitro Study" Nanomaterials 12, no. 12: 1951. https://doi.org/10.3390/nano12121951
APA StyleLudovichetti, F. S., Lucchi, P., Zambon, G., Pezzato, L., Bertolini, R., Zerman, N., Stellini, E., & Mazzoleni, S. (2022). Depth of Cure, Hardness, Roughness and Filler Dimension of Bulk-Fill Flowable, Conventional Flowable and High-Strength Universal Injectable Composites: An In Vitro Study. Nanomaterials, 12(12), 1951. https://doi.org/10.3390/nano12121951