
Influence of Terbium Ions and Their Concentration on the Photoluminescence Properties of Hydroxyapatite for Biomedical Applications


 ,
,  ,
,  ,
,  and
and
Abstract
:1. Introduction
2. Experimental Section
2.1. Materials
2.2. Synthesis Procedure
2.3. Characterization
2.4. Cellular Viability Assays
2.4.1. MTT Assay
2.4.2. GSH-Glo Glutathione Assay
2.4.3. Fluorescence Microscopy
3. Results and Discussions
3.1. ICP-MS Analysis
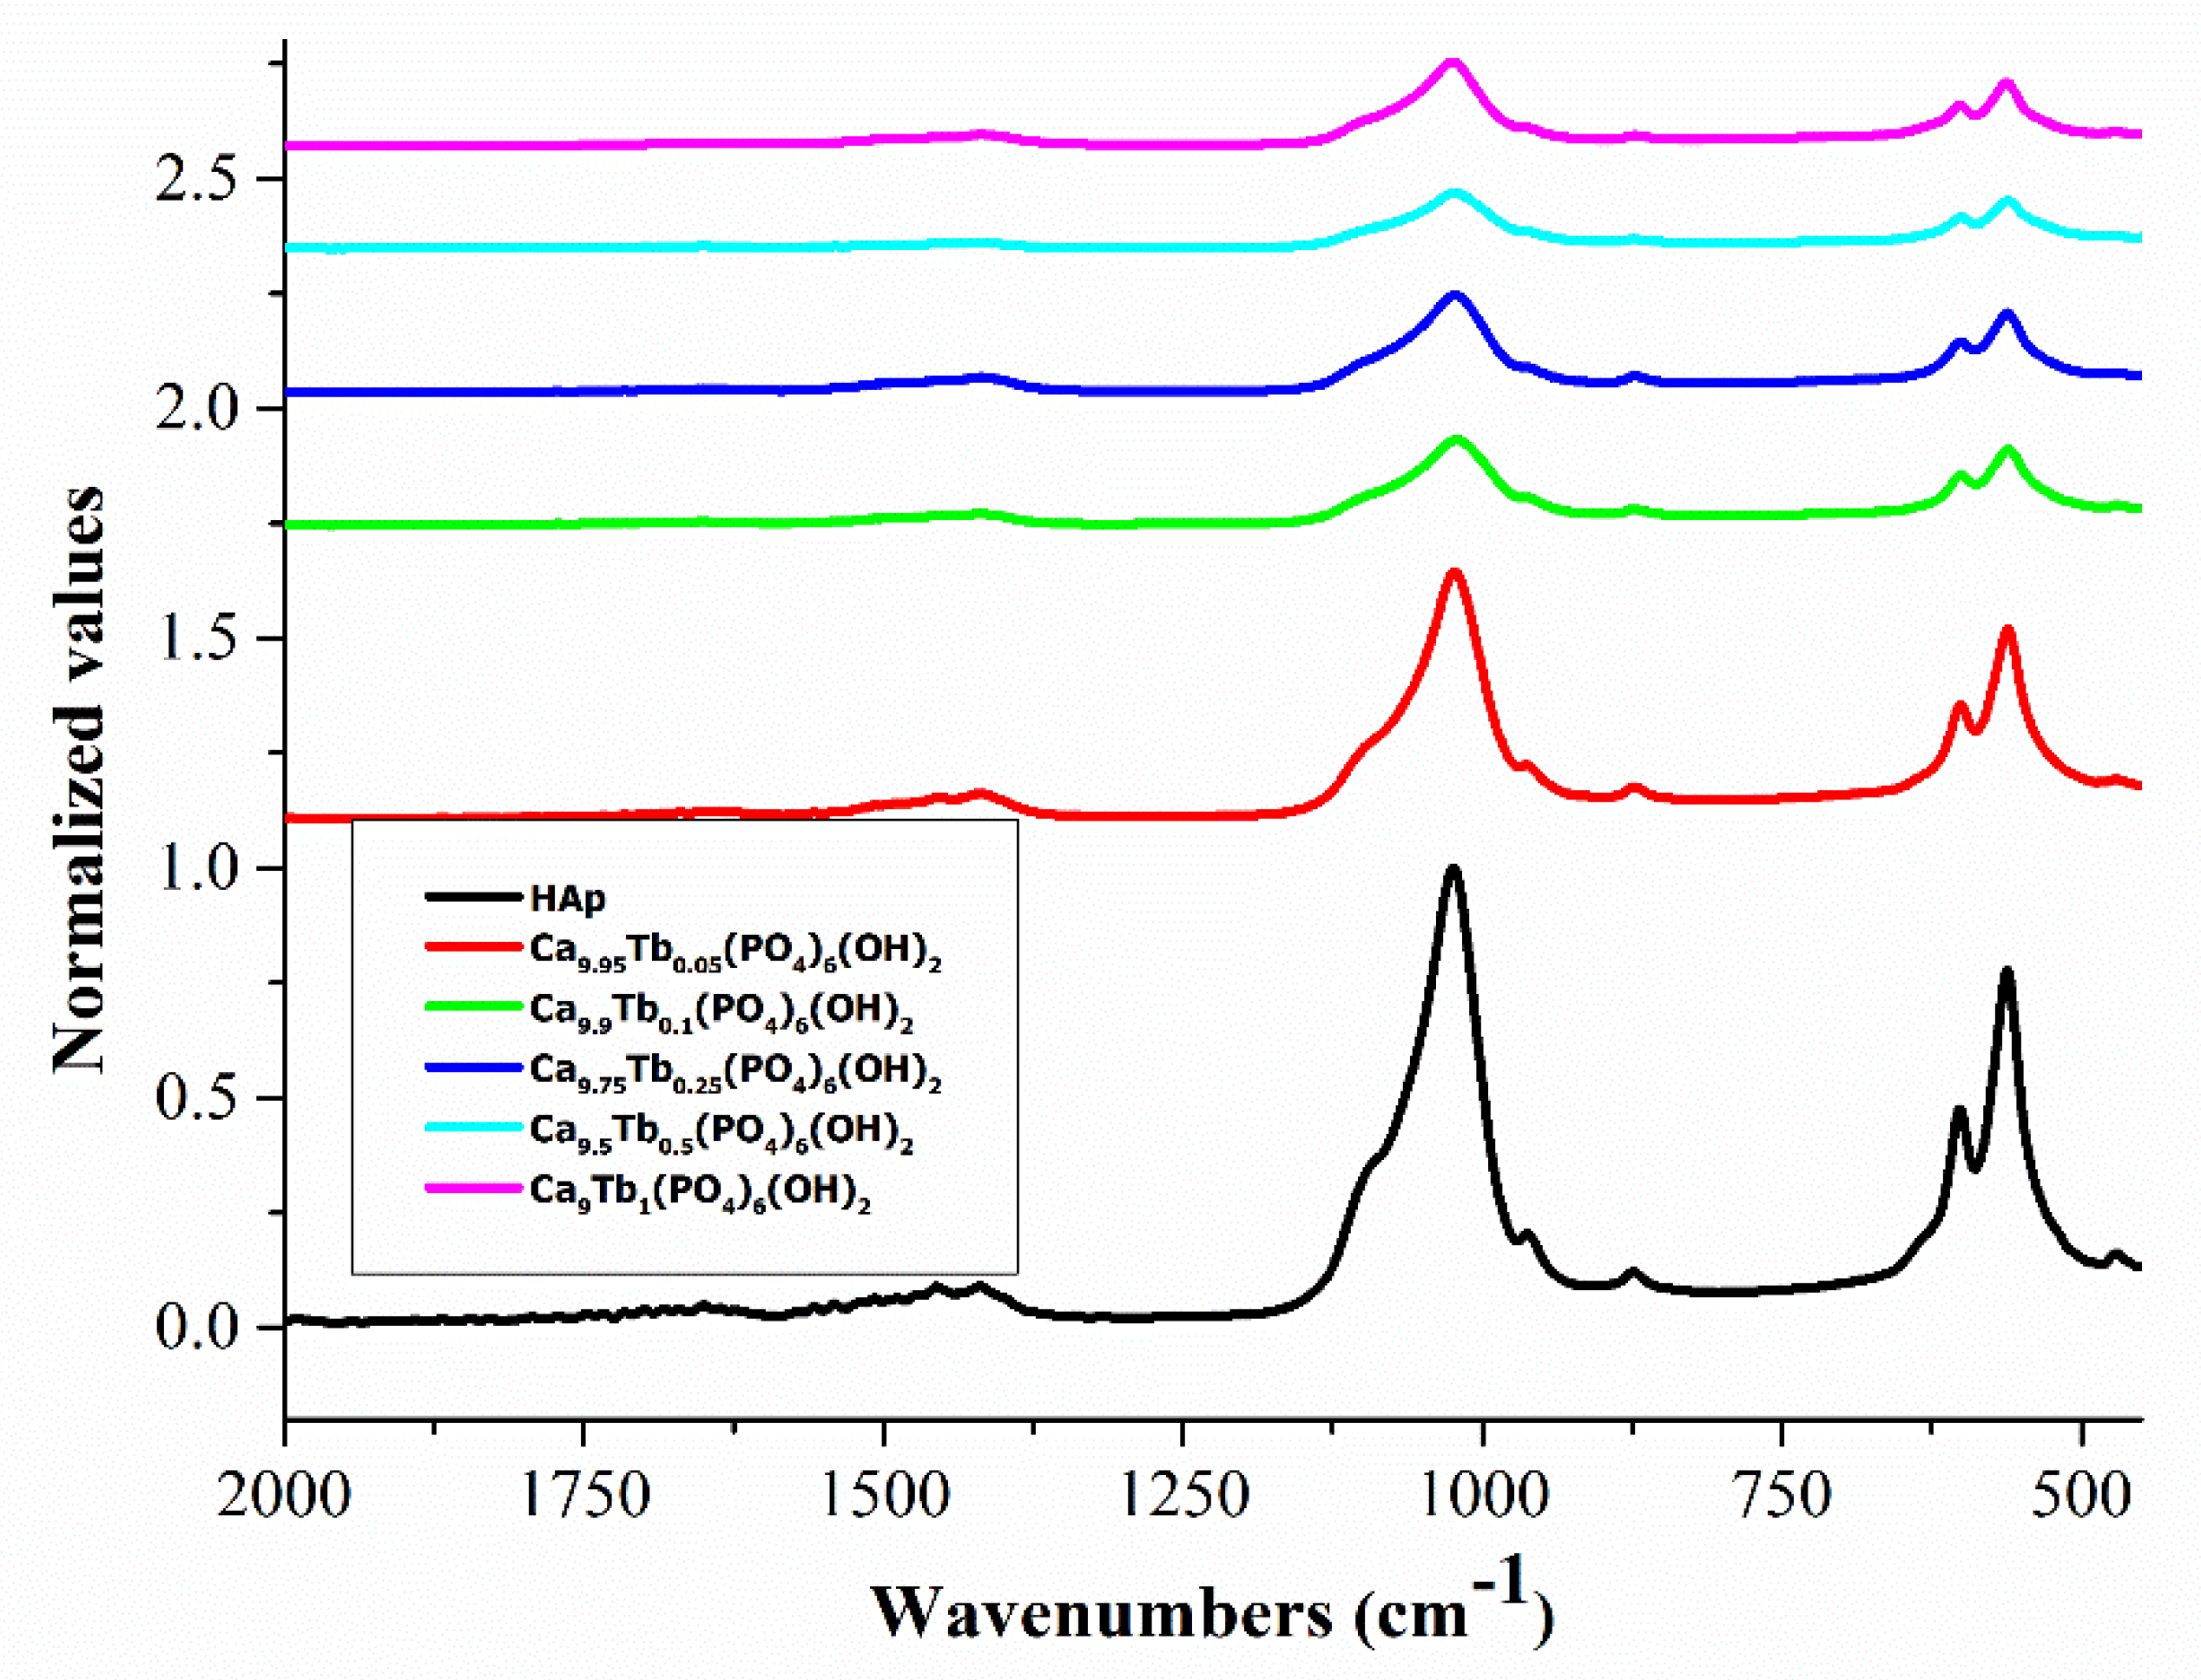
3.2. FTIR Analysis
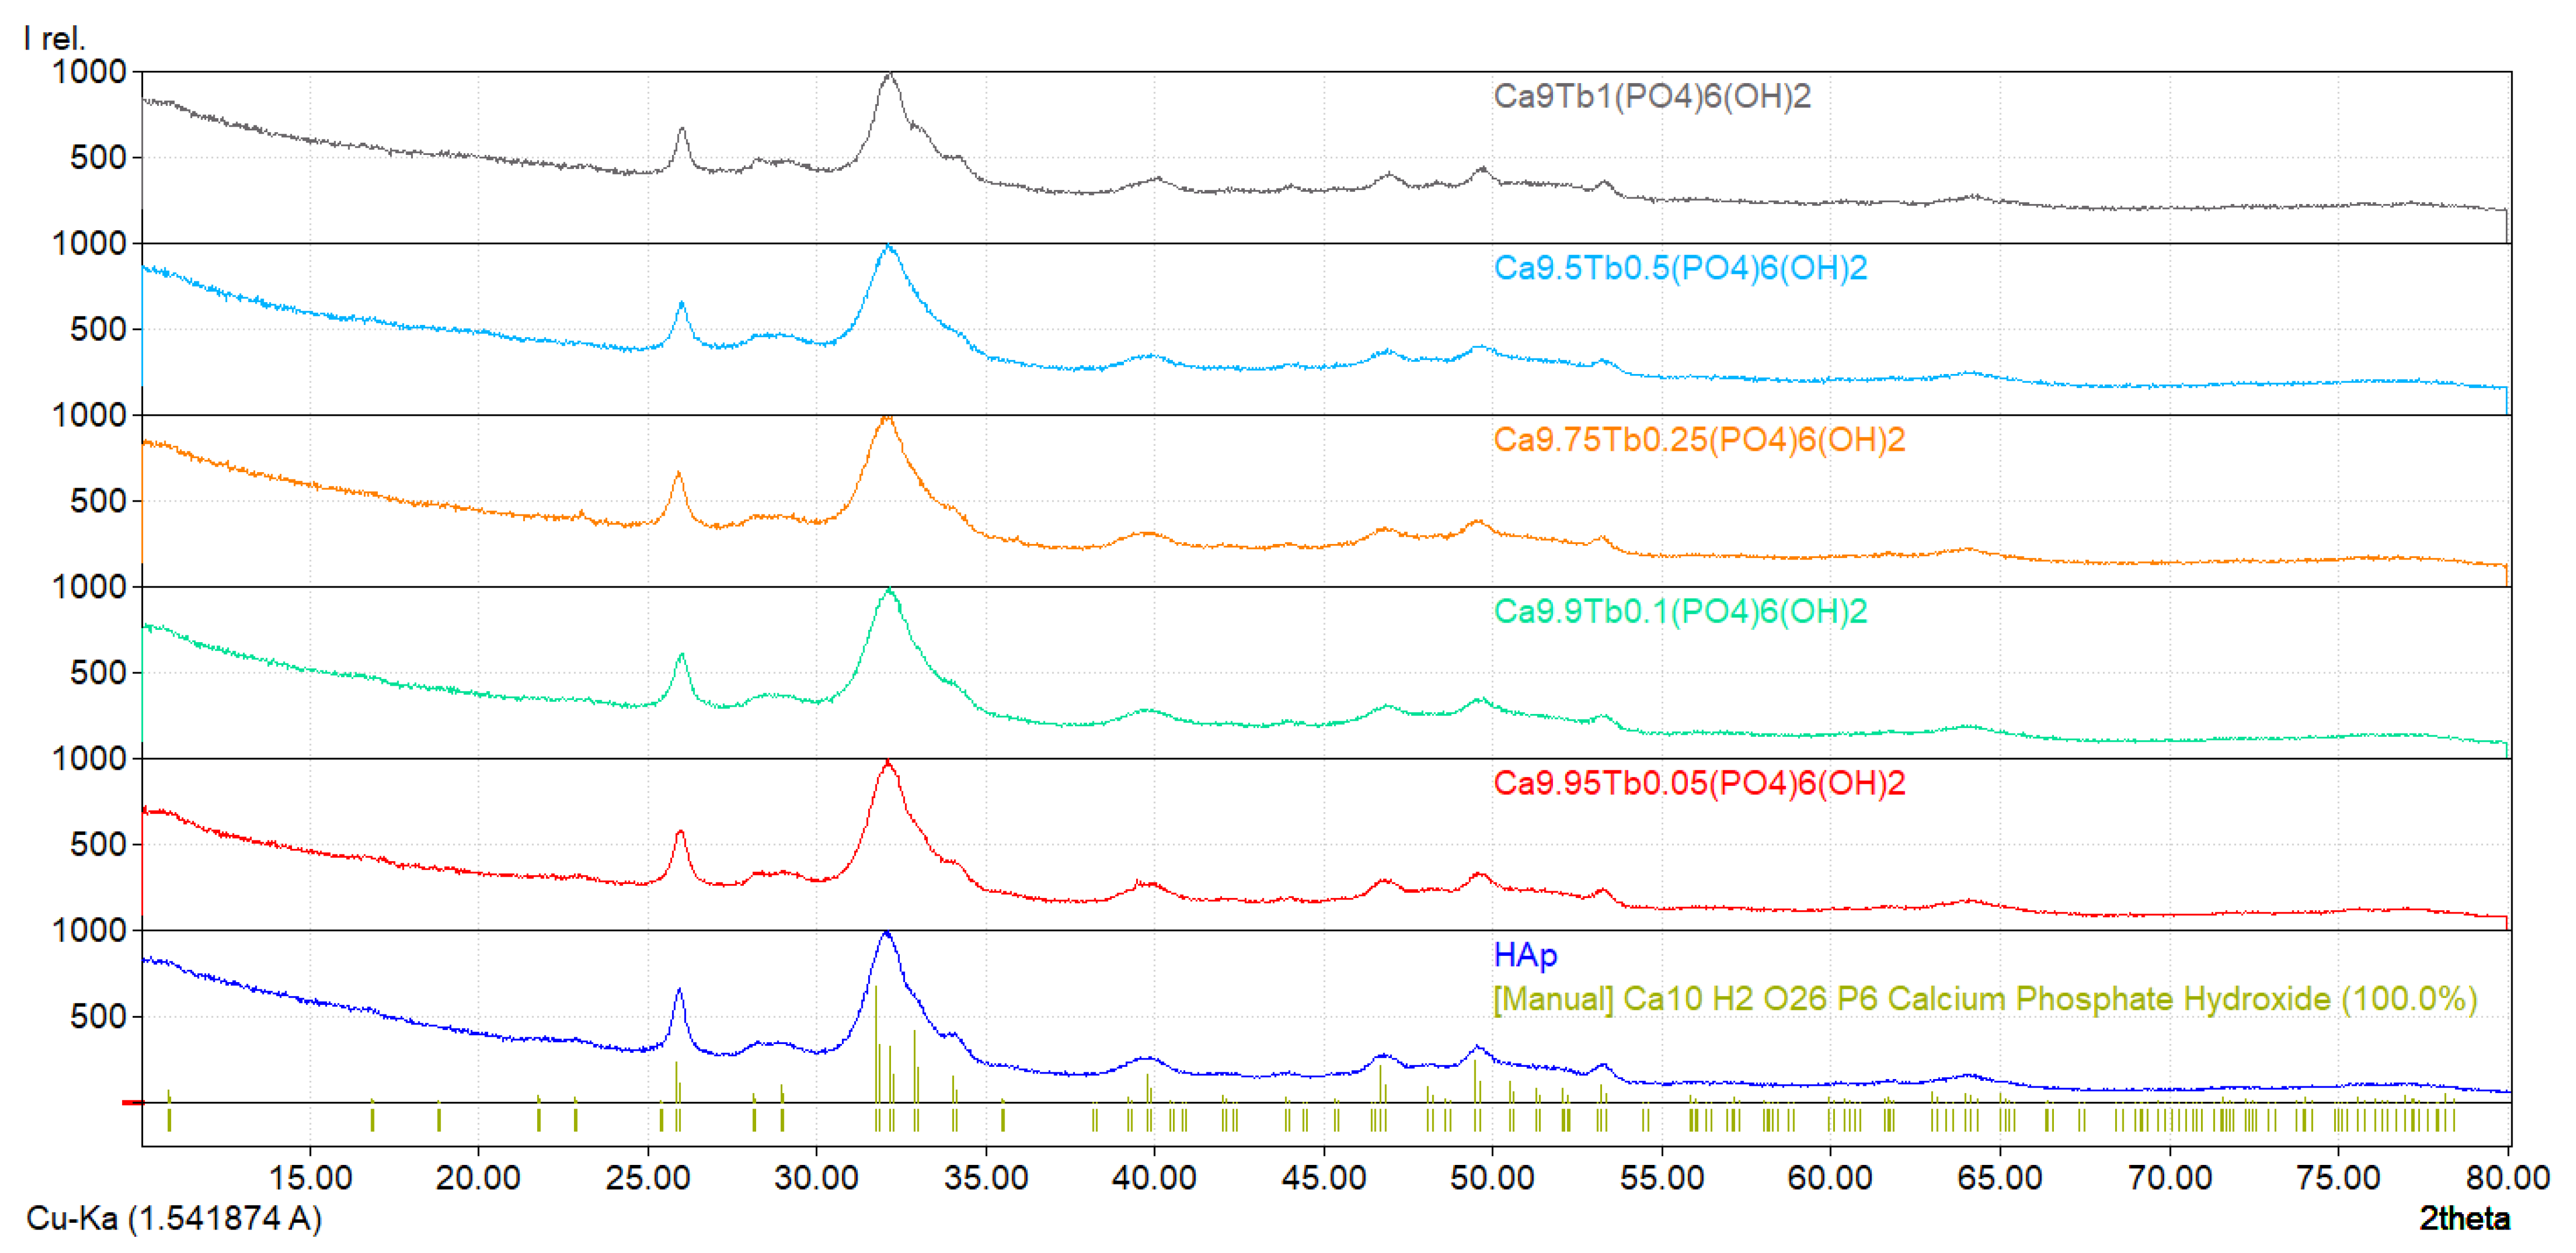
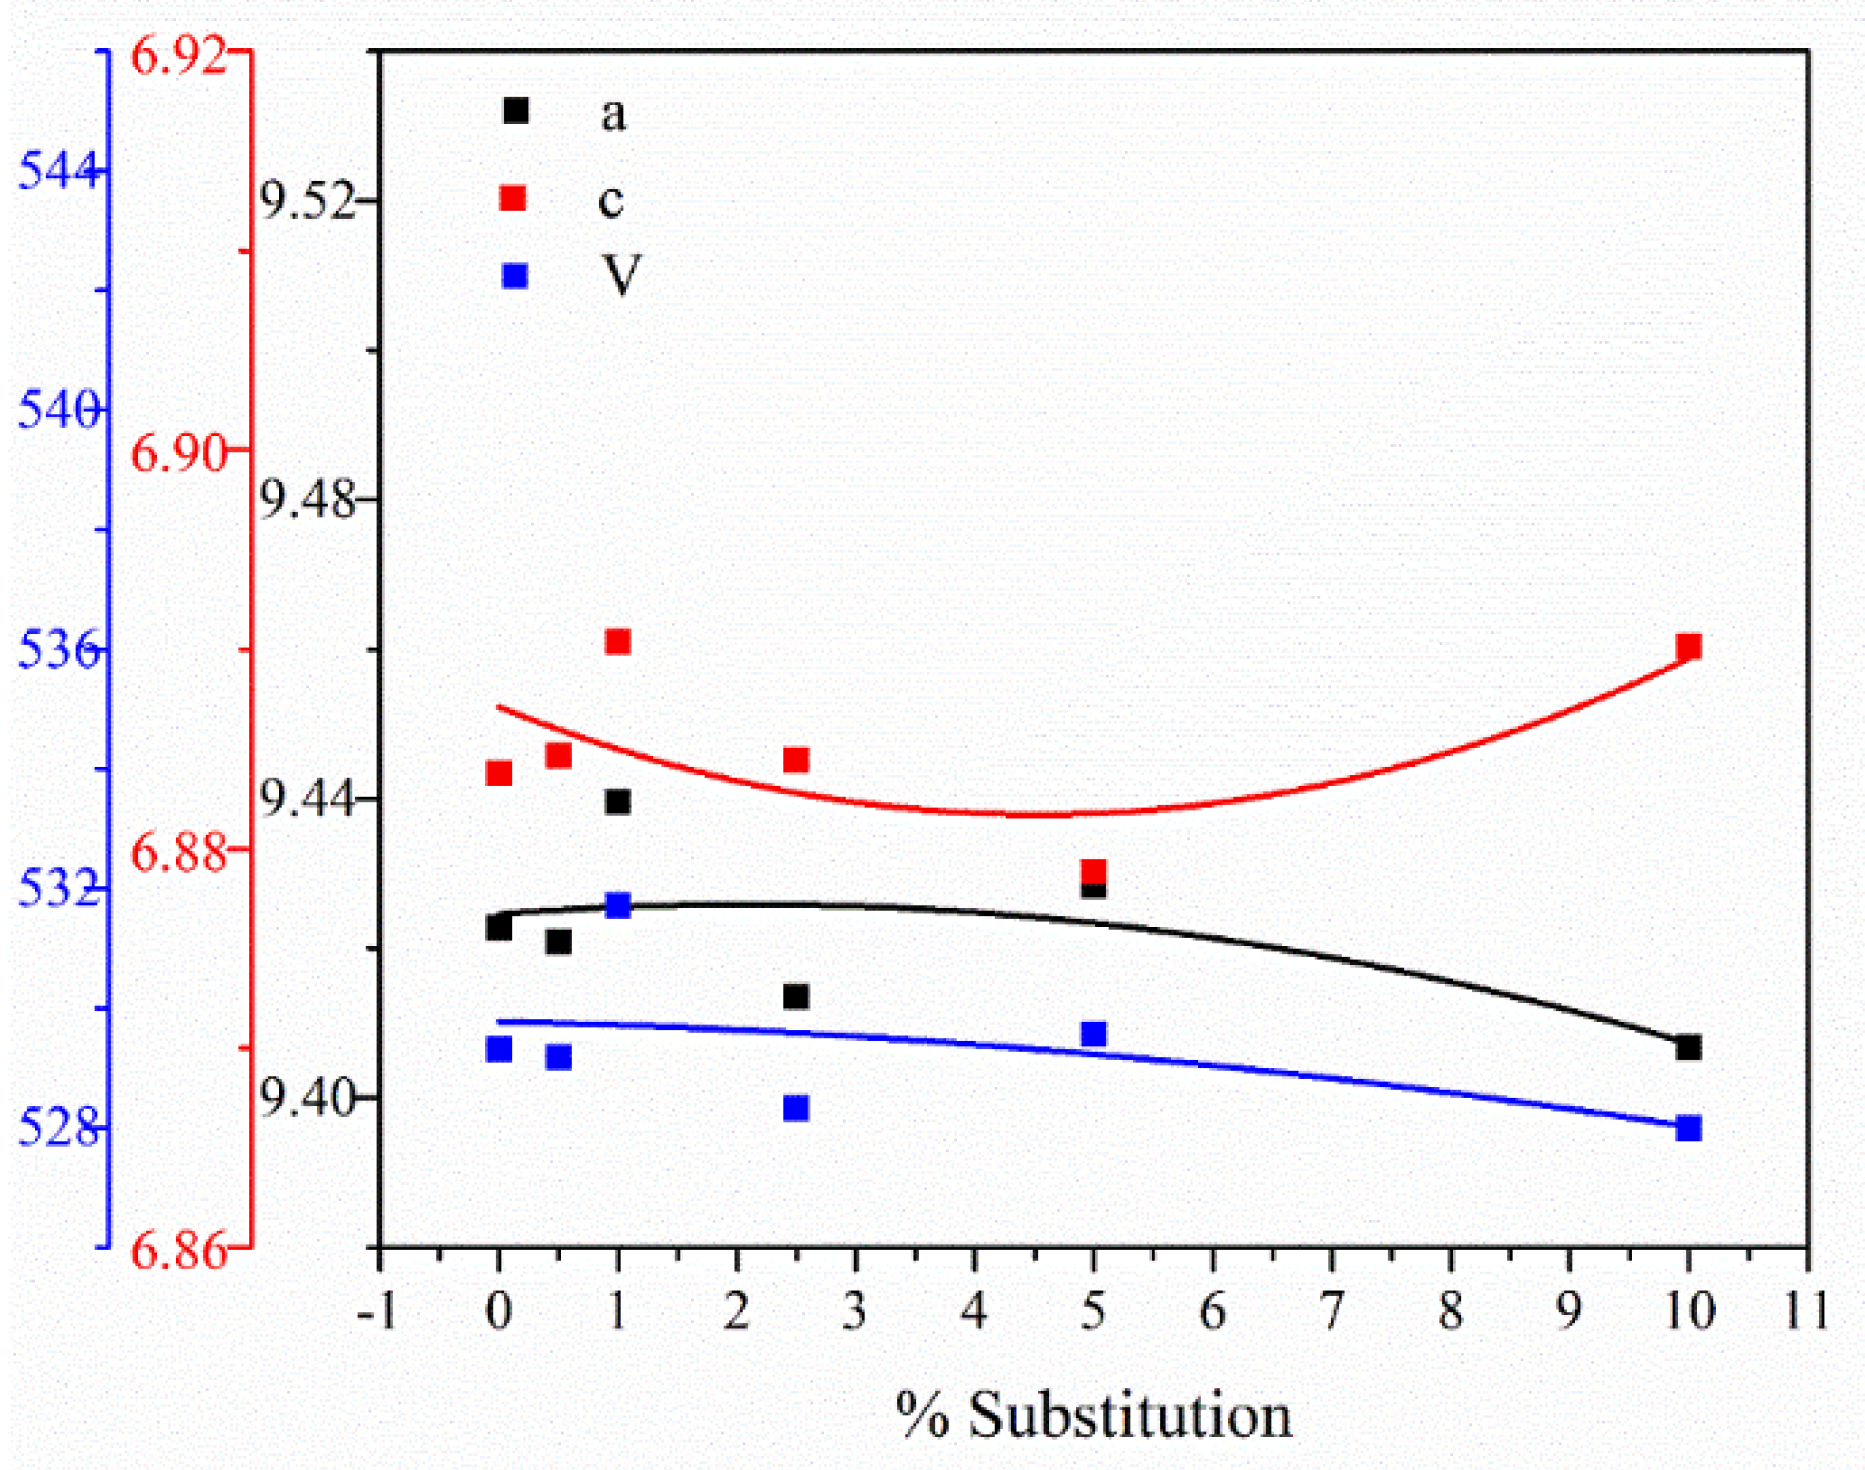
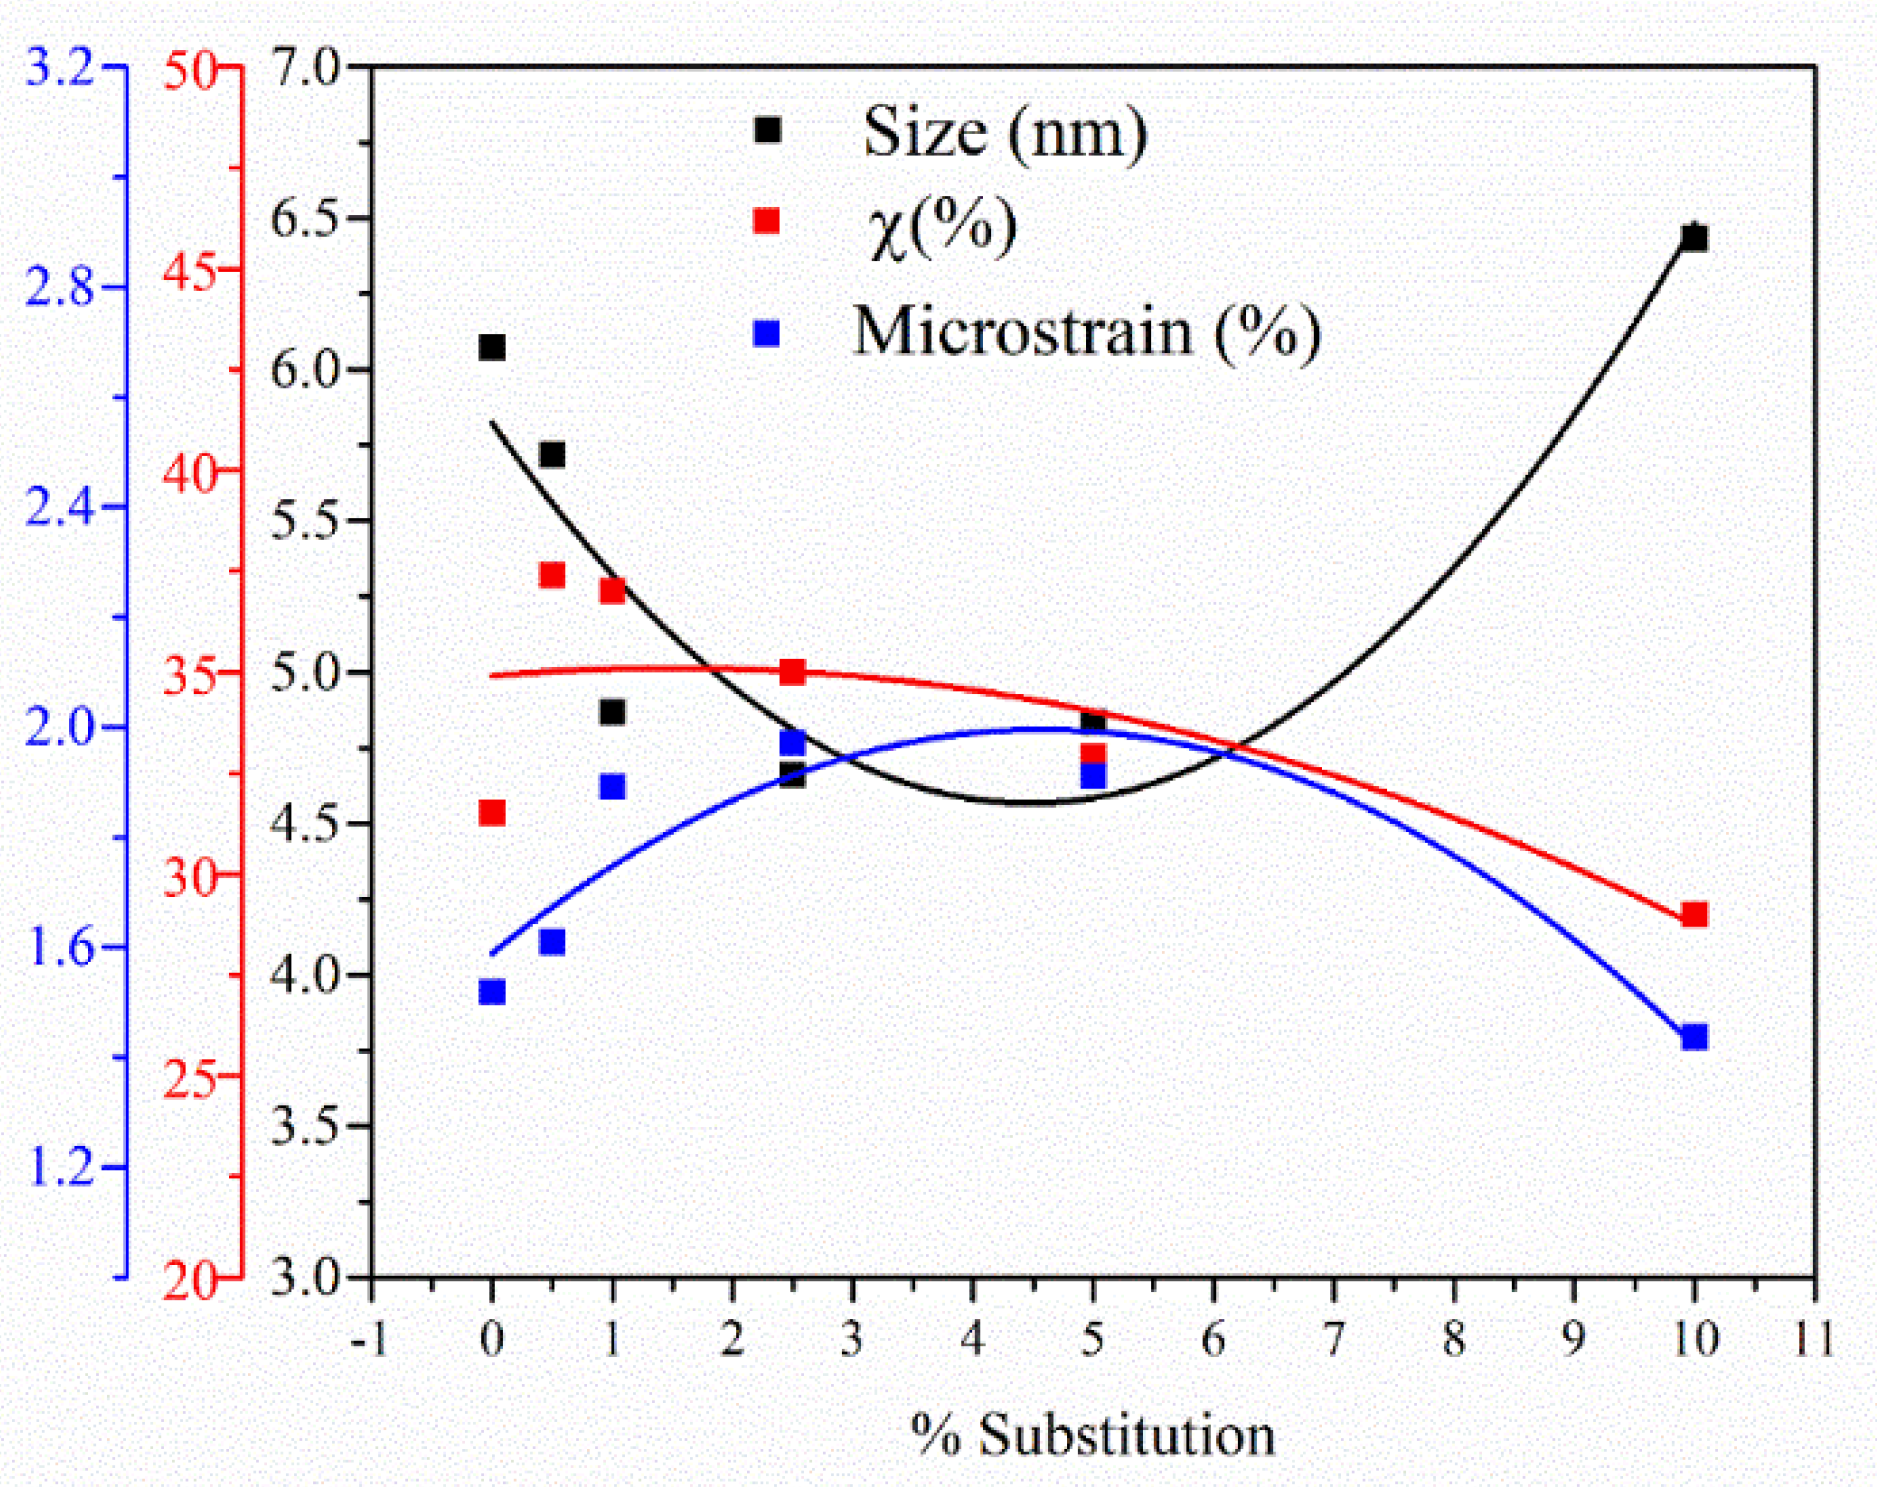
3.3. XRD Analysis
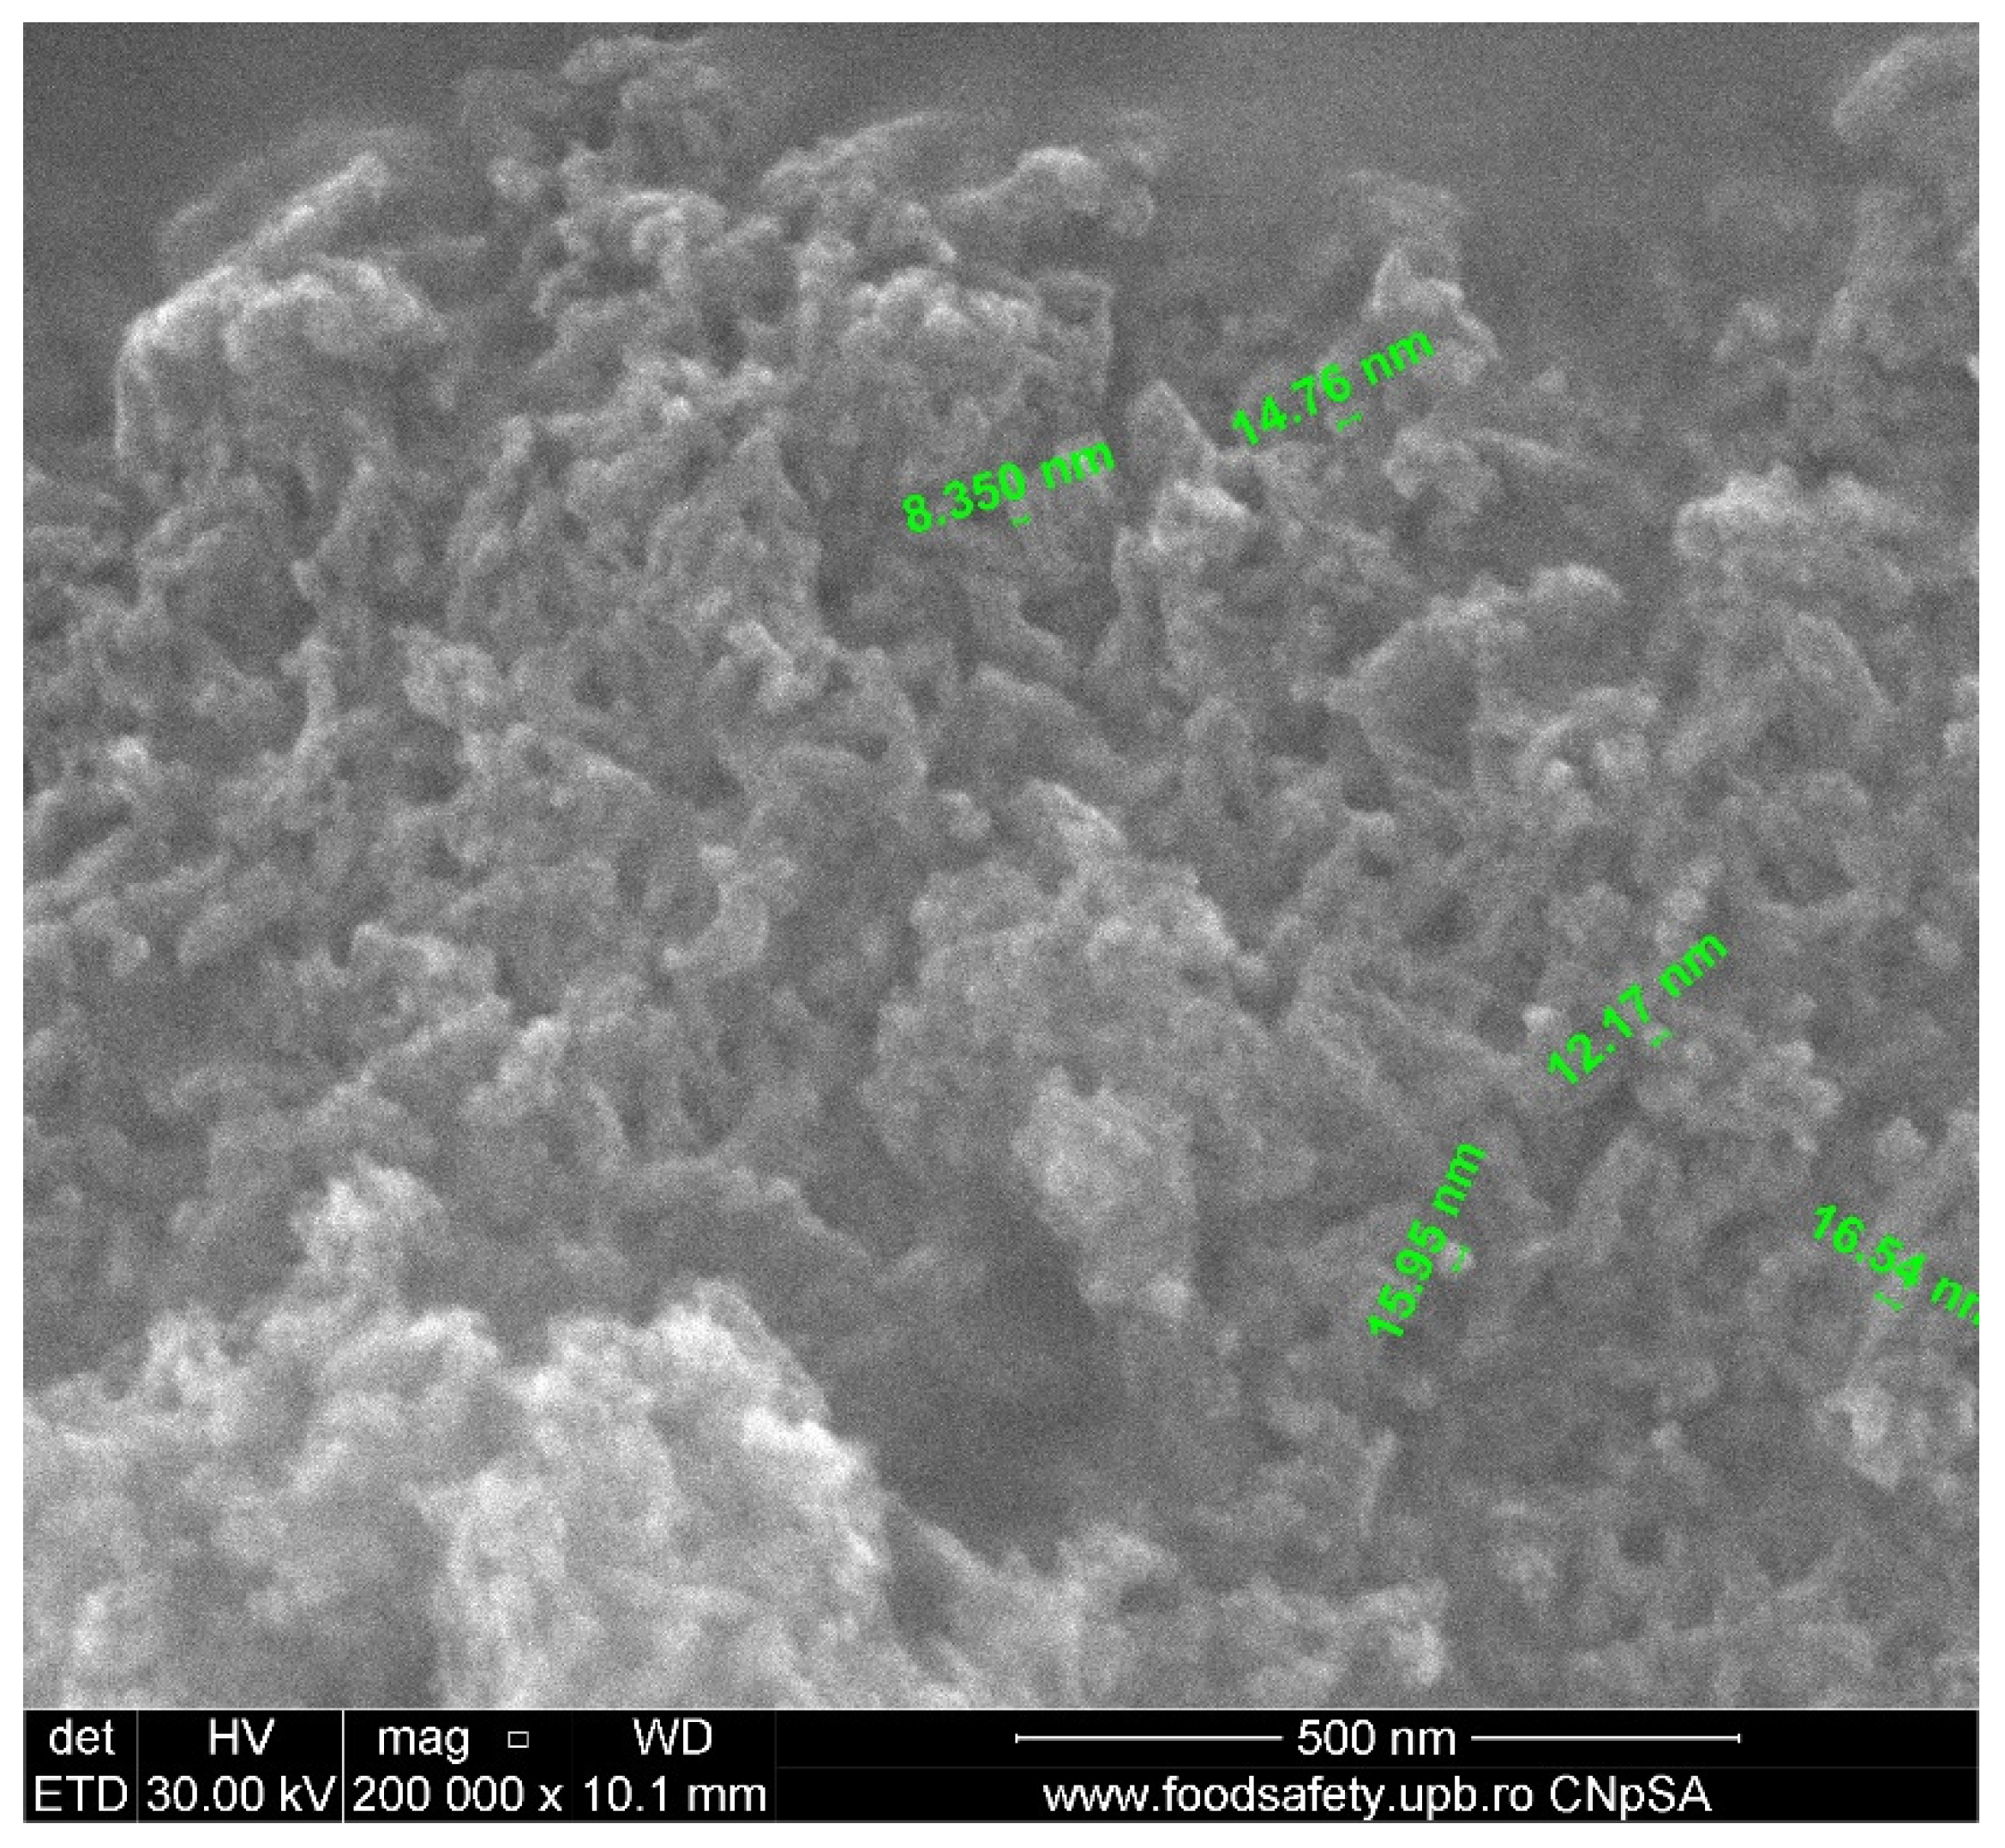
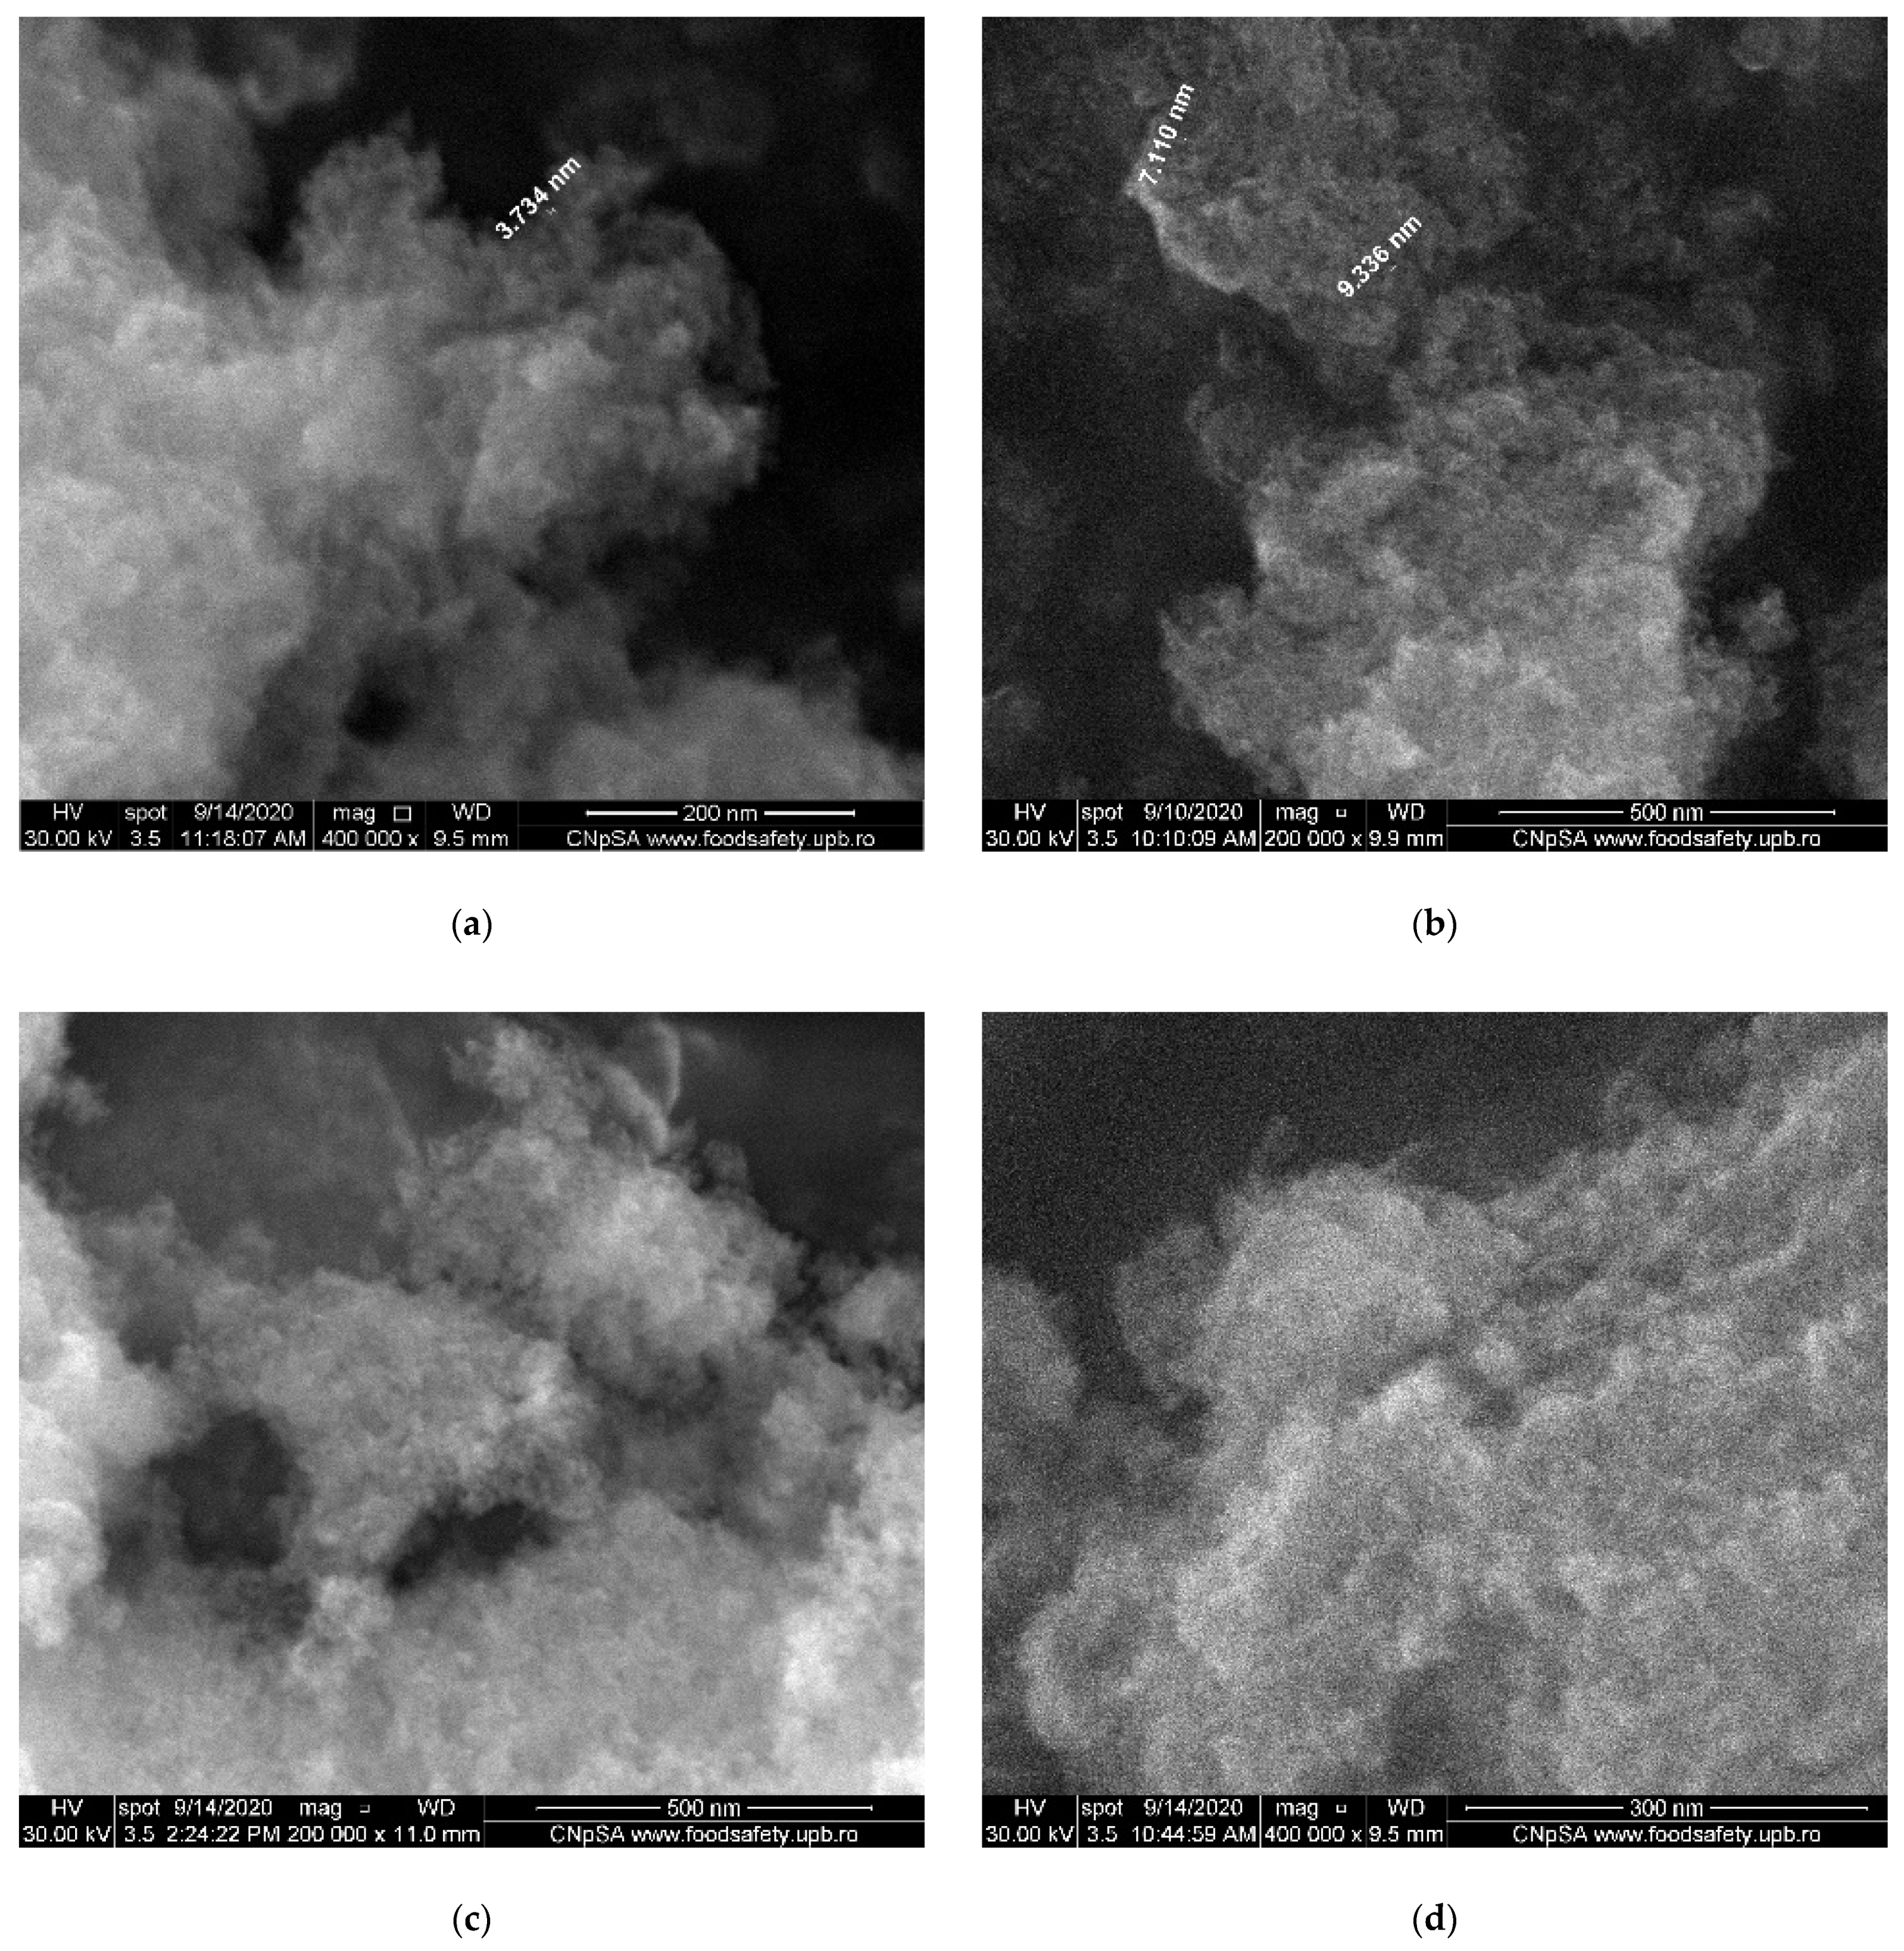
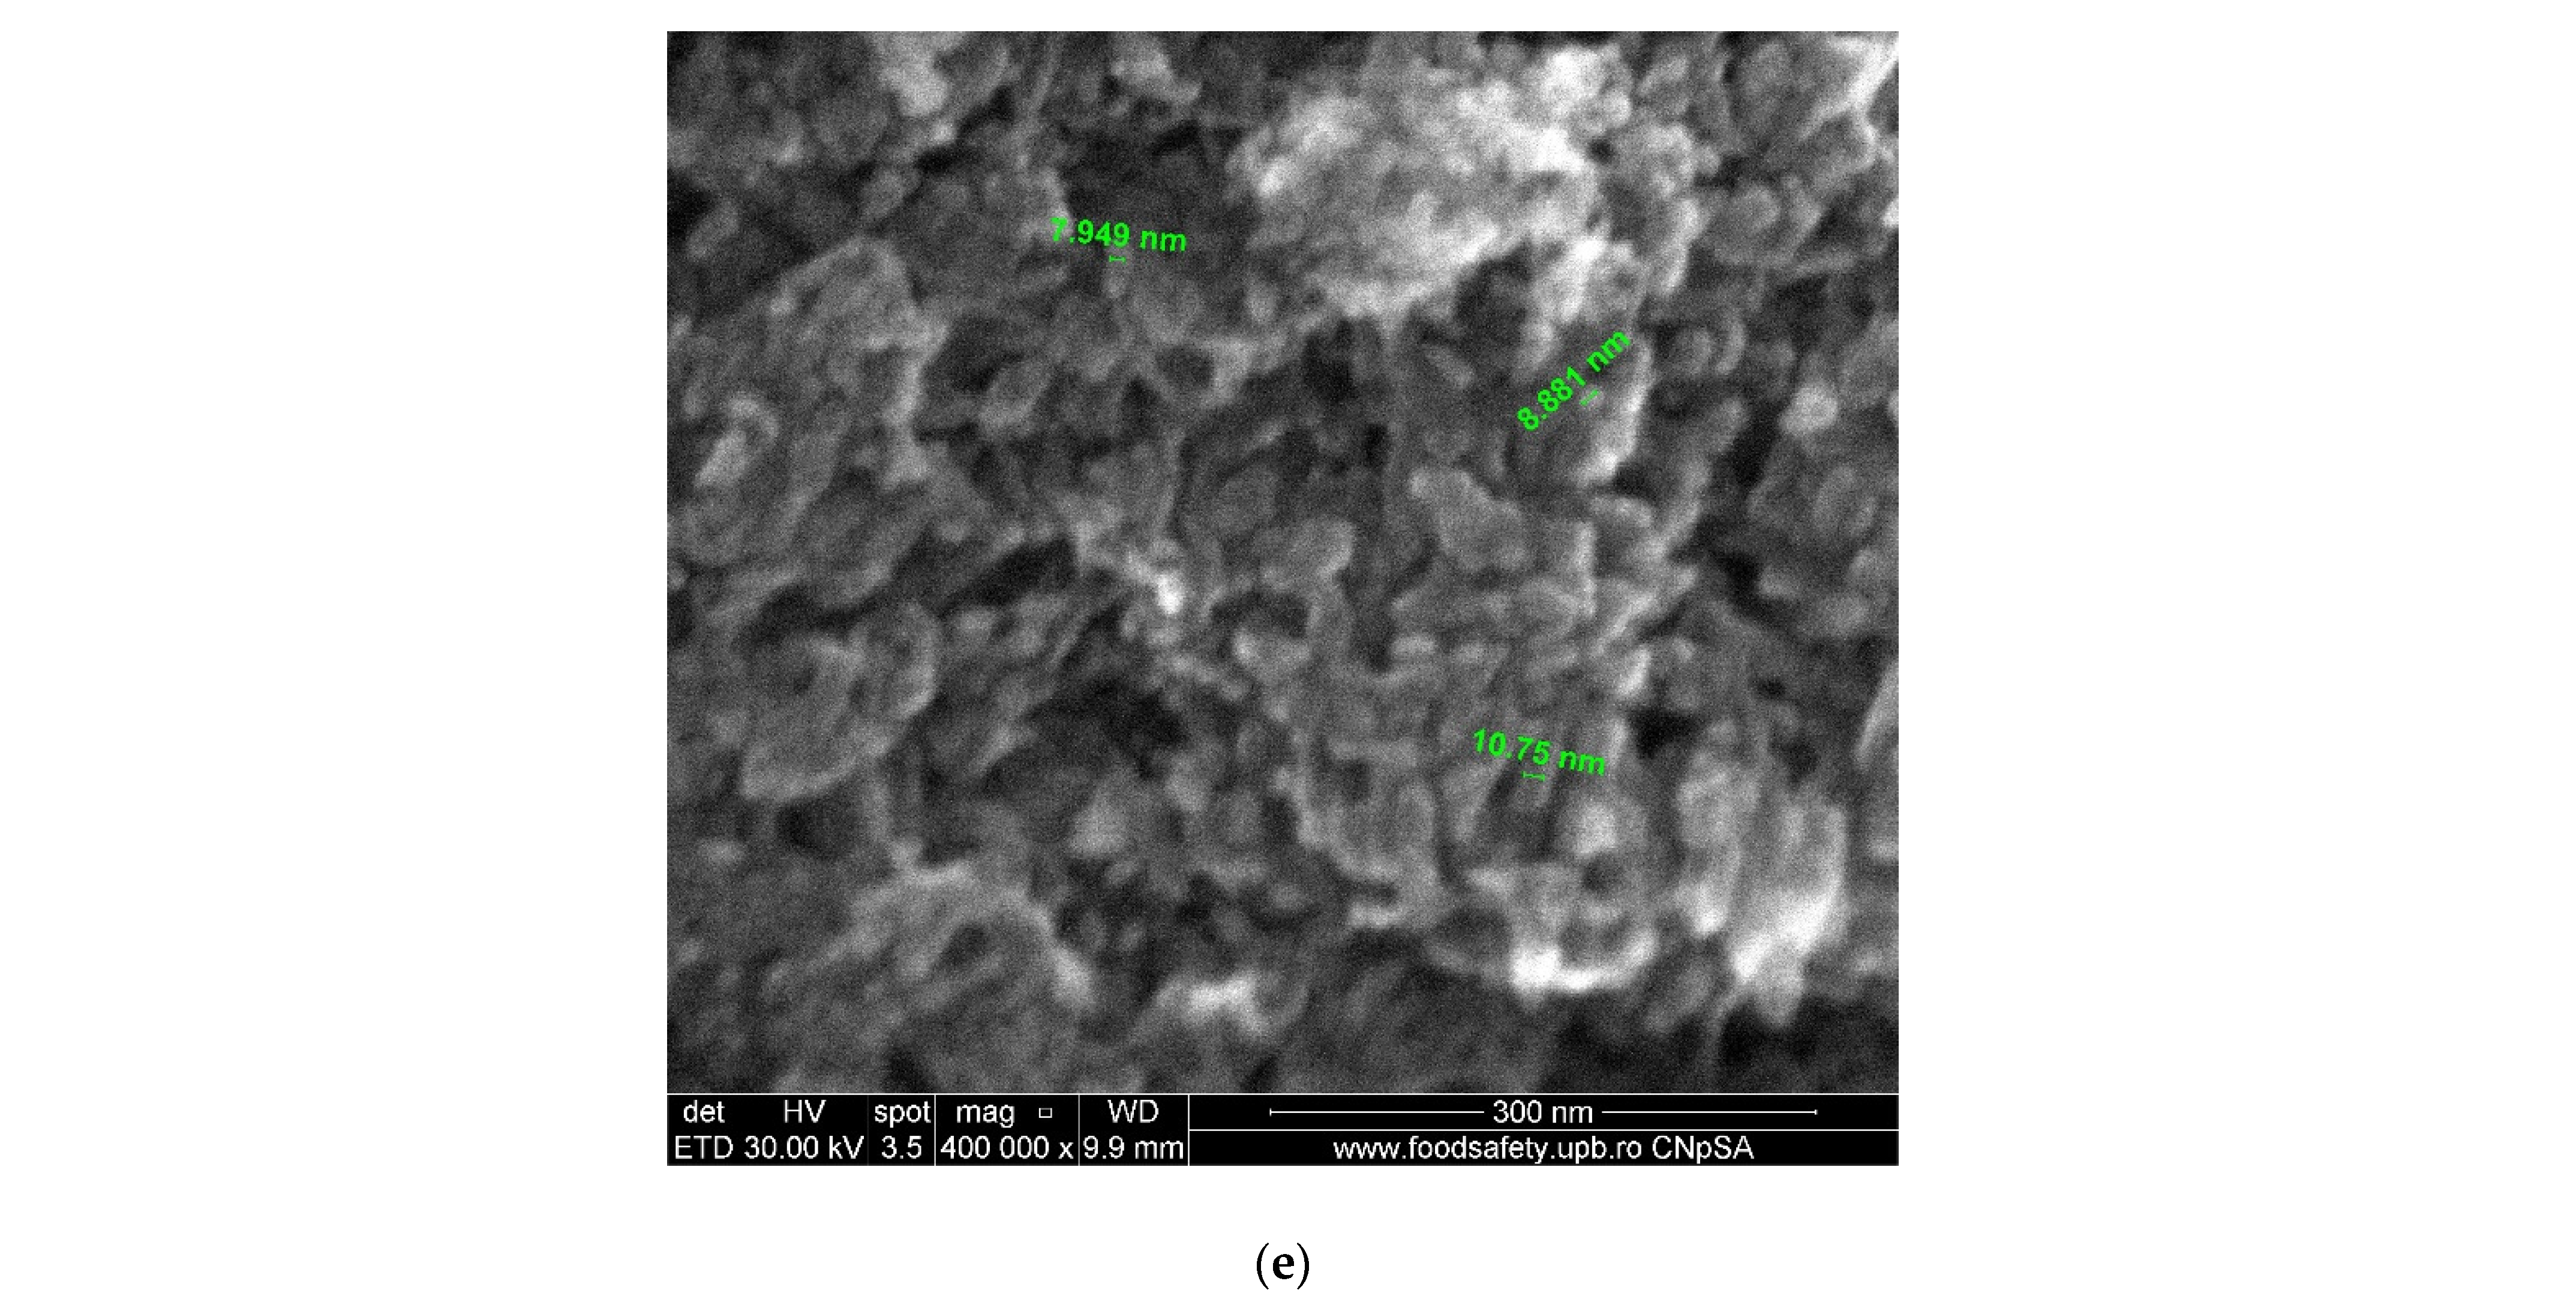
3.4. SEM Investigation
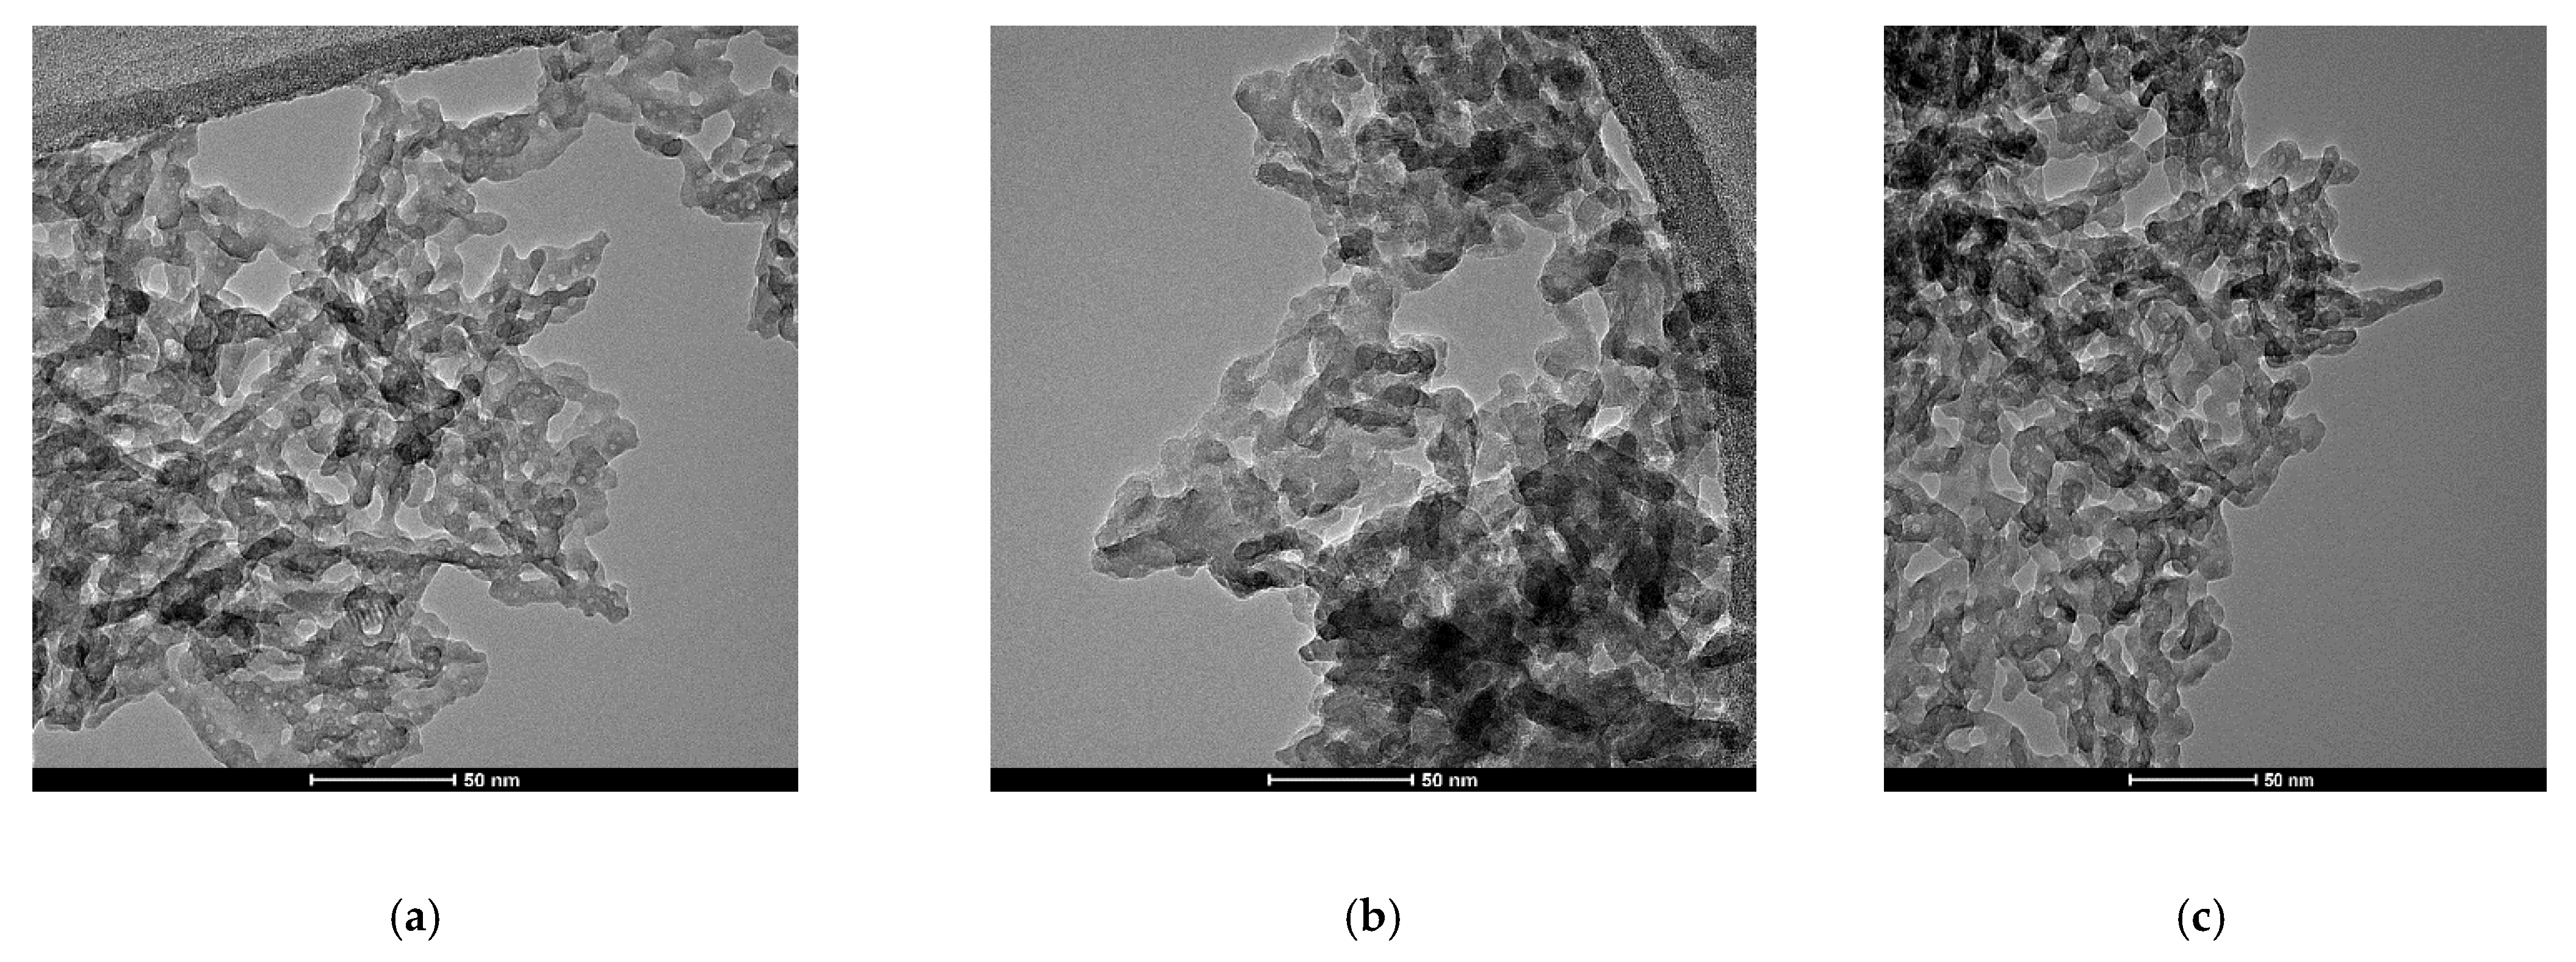
3.5. TEM Investigation
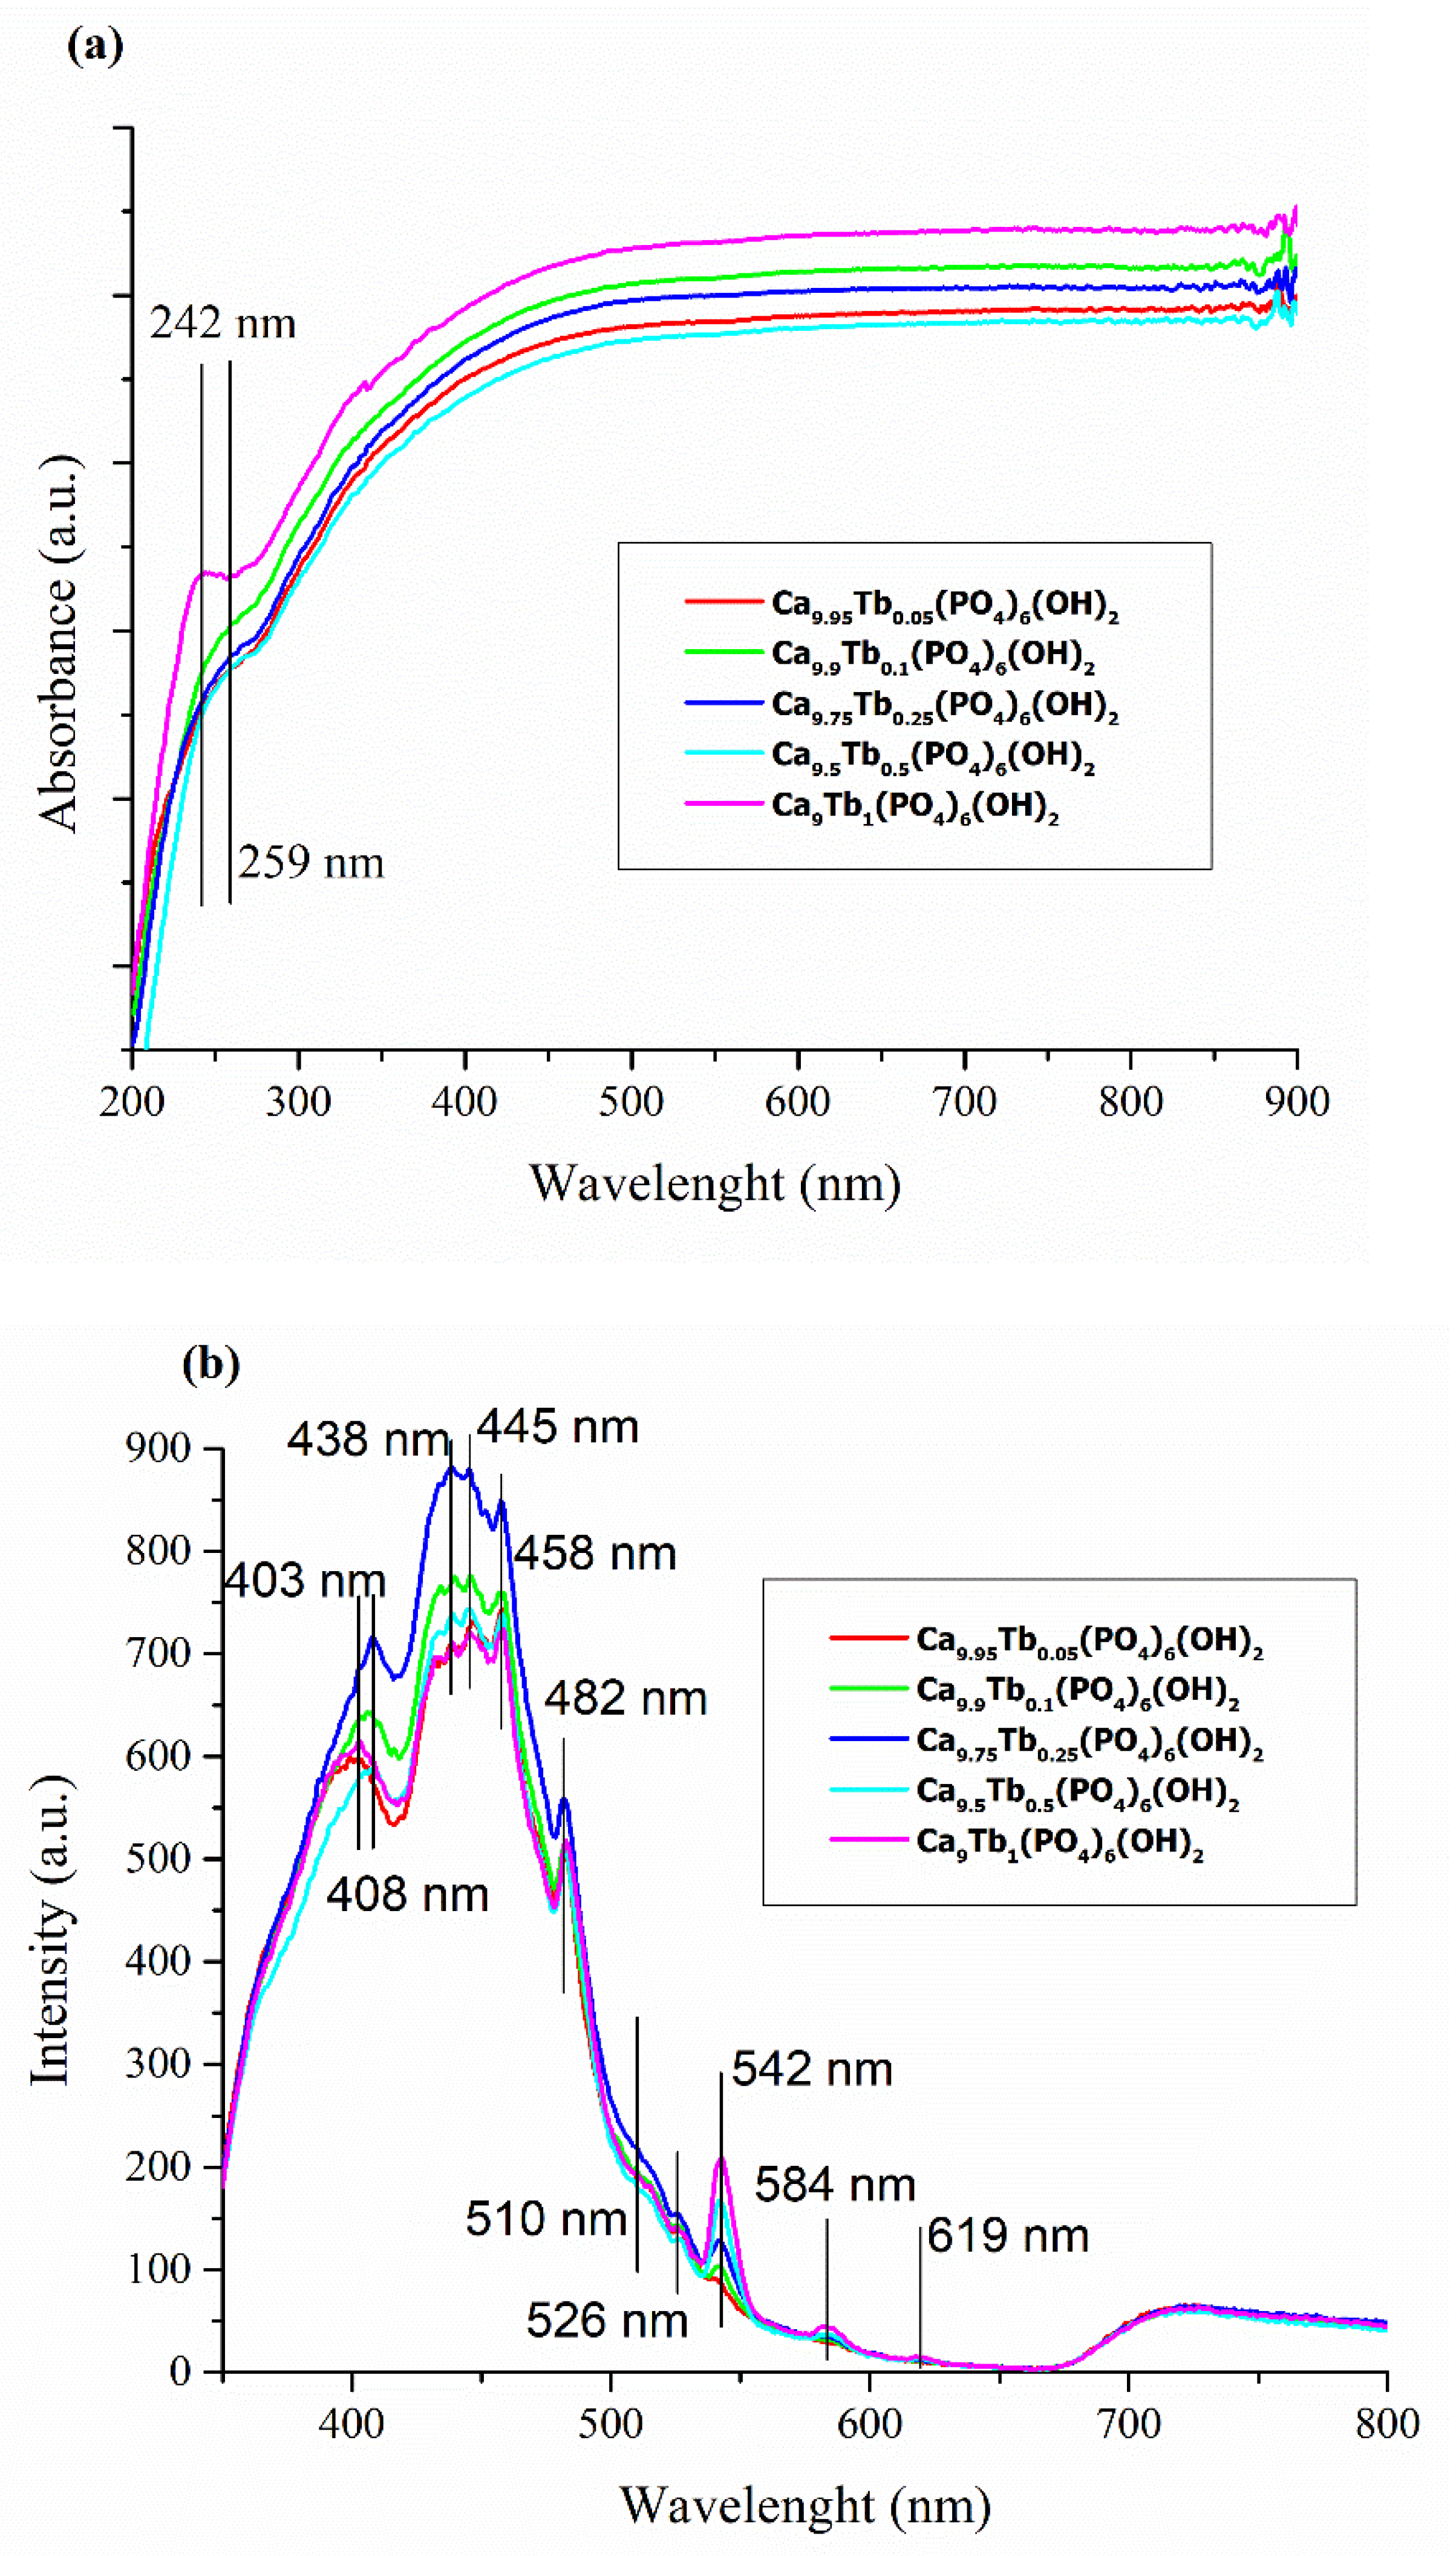
3.6. UV-Vis and PL Spectra
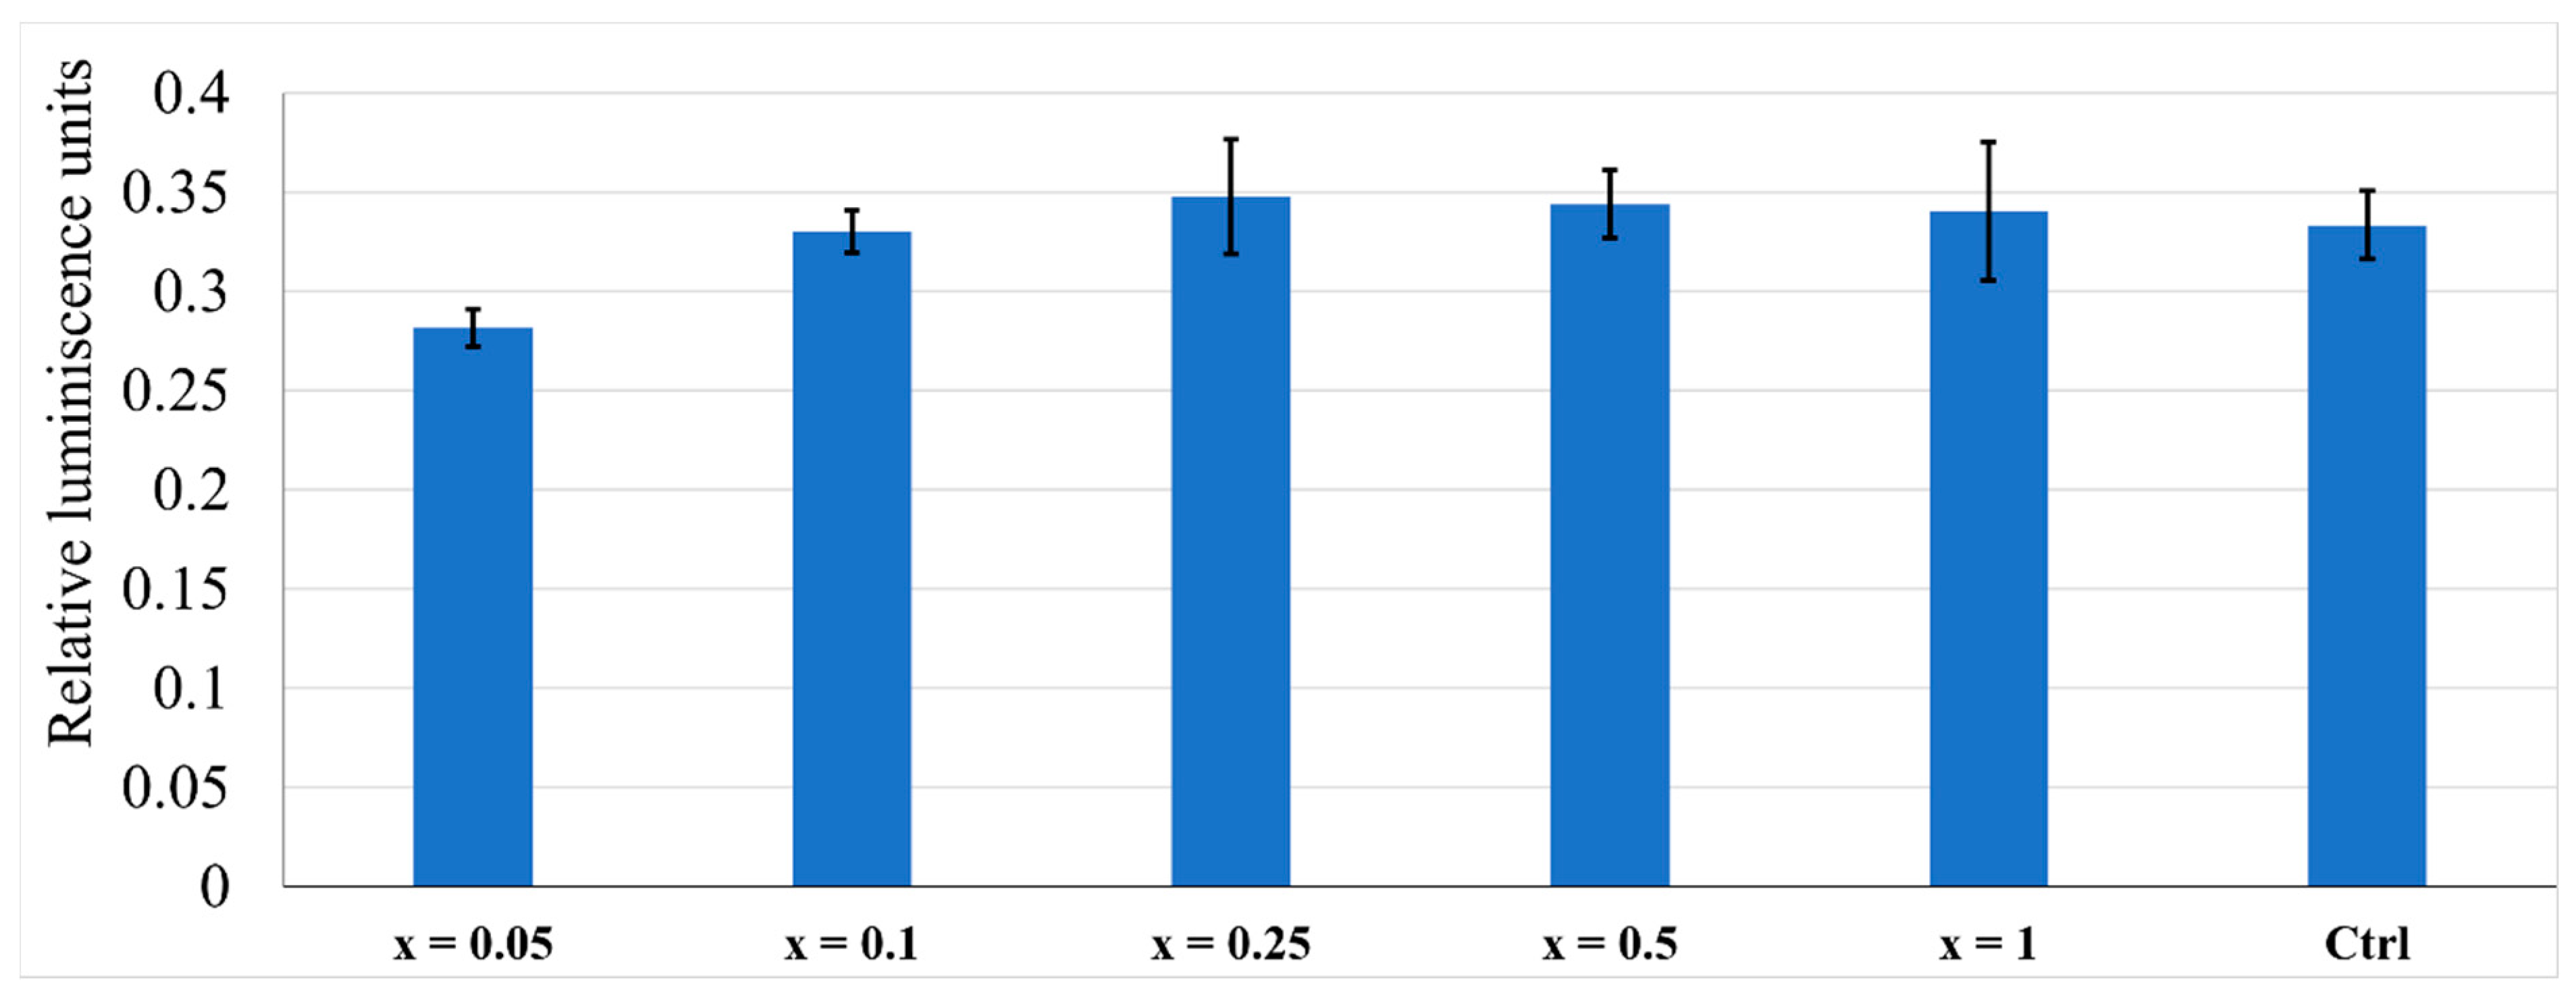
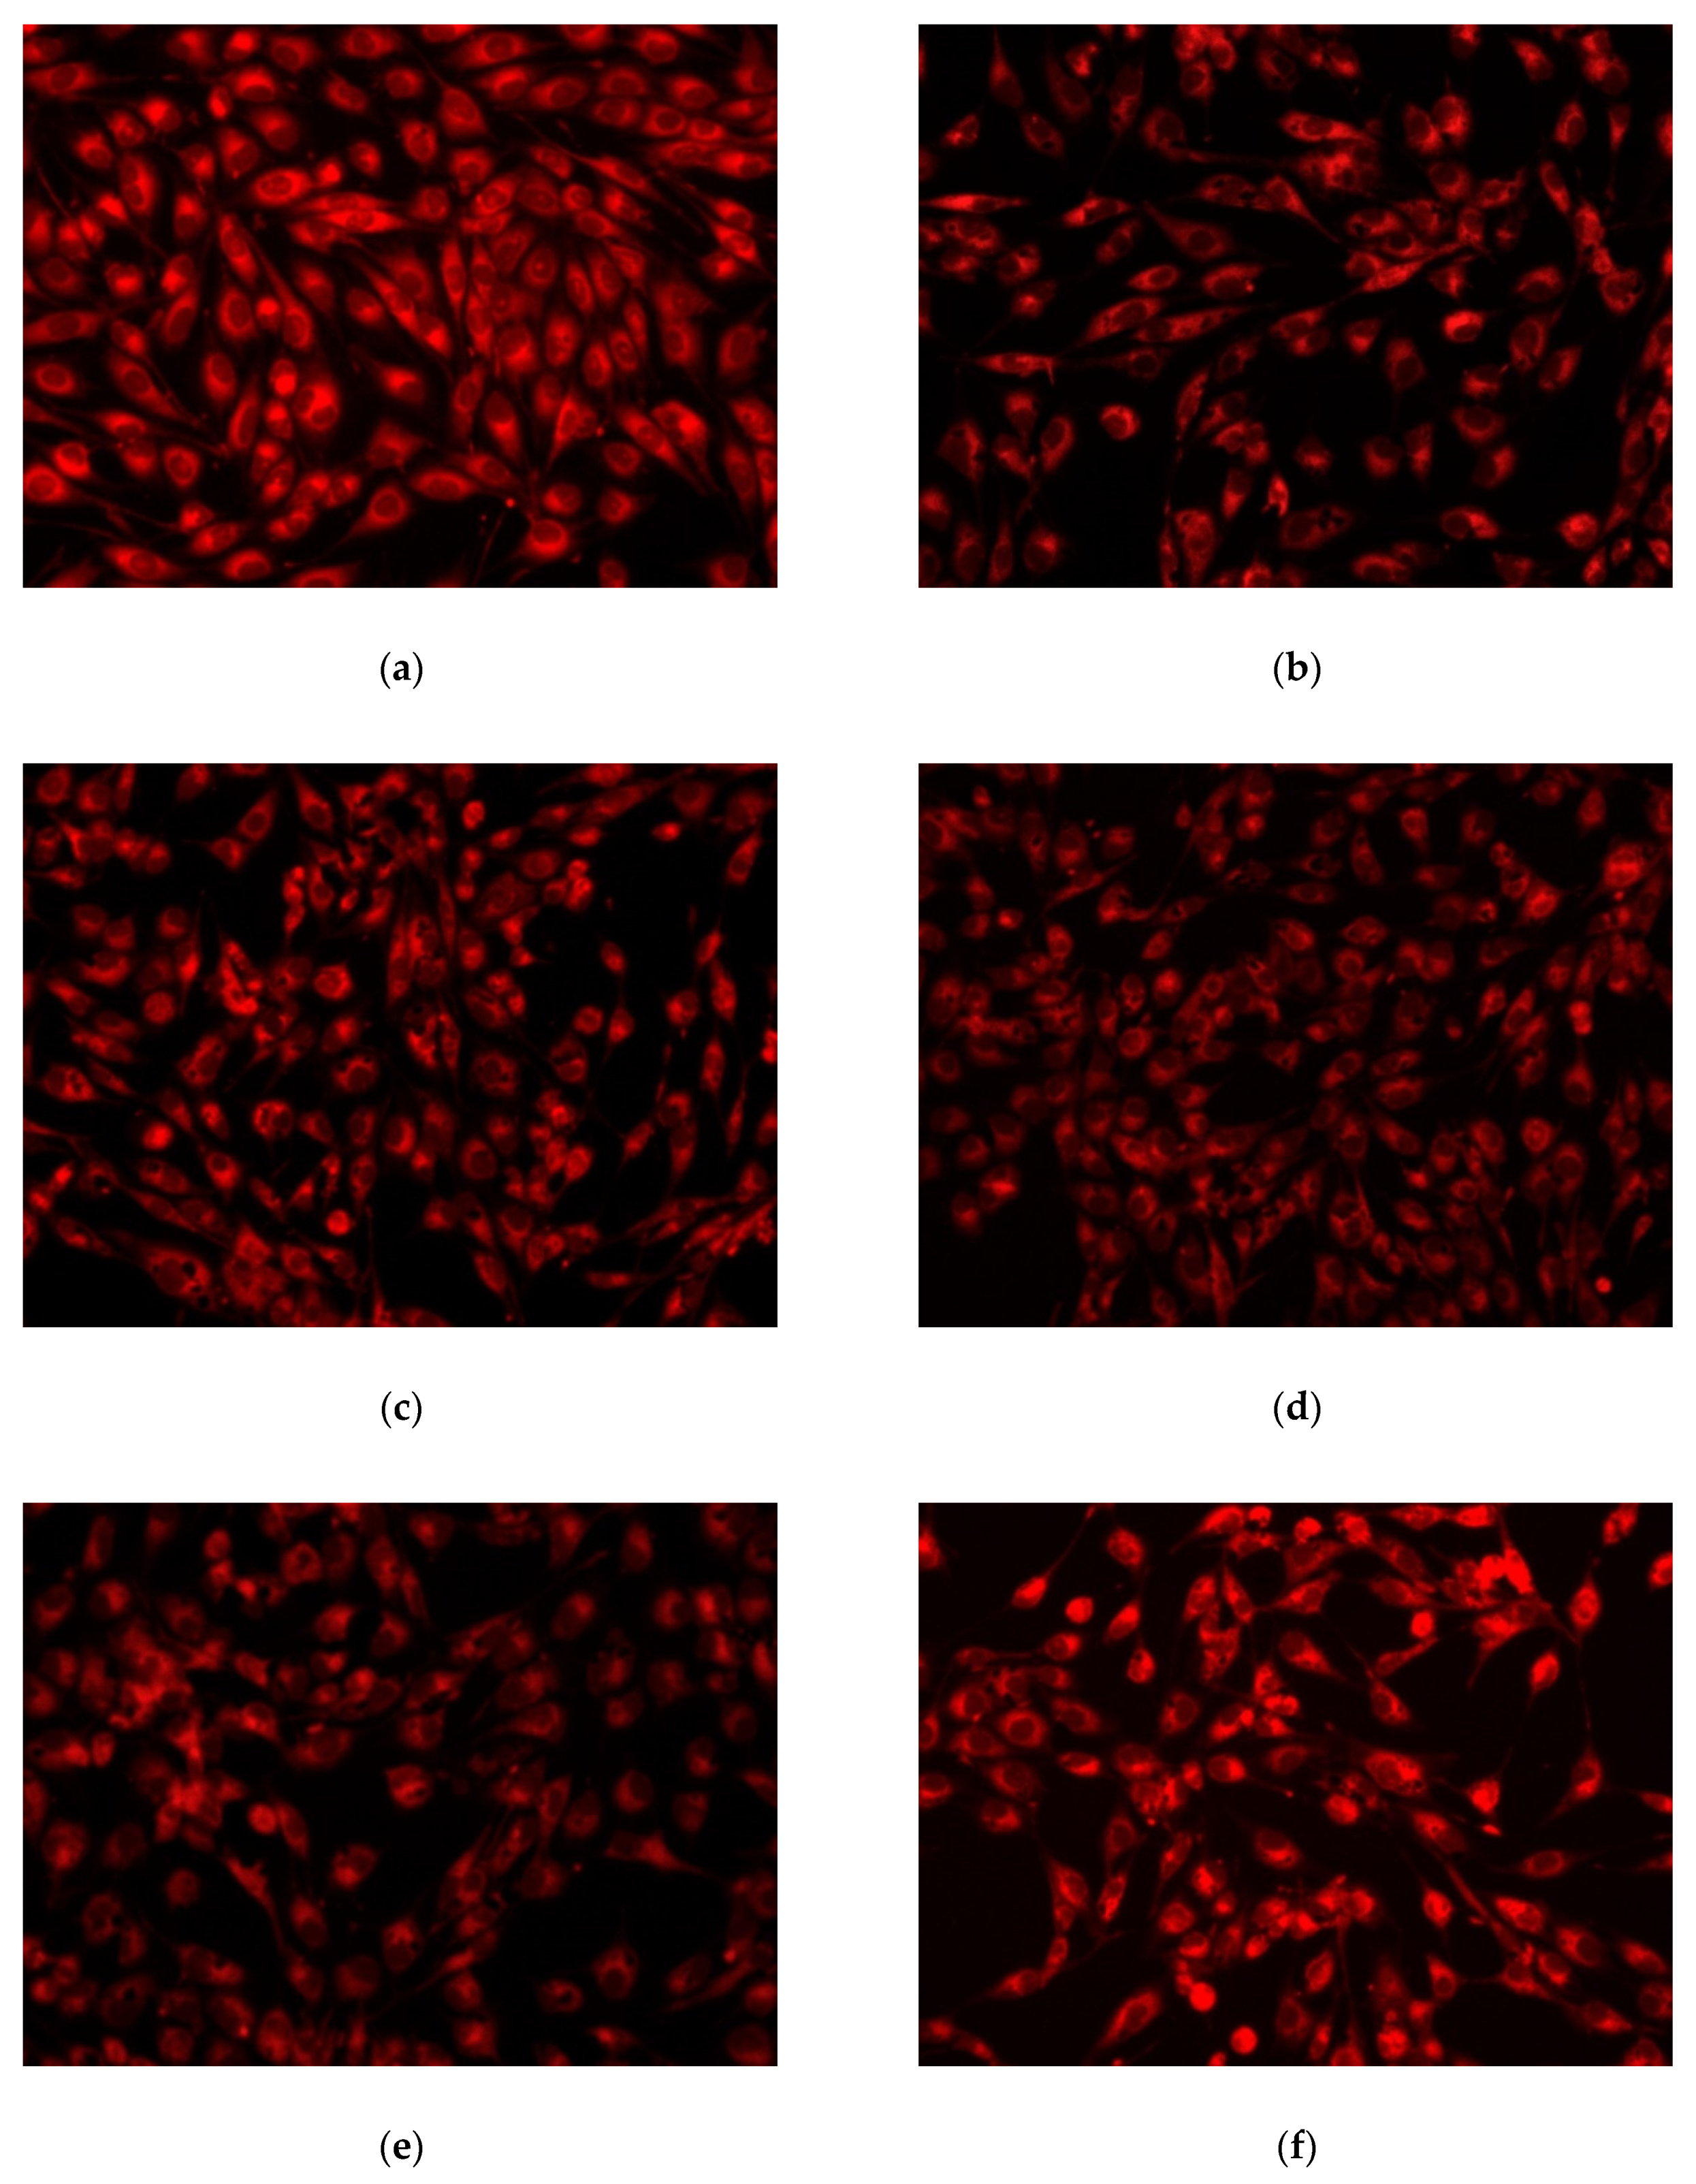
3.7. Cell Viability and Cytotoxicity Assessment by MTT Assay, GSH Assay and Fluorescence Microscopy
4. Conclusions
Author Contributions
Funding
Acknowledgments
Conflicts of Interest
References
- Akinfieva, O.; Nabiev, I.; Sukhanova, A. New directions in quantumdot-based cytometry detection of cancer se-rummarkers and tumor cells. Crit. Rev. Oncol./Hematol. 2013, 86, 1–14. [Google Scholar] [CrossRef]
- Manoharan, M. Research on the frontiers of materials science: The impact of nanotechnology on new material devel-opment. Technol. Soc. 2008, 30, 401–404. [Google Scholar] [CrossRef]
- Oryan, A.; Alidadi, S.; Moshiri, A.; Maffulli, N. Bone regenerative medicine: Classic options, novel strategies, and future directions. J. Orthop. Surg. Res. 2014, 9, 18. [Google Scholar] [CrossRef] [Green Version]
- Dasgupta, S.; Banerjee, S.; Bandyopadhyay, A.; Bose, S. Zn- and Mg-Doped Hydroxyapatite Nanoparticles for Controlled Release of Protein. Langmuir 2010, 26, 4958–4964. [Google Scholar] [CrossRef] [PubMed] [Green Version]
- Yilmaz, B.; Alshemary, A.Z.; Evis, Z. Co-doped hydroxyapatites as potential materials for biomedical applications. Microchem. J. 2019, 144, 443–453. [Google Scholar] [CrossRef]
- Tsai, S.-W.; Huang, S.-S.; Yu, W.-X.; Hsu, Y.-W.; Hsu, F.-Y. Fabrication and Characteristics of Porous Hydroxyapatite-CaO Composite Nanofibers for Biomedical Applications. Nanomaterials 2018, 8, 570. [Google Scholar] [CrossRef] [PubMed] [Green Version]
- Li, L.; Liu, Y.; Tao, J.; Zhang, M.; Pan, H.; Xu, X.; Tang, R. Surface Modification of Hydroxyapatite Nanocrystallite by a Small Amount of Terbium Provides a Biocompatible Fluorescent Probe. J. Phys. Chem. C 2008, 112, 12219–12224. [Google Scholar] [CrossRef]
- Chane-Ching, J.-Y.; Lebugle, A.; Rousselot, I.; Pourpoint, A.; Pellé, F. Colloidal synthesis and characterization of monocrystalline apatite nanophosphors. J. Mater. Chem. 2007, 17, 2904–2913. [Google Scholar] [CrossRef] [Green Version]
- Wang, F.; Tan, W.B.; Zhang, Y.; Fan, X.; Wang, M. Luminescent nanomaterials for biological labelling. Nanotechnology 2005, 17, R1–R13. [Google Scholar] [CrossRef]
- Meiser, F.; Cortez, C.; Caruso, F. Biofunctionalization of Fluorescent Rare-Earth-Doped Lanthanum Phosphate Colloidal Nanoparticles. Angew. Chem. Int. Ed. 2004, 43, 5954–5957. [Google Scholar] [CrossRef] [PubMed]
- Guo, D.; Wang, A.; Han, Y.; Xu, K. Characterization, physicochemical properties and biocompatibility of La-incorporated apatites. Acta Biomater. 2009, 5, 3512–3523. [Google Scholar] [CrossRef] [PubMed]
- Šupová, M. Substituted hydroxyapatites for biomedical applications: A review. Ceram. Int. 2015, 41, 9203–9231. [Google Scholar] [CrossRef]
- Zhou, W.Y.; Wang, M.; Cheung, W.L.; Guo, B.C.; Jia, D.M. Synthesis of carbonated hydroxyapatite nanospheres through nanoemulsion. J. Mater. Sci. Mater. Med. 2007, 19, 103–110. [Google Scholar] [CrossRef] [PubMed]
- Landi, E.; Tampieri, A.; Celotti, G.; Sprio, S. Densification behaviour and mechanisms of synthetic hydroxyapatites. J. Eur. Ceram. Soc. 2000, 20, 2377–2387. [Google Scholar] [CrossRef]
- Li, H.; Zhao, X.; Cao, S.; Li, K.; Chen, M.; Xu, Z.; Lu, J.; Zhang, L. Na-doped hydroxyapatite coating on carbon/carbon com-posites: Preparation, in vitro bioactivity and biocompatibility. Appl. Surf. Sci. 2012, 263, 163–173. [Google Scholar] [CrossRef]
- Kannan, S.; Ventura, J.; Ferreira, J. Synthesis and thermal stability of potassium substituted hydroxyapatites and hydroxyapatite/β-tricalciumphosphate mixtures. Ceram. Int. 2007, 33, 1489–1494. [Google Scholar] [CrossRef]
- Yan, Y.; Zhang, X.; Huang, Y.; Ding, Q.; Pang, X. Antibacterial and bioactivity of silver substituted hydroxyapatite/TiO 2 nanotube composite coatings on titanium. Appl. Surf. Sci. 2014, 314, 348–357. [Google Scholar] [CrossRef]
- Zhang, W.; Cao, N.; Chai, Y.; Xu, X.; Wang, Y. Synthesis of nanosize single-crystal strontium hydroxyapatite via a simple sol–gel method. Ceram. Int. 2014, 40, 16061–16064. [Google Scholar] [CrossRef]
- Thian, E.S.; Konishi, T.; Kawanobe, Y.; Lim, P.N.; Choong, C.; Ho, B.; Aizawa, M. Zincsubstituted hydroxyapatite: A bio-material with enhanced bioactivity and antibacterial properties. J. Mater. Sci. Mater. Med. 2013, 24, 437–445. [Google Scholar] [CrossRef]
- Shanmugam, S.; Gopal, B. Copper substituted hydroxyapatite and fluorapatite: Synthesis, characterization and antimicrobial properties. Ceram. Int. 2014, 40, 15655–15662. [Google Scholar] [CrossRef]
- Chandra, V.S.; Baskar, G.; Suganthi, R.V.; Elayaraja, K.; Joshy, M.I.A.; Beaula, W.S.; Mythili, R.; Venkatraman, G.; Kalkura, S.N. Blood Compatibility of Iron-Doped Nanosize Hydroxyapatite and Its Drug Release. ACS Appl. Mater. Interfaces 2012, 4, 1200–1210. [Google Scholar] [CrossRef]
- Nie, Y.; Hu, C.; Kong, C. Enhanced fluoride adsorption using Al (III) modified calcium hydroxyapatite. J. Hazard. Mater. 2012, 233-234, 194–199. [Google Scholar] [CrossRef]
- Tite, T.; Popa, A.-C.; Balescu, L.M.; Bogdan, I.M.; Pasuk, I.; Ferreira, J.M.F.; Stan, G.E. Cationic Substitutions in Hydroxyapatite: Current Status of the Derived Biofunctional Effects and Their In Vitro Interrogation Methods. Materials 2018, 11, 2081. [Google Scholar] [CrossRef] [Green Version]
- Neacsu, I.A.; Stoica, A.E.; Vasile, B.S.; Andronescu, E. Luminescent Hydroxyapatite Doped with Rare Earth Elements for Biomedical Applications. Nanomaterials 2019, 9, 239. [Google Scholar] [CrossRef] [Green Version]
- Lin, Y.; Yang, Z.; Cheng, J. Preparation, Characterization and Antibacterial Property of Cerium Substituted Hydroxyapatite Nanoparticles. J. Rare Earths 2007, 25, 452–456. [Google Scholar] [CrossRef]
- Kar, A.; Patra, A. Impacts of core–shell structures on properties of lanthanide-based nanocrystals: Crystal phase, lattice strain, downconversion, upconversion and energy transfer. Nanoscale 2012, 4, 3608–3619. [Google Scholar] [CrossRef]
- Deopa, N.; Rao, A. Spectroscopic studies of single near ultraviolet pumped Tb3+ doped Lithium Lead Alumino Borate glasses for green lasers and tricolour w-LEDs. J. Lumin. 2018, 194, 56–63. [Google Scholar] [CrossRef]
- Bin Chen, B.; Liu, M.L.; Zhan, L.; Li, C.M.; Huang, C.Z. Terbium(III) Modified Fluorescent Carbon Dots for Highly Selective and Sensitive Ratiometry of Stringent. Anal. Chem. 2018, 90, 4003–4009. [Google Scholar] [CrossRef] [PubMed]
- Materials, S.E.; Cells, S. Luminescent Layers for Enhanced Silicon Solar Cell Performance: Down-Conversion. Sol. Energy Mater. Sol. Cells 2016. [CrossRef]
- Wei, Y.; He, Y.; Li, X.; Chen, H.; Deng, X. Cellular Uptake and Delivery-Dependent Effects of Tb3+-Doped Hydroxyapatite Nanorods. Molecules 2017, 22, 1043. [Google Scholar] [CrossRef] [Green Version]
- Chen, M.H.; Yoshioka, T.; Ikoma, T.; Hanagata, N.; Lin, F.H.; Tanaka, J. Photolumi-nescence and doping mechanism of theranostic Eu3+/Fe3+ dual-doped hydroxyapatite nanoparticles. Sci. Technol. Adv. Mater. 2014, 15. [Google Scholar] [CrossRef]
- Nicoara, A.I.; Ene, V.L.; Voicu, B.B.; Bucur, M.A.; Neacsu, I.A.; Vasile, B.S.; Iordache, F. Biocompatible Ag/Fe-Enhanced TiO2 Nanoparticles as an Effective Compound in Sunscreens. Nanomaterials 2020, 10, 570. [Google Scholar] [CrossRef] [PubMed] [Green Version]
- Andronescu, E.; Predoi, D.; Neacsu, I.A.; Paduraru, A.V.; Musuc, A.M.; Trusca, R.; Oprea, O.; Vasile, E.; Vasile, O.R.; Nicoara, A.I.; et al. Photoluminescent Hydroxylapatite: Eu3+ Doping E_ect on Biological Behaviour. Nanomaterials 2019, 9, 1187. [Google Scholar] [CrossRef] [PubMed] [Green Version]
- Paduraru, A.V.; Musuc, A.M.; Oprea, O.C.; Trusca, R.; Iordache, F.; Vasile, B.S.; Andronescu, E. Synthesis and Character-ization of Photoluminescent Ce(III) and Ce(IV) Substituted Hydroxyapatite Nanomaterials by Co-Precipitation Meth-od: Cytotoxicity and Biocompatibility Evaluation. Nanomaterials 2021, 11, 1911. [Google Scholar] [CrossRef] [PubMed]
- Paduraru, A.; Ghitulica, C.; Trusca, R.; Surdu, V.A.; Neacsu, I.A.; Holban, A.; Bîrca, A.; Iordache, F.; Vasile, B.S. Antimi-crobial Wound Dressings as Potential Materials for Skin Tissue Regeneration. Materials 2019, 12, 1859. [Google Scholar] [CrossRef] [PubMed] [Green Version]
- Dhand, V.; Rhee, K.Y.; Park, S.J. The facile and low temperature synthesis of nanophase hydroxyapatite crystals using wet chemistry. Mater. Sci. Eng. C 2014, 36, 152–159. [Google Scholar] [CrossRef]
- Yuan, Q.; Qin, C.; Wu, J.; Xu, A.; Zhang, Z.; Liao, J.; Lin, S.; Ren, X.; Zhang, P. Synthesis and characterization of Cerium-doped hydroxyapatite/polylactic acid composite coatings on metal sub-strates. Mater. Chem. Phys. 2016, 182, 365–371. [Google Scholar] [CrossRef]
- Feng, Z.; Liao, Y.; Ye, M. Synthesis and structure of cerium-substituted hydroxyapatite. J. Mater. Sci. Mater. Med. 2005, 16, 417–421. [Google Scholar] [CrossRef] [PubMed]
- Li, H.; Sun, X.; Li, Y.; Li, B.; Liang, C.; Wang, H. Materials Science & Engineering C Preparation and properties of carbon nanotube ( Fe )/ hydroxyapatite composite as magnetic targeted drug delivery carrier. Mater. Sci. Eng. C 2019, 97, 222–229. [Google Scholar]
- Mondal, S.; Dey, A.; Pal, U. Low temperature wet-chemical synthesis of spherical hydroxyapatite nanoparticles and their in situ cytotoxicity study. Adv. Nano Res. 2016, 4, 295–307. [Google Scholar] [CrossRef]
- Murugan, R.; Ramakrishna, S. Production of ultra-fine bioresorbable carbonated hydroxyapatite. Acta Biomater. 2006, 2, 201–206. [Google Scholar] [CrossRef]
- Veselinovic, L.; Karanovic, L.; Stojanovic, Z.; Bracko, I.; Markovic, S.; Ignjatovic, N.; Uskokovic, D. Crystal structure of cobalt-substituted calcium hydroxyapatite nanopowders prepared by hydrothermal processing. J. Appl. Cryst. 2010, 43, 320–327. [Google Scholar] [CrossRef]
- Lima, T.A.; Valerio, M.E. X-ray absorption fine structure spectroscopy and photoluminescence study of multifunctional europium (III)-doped hydroxyapatite in the presence of cationic surfactant medium. J. Lumin. 2018, 201, 70–76. [Google Scholar] [CrossRef]
- Elliott, J.C. Structure and Chemistry of the Apatites and Other Calcium Orthophosphates; Elsevier: Amsterdam, The Netherlands, 1994; Volume 18, 404p. [Google Scholar]
- Suzuki, T.; Hatsushika, T.; Miyake, M. Synthetic hydroxyapatites as inorganic cation exchangers. Part 2. J. Chem. Soc. Faraday Trans. 1 Phys. Chem. Condens. Phases 1982, 178, 3605–3611. [Google Scholar] [CrossRef]
- Gaines, R.V.; Skinner, H.C.; Foord, E.E.; Mason, B.; Rosenzweig, A. Dana’s New Mineralogy; John Wiley & Sons Inc.: New York, NY, USA, 1997. [Google Scholar]
- Klein, C.; Dutrow, B. Mineral Science; John Wiley & Sons Inc.: New York, NY, USA, 2008. [Google Scholar]
- Jiménez-Flores, Y.; Suárez-Quezada, M.; Rojas-Trigos, J.B.; Lartundo-Rojas, L.; Suárez, V.; Mantilla, A. Characterization of Tb-doped hydroxyapatite for bio-medical applications: Optical properties and energy band gap determination. J. Mater. Sci. 2017, 52, 9990–10000. [Google Scholar] [CrossRef]


| Sample | Element | µg Element/mg Sample | Limit of Detection (LoD) [ug/L] | Correlation Coefficient (r2) |
|---|---|---|---|---|
| Ca9.95Tb0.05(PO4)6(OH)2 | 159Tb | 7.89 | 0.0002 | 0.997 |
| Ca9.9Tb0.1(PO4)6(OH)2 | 25.11 | |||
| Ca9.75Tb0.25(PO4)6(OH)2 | 41.27 | |||
| Ca9.5Tb0.5(PO4)6(OH)2 | 70.66 | |||
| Ca9Tb1(PO4)6(OH)2 | 110.37 |
| Samples | D/nm | S/% | χc/% |
|---|---|---|---|
| HAp | 6.07 ± 0.82 | 1.52 ± 0.53 | 31.50 |
| Ca10−xTbx(PO4)6(OH)2 | |||
| Ca9.95Tb0.05(PO4)6(OH)2 | 5.72 ± 0.76 | 1.61 ± 0.54 | 37.40 |
| Ca9.9Tb0.1(PO4)6(OH)2 | 4.87 ± 0.71 | 1.89 ± 0.60 | 37.00 |
| Ca9.75Tb0.25(PO4)6(OH)2 | 4.66 ± 0.72 | 1.97 ± 0.60 | 35.02 |
| Ca9.5Tb0.5(PO4)6(OH)2 | 4.83 ± 0.57 | 1.91 ± 0.69 | 32.87 |
| Ca9Tb1(PO4)6(OH)2 | 6.43 ± 0.70 | 1.44 ± 0.56 | 28.95 |
| Sample | a [Å] | c [Å] | V [Å3] | Rexp | Rp | Rwp | χ2 |
|---|---|---|---|---|---|---|---|
| HAp | 9.4227 ± 0.0033 | 6.8837 ± 0.0025 | 529.3087 | 3.1050 | 4.5059 | 5.7040 | 3.3747 |
| Ca10−xTbx(PO4)6(OH)2 | |||||||
| Ca9.95Tb0.05(PO4)6(OH)2 | 9.4208 ± 0.0030 | 6.8846 ± 0.0023 | 529.1685 | 3.6765 | 3.8036 | 5.0633 | 1.8967 |
| Ca9.9Tb0.1(PO4)6(OH)2 | 9.4395 ± 0.0037 | 6.8903 ± 0.0029 | 531.7138 | 3.6495 | 3.6622 | 4.7929 | 1.7247 |
| Ca9.75Tb0.25(PO4)6(OH)2 | 9.4135 ± 0.0043 | 6.8844 ± 0.0035 | 528.3299 | 3.4967 | 3.4024 | 4.5551 | 1.6969 |
| Ca9.5Tb0.5(PO4)6(OH)2 | 9.4283 ± 0.0046 | 6.8788 ± 0.0036 | 529.5652 | 3.3414 | 3.3127 | 4.2472 | 1.6157 |
| Ca9Tb1(PO4)6(OH)2 | 9.4066 ± 0.0037 | 6.8901 ± 0.0028 | 527.9956 | 3.1025 | 2.9919 | 3.9236 | 1.5994 |
Publisher’s Note: MDPI stays neutral with regard to jurisdictional claims in published maps and institutional affiliations. |
© 2021 by the authors. Licensee MDPI, Basel, Switzerland. This article is an open access article distributed under the terms and conditions of the Creative Commons Attribution (CC BY) license (https://creativecommons.org/licenses/by/4.0/).
Share and Cite
Paduraru, A.V.; Oprea, O.; Musuc, A.M.; Vasile, B.S.; Iordache, F.; Andronescu, E. Influence of Terbium Ions and Their Concentration on the Photoluminescence Properties of Hydroxyapatite for Biomedical Applications. Nanomaterials 2021, 11, 2442. https://doi.org/10.3390/nano11092442
Paduraru AV, Oprea O, Musuc AM, Vasile BS, Iordache F, Andronescu E. Influence of Terbium Ions and Their Concentration on the Photoluminescence Properties of Hydroxyapatite for Biomedical Applications. Nanomaterials. 2021; 11(9):2442. https://doi.org/10.3390/nano11092442
Chicago/Turabian StylePaduraru, Andrei Viorel, Ovidiu Oprea, Adina Magdalena Musuc, Bogdan Stefan Vasile, Florin Iordache, and Ecaterina Andronescu. 2021. "Influence of Terbium Ions and Their Concentration on the Photoluminescence Properties of Hydroxyapatite for Biomedical Applications" Nanomaterials 11, no. 9: 2442. https://doi.org/10.3390/nano11092442
APA StylePaduraru, A. V., Oprea, O., Musuc, A. M., Vasile, B. S., Iordache, F., & Andronescu, E. (2021). Influence of Terbium Ions and Their Concentration on the Photoluminescence Properties of Hydroxyapatite for Biomedical Applications. Nanomaterials, 11(9), 2442. https://doi.org/10.3390/nano11092442