
Analysis of Thermoelectric Energy Harvesting with Graphene Aerogel-Supported Form-Stable Phase Change Materials


Abstract
:1. Introduction
2. Experimental Sections
2.1. Materials
2.2. Fabrication of PCM Composites
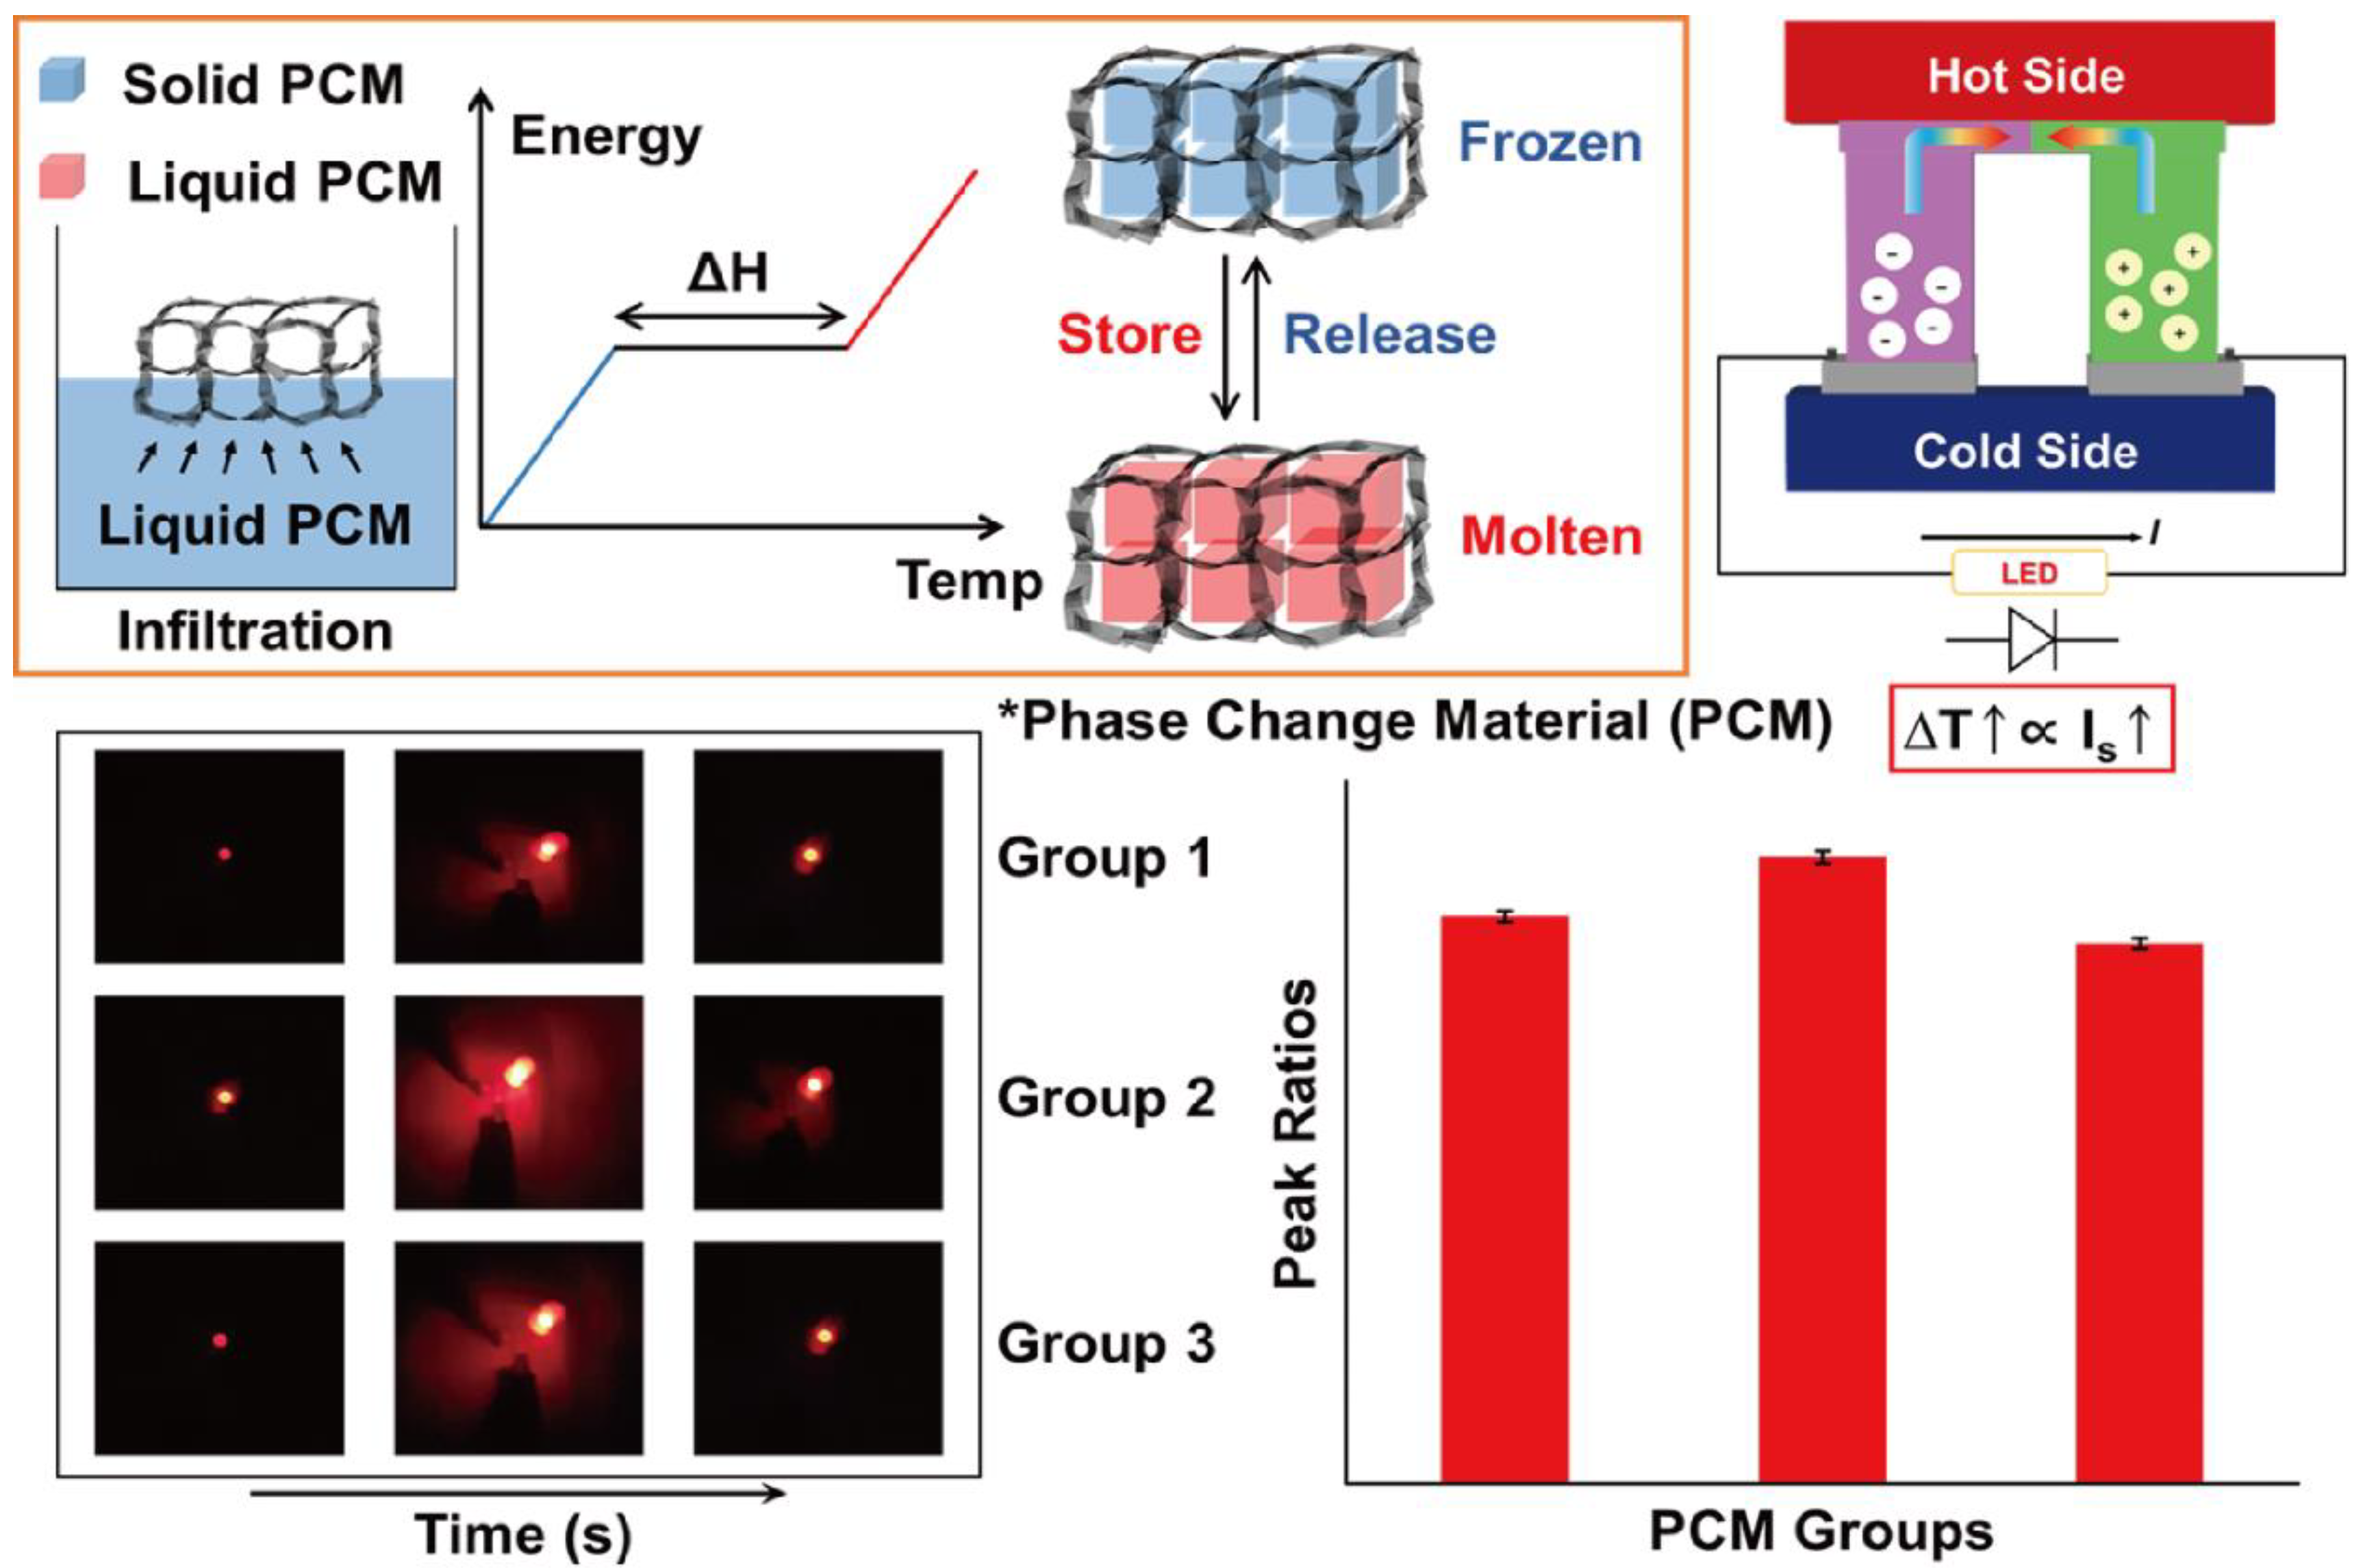
2.3. Design of the Energy Harvesting System
2.4. Characterizations
3. Numerical Analysis
4. Results and Discussion
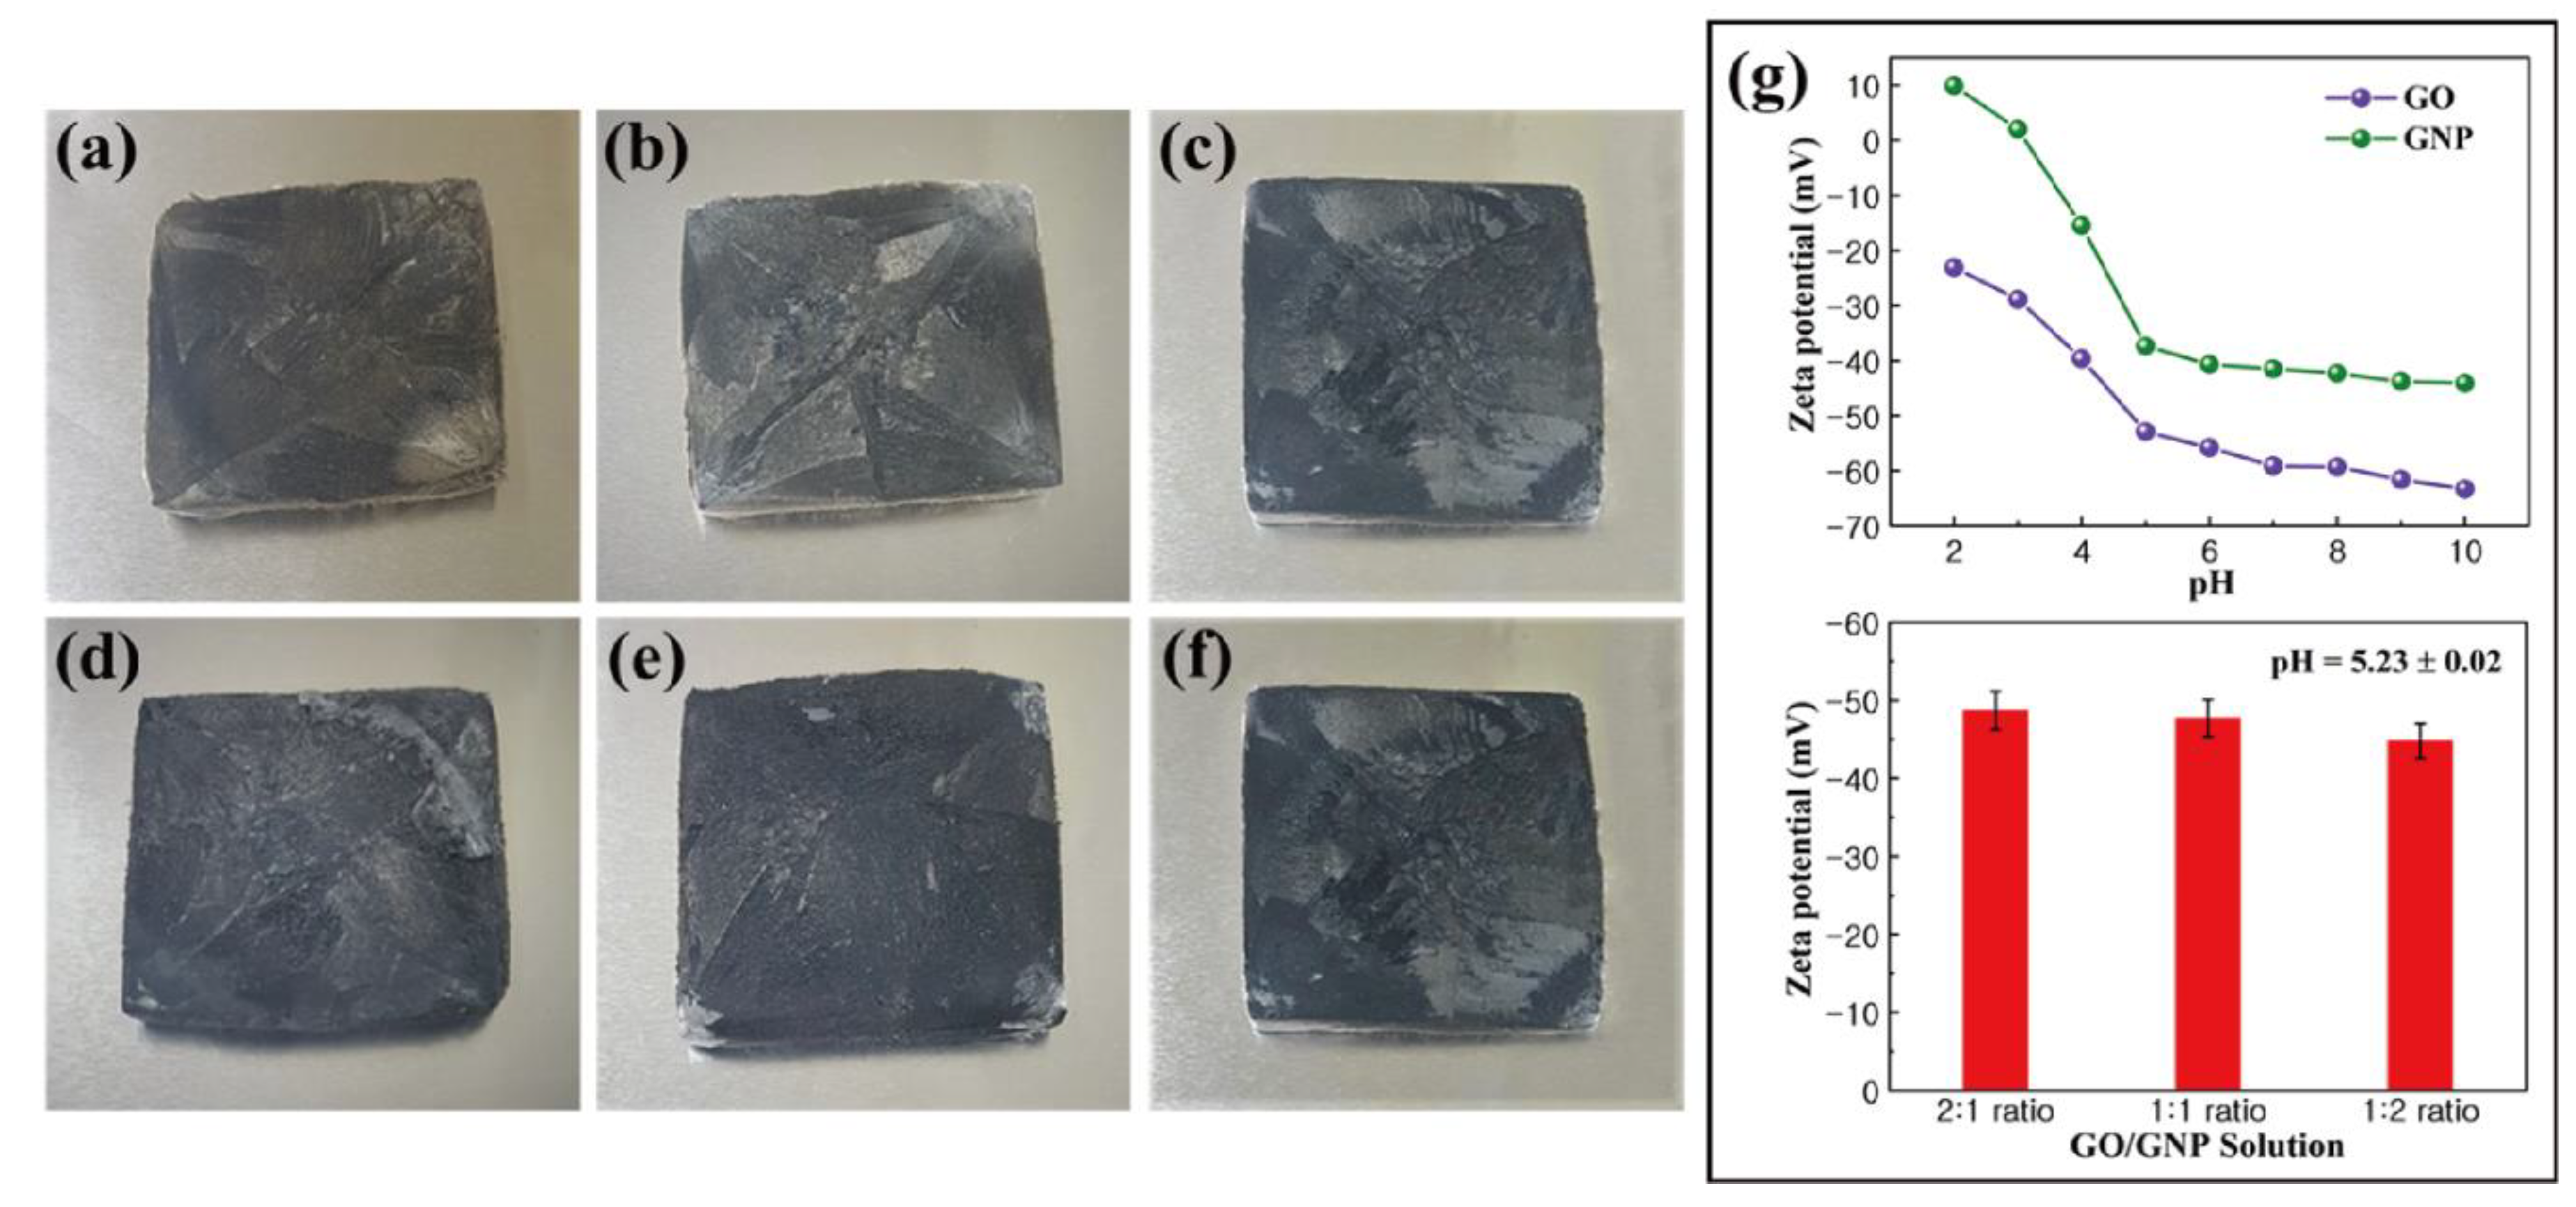
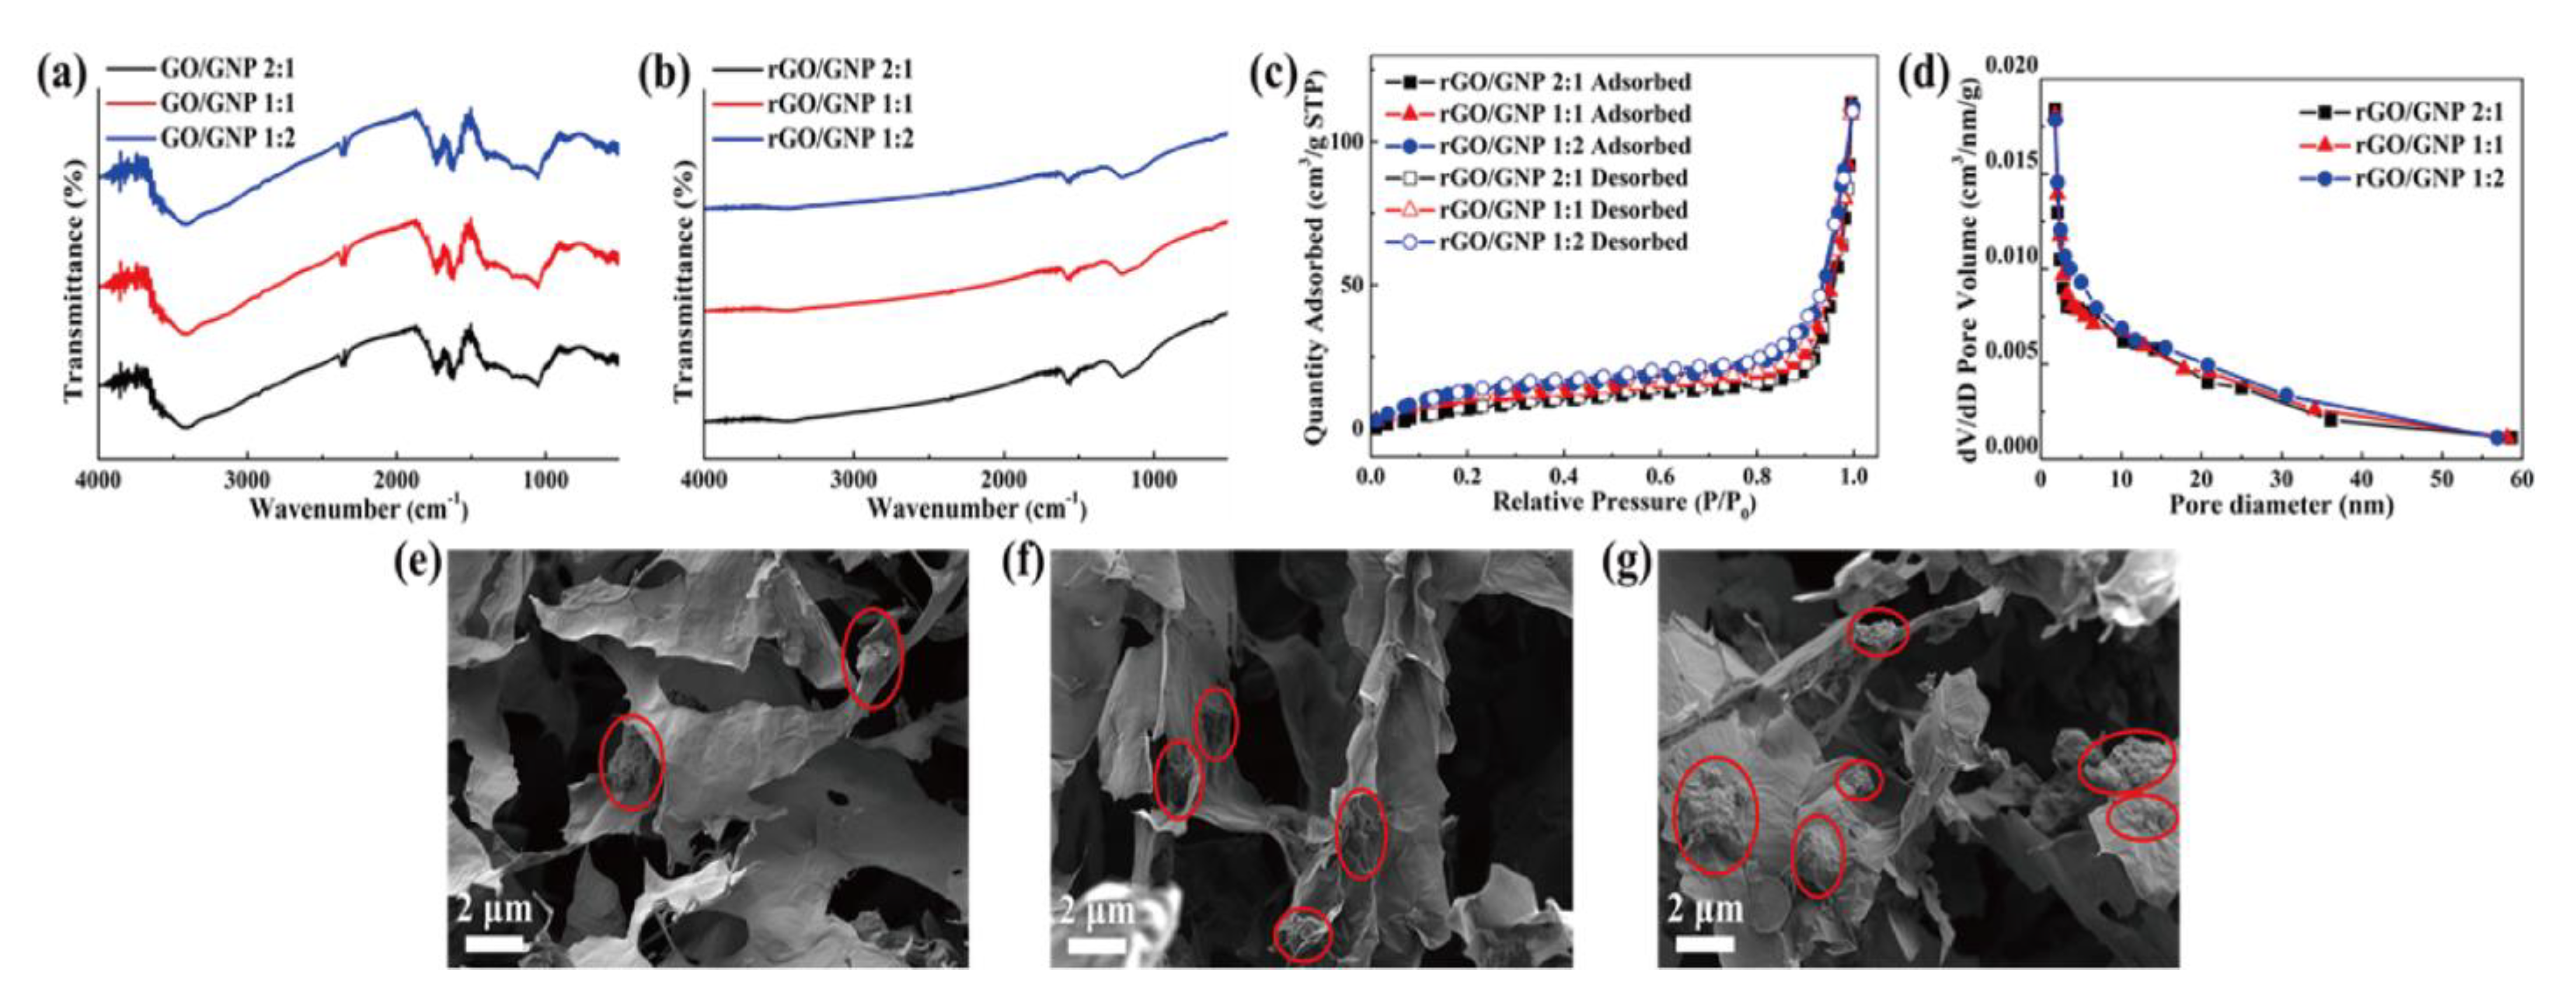
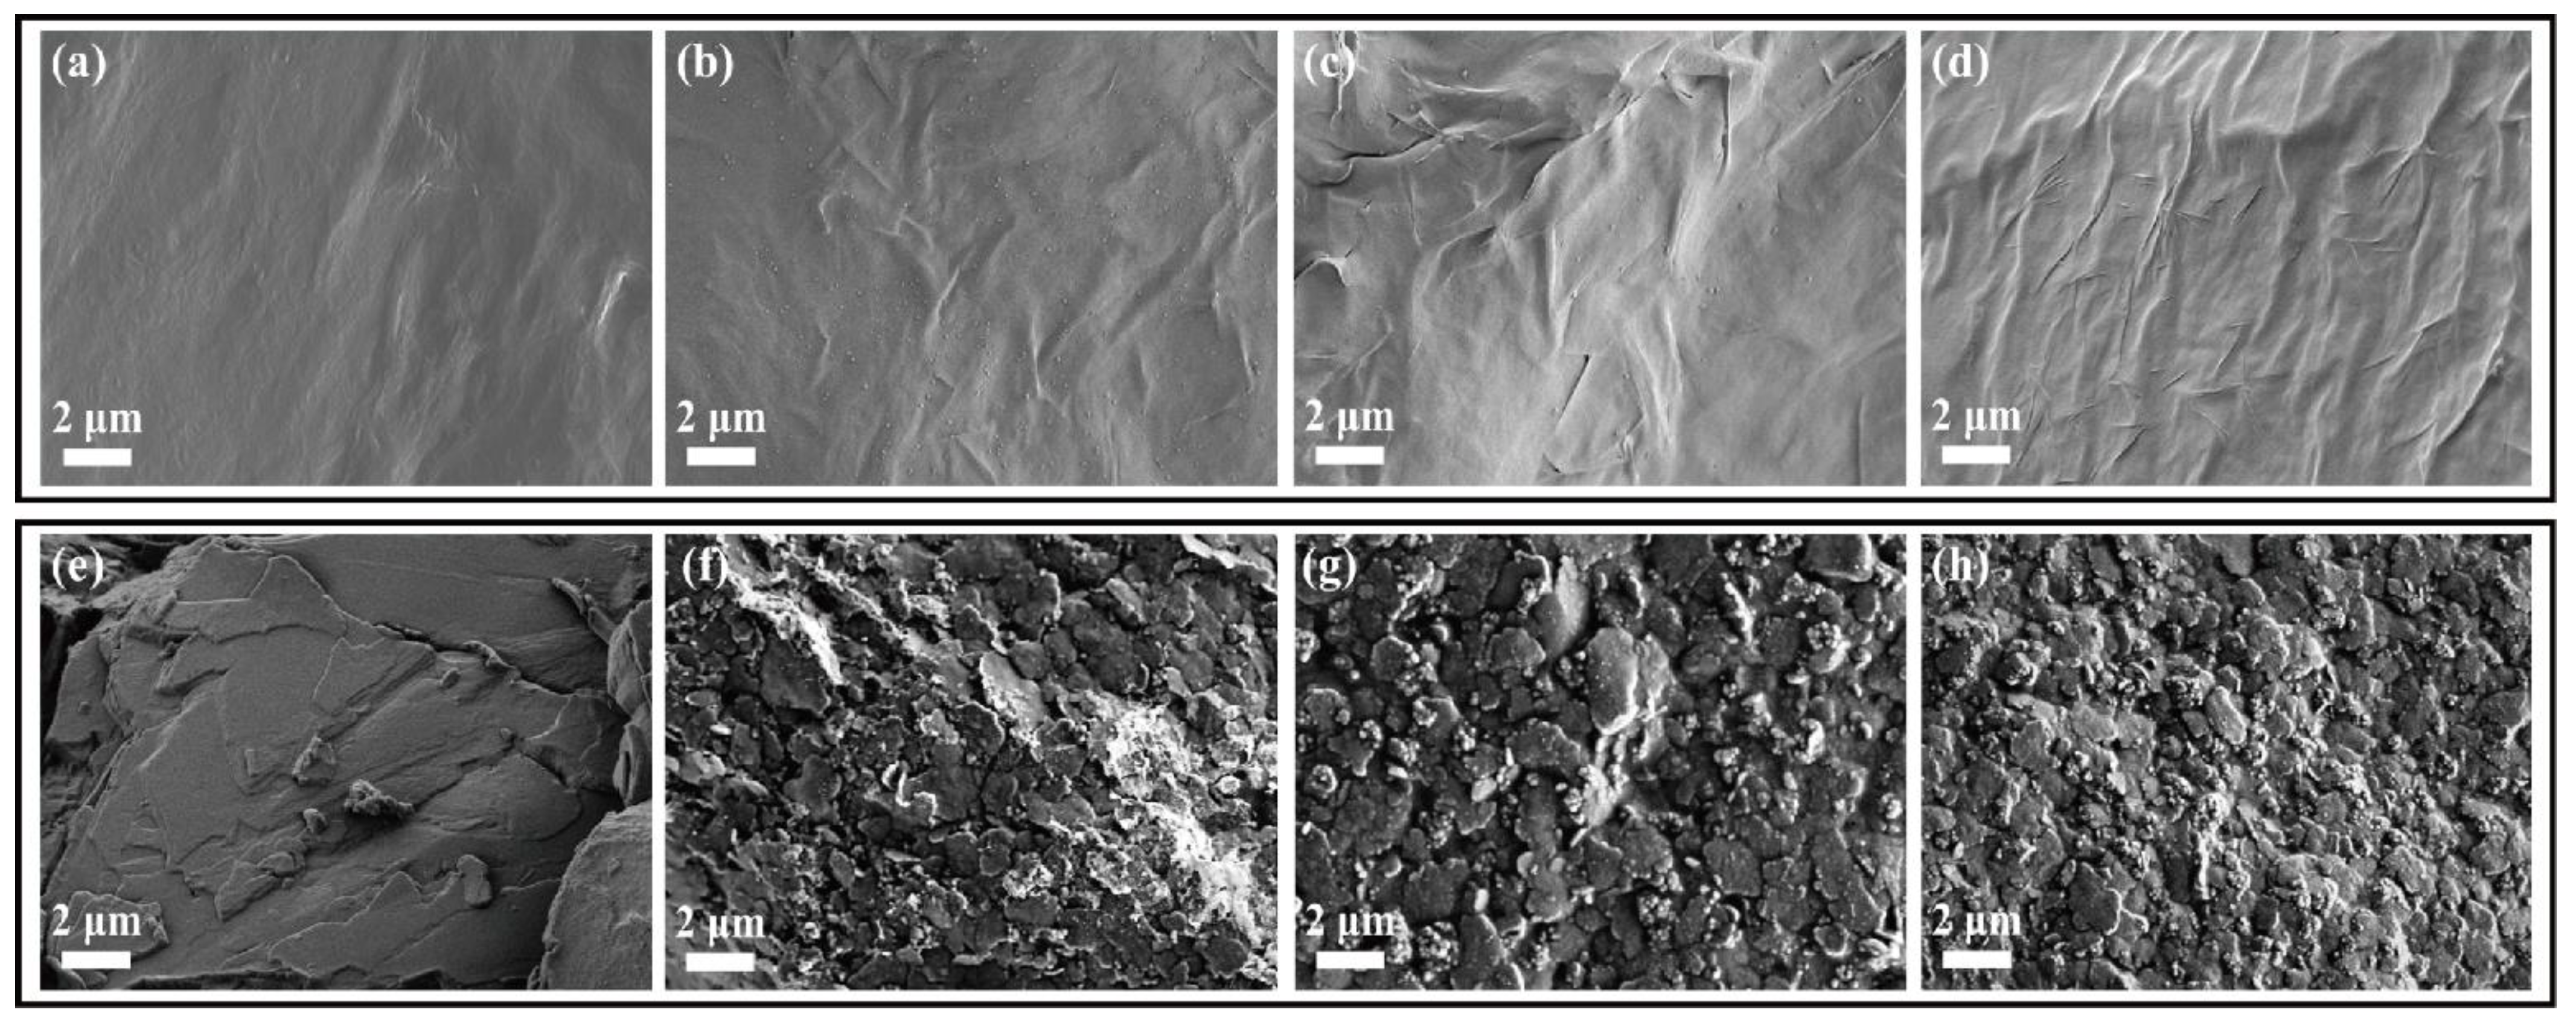
4.1. Morphology of Graphene Aerogels
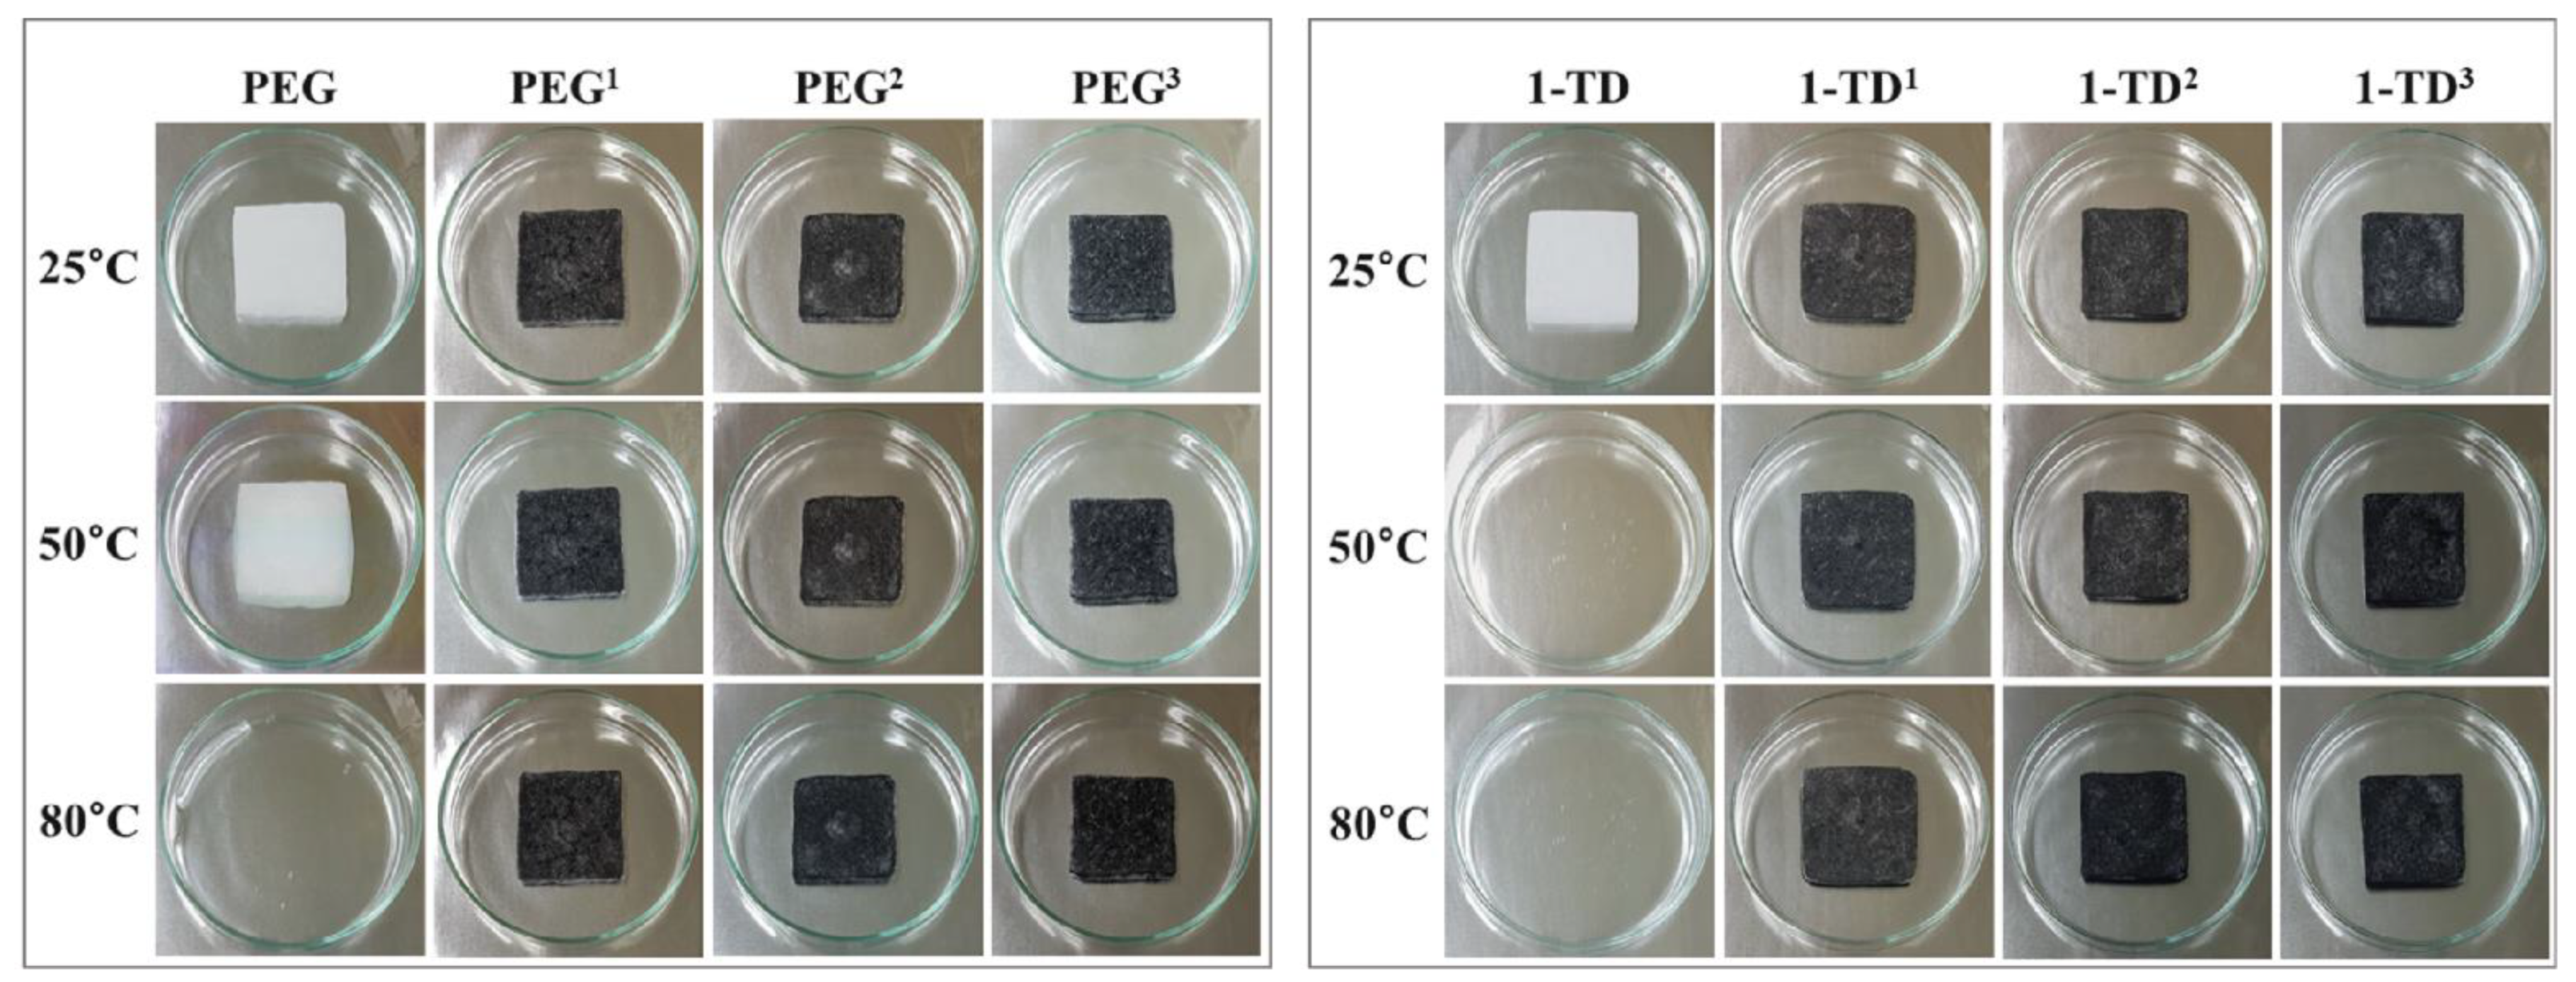
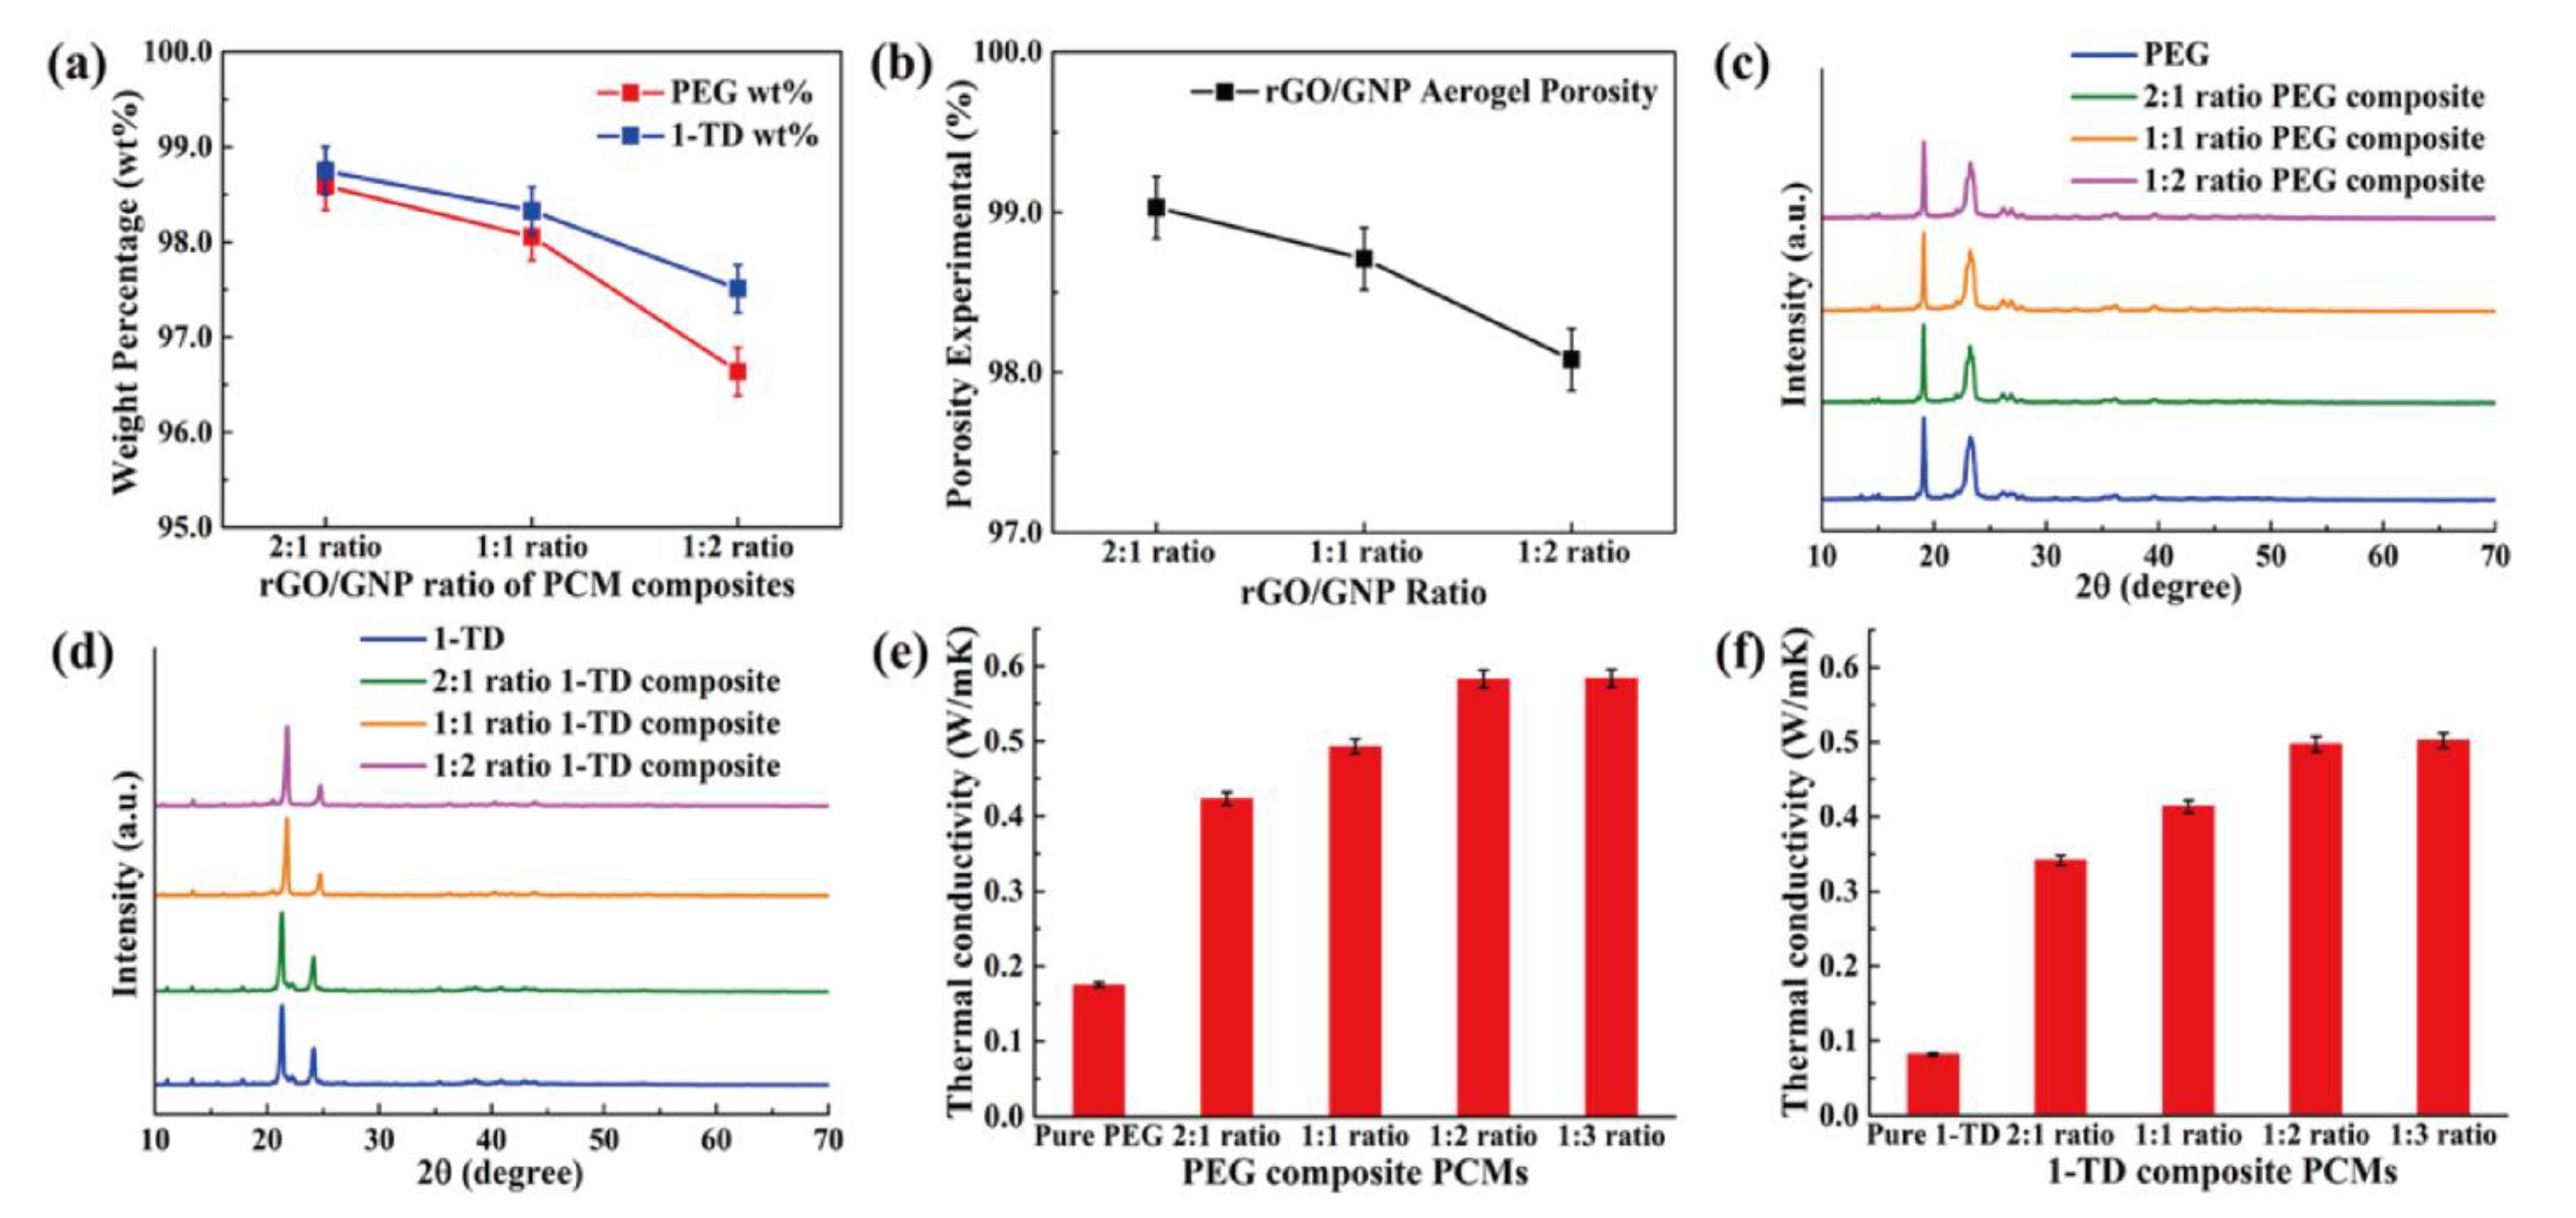
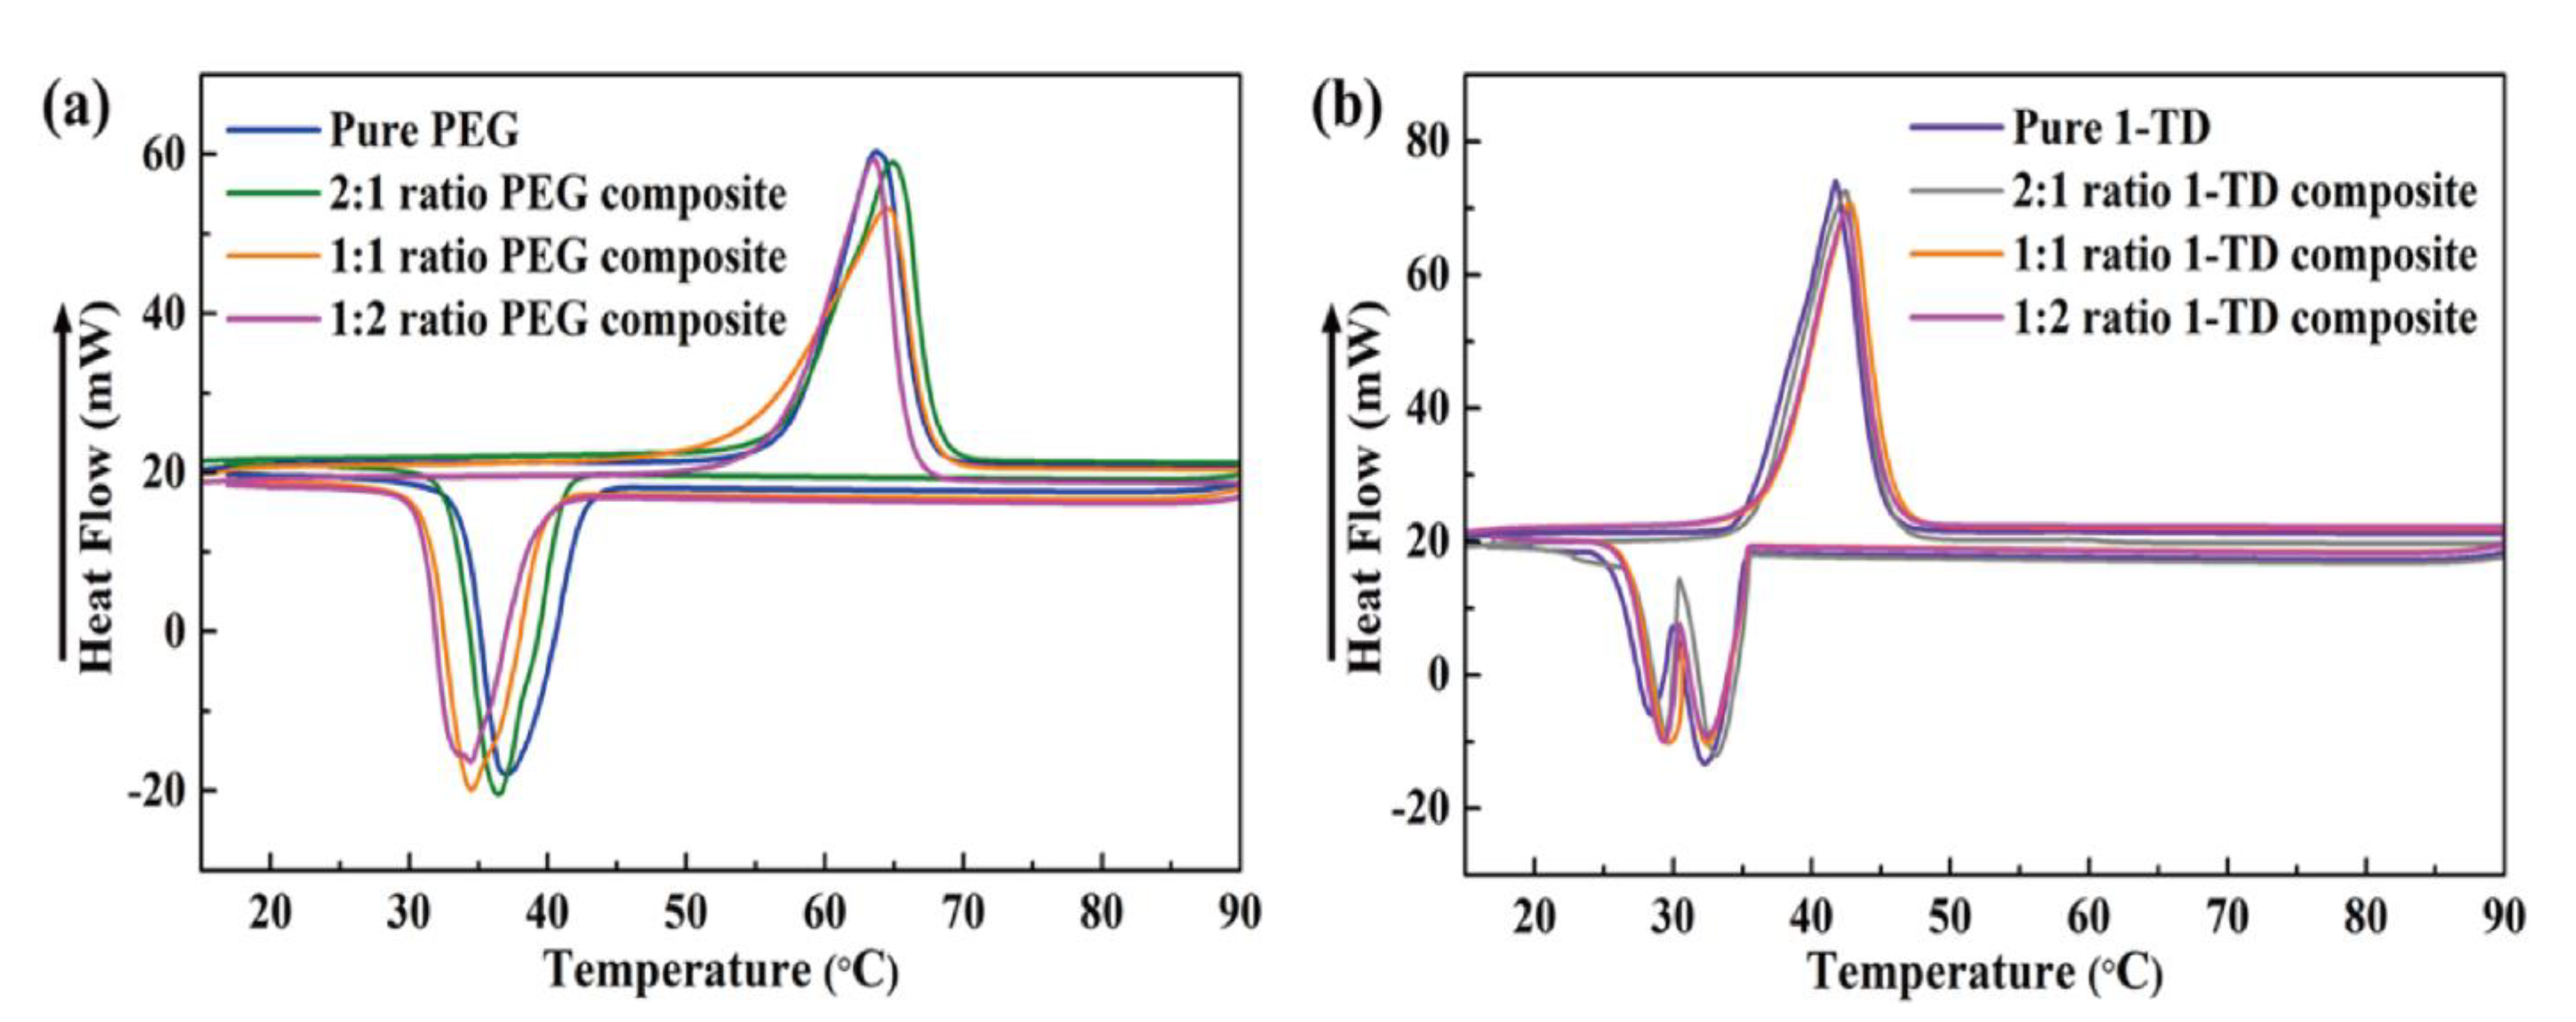
4.2. Characterization of PCM Composites
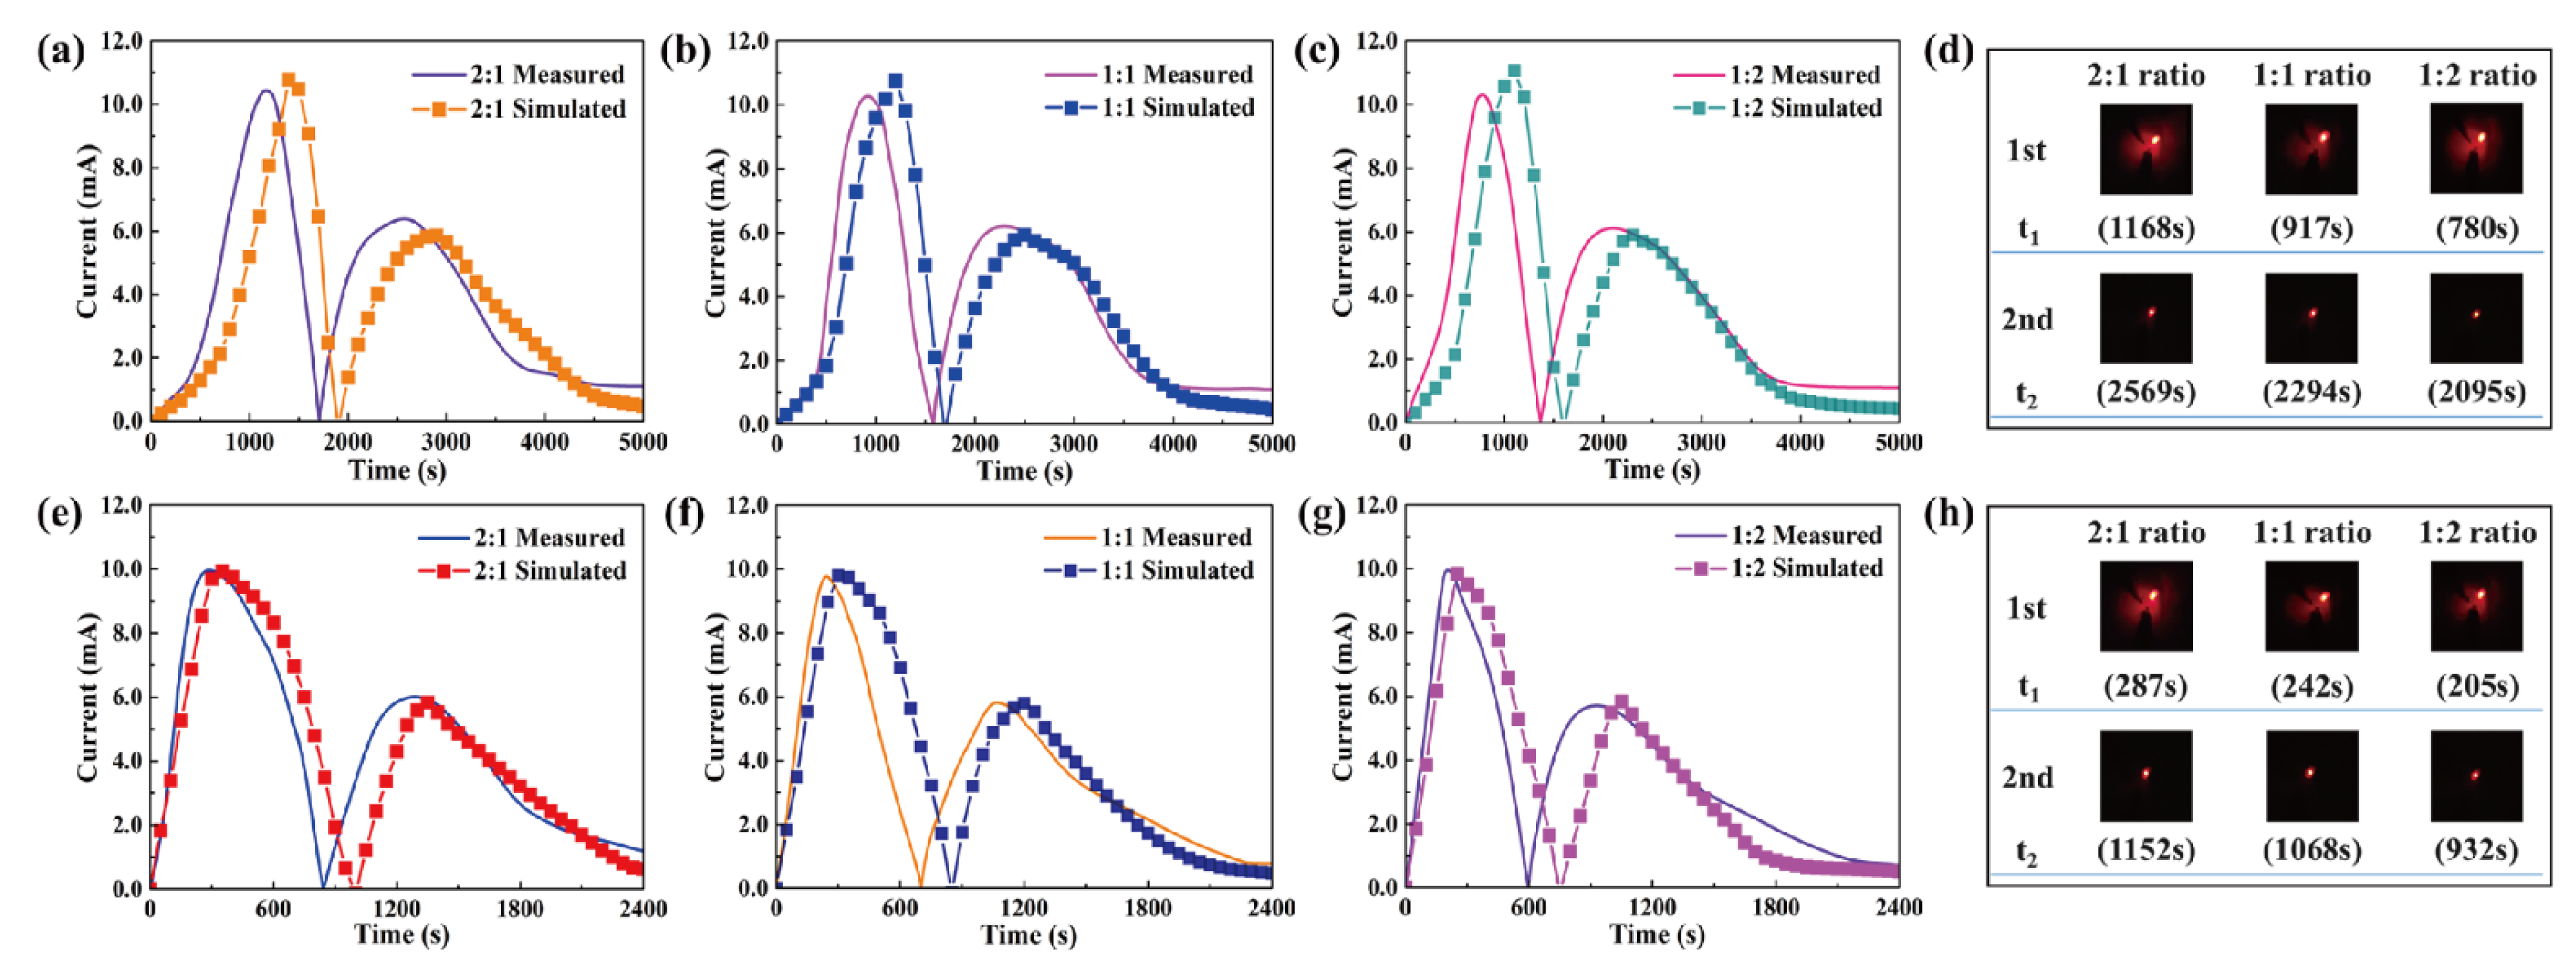
4.3. Thermoelectric Energy Harvesting
5. Conclusions
Author Contributions
Funding
Institutional Review Board Statement
Informed Consent Statement
Data Availability Statement
Acknowledgments
Conflicts of Interest
References
- Rödel, J. Crystallographic design for energy storage. Nat. Mater. 2020, 19, 932–934. [Google Scholar] [CrossRef] [PubMed]
- Elavarasan, R.M.; Shafiullah, G.; Padmanaban, S.; Kumar, N.M.; Annam, A.; Vetrichelvan, A.M.; Mihet-Popa, L.; Holm-Nielsen, J.B. A Comprehensive Review on Renewable Energy Development, Challenges, and Policies of Leading Indian States with an International Perspective. IEEE Access 2020, 8, 74432–74457. [Google Scholar] [CrossRef]
- Zhang, X.; Grajal, J.; Vazquez-Roy, J.L.; Radhakrishna, U.; Wang, X.; Chern, W.; Zhou, L.; Lin, Y.; Shen, P.-C.; Ji, X.; et al. Two-dimensional MoS2-enabled flexible rectenna for Wi-Fi-band wireless energy harvesting. Nature 2019, 566, 368–372. [Google Scholar] [CrossRef] [PubMed]
- Salman, W.; Qi, L.; Zhu, X.; Pan, H.; Zhang, X.; Bano, S.; Zhang, Z.; Yuan, Y. A high-efficiency energy regenerative shock absorber using helical gears for powering low-wattage electrical device of electric vehicles. Energy 2018, 159, 361–372. [Google Scholar] [CrossRef]
- Liu, Y.; Song, H.; Bei, Z.; Zhou, L.; Zhao, C.; Ooi, B.S.; Gan, Q. Ultra-thin dark amorphous TiOx hollow nanotubes for full spectrum solar energy harvesting and conversion. Nano Energy 2021, 84, 105872. [Google Scholar] [CrossRef]
- Ding, T.; Zhou, Y.; Ong, W.L.; Ho, G.W. Hybrid solar-driven interfacial evaporation systems: Beyond water production towards high solar energy utilization. Mater. Today 2020, 42, 178–191. [Google Scholar] [CrossRef]
- Lv, H.; Liang, L.; Zhang, Y.; Deng, L.; Chen, Z.; Liu, Z.; Wang, H.; Chen, G. A flexible spring-shaped architecture with optimized thermal design for wearable thermoelectric energy harvesting. Nano Energy 2021, 88, 106260. [Google Scholar] [CrossRef]
- Sani, E.; Martina, M.; Salez, T.; Nakamae, S.; Dubois, E.; Peyre, V. Multifunctional Magnetic Nanocolloids for Hybrid Solar-Thermoelectric Energy Harvesting. Nanomaterials 2021, 11, 1031. [Google Scholar] [CrossRef]
- Qian, M.; Li, Z.; Fan, L.; Wang, H.; Xu, J.; Zhao, W.; Huang, F. Ultra-Light Graphene Tile-Based Phase-Change Material for Efficient Thermal and Solar Energy Harvest. ACS Appl. Energy Mater. 2020, 3, 5517–5522. [Google Scholar] [CrossRef]
- Li, T.; Fang, Q.; Wang, J.; Lin, H.; Han, Q.; Wang, P.; Liu, F. Exceptional interfacial solar evaporation via heteromorphic PTFE/CNT hollow fiber arrays. J. Mater. Chem. A 2020, 9, 390–399. [Google Scholar] [CrossRef]
- Faraj, K.; Khaled, M.; Faraj, J.; Hachem, F.; Castelain, C. Phase change material thermal energy storage systems for cooling applications in buildings: A review. Renew. Sustain. Energy Rev. 2019, 119, 109579. [Google Scholar] [CrossRef]
- Zhang, X.; Lin, Q.; Luo, H.; Luo, S. Three-dimensional graphitic hierarchical porous carbon/stearic acid composite as shape-stabilized phase change material for thermal energy storage. Appl. Energy 2019, 260, 114278. [Google Scholar] [CrossRef]
- Thirugnanam, C.; Karthikeyan, S.; Kalaimurugan, K. Study of phase change materials and its application in solar cooker. Mater. Today Proc. 2020, 33, 2890–2896. [Google Scholar] [CrossRef]
- Sharma, A.; Tyagi, V.; Chen, C.; Buddhi, D. Review on thermal energy storage with phase change materials and applications. Renew. Sustain. Energy Rev. 2009, 13, 318–345. [Google Scholar] [CrossRef]
- Su, W.; Darkwa, J.; Kokogiannakis, G. Review of solid–liquid phase change materials and their encapsulation technologies. Renew. Sustain. Energy Rev. 2015, 48, 373–391. [Google Scholar] [CrossRef]
- Zalba, B.; Marín, J.M.; Cabeza, L.F.; Mehling, H. Review on thermal energy storage with phase change: Materials, heat transfer analysis and applications. Appl. Therm. Eng. 2003, 23, 251–283. [Google Scholar] [CrossRef]
- Feldman, D.; Shapiro, M.; Banu, D. Organic phase change materials for thermal energy storage. Sol. Energy Mater. 1986, 13, 1–10. [Google Scholar] [CrossRef]
- Shukla, A.; Buddhi, D.; Sawhney, R. Thermal cycling test of few selected inorganic and organic phase change materials. Renew. Energy 2008, 33, 2606–2614. [Google Scholar] [CrossRef]
- Yu, C.; Youn, J.R.; Song, Y.S. Enhancement in thermo-electric energy harvesting efficiency by embedding PDMS in form-stable PCM composites. Polym. Adv. Technol. 2021. [Google Scholar] [CrossRef]
- Chriaa, I.; Karkri, M.; Trigui, A.; Jedidi, I.; Abdelmouleh, M.; Boudaya, C. The performances of expanded graphite on the phase change materials composites for thermal energy storage. Polymer 2020, 212, 123128. [Google Scholar] [CrossRef]
- Yu, C.; Youn, J.R.; Song, Y.S. Multiple Energy Harvesting Based on Reversed Temperature Difference Between Graphene Aerogel Filled Phase Change Materials. Macromol. Res. 2019, 27, 606–613. [Google Scholar] [CrossRef]
- Huang, K.; Yan, Y.; Wang, G.; Li, B. Improving transient performance of thermoelectric generator by integrating phase change material. Energy 2020, 219, 119648. [Google Scholar] [CrossRef]
- Yu, C.; Yang, S.H.; Pak, S.Y.; Youn, J.R.; Song, Y.S. Graphene embedded form stable phase change materials for drawing the thermo-electric energy harvesting. Energy Convers. Manag. 2018, 169, 88–96. [Google Scholar] [CrossRef]
- Niu, Z.; Yuan, W. Highly Efficient Thermo- and Sunlight-Driven Energy Storage for Thermo-Electric Energy Harvesting Using Sustainable Nanocellulose-Derived Carbon Aerogels Embedded Phase Change Materials. ACS Sustain. Chem. Eng. 2019, 7, 17523–17534. [Google Scholar] [CrossRef]
- Yang, Z.; Xiang, M.; Zhu, Y.; Hui, J.; Jiang, Y.; Dong, S.; Yu, C.; Ou, J.; Qin, H. Single-atom platinum or ruthenium on C4N as 2D high-performance electrocatalysts for oxygen reduction reaction. Chem. Eng. J. 2021, 426, 131347. [Google Scholar] [CrossRef]
- Bhattacharya, M.; Ranjan, M.; Kumar, N.; Maiti, T. Performance Analysis and Optimization of a SnSe-Based Thermoelectric Generator. ACS Appl. Energy Mater. 2021, 4, 8211–8219. [Google Scholar] [CrossRef]
- Grosu, Y.; Zhao, Y.; Giacomello, A.; Meloni, S.; Dauvergne, J.-L.; Nikulin, A.; Palomo, E.; Ding, Y.; Faik, A. Hierarchical macro-nanoporous metals for leakage-free high-thermal conductivity shape-stabilized phase change materials. Appl. Energy 2020, 269, 115088. [Google Scholar] [CrossRef]
- Li, H.; Liu, X.; Fang, G.-Y. Synthesis and characteristics of form-stable n-octadecane/expanded graphite composite phase change materials. Appl. Phys. A 2010, 100, 1143–1148. [Google Scholar] [CrossRef]
- Park, J.H.; Yang, S.H.; Lee, H.R.; Bin Yu, C.; Pak, S.Y.; Oh, C.S.; Kang, Y.J.; Youn, J.R. Optimization of low frequency sound absorption by cell size control and multiscale poroacoustics modeling. J. Sound Vib. 2017, 397, 17–30. [Google Scholar] [CrossRef]
- Yu, C.; Youn, J.R.; Song, Y.S. Encapsulated Phase Change Material Embedded by Graphene Powders for Smart and Flexible Thermal Response. Fibers Polym. 2019, 20, 545–554. [Google Scholar] [CrossRef]
- Yu, C.; Youn, J.R.; Song, Y.S. Tunable Electrical Resistivity of Carbon Nanotube Filled Phase Change Material Via Solid-solid Phase Transitions. Fibers Polym. 2020, 21, 24–32. [Google Scholar] [CrossRef]
- Fang, G.; Li, H.; Yang, F.; Liu, X.; Wu, S. Preparation and characterization of nano-encapsulated n-tetradecane as phase change material for thermal energy storage. Chem. Eng. J. 2009, 153, 217–221. [Google Scholar] [CrossRef]
- Sari, A.; Alkan, C.; Biçer, A.; Karaipekli, A. Synthesis and thermal energy storage characteristics of polystyrene-graft-palmitic acid copolymers as solid–solid phase change materials. Sol. Energy Mater. Sol. Cells 2011, 95, 3195–3201. [Google Scholar] [CrossRef]
- Yanshan, L.; Shujun, W.; Hongyan, L.; Fanbin, M.; Huanqing, M.; Wangang, Z. Preparation and characterization of melamine/formaldehyde/polyethylene glycol crosslinking copolymers as solid–solid phase change materials. Sol. Energy Mater. Sol. Cells 2014, 127, 92–97. [Google Scholar] [CrossRef]
- Leng, G.; Qiao, G.; Jiang, Z.; Xu, G.; Qin, Y.; Chang, C.; Ding, Y. Micro encapsulated & form-stable phase change materials for high temperature thermal energy storage. Appl. Energy 2018, 217, 212–220. [Google Scholar] [CrossRef]
- Wang, Y.; Mi, H.; Zheng, Q.; Ma, Z.; Gong, S. Flexible Infrared Responsive Multi-Walled Carbon Nanotube/Form-Stable Phase Change Material Nanocomposites. ACS Appl. Mater. Interfaces 2015, 7, 21602–21609. [Google Scholar] [CrossRef] [PubMed]
- Ding, J.; Wu, X.; Shen, X.; Cui, S.; Chen, X. A promising form-stable phase change material composed of C/SiO2 aerogel and palmitic acid with large latent heat as short-term thermal insulation. Energy 2020, 210, 118478. [Google Scholar] [CrossRef]
- Du, X.; Qiu, J.; Deng, S.; Du, Z.; Cheng, X.; Wang, H. Alkylated Nanofibrillated Cellulose/Carbon Nanotubes Aerogels Supported Form-Stable Phase Change Composites with Improved n-Alkanes Loading Capacity and Thermal Conductivity. ACS Appl. Mater. Interfaces 2020, 12, 5695–5703. [Google Scholar] [CrossRef]
- Ding, J.; Wu, X.; Shen, X.; Cui, S.; Chen, X. Form-stable phase change material embedded in three-dimensional reduced graphene aerogel with large latent heat for thermal energy management. Appl. Surf. Sci. 2020, 534, 147612. [Google Scholar] [CrossRef]
- Yang, J.; Qi, G.-Q.; Liu, Y.; Bao, R.-Y.; Liu, Z.-Y.; Yang, W.; Xie, B.-H.; Yang, M.-B. Hybrid graphene aerogels/phase change material composites: Thermal conductivity, shape-stabilization and light-to-thermal energy storage. Carbon 2016, 100, 693–702. [Google Scholar] [CrossRef]
- Yang, P.; Tontini, G.; Wang, J.; A Kinloch, I.; Barg, S. Ice-templated hybrid graphene oxide—Graphene nanoplatelet lamellar architectures: Tuning mechanical and electrical properties. Nanotechnology 2021, 32, 205601. [Google Scholar] [CrossRef]
- Yang, J.; Li, X.; Han, S.; Zhang, Y.; Min, P.; Koratkar, N.; Yu, Z.-Z. Air-dried, high-density graphene hybrid aerogels for phase change composites with exceptional thermal conductivity and shape stability. J. Mater. Chem. A 2016, 4, 18067–18074. [Google Scholar] [CrossRef]
- Chavez, R.; Angst, S.; Hall, J.; Stoetzel, J.; Kessler, V.; Bitzer, L.; Maculewicz, F.; Benson, N.; Wiggers, H.; Wolf, D.; et al. High Temperature Thermoelectric Device Concept Using Large Area PN Junctions. J. Electron. Mater. 2014, 43, 2376–2383. [Google Scholar] [CrossRef]
- Jo, S.-E.; Kim, M.-S.; Kim, M.-K.; Kim, Y.-J. Power generation of a thermoelectric generator with phase change materials. Smart materials and structures. Smart Mater. Struct. 2013, 22, 115008. [Google Scholar] [CrossRef]
- Jiang, Y.; Wang, Z.; Shang, M.; Zhang, Z.; Zhang, S. Heat collection and supply of interconnected netlike graphene/polyethyleneglycol composites for thermoelectric devices. Nanoscale 2015, 7, 10950–10953. [Google Scholar] [CrossRef]
- Xu, R.; Zhang, Q.; Wang, J.Y.; Liu, D.; Wang, J.; Wang, Z.L. Direct current triboelectric cell by sliding an n-type semiconductor on a p-type semiconductor. Nano Energy 2019, 66, 104185. [Google Scholar] [CrossRef]
- Lu, Y.; Hao, Z.; Feng, S.; Shen, R.; Yan, Y.; Lin, S. Direct-Current Generator Based on Dynamic PN Junctions with the Designed Voltage Output. iScience 2019, 22, 58–69. [Google Scholar] [CrossRef]
- Chen, X.; Gao, H.; Tang, Z.; Dong, W.; Li, A.; Wang, G. Optimization strategies of composite phase change materials for thermal energy storage, transfer, conversion and utilization. Energy Environ. Sci. 2020, 13, 4498–4535. [Google Scholar] [CrossRef]
- Yuan, K.; Shi, J.; Aftab, W.; Qin, M.; Usman, A.; Zhou, F.; Lv, Y.; Gao, S.; Zou, R. Engineering the thermal conductivity of functional phase-change materials for heat energy conversion, storage, and utilization. Adv. Funct. Mater. 2020, 30, 1904228. [Google Scholar] [CrossRef]
- He, H.; Klinowski, J.; Forster, M.; Lerf, A. A new structural model for graphite oxide. Chem. Phys. Lett. 1998, 287, 53–56. [Google Scholar] [CrossRef]
- Guerrero-Contreras, J.; Caballero-Briones, F. Graphene oxide powders with different oxidation degree, prepared by synthesis variations of the Hummers method. Mater. Chem. Phys. 2015, 153, 209–220. [Google Scholar] [CrossRef]
- Yu, C.; Youn, J.R.; Song, Y.S. Reversible thermo-electric energy harvesting with phase change material (PCM) composites. J. Polym. Res. 2021, 28. [Google Scholar] [CrossRef]
- Kiflemariam, R.; Almas, M.; Lin, C. Modeling Integrated Thermoelectric Generator-Photovoltaic Thermal (TEG-PVT) System. In Proceedings of the 2014 COMSOL Conference, 2014. pp. 1–5.
- Zhang, J.; Yang, H.; Shen, G.; Cheng, P.; Zhang, J.; Guo, S. Reduction of graphene oxide via L-ascorbic acid. Chem. Commun. 2010, 46, 1112–1124. [Google Scholar] [CrossRef] [PubMed]
- Cheng, Y.; Zhou, S.; Hu, P.; Zhao, G.; Li, Y.; Zhang, X.; Han, W. Enhanced mechanical, thermal, and electric properties of graphene aerogels via supercritical ethanol drying and high-temperature thermal reduction. Sci. Rep. 2017, 7, 1439. [Google Scholar] [CrossRef] [PubMed] [Green Version]
- Chi, C.; Xu, H.; Zhang, K.; Wang, Y.; Zhang, S.; Liu, X.; Liu, X.; Zhao, J.; Li, Y. 3D hierarchical porous graphene aerogels for highly improved adsorption and recycled capacity. Mater. Sci. Eng. B 2015, 194, 62–67. [Google Scholar] [CrossRef]
- Tang, B.; Wang, Y.; Qiu, M.; Zhang, S. A full-band sunlight-driven carbon nanotube/PEG/SiO2 composites for solar energy storage. Sol. Energy Mater. Sol. Cells 2014, 123, 7–12. [Google Scholar] [CrossRef]
- Wei, Q.; Mukaida, M.; Kirihara, K.; Naitoh, Y.; Ishida, T. Polymer thermoelectric modules screen-printed on paper. RSC Adv. 2014, 4, 28802–28806. [Google Scholar] [CrossRef]


| Samples | Graphene/GNP 2:1 | Graphene/GNP 1:1 | Graphene/GNP 1:2 |
|---|---|---|---|
| Surface Area (m2/g) | 373.95 ± 0.10 | 372.74 ± 0.10 | 370.36 ± 0.10 |
| Samples | 2:1 Ratio PCM Composite | 1:1 Ratio PCM Composite | 1:2 Ratio PCM Composite |
|---|---|---|---|
| PEG wt% | 98.59 ± 0.10 | 98.06 ± 0.10 | 96.64 ± 0.10 |
| 1-TD wt% | 98.75 ± 0.10 | 98.33 ± 0.10 | 97.51 ± 0.10 |
| Samples | Graphene/GNP 2:1 | Graphene/GNP 1:1 | Graphene/GNP 1:2 |
|---|---|---|---|
| Porosity (%) | 99.03 ± 0.02 | 98.71 ± 0.02 | 98.08 ± 0.02 |
| Samples | To (°C) | Te (°C) | Tp (°C) | ΔH (J/g) | ||||
|---|---|---|---|---|---|---|---|---|
| Heating Cycle | Cooling Cycle | Heating Cycle | Cooling Cycle | Heating Cycle | Cooling Cycle | Heating Cycle | Cooling Cycle | |
| Pure PEG | 50.75 | 41.54 | 69.16 | 32.68 | 66.81 | 37.50 | 182.62 | 164.84 |
| 2:1 PEG Composite | 50.42 | 42.38 | 68.55 | 33.05 | 67.43 | 36.83 | 180.72 | 163.22 |
| 1:1 PEG Composite | 47.64 | 42.51 | 68.31 | 33.17 | 67.41 | 34.59 | 180.56 | 163.03 |
| 1:2 PEG Composite | 47.11 | 42.86 | 67.34 | 33.61 | 66.25 | 34.49 | 180.17 | 162.67 |
| Pure 1-TD | 34.47 | 36.11 | 45.23 | 20.23 | 41.63 | 27.68 | 226.09 | 213.82 |
| 2:1 1-TD Composite | 34.36 | 36.14 | 45.18 | 20.31 | 42.27 | 26.74 | 221.87 | 210.13 |
| 1:1 1-TD Composite | 34.18 | 36.22 | 45.15 | 20.56 | 42.51 | 25.32 | 220.76 | 209.79 |
| 1:2 1-TD Composite | 34.03 | 36.35 | 44.97 | 20.64 | 42.24 | 25.01 | 220.43 | 208.56 |
| Time (s) | Onset (1st) | t1 (Max) | Endset (1st) | Onset (2nd) | t2 (Max) | Endset (2nd) | Total |
|---|---|---|---|---|---|---|---|
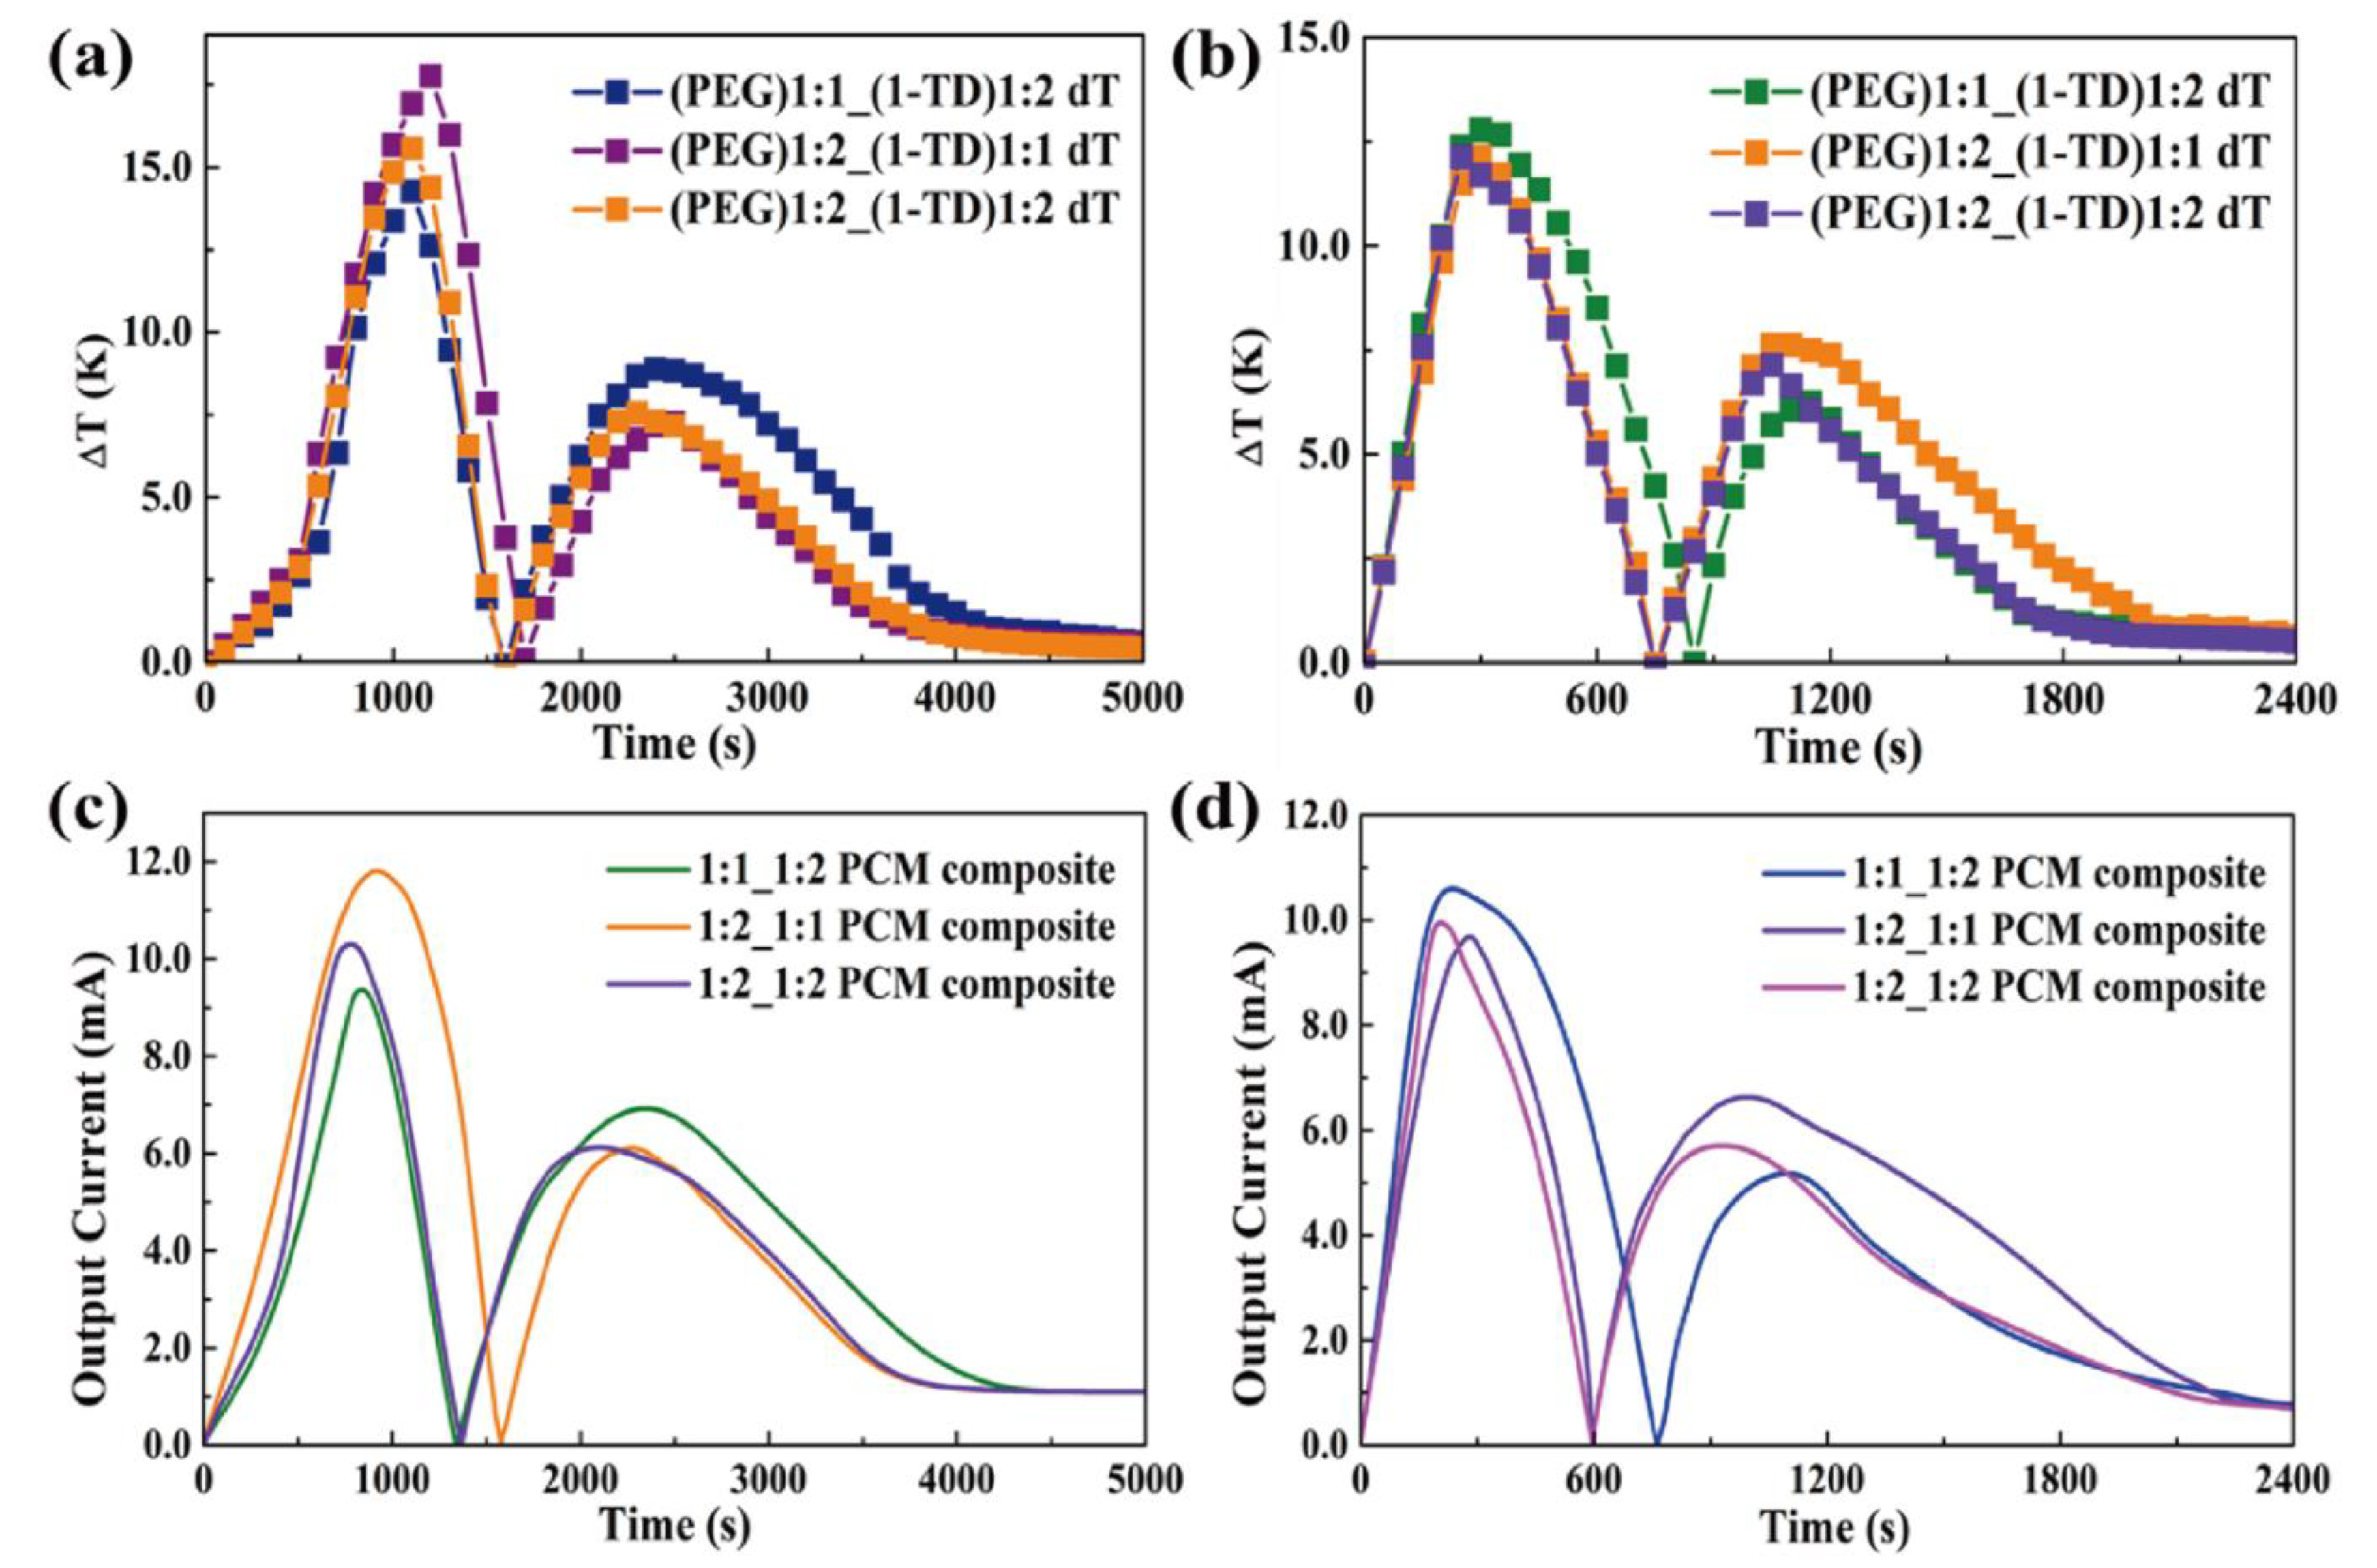
| 1:1 PEG and 1:2 1-TD | 544 | 838 | 1121 | 1778 | 2343 | 2968 | 1767 |
| 1:2 PEG and 1:1 1-TD | 380 | 919 | 1422 | 1958 | 2274 | 2647 | 1731 |
| 1:2 PEG and 1:2 1-TD | 472 | 779 | 1149 | 1746 | 2097 | 2691 | 1622 |
| Time (s) | Onset (1st) | t1 (Max) | Endset (1st) | Onset (2nd) | t2 (Max) | Endset (2nd) | Total |
|---|---|---|---|---|---|---|---|
| 1:1 PEG and 1:2 1-TD | 84 | 235 | 627 | 1048 | 1099 | 1141 | 636 |
| 1:2 PEG and 1:1 1-TD | 109 | 282 | 503 | 767 | 995 | 1404 | 1031 |
| 1:2 PEG and 1:2 1-TD | 98 | 206 | 466 | 790 | 928 | 1108 | 686 |
Publisher’s Note: MDPI stays neutral with regard to jurisdictional claims in published maps and institutional affiliations. |
© 2021 by the authors. Licensee MDPI, Basel, Switzerland. This article is an open access article distributed under the terms and conditions of the Creative Commons Attribution (CC BY) license (https://creativecommons.org/licenses/by/4.0/).
Share and Cite
Yu, C.; Song, Y.S. Analysis of Thermoelectric Energy Harvesting with Graphene Aerogel-Supported Form-Stable Phase Change Materials. Nanomaterials 2021, 11, 2192. https://doi.org/10.3390/nano11092192
Yu C, Song YS. Analysis of Thermoelectric Energy Harvesting with Graphene Aerogel-Supported Form-Stable Phase Change Materials. Nanomaterials. 2021; 11(9):2192. https://doi.org/10.3390/nano11092192
Chicago/Turabian StyleYu, Chengbin, and Young Seok Song. 2021. "Analysis of Thermoelectric Energy Harvesting with Graphene Aerogel-Supported Form-Stable Phase Change Materials" Nanomaterials 11, no. 9: 2192. https://doi.org/10.3390/nano11092192
APA StyleYu, C., & Song, Y. S. (2021). Analysis of Thermoelectric Energy Harvesting with Graphene Aerogel-Supported Form-Stable Phase Change Materials. Nanomaterials, 11(9), 2192. https://doi.org/10.3390/nano11092192