
Interaction between Graphene-Based Materials and Small Ag, Cu, and CuO Clusters: A Molecular Dynamics Study


Abstract
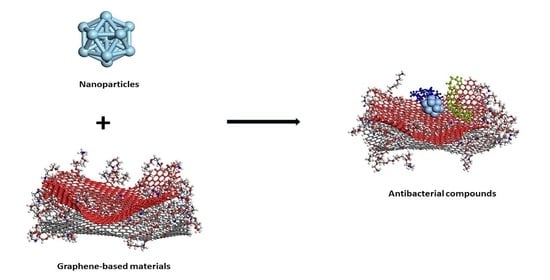
1. Introduction
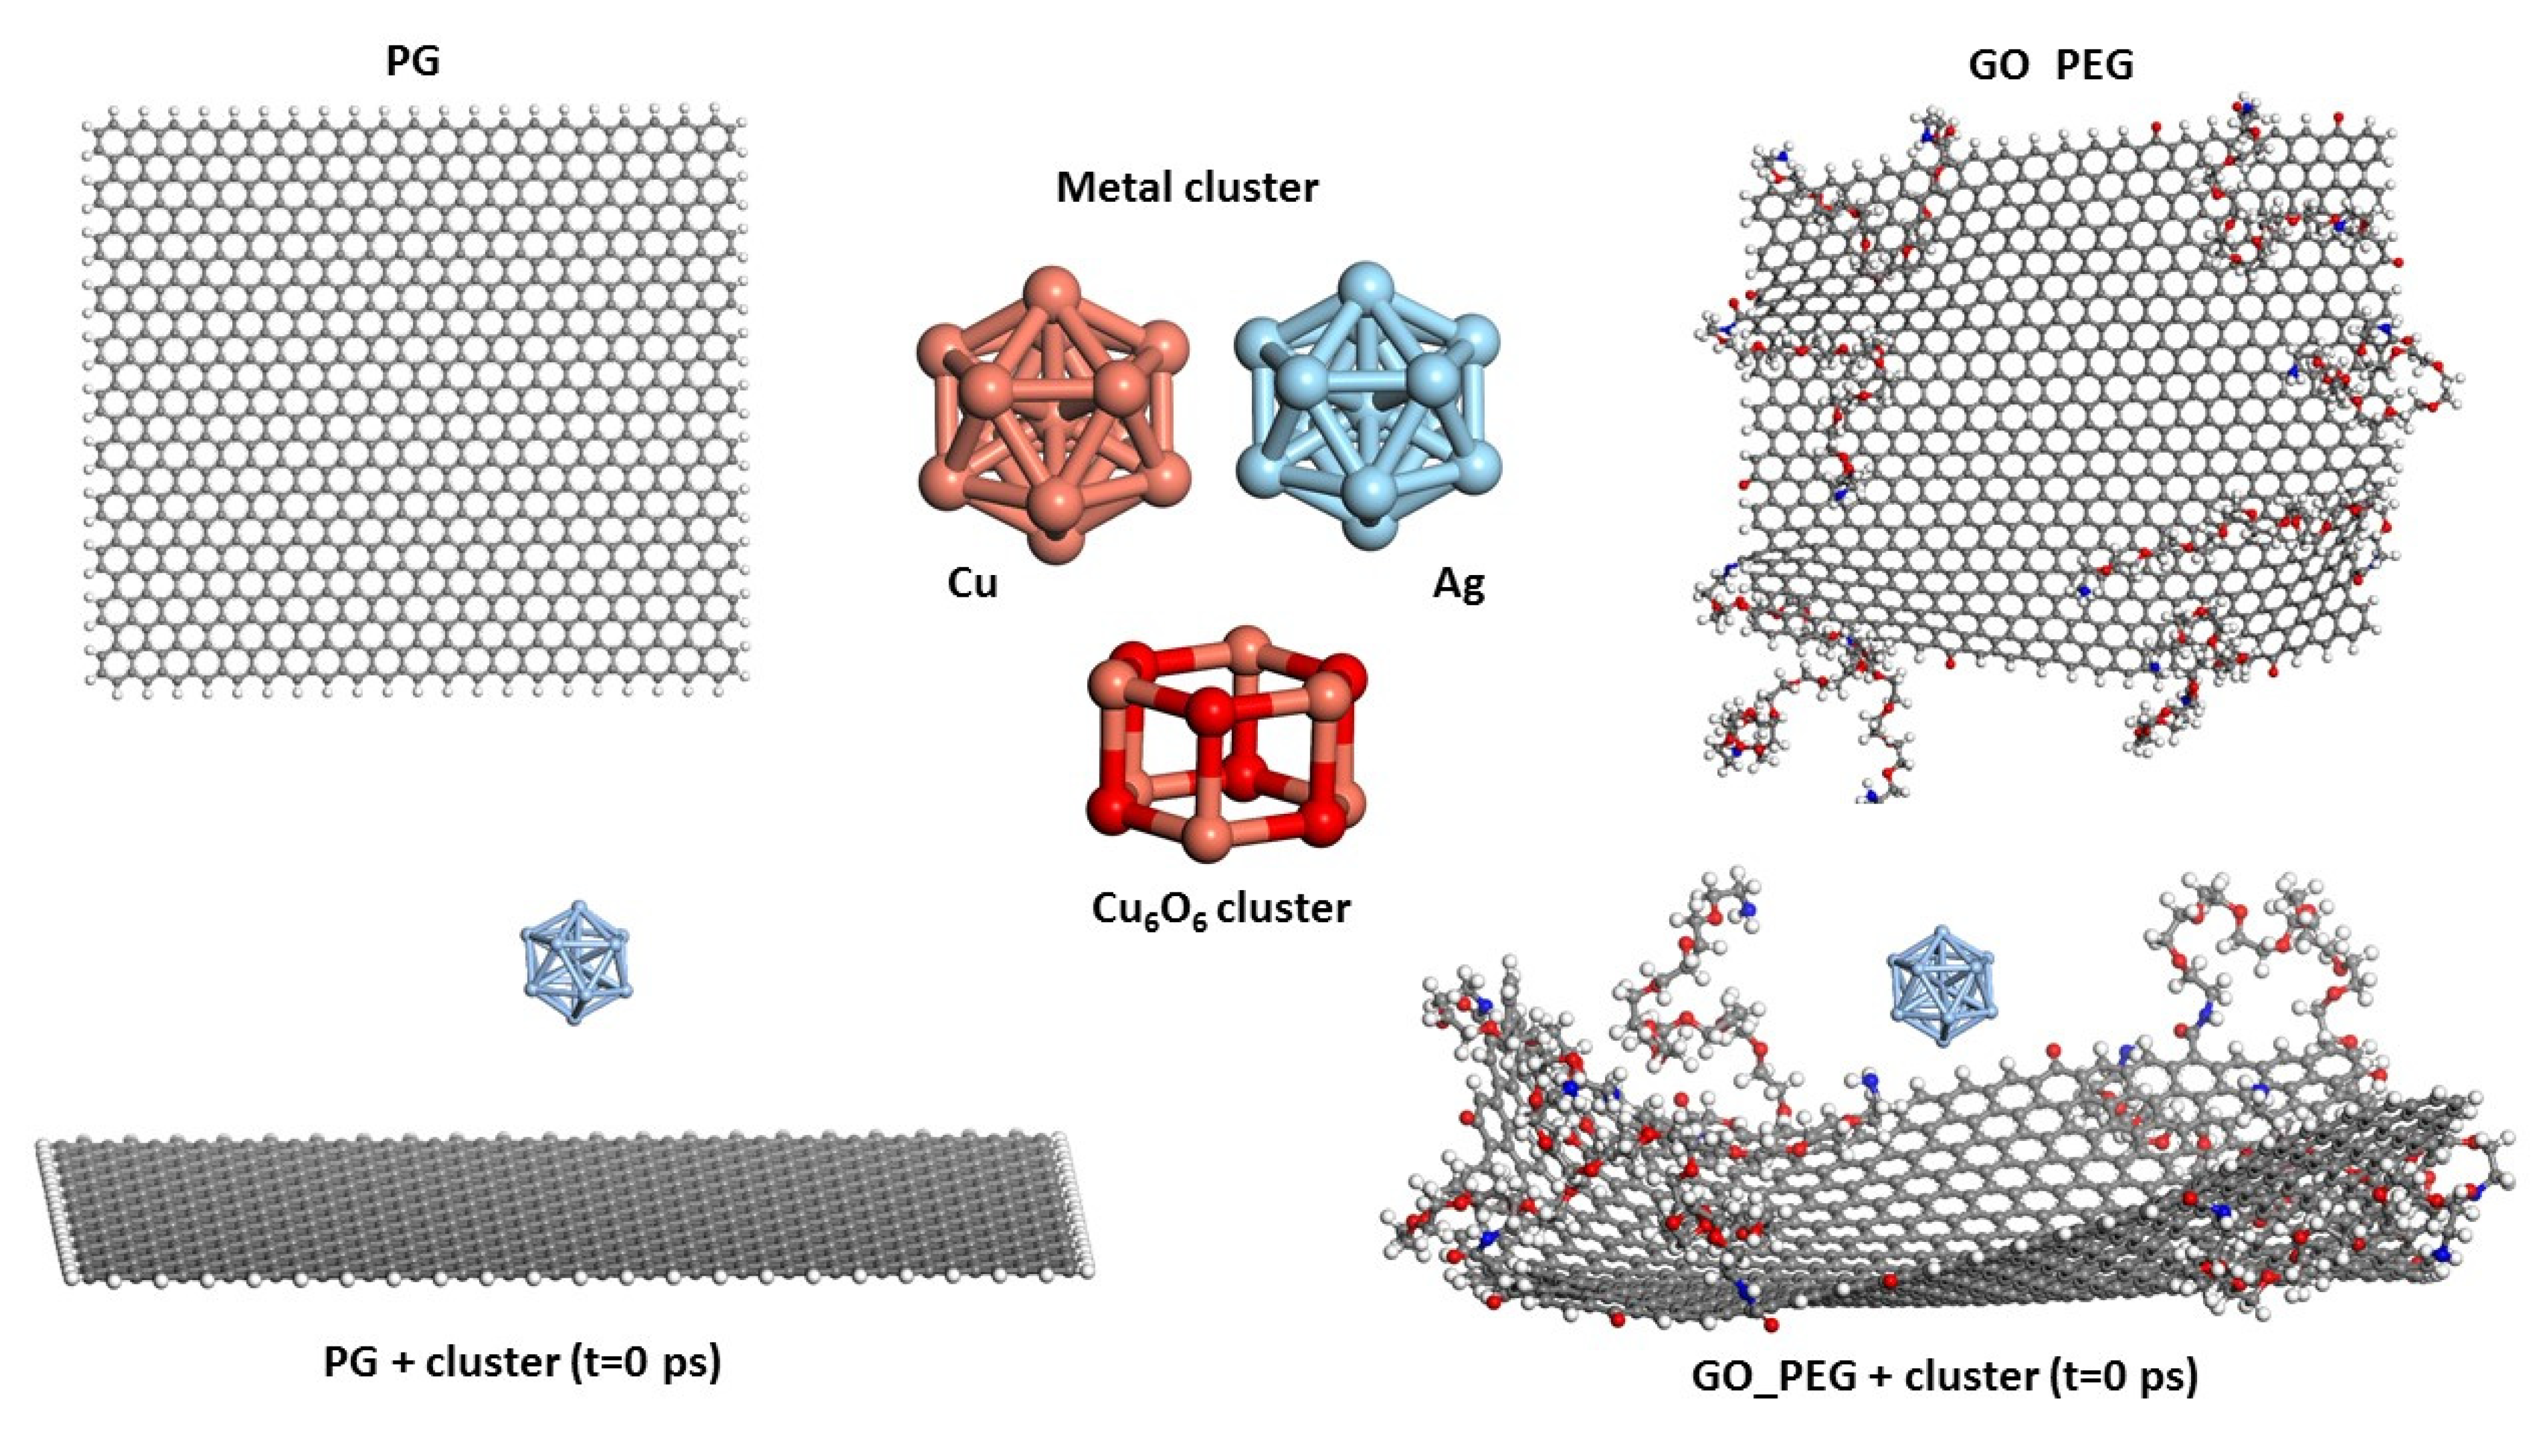
2. Models and Calculation Method
3. Results and Discussion
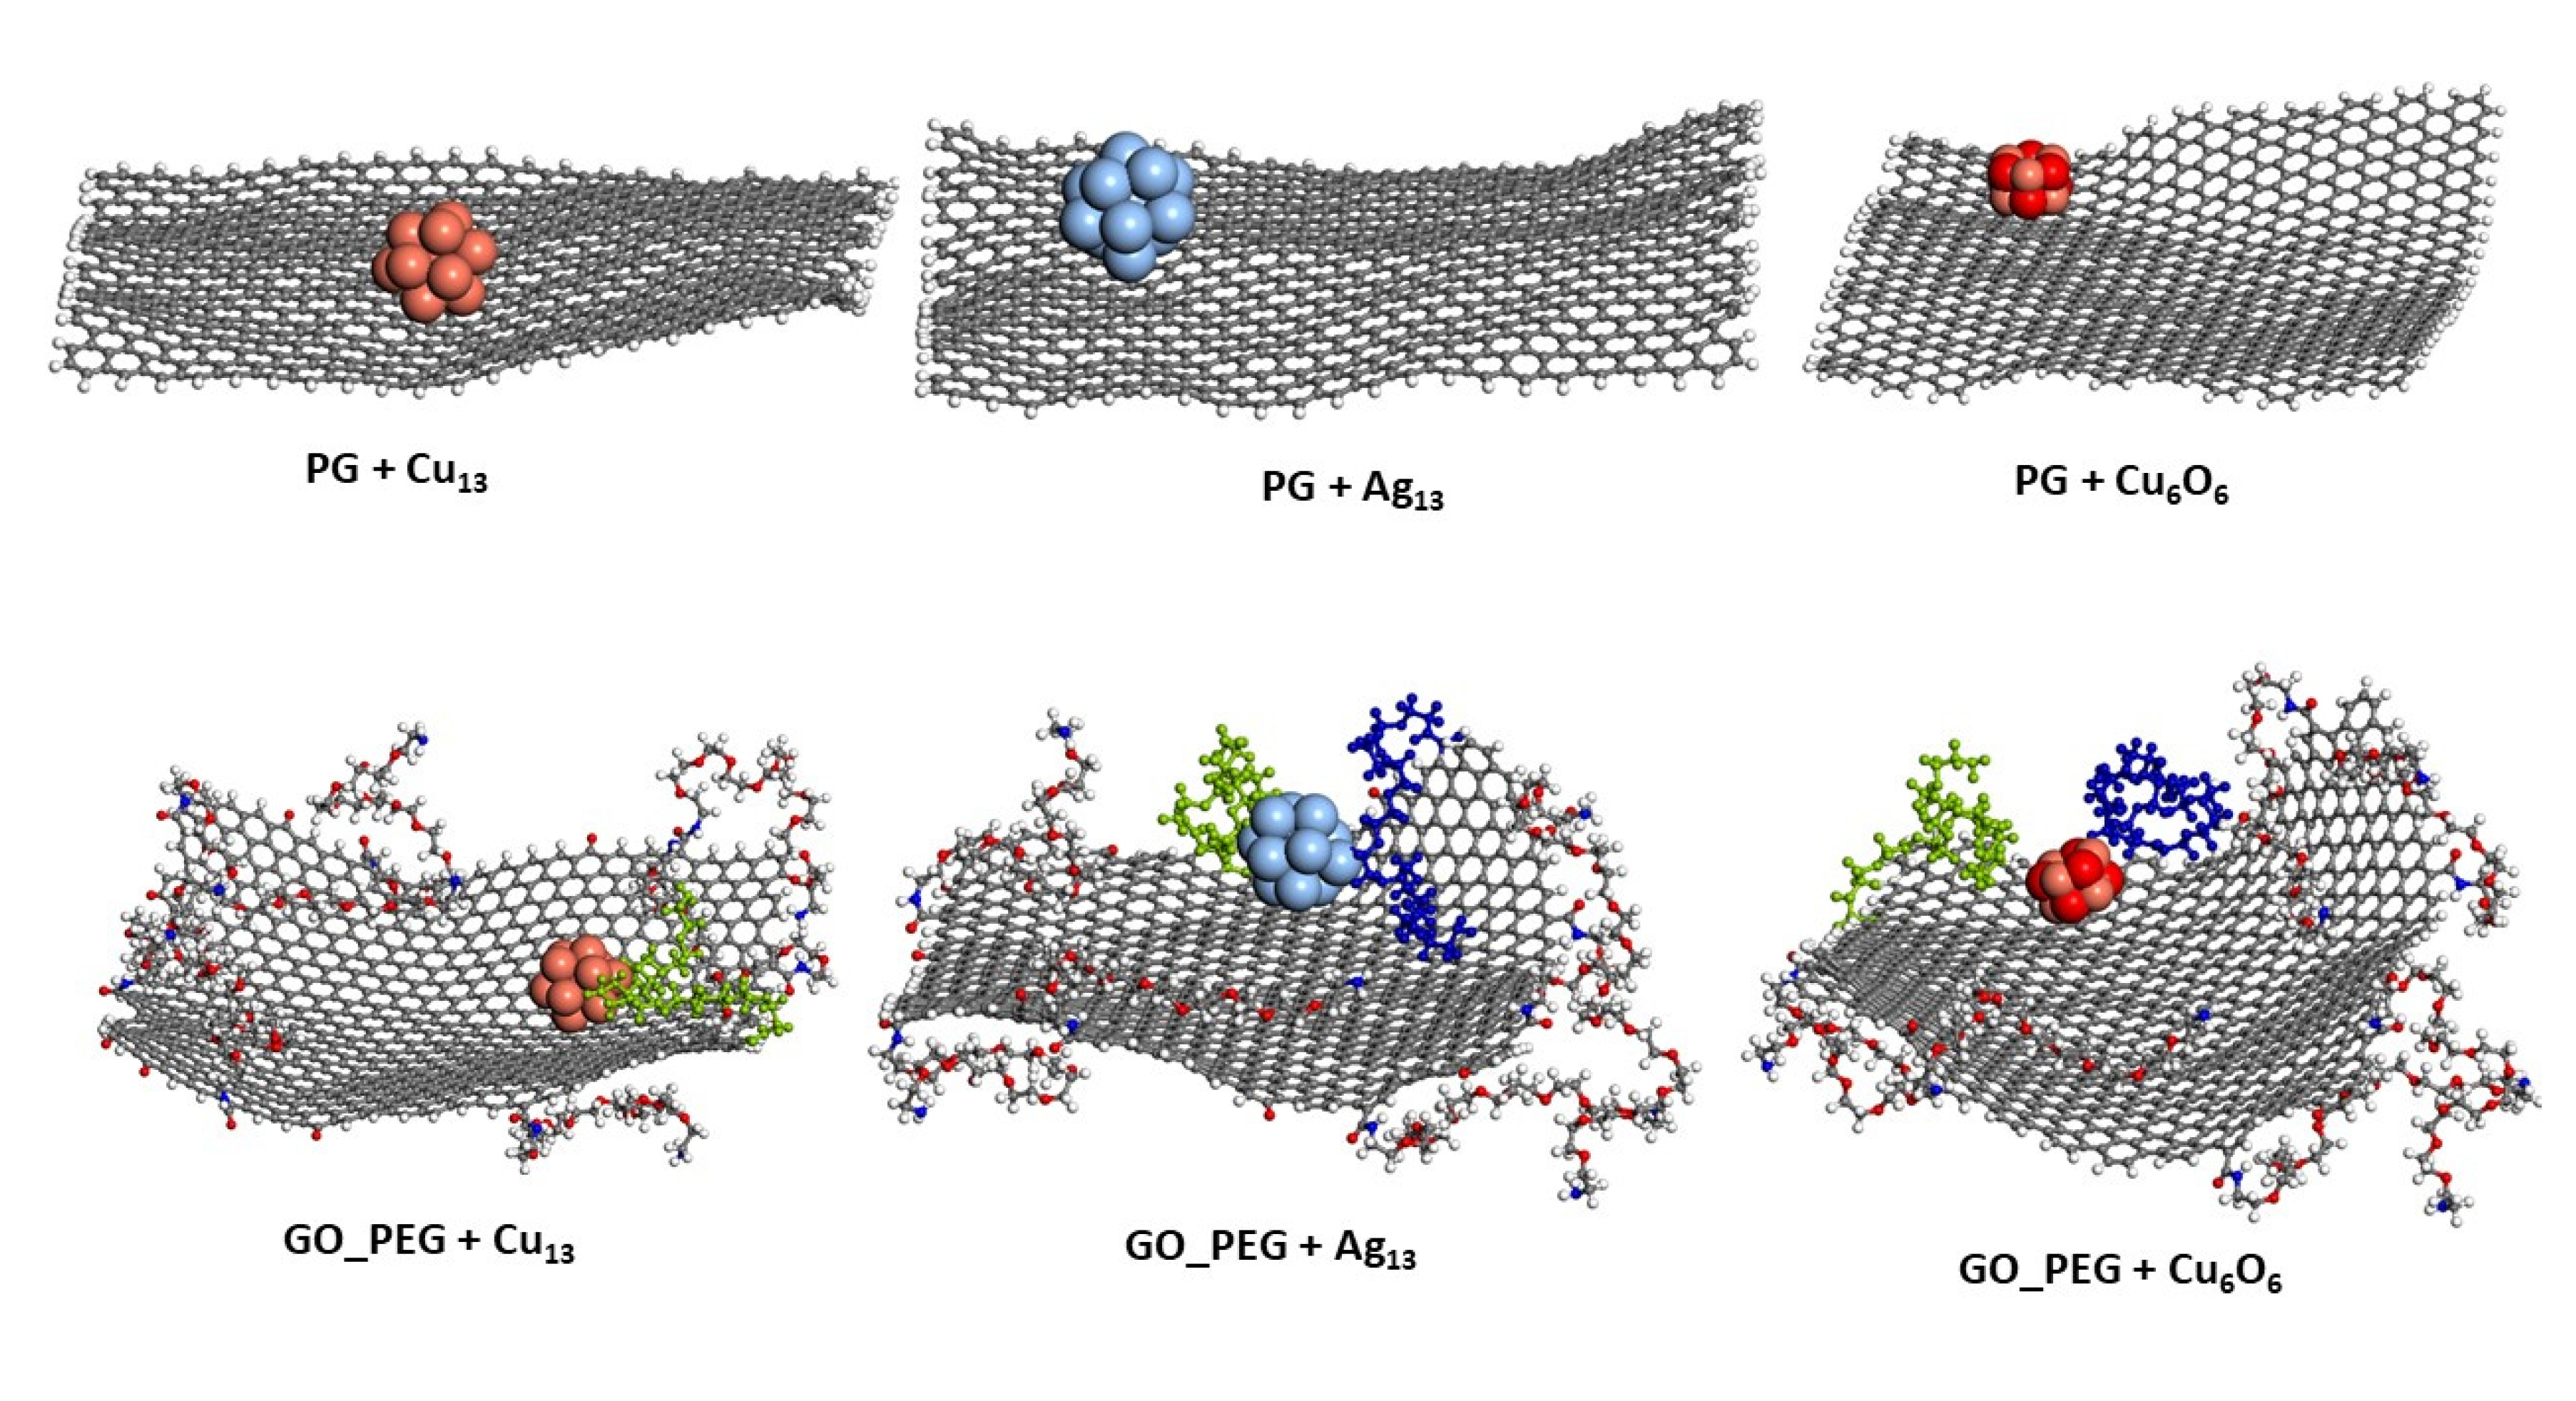
3.1. Adsorption Energies
3.2. Cluster–Surface Distances
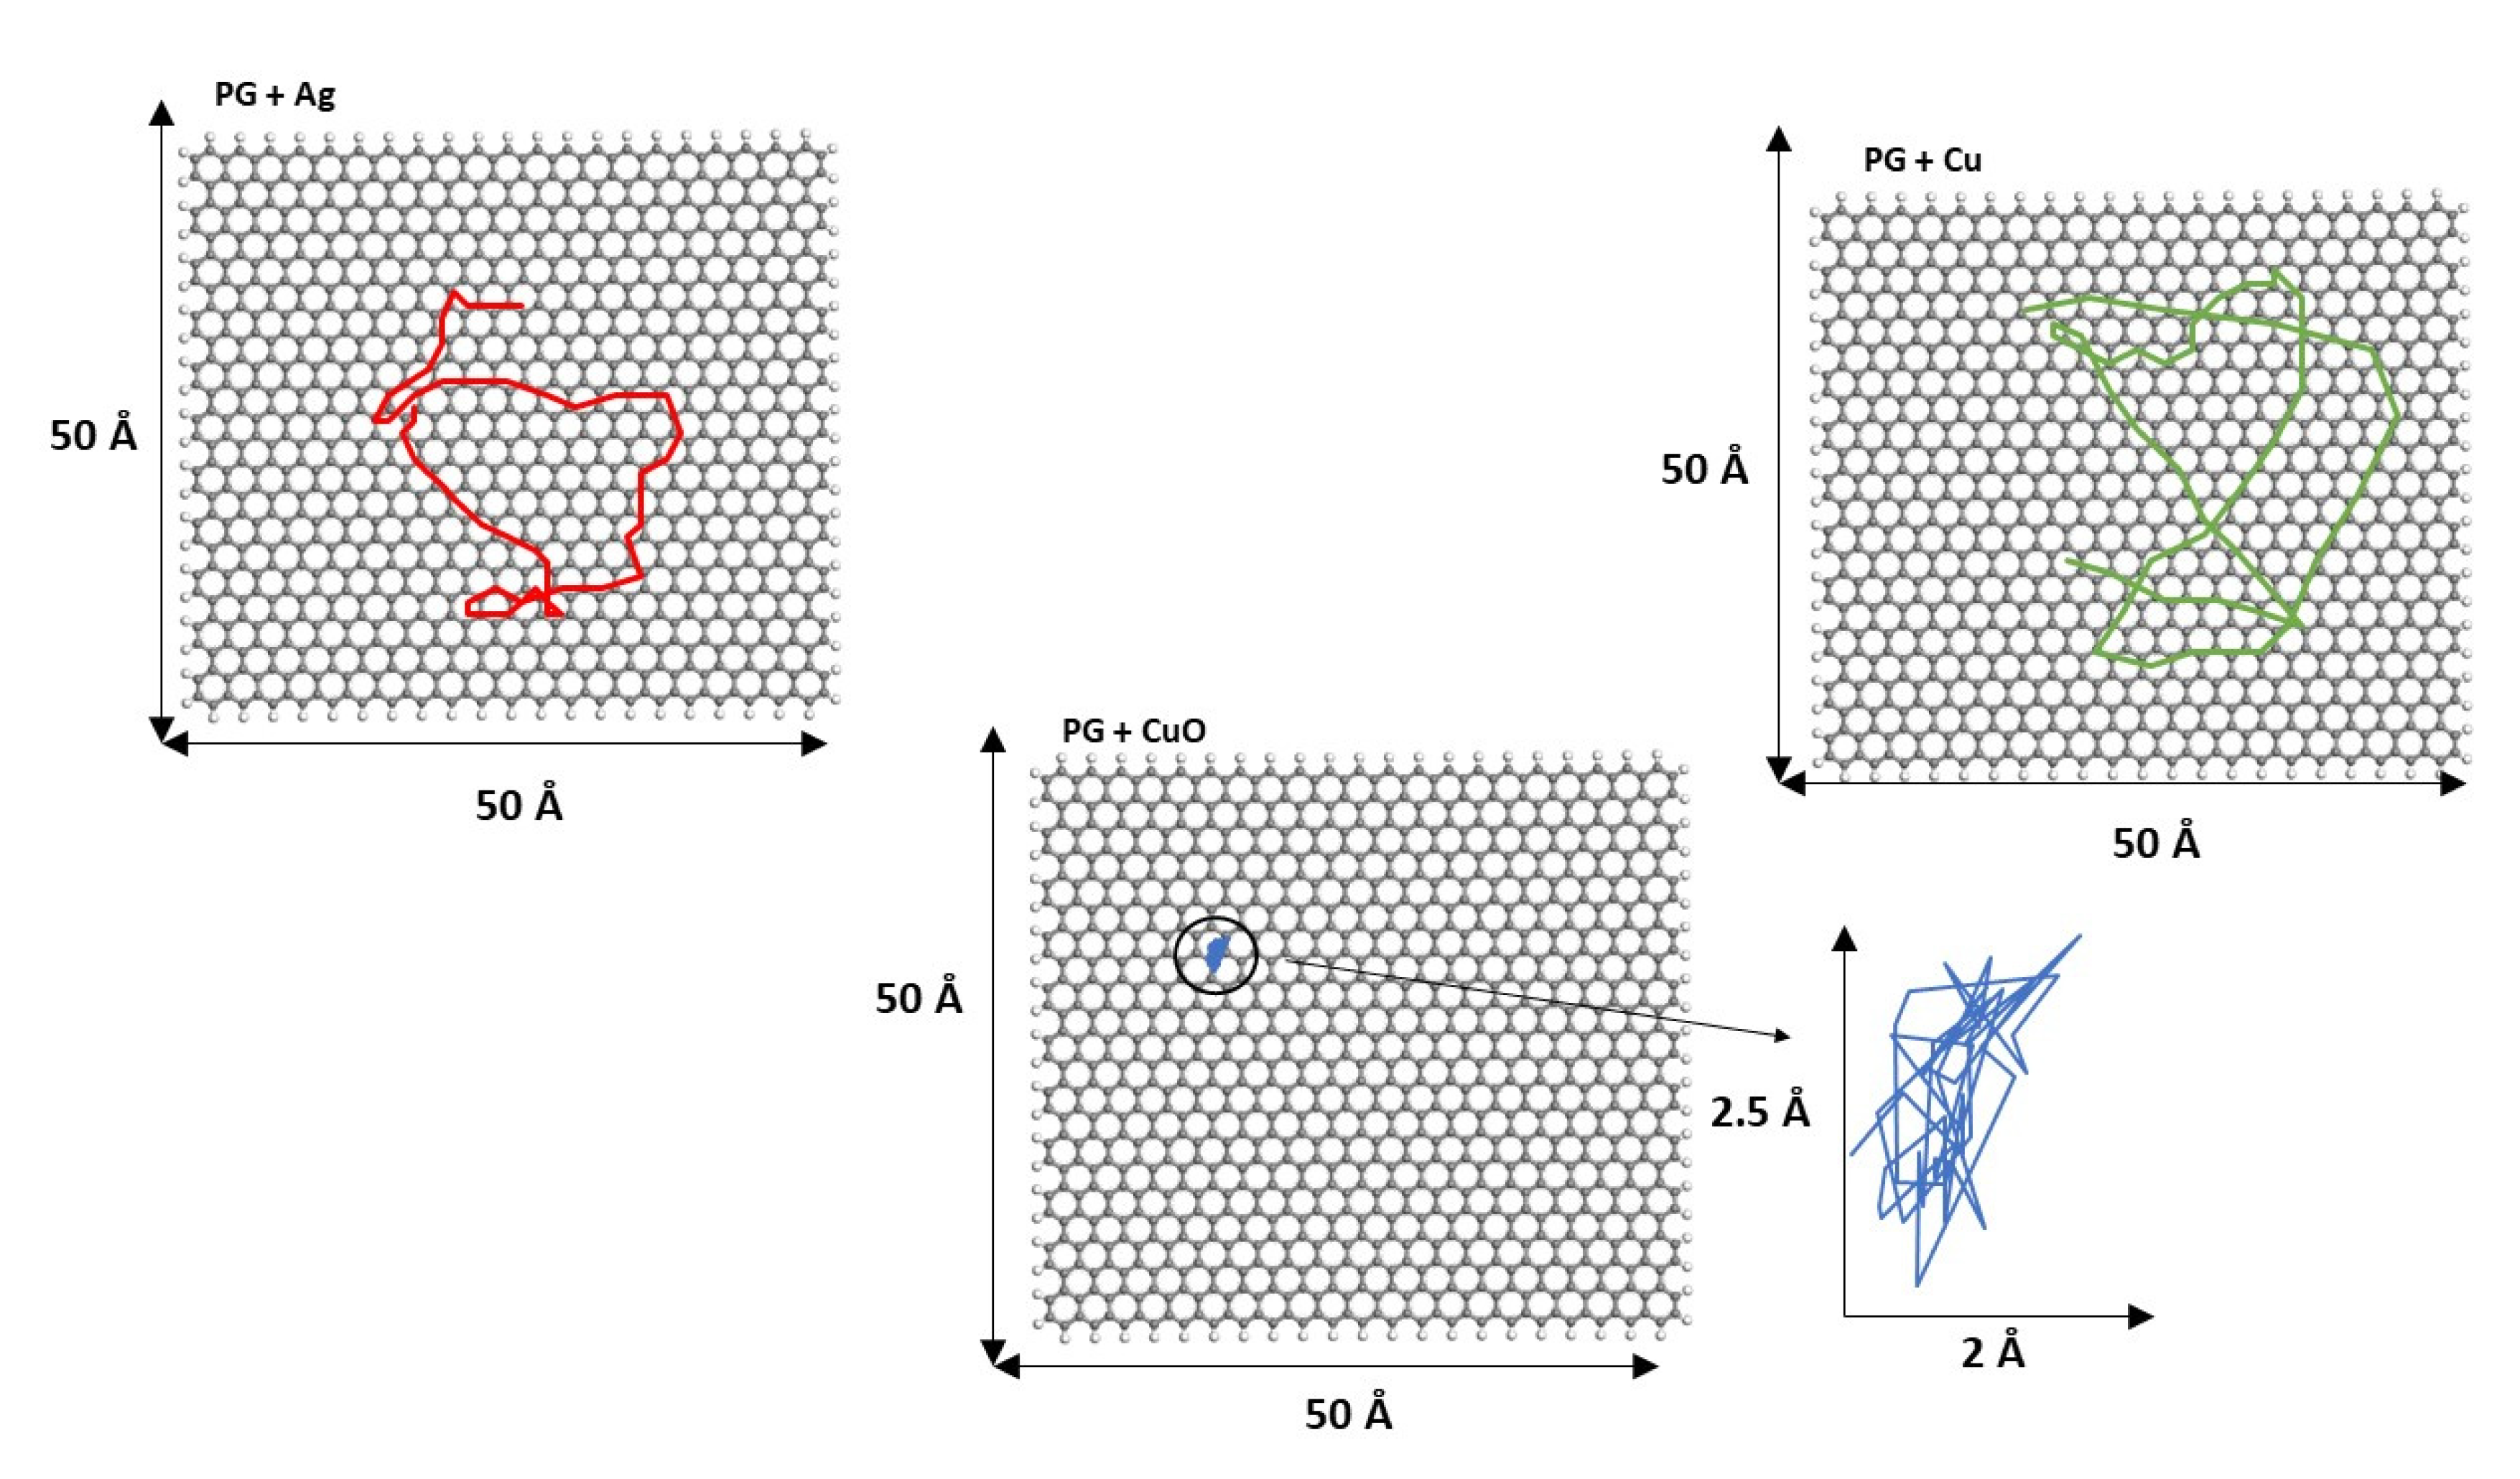
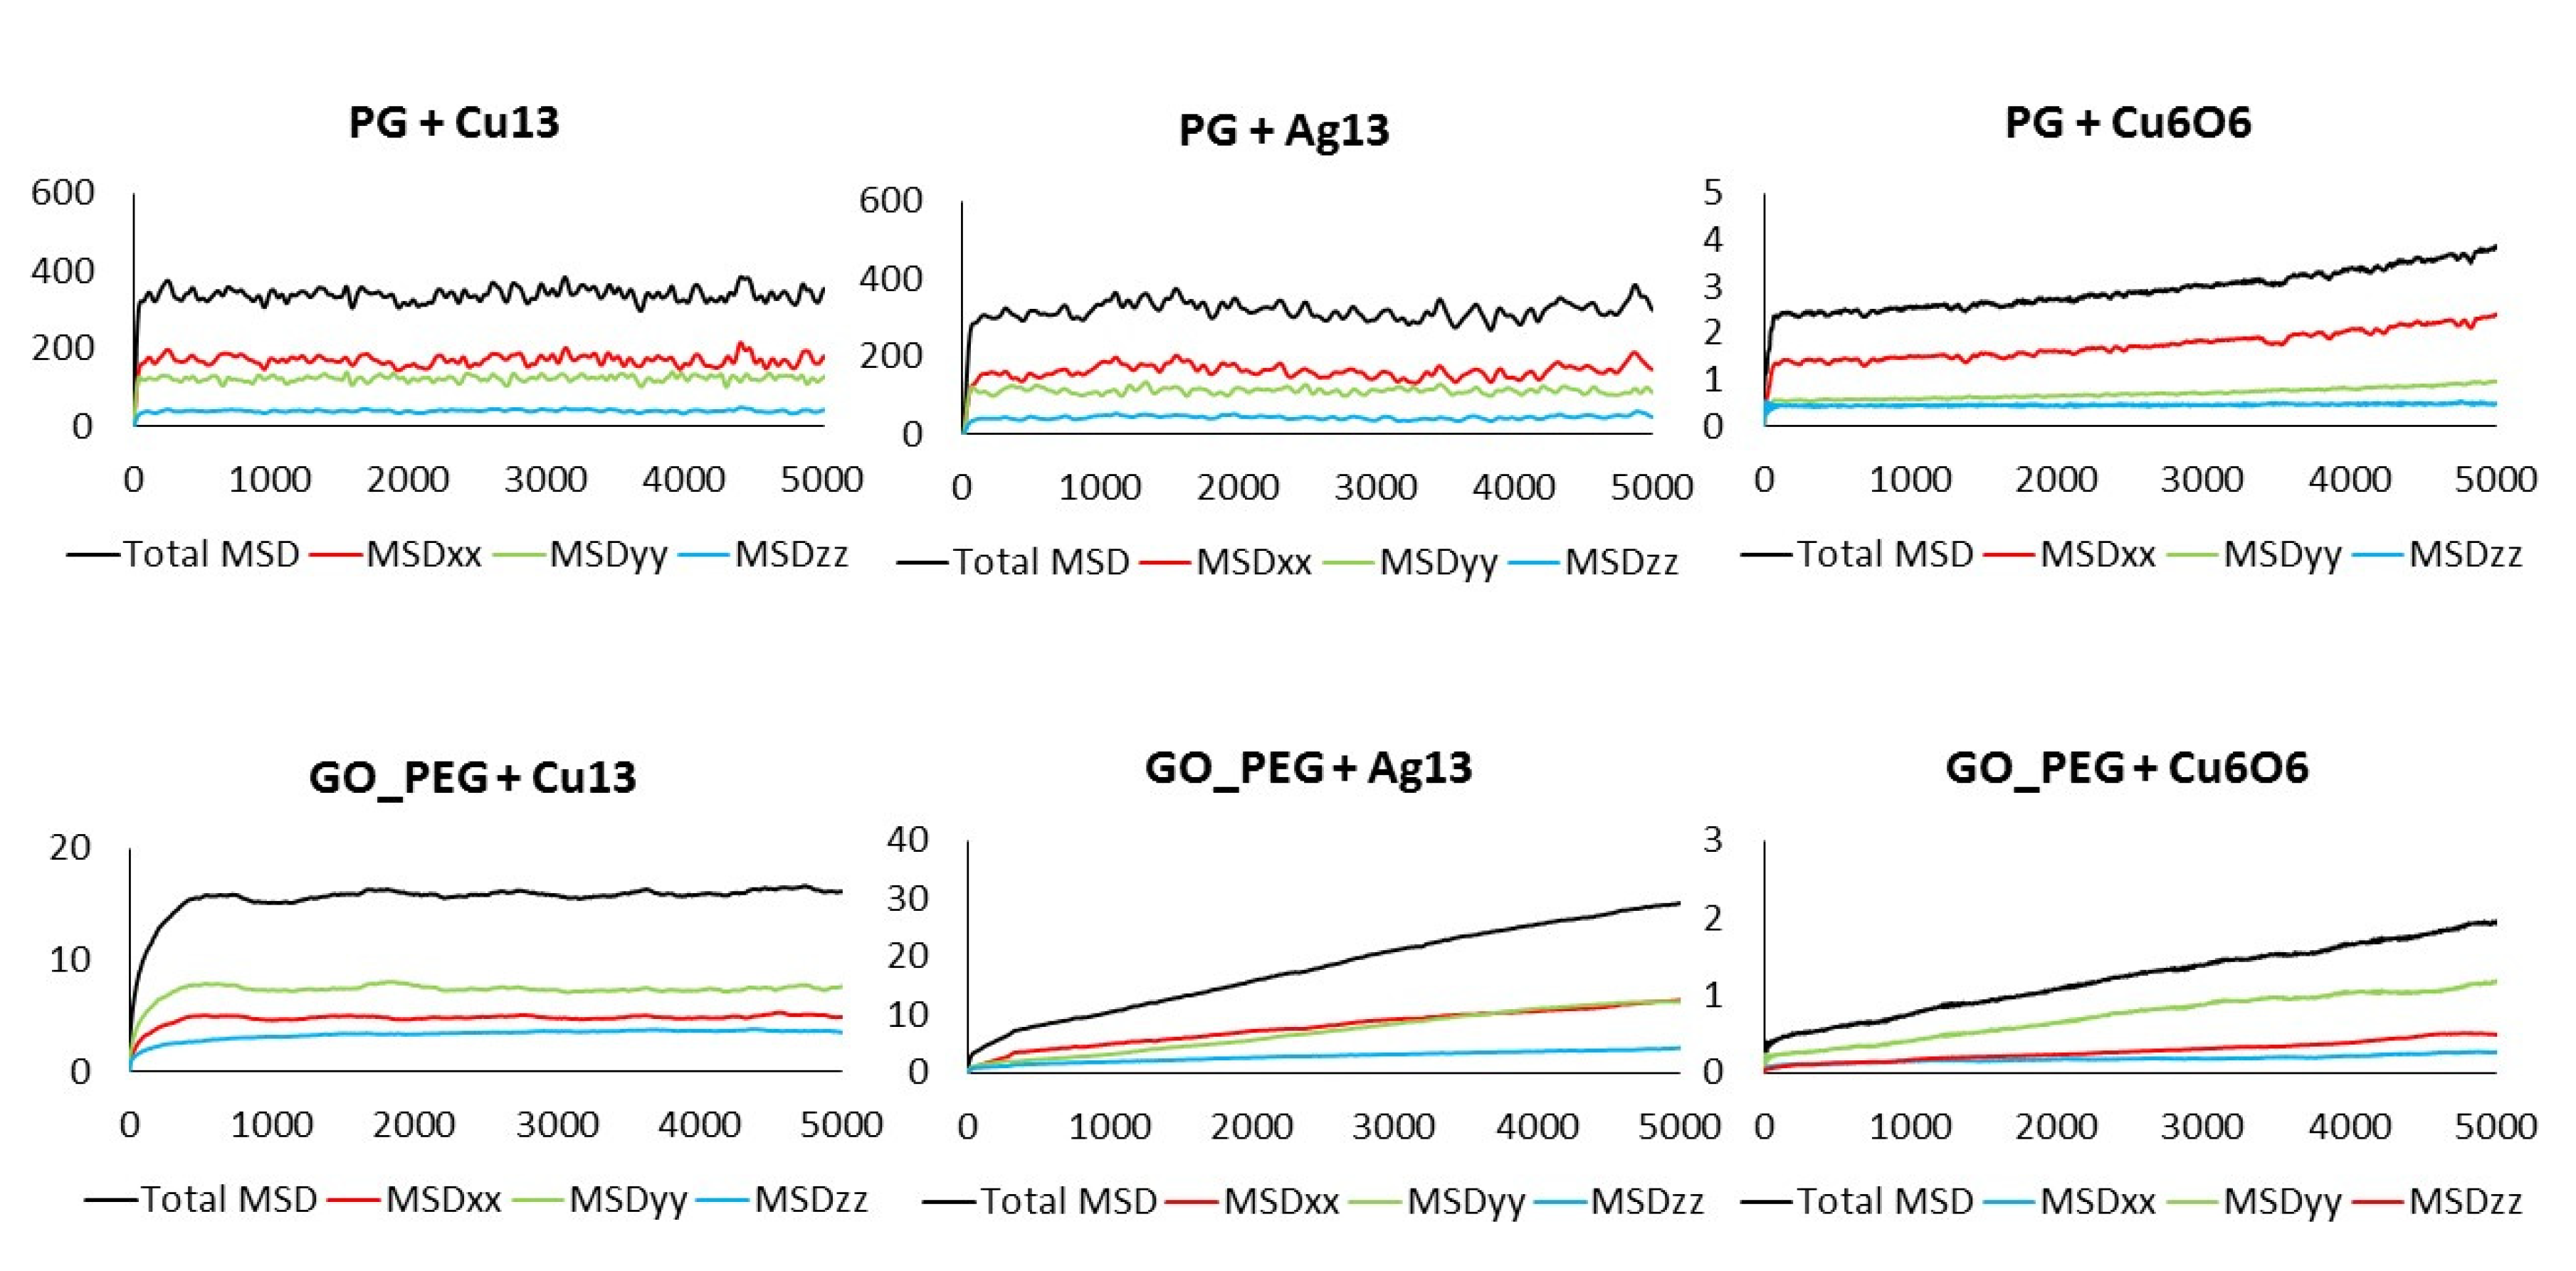
3.3. Mean Square Displacement
4. Conclusions
Supplementary Materials
Author Contributions
Funding
Informed Consent Statement
Data Availability Statement
Acknowledgments
Conflicts of Interest
References
- Hu, W.; Peng, C.; Luo, W.; Lv, M.; Li, X.; Li, D.; Huang, Q.; Fan, C. Graphene-based antibacterial paper. ACS Nano 2010, 4, 4317–4323. [Google Scholar] [CrossRef] [PubMed]
- Kumar, P.; Peipei, H.; Rongzhao, Z.; Bo, L. Antibacterial Properties of Graphene-Based Nanomaterials. Nanomaterials 2019, 9, 737. [Google Scholar] [CrossRef]
- Chen, J.; Feng, D.; Yongyou, H.; Jian, S.; Yongyang, Y. Antibacterial activity of graphene-modified anode on Shewanella oneidensis MR-1 biofilm in microbial fuel cell. J. Power Sources 2015, 290, 80–86. [Google Scholar] [CrossRef]
- Hegab, H.M.; ElMekawy, A.; Zou, L.; Mulcahy, D.; Saint, C.P.; Ginic-Markovic, M. The controversial antibacterial activity of graphene-based materials. Carbon 2016, 105, 362–376. [Google Scholar] [CrossRef]
- Li, X.; Li, F.; Gao, Z.; Fang, L. Toxicology of graphene oxide nanosheets against paecilomyces catenlannulatus. Bull. Environ. Contam. Toxicol. 2015, 95, 25–30. [Google Scholar] [CrossRef] [PubMed]
- Pieper, H.; Chercheja, S.; Eigler, S.; Halbig, C.E.; Filipovic, M.R.; Mokhir, A. Toxizität von Graphenoxid: Endoperoxide als Ursache. Angew. Chem. 2016, 128, 413–416. [Google Scholar] [CrossRef]
- Jayanthi, S.; Eswar, N.K.; Singh, S.A.; Chatterjee, K.; Madras, G.; Sood, A. Macroporous three-dimensional graphene oxide foams for dye adsorption and antibacterial applications. RSC Adv. 2016, 6, 1231–1242. [Google Scholar] [CrossRef]
- Chen, J.; Peng, H.; Wang, X.; Shao, F.; Yuan, Z.; Han, H. Graphene oxide exhibits broad-spectrum antimicrobial activity against bacterial phytopathogens and fungal conidia by intertwining and membrane perturbation. Nanoscale 2014, 6, 1879–1889. [Google Scholar] [CrossRef] [PubMed]
- Sengupta, I.; Bhattacharya, P.; Talukdar, M.; Neogi, S.; Pal, S.K.; Chakraborty, S. Bactericidal effect of graphene oxide and reduced graphene oxide: Influence of shape of bacteria. Colloid Interface Sci. Commun. 2019, 28, 60–68. [Google Scholar] [CrossRef]
- Trinh, L.T.; Quynh, L.A.B.; Hieu, N.H. Synthesis of zinc oxide/graphene oxide nanocomposite material for antibacterial application. Int. J. Nanotechnol. 2018, 15, 108–117. [Google Scholar] [CrossRef]
- Raja, A.; Selvakumar, K.; Rajasekaran, P.; Arunpandian, M.; Ashokkumar, S.; Kaviyarasu, K.; Bahadur, S.A.; Swaminathan, M. Visible active reduced graphene oxide loaded titania for photodecomposition of ciprofloxacin and its antibacterial activity. Colloids Surf. A Physicochem. Eng. Asp. 2019, 564, 23–30. [Google Scholar] [CrossRef]
- Yang, S.; Lei, P.; Shan, Y.; Zhang, D. Preparation and characterization of antibacterial electrospun chitosan/poly (vinyl alcohol)/graphene oxide composite nanofibrous membrane. Appl. Surf. Sci. 2018, 435, 832–840. [Google Scholar] [CrossRef]
- Tu, Q.; Zhang, Q.; Wang, Y.; Jiao, Y.; Xiao, J.; Peng, T.; Wang, J. Antibacterial properties of poly (dimethylsiloxane) surfaces modified with graphene oxide-catechol composite. Prog. Org. Coat. 2019, 129, 247–253. [Google Scholar] [CrossRef]
- Hosseini, M.; Sarafbidabad, M.; Fakhri, A.; NoorMohammadi, Z.; Tahami, S. Preparation and characterization of MnS2/chitosan-sodium alginate and calcium alginate nanocomposites for degradation of analgesic drug: Photocorrosion, mechanical, antimicrobial and antioxidant properties studies. Int. J. Biol. Macromol. 2018, 118, 1494–1500. [Google Scholar] [CrossRef]
- Liu, Y.; Wen, J.; Gao, Y.; Li, T.; Wang, H.; Yan, H.; Niu, B.; Guo, R. Antibacterial graphene oxide coatings on polymer substrate. Appl. Surf. Sci. 2018, 436, 624–630. [Google Scholar] [CrossRef]
- Teymourinia, H.; Salavati-Niasari, M.; Amiri, O.; Yazdian, F. Application of green synthesized TiO2/Sb2S3/GQDs nanocomposite as high efficient antibacterial agent against E. coli and Staphylococcus aureus. Mater. Sci. Eng. C 2019, 99, 296–303. [Google Scholar] [CrossRef]
- Wang, X.; Han, Q.; Yu, N.; Wang, T.; Wang, C.; Yang, R. GO-AgCl/Ag nanocomposites with enhanced visible light-driven catalytic properties for antibacterial and biofilm-disrupting applications. Colloids Surf. B Biointerfaces 2018, 162, 296–305. [Google Scholar] [CrossRef] [PubMed]
- Naeem, H.; Ajmal, M.; Qureshi, R.B.; Muntha, S.T.; Farooq, M.; Siddiq, M. Facile synthesis of graphene oxide–silver nanocomposite for decontamination of water from multiple pollutants by adsorption, catalysis and antibacterial activity. J. Environ. Manag. 2019, 230, 199–211. [Google Scholar] [CrossRef]
- Moghayedi, M.; Goharshadi, E.K.; Ghazvini, K.; Ahmadzadeh, H.; Ranjbaran, L.; Masoudi, R.; Ludwig, R. Kinetics and mechanism of antibacterial activity and cytotoxicity of Ag-RGO nanocomposite. Colloids Surf. B Biointerfaces 2017, 159, 366–374. [Google Scholar] [CrossRef] [PubMed]
- Huo, P.; Liu, C.; Wu, D.; Guan, J.; Li, J.; Wang, H.; Tang, Q.; Li, X.; Yan, Y.; Yuan, S. Fabricated Ag/Ag2S/reduced graphene oxide composite photocatalysts for enhancing visible light photocatalytic and antibacterial activity. J. Ind. Eng. Chem. 2018, 57, 125–133. [Google Scholar] [CrossRef]
- Deng, C.H.; Gong, J.L.; Zeng, G.M.; Zhang, P.; Song, B.; Zhang, X.G.; Liu, H.Y.; Huan, S.Y. Graphene sponge decorated with copper nanoparticles as a novel bactericidal filter for inactivation of Escherichia coli. Chemosphere 2017, 184, 347–357. [Google Scholar] [CrossRef]
- Ouyang, Y.; Cai, X.; Shi, Q.; Liu, L.; Wan, D.; Tan, S. Poly-l-lysine-modified reduced graphene oxide stabilizes the copper nanoparticles with higher water-solubility and long-term additively antibacterial activity. Colloids Surf. B Biointerfaces 2013, 107, 107–114. [Google Scholar] [CrossRef] [PubMed]
- Yang, Z.; Hao, X.; Chen, S.; Ma, Z.; Wang, W.; Wang, C.; Yue, L.; Sun, H.; Shao, Q.; Murugadoss, V. Long-term antibacterial stable reduced graphene oxide nanocomposites loaded with cuprous oxide nanoparticles. J. Colloid Interface Sci. 2019, 533, 13–23. [Google Scholar] [CrossRef] [PubMed]
- Feng, Y.; Chang, Y.; Sun, X.; Liu, N.; Cheng, Y.; Feng, Y.; Zhang, H.; Li, X. Understanding the Property–Activity Relationships of Polyhedral Cuprous Oxide Nanocrystals in Terms of Reactive Crystallographic Facets. Toxicol. Sci. 2017, 156, 480–491. [Google Scholar] [CrossRef] [PubMed][Green Version]
- Zavareh, S.; Norouzi, E. Impregnation of GO with Cu2+ for enhancement of aniline adsorption and antibacterial activity. J. Water Process Eng. 2017, 20, 160–167. [Google Scholar] [CrossRef]
- Liu, H.; Lv, M.; Deng, B.; Li, J.; Yu, M.; Huang, Q.; Fan, C. Laundering durable antibacterial cotton fabrics grafted with pomegranate-shaped polymer wrapped in silver nanoparticle aggregations. Sci. Rep. 2014, 4, 5920. [Google Scholar] [CrossRef] [PubMed]
- Liu, Z.; Joshua, T.R.; Hongjie, D. PEGylated Nanographene Oxide for Delivery of Water-Insoluble Cancer Drugs. J. Am. Chem. Soc. 2008, 130, 10876–10877. [Google Scholar] [CrossRef] [PubMed]
- Ghosh, S.; Chatterjee, K. Poly(Ethylene Glycol) Functionalized Graphene Oxide in Tissue Engineering: A Review on Recent Advances. Int. J. Nanomed. 2020, 15, 5991–6006. [Google Scholar] [CrossRef] [PubMed]
- Chen, D.; Feng, H.; Li, J. Graphene oxide: Preparation, functionalization, and electrochemical applications. Chem. Rev. 2012, 112, 6027–6053. [Google Scholar] [CrossRef]
- Yang, K.; Wan, J.; Zhang, S.; Zhang, Y.; Lee, S.T.; Liu, Z. In vivo pharmacokinetics, long-term biodistribution, and toxicology of PEGylated graphene in mice. ACS Nano. 2011, 5, 516–522. [Google Scholar] [CrossRef]
- Demirel, E.; Karaca, E.; Durmaz, Y. Effective PEGylation method to improve biocompatibility of graphene derivatives. Eur. Polym. J. 2020, 124, 10876–109504. [Google Scholar] [CrossRef]
- Luo, N.; Weber, J.K.; Wang, S. PEGylated graphene oxide elicits strong immunological responses despite surface passivation. Nat. Commun. 2017, 8, 14537. [Google Scholar] [CrossRef]
- Kamberaj, H. Molecular Dynamics Simulations in Statistical Physics: Theory and Applications; Springer Nature Switzerland AG: Cham, Switzerland, 2020. [Google Scholar]
- Haghighi, S.; Ansari, R.; Ajori, S. A molecular dynamics study on the interfacial properties of carbene-functionalized graphene/polymer nanocomposites. Int. J. Mech. Mater. Des. 2020, 16, 387–400. [Google Scholar] [CrossRef]
- Lado-Touriño, I.; Cerpa-Naranjo, A.; Arce, M.P. A molecular dynamics modelling adsorption study of Cu and Ag nanoparticles on pristine and functionalized graphene surfaces. Mater. Today Proc. 2020, 33, 1830–1834. [Google Scholar] [CrossRef]
- Xiunan, W.; Yi, L.; Jingcheng, X.; Shengjuan, L.; Fada, Z.; Qian, Y.; Xiao, Z.; Xinluo, Z. Molecular Dynamics Study of Stability and Diffusion of Graphene-Based Drug Delivery Systems. J. Nanomat. 2015, 16, 872079. [Google Scholar]
- Safina, L.L.; Baimov, J.A. Molecular dynamics simulation of fabrication of Ni-graphene composite: Temperature effect. Micro Nano Lett. 2020, 15, 176–180. [Google Scholar] [CrossRef]
- Bačová, P.; Rissanou, A.; Harmandaris, V.A. Edge-Functionalized Graphene as a Nanofiller: Molecular Dynamics Simulation Study. Macromolecules 2015, 48, 9024–9038. [Google Scholar] [CrossRef]
- Georgios, K.; Rakesh, P.; Soumyadipta, S.; Kostas, K.; Arun, V.; Alexey, V.L. Nanostructure and Dynamics of Humidified Nafion-GrapheneOxide Composites via Molecular Dynamics Simulations. J. Phys. Chem. C 2018, 122, 22864–22875. [Google Scholar]
- Georgios, K.; Kostas, K. Temperature dependence of dynamic and mechanical properties in poly(acrylic acid)/graphene oxide nanocomposites. Mater. Today Commun. 2017, 13, 359–366. [Google Scholar]
- Chen, J.; Chen, L.; Wang, Y. Molecular dynamics simulations of the adsorption of DNA segments onto graphene oxide. J. Phys. D Appl. Phys. 2014, 47, 505401. [Google Scholar] [CrossRef]
- Azimi, M.; Mirjavadi, S.S.; Hamouda, A.M.S. Heterogeneities in polymer structural and dynamic properties in graphene and graphene oxide nanocomposites: Molecular dynamics simulations. Macromol. Theory Simul. 2017, 26, 1600086. [Google Scholar] [CrossRef]
- Roza-Eleftheria, R.; Karatasos, K. Graphene/poly(ethylene glycol) nanocomposites as studied by molecular dynamics simulations. Mater. Des. 2016, 97, 163–174. [Google Scholar]
- Mirhosseini, M.M.; Seyed, S.Z.; Reza, K. Molecular dynamics simulation of functionalized graphene surface for high efficient loading of doxorubicin. J. Mol. Struct. 2017, 1141, 441–450. [Google Scholar] [CrossRef]
- Xu, L.; Xiaoning, Y. Molecular dynamics simulation of adsorption of pyrene–polyethylene glycol onto graphene. J. Colloid Interface Sci. 2014, 418, 66–73. [Google Scholar] [CrossRef]
- Mahdavi, M.; Fattahi, A.; Tajkhorshid, E.; Nouranian, S. Molecular insights into the loading and dynamics of doxorubicin on PEGylated graphene oxide nanocarriers. ACS Appl. Bio Mater. 2020, 3, 1354–1363. [Google Scholar] [CrossRef]
- Kumar, S.; Parekh, S.H. Linking graphene-based material physicochemical properties with molecular adsorption, structure and cell fate. Commun. Chem. 2020, 3, 8. [Google Scholar] [CrossRef]
- Bedrov, D.; Smith, G.D. Molecular Dynamics Simulation Study of the Structure of Poly(ethylene oxide) Brushes on Nonpolar Surfaces in Aqueous Solution. Langmuir 2006, 22, 6189–6194. [Google Scholar] [CrossRef] [PubMed]
- Biovia Materials Studio, an Integrated, Multi-Scale Modelling Environment. Available online: https://www.3ds.com/products-services/biovia/products/molecular-modeling-simulation/biovia-materials-studio (accessed on 4 March 2021).
- Sun, H.; Pengyu, R.; Fried, J.R. The COMPASS force field: Parameterization and validation for phosphazenes. Comput. Theor. Polym. Sci. 1998, 8, 229–246. [Google Scholar] [CrossRef]
- Rahmani, F.; Mahdavi, M.; Nouranian, S.; Al-Ostaz, A. Confinement effects on the thermal stability of poly(ethylene oxide)/graphene nanocomposites: A reactive molecular dynamics simulation study. J. Polym. Sci. B Polym. Phys. 2017, 55, 1026–1035. [Google Scholar] [CrossRef]
- Cha, J.; Kyoung, W.; Song, K.; Park, S.; Lim, T.; Lee, J.; Kang, H. Quantitative Evaluation of the Dispersion of Graphene Sheets With and Without Functional Groups Using Molecular Dynamics Simulations. Nanoscale Res. Lett. 2016, 11, 136. [Google Scholar] [CrossRef]
- Hoover, W.G. Canonical dynamics: Equilibrium phase-space distributions. Phys. Rev. A 1985, 31, 1695–1697. [Google Scholar] [CrossRef]
- Nosé, S. A molecular dynamics method for simulations in the canonical ensemble. Mol. Phys. 1984, 52, 255–268. [Google Scholar] [CrossRef]
- Böyükata, M.; Jadson, C.B. Structural and Energetic Analysis of Copper Clusters: MD Study of Cun (n = 2–45). J. Braz. Chem. Soc. 2008, 19, 884–893. [Google Scholar] [CrossRef]
- Rao, Y.; Yimin, L.; Xiangyuan, C.; Zongwen, L.; Fuyi, C. Optical and magnetic properties of Cu-doped 13-atom Ag nanoclusters. J. Alloys Compd. 2013, 56, 50–55. [Google Scholar] [CrossRef]
- Sriram, S.; Rubalya, V.; Chandiramouli, R. Structural and Electronic Properties of CuO, CuO2 and Cu2O Nanoclusters –a DFT Approach. Mater. Sci. 2015, 21, 173–178. [Google Scholar]
- Mirhosseini, M.M.; Haddadi-Asl, V.; Zargarian, S.S. Fabrication and characterization of hydrophilic poly(ε-caprolactone)/pluronic P123 electrospun fibers. Appl. Polym. Sci. 2016, 133, 43345. [Google Scholar] [CrossRef]
- Einstein, A. A new determination of molecular dimensions. Ann. Phys. 1906, 19, 289–306. [Google Scholar]
- Metzler, R.; Jeon, J.H.; Cherstvy, A.G.; Barkai, E. Anomalous diffusion models and their properties: Non-stationarity, non-ergodicity, and ageing at the centenary of single particle tracking. Phys. Chem. Chem. Phys. 2014, 16, 24128–24164. [Google Scholar] [CrossRef]
- Rêgo, C.R.C.; Tereshchuk, P.; Oliveira, L.N.; Da Silv, J.L.F. Graphene-supported small transition metal clusters: A density functional theory investigation within van der Waals corrections. Phys. Rev. B 2017, 95, 235422. [Google Scholar] [CrossRef]
- Berahman, M.; Sheikhi, M.; Zarifkar, A.; Nadgaran, H. Structural and electronic properties of zigzag graphene nanoribbon decorated with copper cluster. J. Comput. Electron. 2015, 14, 270–279. [Google Scholar] [CrossRef]
- Del Castillo, R.M.; Sansores, L.E. Study of the electronic structure of Ag, Au, Pt and Pd clusters adsorption on graphene and their effect on conductivity. Eur. Phys. J. B 2015, 88, 248. [Google Scholar] [CrossRef]
- Martin., A.; Lebègue, S.; Erikssonand, O.; Skorodumova, N.V. Adsorption of Cu, Ag, and Au atoms on graphene including van der Waals interactions. J. Phys. Condens. Matter. 2011, 23, 395001. [Google Scholar]
- Chen, Y.J.; Lee, Y.T.; Yeh, P.L.; Wang, B.C. Optimized geometry, electronic structure and Ag adsorption property of nanosheet graphene with different symmetry shapes: A theoretical investigation. Res. Chem. Intermed. 2017, 43, 3613–3620. [Google Scholar] [CrossRef]
- Mashhadzadeh, A.H.; Vahedi, A.M.; Ardjmand, A.M.; Ahangari, M.G. Investigation of heavy metal atoms adsorption onto graphene and graphdiyne surface: A density functional theory study. Superlattices Microstruct. 2016, 100, 1094–1102. [Google Scholar] [CrossRef]
- Hidalgo-Manrique, P.; Xianzhang Lei, R.X.; Mingyu, Z.; Kinloch, I.A.; Young, R.J. Copper/graphene composites: A review. J. Mater. Sci. 2019, 54, 12236–12289. [Google Scholar] [CrossRef]
- Sun, X.; Sun, Z.; Zhang, J.; Liu, X.; Yu, F.; Cheng, X.; Zhao, X. Graphene Nucleation Preference at CuO Defects Rather Than Cu2O on Cu (111): A Combination of DFT Calculation and Experiment. ACS Appl. Mater. Interfaces 2018, 10, 43156–43165. [Google Scholar] [CrossRef]
- Ko, Y.; Shim, J.; Lee, C.H.; Lee, K.S.; Cho, H.; Lee, K.T.; Son, D.I. Synthesis and characterization of CuO/graphene (Core/shell) quantum dots for electrochemical applications. Mater. Lett. 2018, 217, 113–116. [Google Scholar] [CrossRef]
- Mohammadi-Manesh, E.; Vaezzadeh, M.; Saeidi, M. Cu- and CuO-decorated graphene as a nanosensor for H2S detection at room temperature. Surf. Sci. 2015, 636, 36–41. [Google Scholar] [CrossRef]
- Sidorenkov, A.; Kolesnikov, S.; Saletsky, A. Molecular dynamics simulation of graphene on Cu (111) with different Lennard-Jones parameters. Eur. Phys. J. B 2016, 89, 220. [Google Scholar] [CrossRef]
- Sunil, K. Spreading and orientation of silver nano-drops over a flat graphene substrate: An atomistic investigation. Carbon 2018, 138, 26–41. [Google Scholar]
- Valencia, H.; Gil, A.; Frapper, G. Trends in the Adsorption of 3d Transition Metal Atoms onto Graphene and Nanotube Surfaces: A DFT Study and Molecular Orbital Analysis. J. Phys. Chem. C 2010, 114, 14141–14153. [Google Scholar] [CrossRef]
- Manade, M.; Viñes, F.; Illas, F. Transition metal adatoms on graphene: A systematic density functional study. Carbon 2015, 95, 525–534. [Google Scholar] [CrossRef]
- Dang, T.M.D.; Le, T.T.T.; Fribourg-Blanc, E.; Dang, M.C. Synthesis and optical properties of copper nanoparticles prepared by a chemical reduction method. Adv. Nat. Sci. Nanosci. Nanotechnol. 2011, 2, 015009. [Google Scholar] [CrossRef]
- Tejamaya, M.; Römer, I.; Merrifield, R.C.; Lead, J.R. Stability of Citrate, PVP, and PEG Coated Silver Nanoparticles in Ecotoxicology Media. Environ. Sci. Technol. 2012, 46, 7011–7017. [Google Scholar] [CrossRef]
- Hemalatha, T.; Akilandeswari, S. Effect of Poly Ethylene Glycol on CuO Nanoparticles and its Antibacterial Application. Int. Lett. Chem. Phys. Astron. 2016, 63, 111–118. [Google Scholar] [CrossRef]
- Nursen, S.; Kahraman, E.; Sari, B.; Özgün, A. Synthesis of Some Polymer-Metal Complexes and Elucidation of their Structures. J. Macromol. Sci. Pure Appl. Chem. 2006, 43, 1227–1235. [Google Scholar]
- Gervilla, V.; Zarshenas, M.; Sangiovanni, D.G.; Sarakinos, K. Anomalous versus Normal Room-Temperature Diffusion of Metal Adatoms on Graphene. J. Phys. Chem. Lett. 2020, 11, 8030–8936. [Google Scholar] [CrossRef]
- Zarshenas, M.; Gervilla, V.; Sangiovanni, D.G.; Sarakinos, K. Room-Temperature Diffusion of Metal Clusters on Graphene. Available online: https://europepmc.org/article/PPR/PPR254964 (accessed on 4 March 2021).


| Cluster | System | E (kcal/mol) |
|---|---|---|
| Cu13 | PG | −13.72 (−9.11, −14.27, −17.78) |
| GNP | −18.55 (−16.65, −17.91, −21.09) | |
| GO_PEG | −27.69 (−22.17, −29.32, −31.58) | |
| GO_PEG_ N | −89.54 (−79.11, −85.76, −103.75) | |
| Ag13 | PG | −29.11 (−25.37, −28.83, −33.13) |
| GNP | −37.53 (−30.54, −37.44, −44.61) | |
| GO_PEG | −64.05 (−57.89, −60.45, −73.81) | |
| GO_PEG_ N | −116.96 (−99.54, −109.67, −141.67) | |
| Cu6O6 | PG | −77.83 (−59.54, −82.37, −91.78) |
| GNP | −114.18 (−102.54, −118.02, −121.98) | |
| GO_PEG | −136.01 (−127.27, −130.32, −150.44) | |
| GO_PEG_ N | −220.64 (−191.09, −227.43, −243.40) |
| Cluster | System | d (Å) |
|---|---|---|
| Cu13 | PG | 2.92 (2.85, 2.90, 3.01) |
| GNP | 2.92 (2.84, 2.91, 3.01) | |
| GO_PEG | 2.45 (2.37, 2.46, 2.52) | |
| GO_PEG_ N | 2.44 (2.20, 2.46, 2.66) | |
| Ag13 | PG | 3.01 (2.97, 3.02, 3.04) |
| GNP | 2.99 (2.95, 2.98, 3.04) | |
| GO_PEG | 2.51 (2.38, 2.56. 2.59) | |
| GO_PEG_ N | 2.44 (2.34, 2.40, 2.58) | |
| Cu6O6 | PG | 2.98 (2.94, 2.99, 3.01) (O) 3.45 (3.21, 3.33. 3.45) (Cu) |
| GNP | 2.93 (2.78, 2.97, 3.04) (O) 3.01 (2.92, 3.07, 3.04) (Cu) | |
| GO_PEG | 2.55 (2.34, 2.52, 2.79) (O) 3.11 (2.94, 3.07, 3.32) (Cu) | |
| GO_PEG_ N | 2.63 (2.54, 2.61, 2.74) (O) 2.94 (2.72, 2.99, 3.11) (Cu) |
Publisher’s Note: MDPI stays neutral with regard to jurisdictional claims in published maps and institutional affiliations. |
© 2021 by the authors. Licensee MDPI, Basel, Switzerland. This article is an open access article distributed under the terms and conditions of the Creative Commons Attribution (CC BY) license (https://creativecommons.org/licenses/by/4.0/).
Share and Cite
Lado-Touriño, I.; Páez-Pavón, A. Interaction between Graphene-Based Materials and Small Ag, Cu, and CuO Clusters: A Molecular Dynamics Study. Nanomaterials 2021, 11, 1378. https://doi.org/10.3390/nano11061378
Lado-Touriño I, Páez-Pavón A. Interaction between Graphene-Based Materials and Small Ag, Cu, and CuO Clusters: A Molecular Dynamics Study. Nanomaterials. 2021; 11(6):1378. https://doi.org/10.3390/nano11061378
Chicago/Turabian StyleLado-Touriño, Isabel, and Alicia Páez-Pavón. 2021. "Interaction between Graphene-Based Materials and Small Ag, Cu, and CuO Clusters: A Molecular Dynamics Study" Nanomaterials 11, no. 6: 1378. https://doi.org/10.3390/nano11061378
APA StyleLado-Touriño, I., & Páez-Pavón, A. (2021). Interaction between Graphene-Based Materials and Small Ag, Cu, and CuO Clusters: A Molecular Dynamics Study. Nanomaterials, 11(6), 1378. https://doi.org/10.3390/nano11061378