
Fabrication and Characterization of Physical and Mechanical Properties of Carbon Nanotubes—Graphene-Based Sandwich Composite Pressure Sensor

 ,
,  , and
, and
Abstract
1. Introduction
2. Materials, Sample Fabrication, and Experimental Setup
2.1. Materials
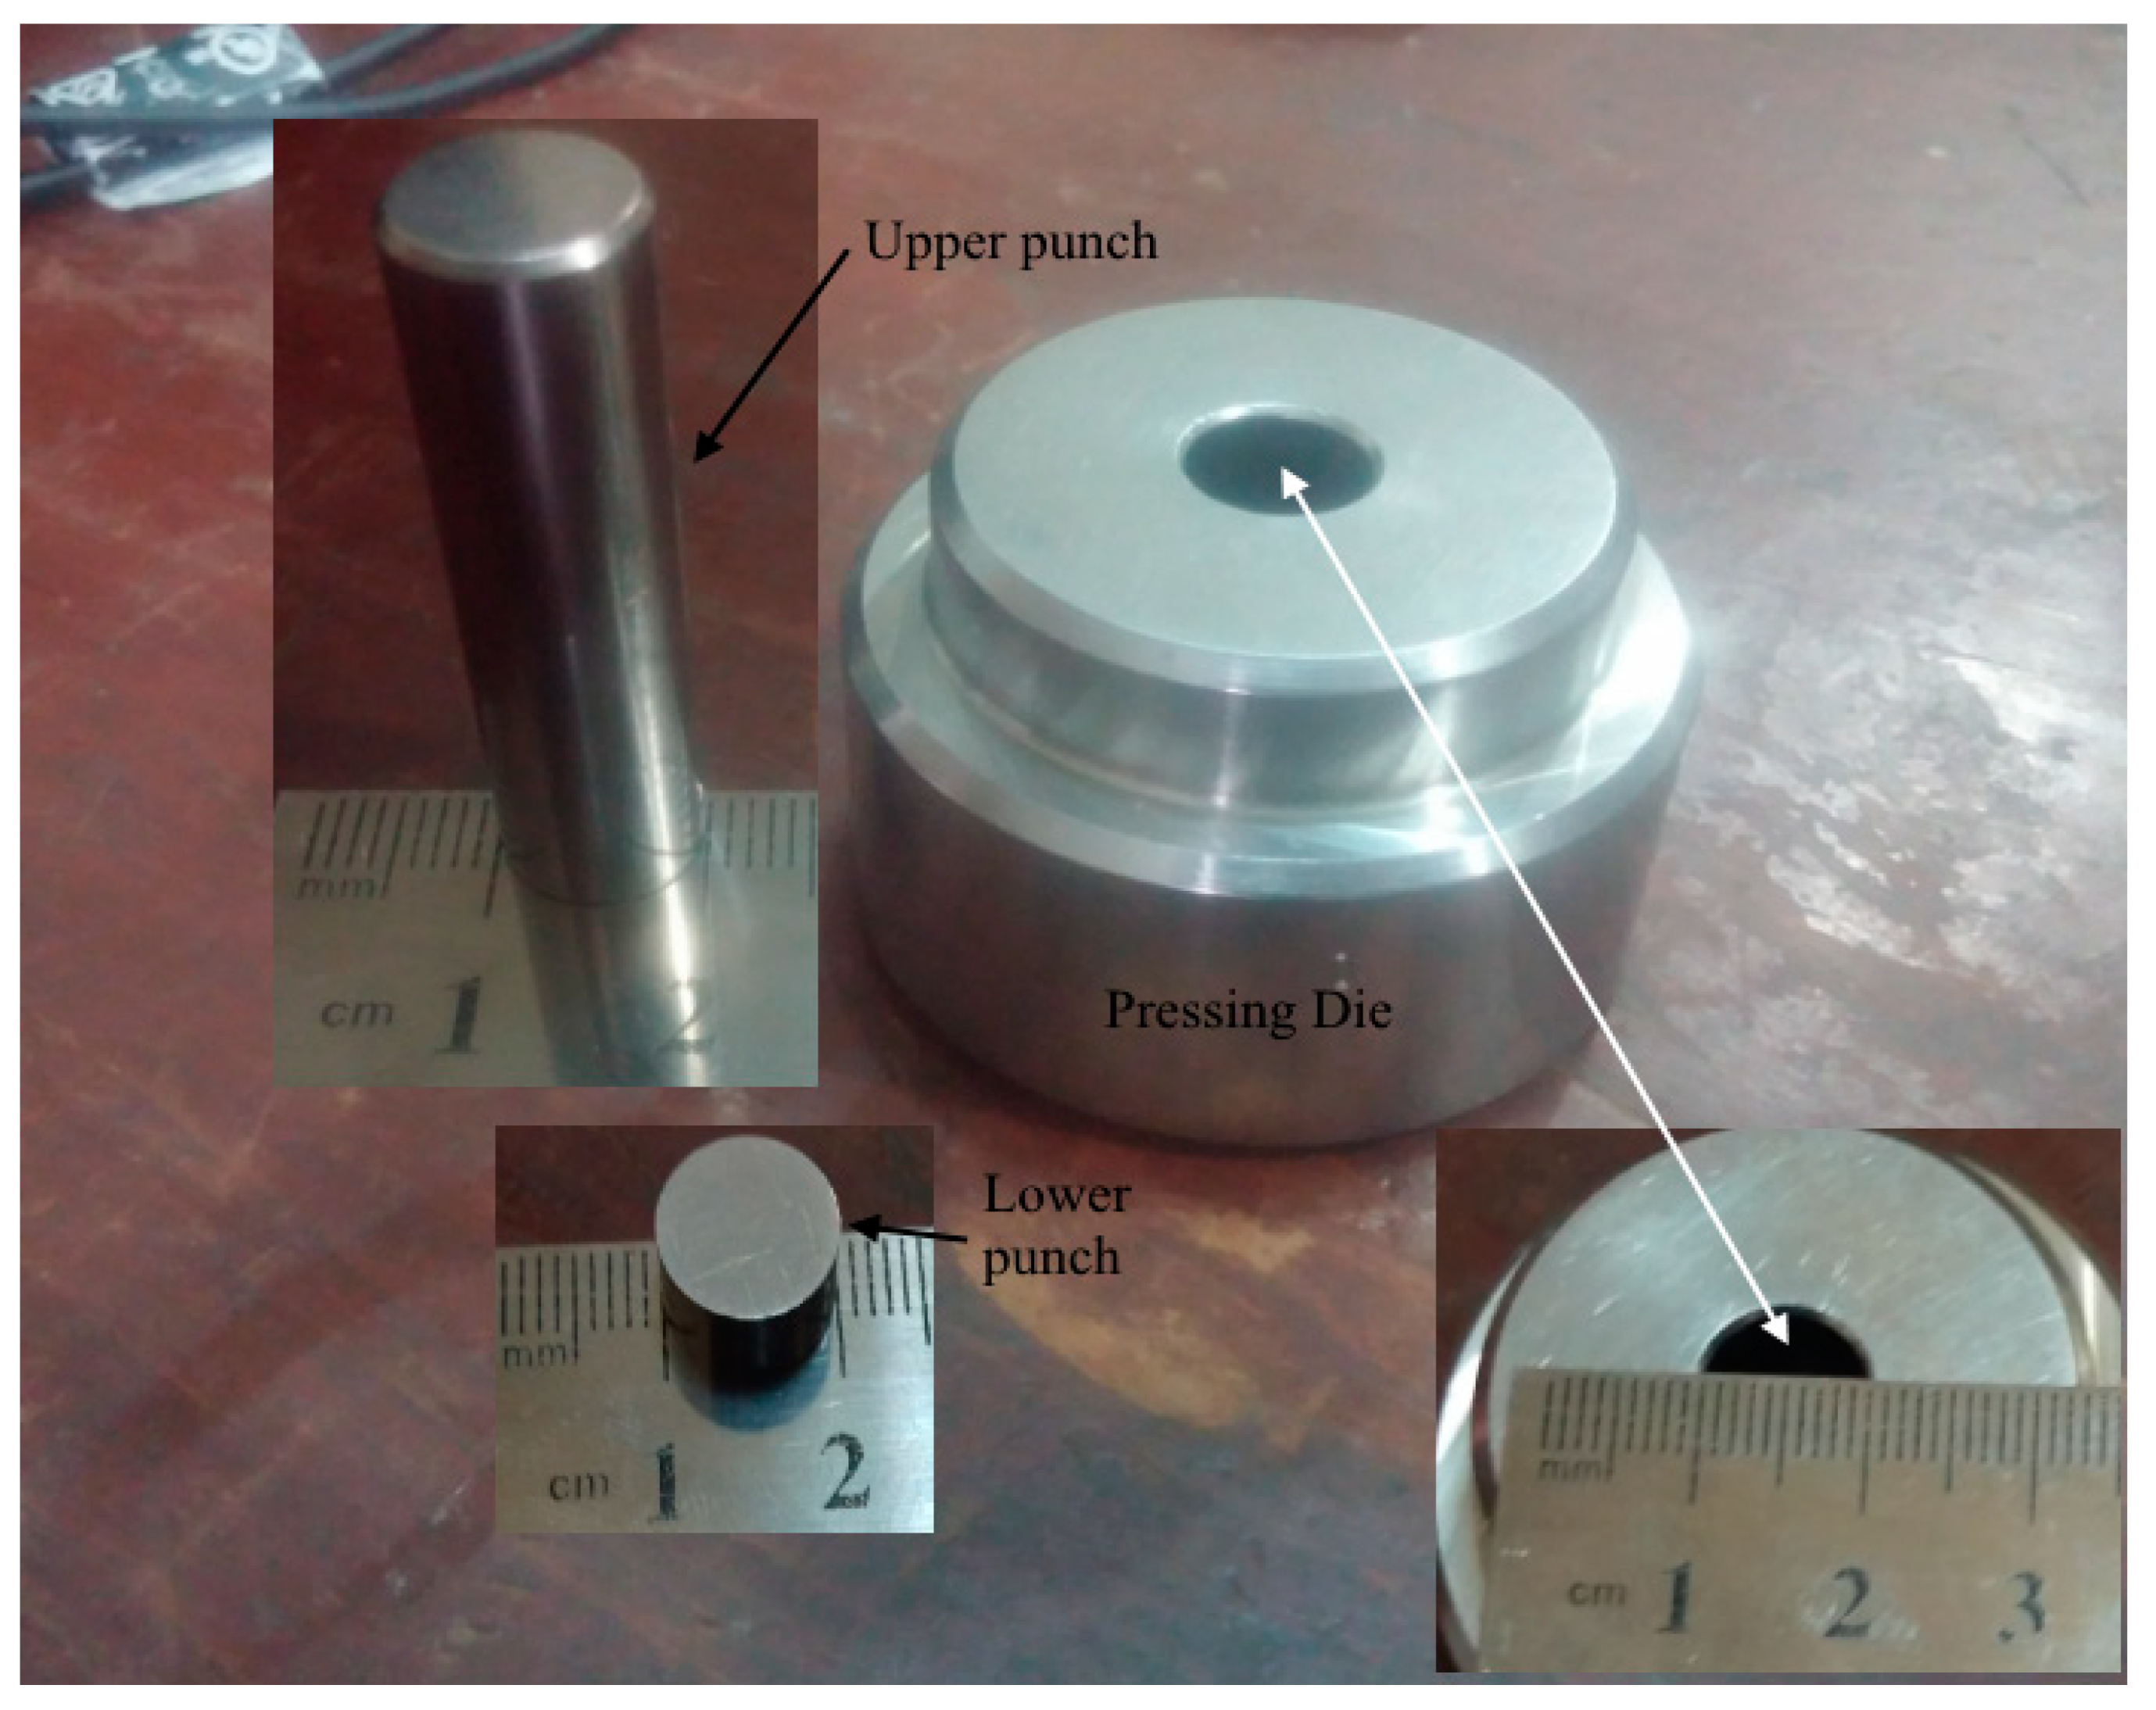
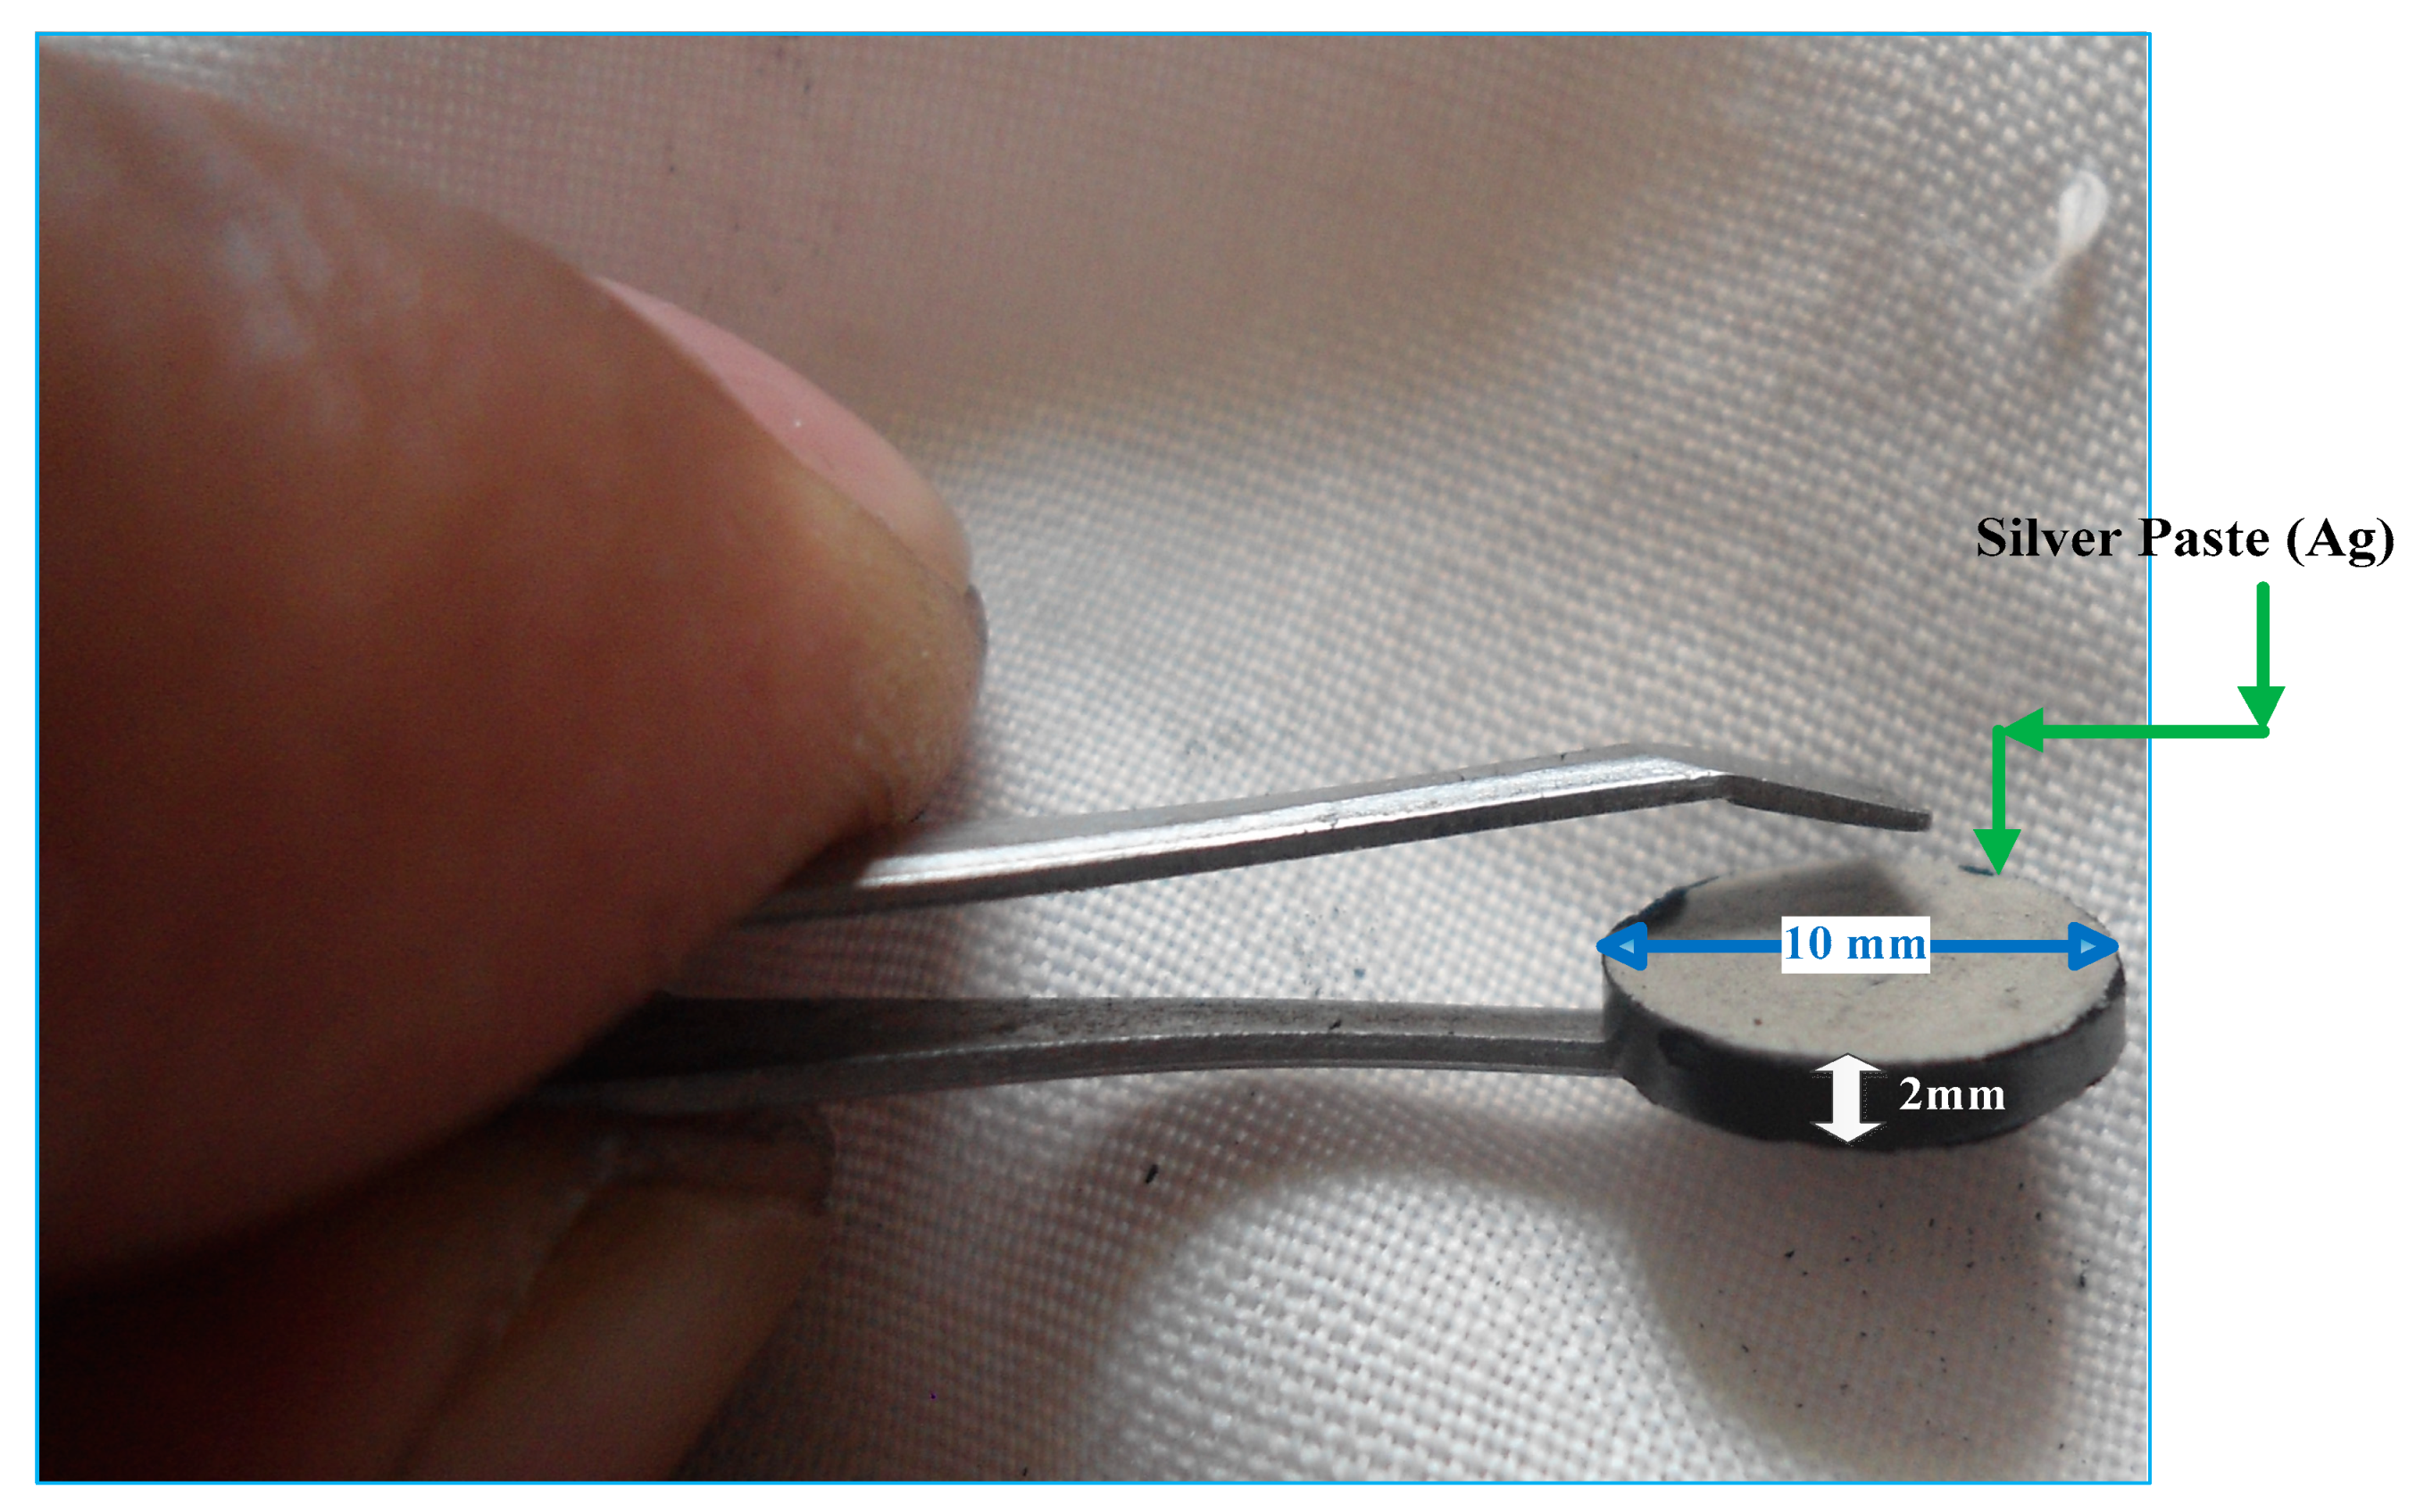
2.2. Samples Fabrication
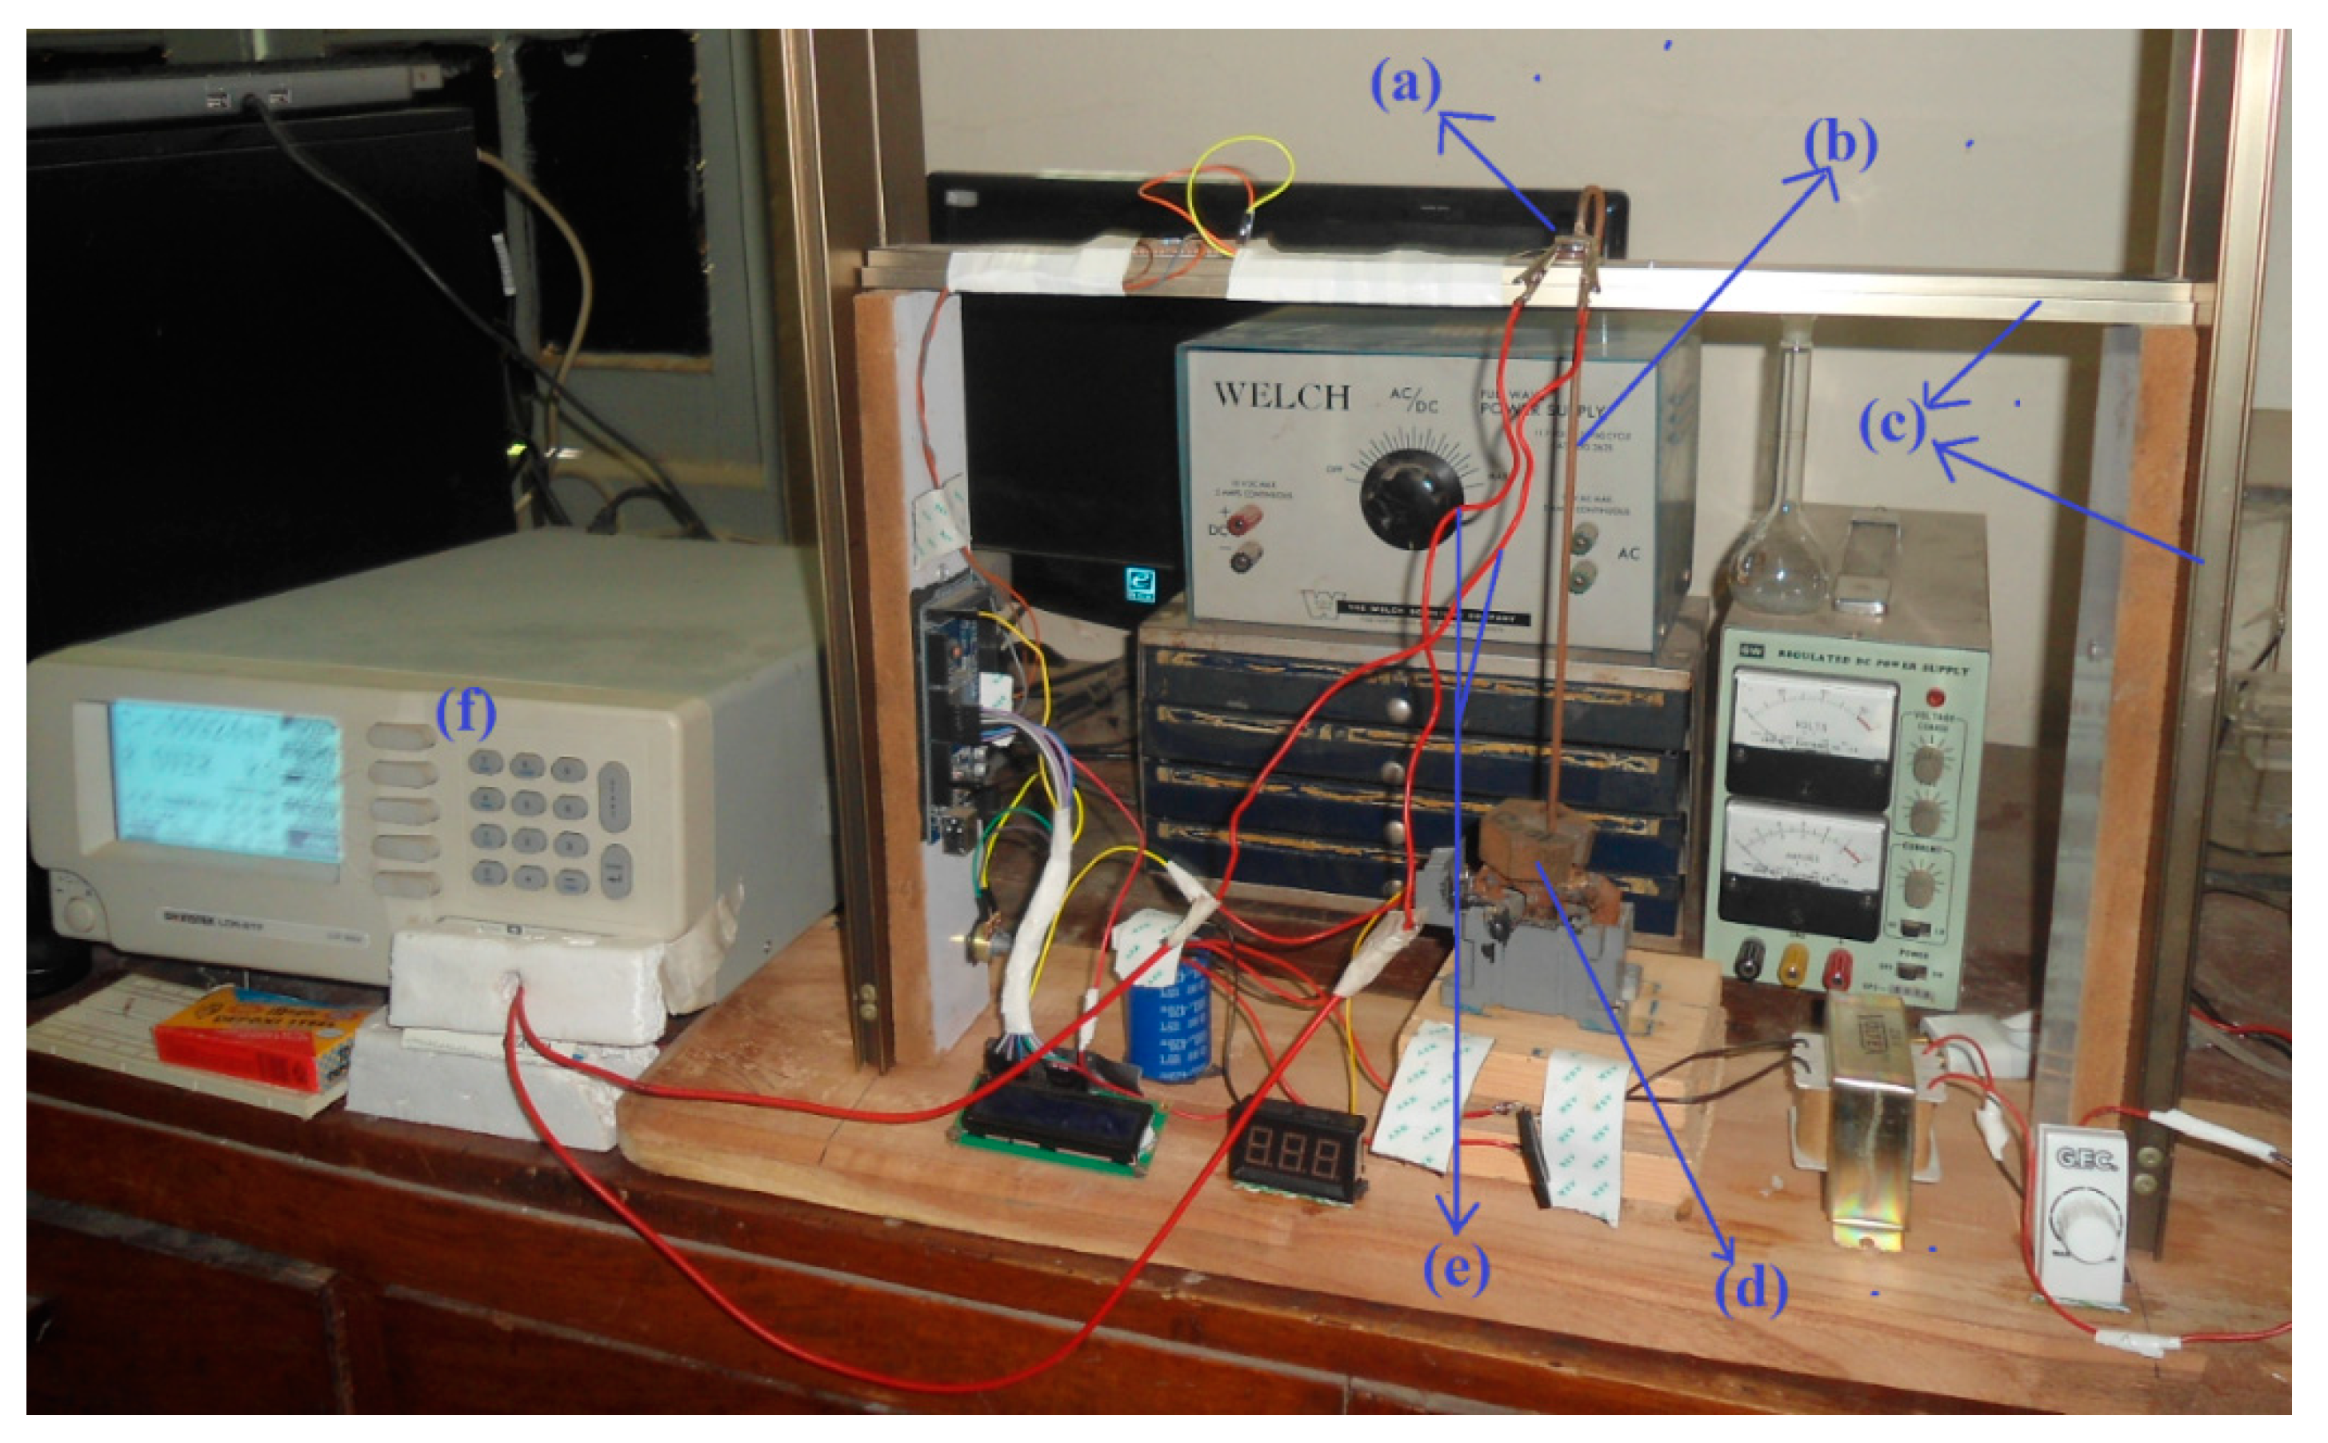
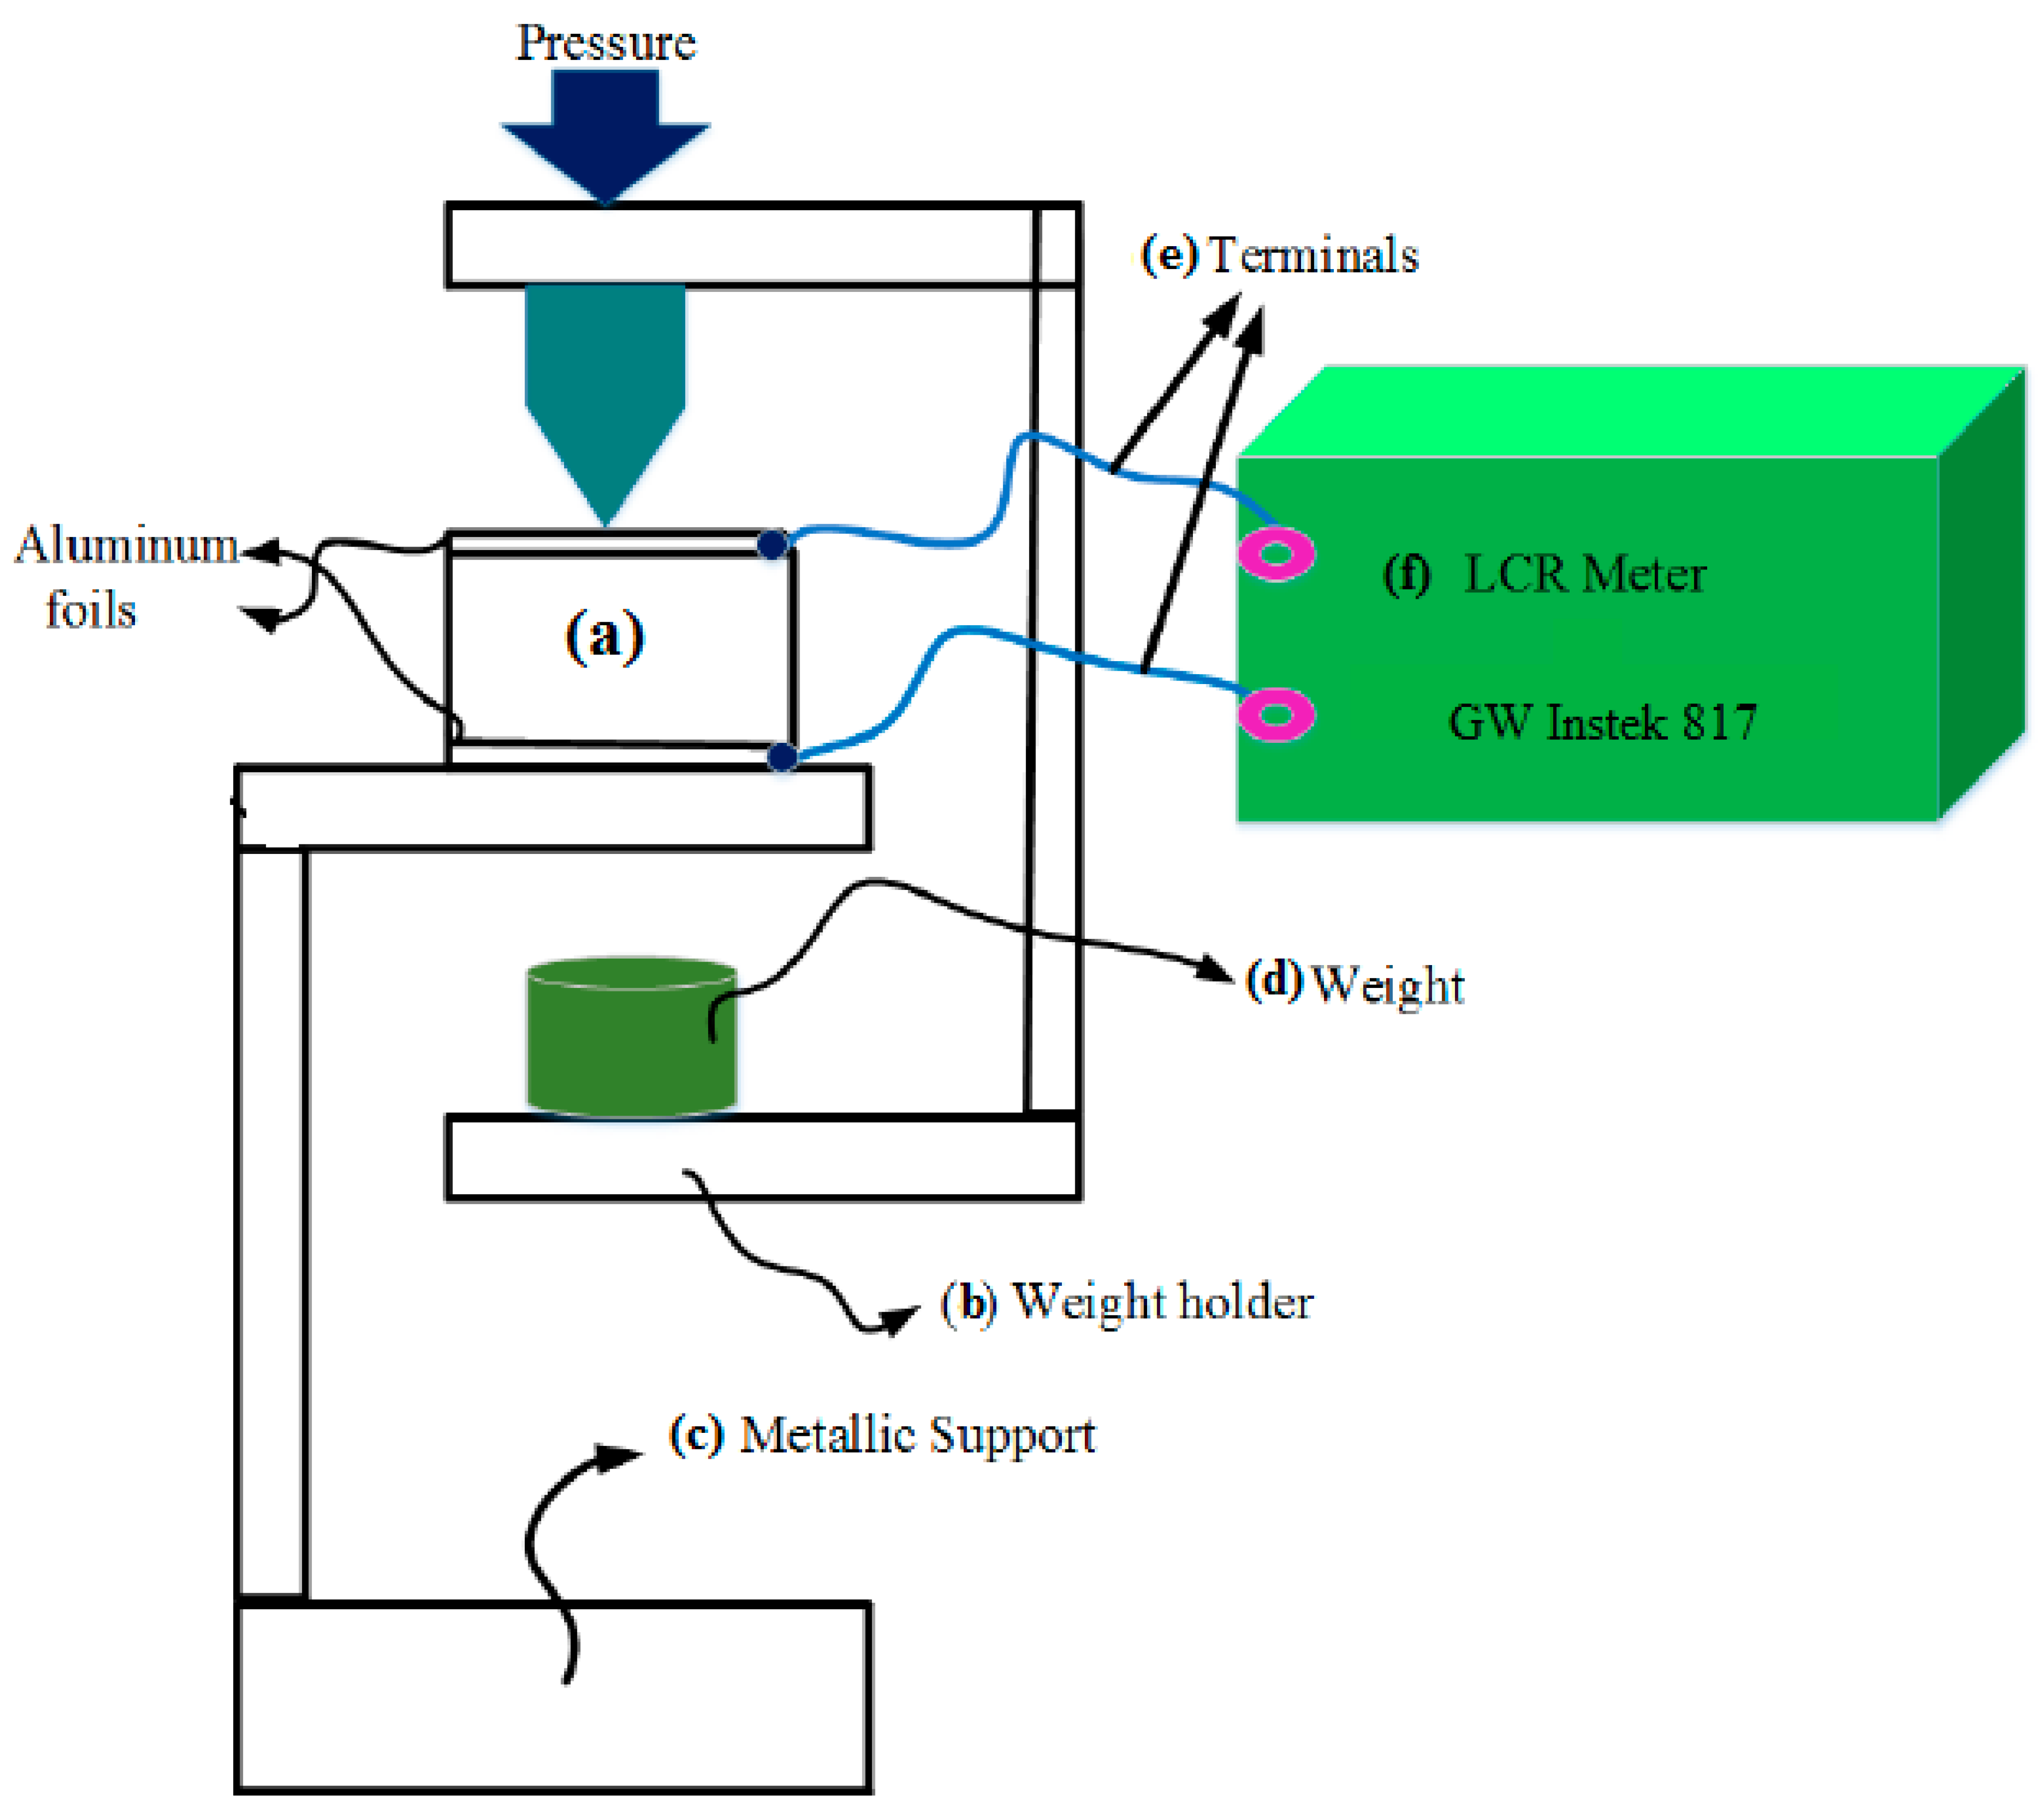
2.3. Experimental Setup and Measurements
3. Results and Discussion
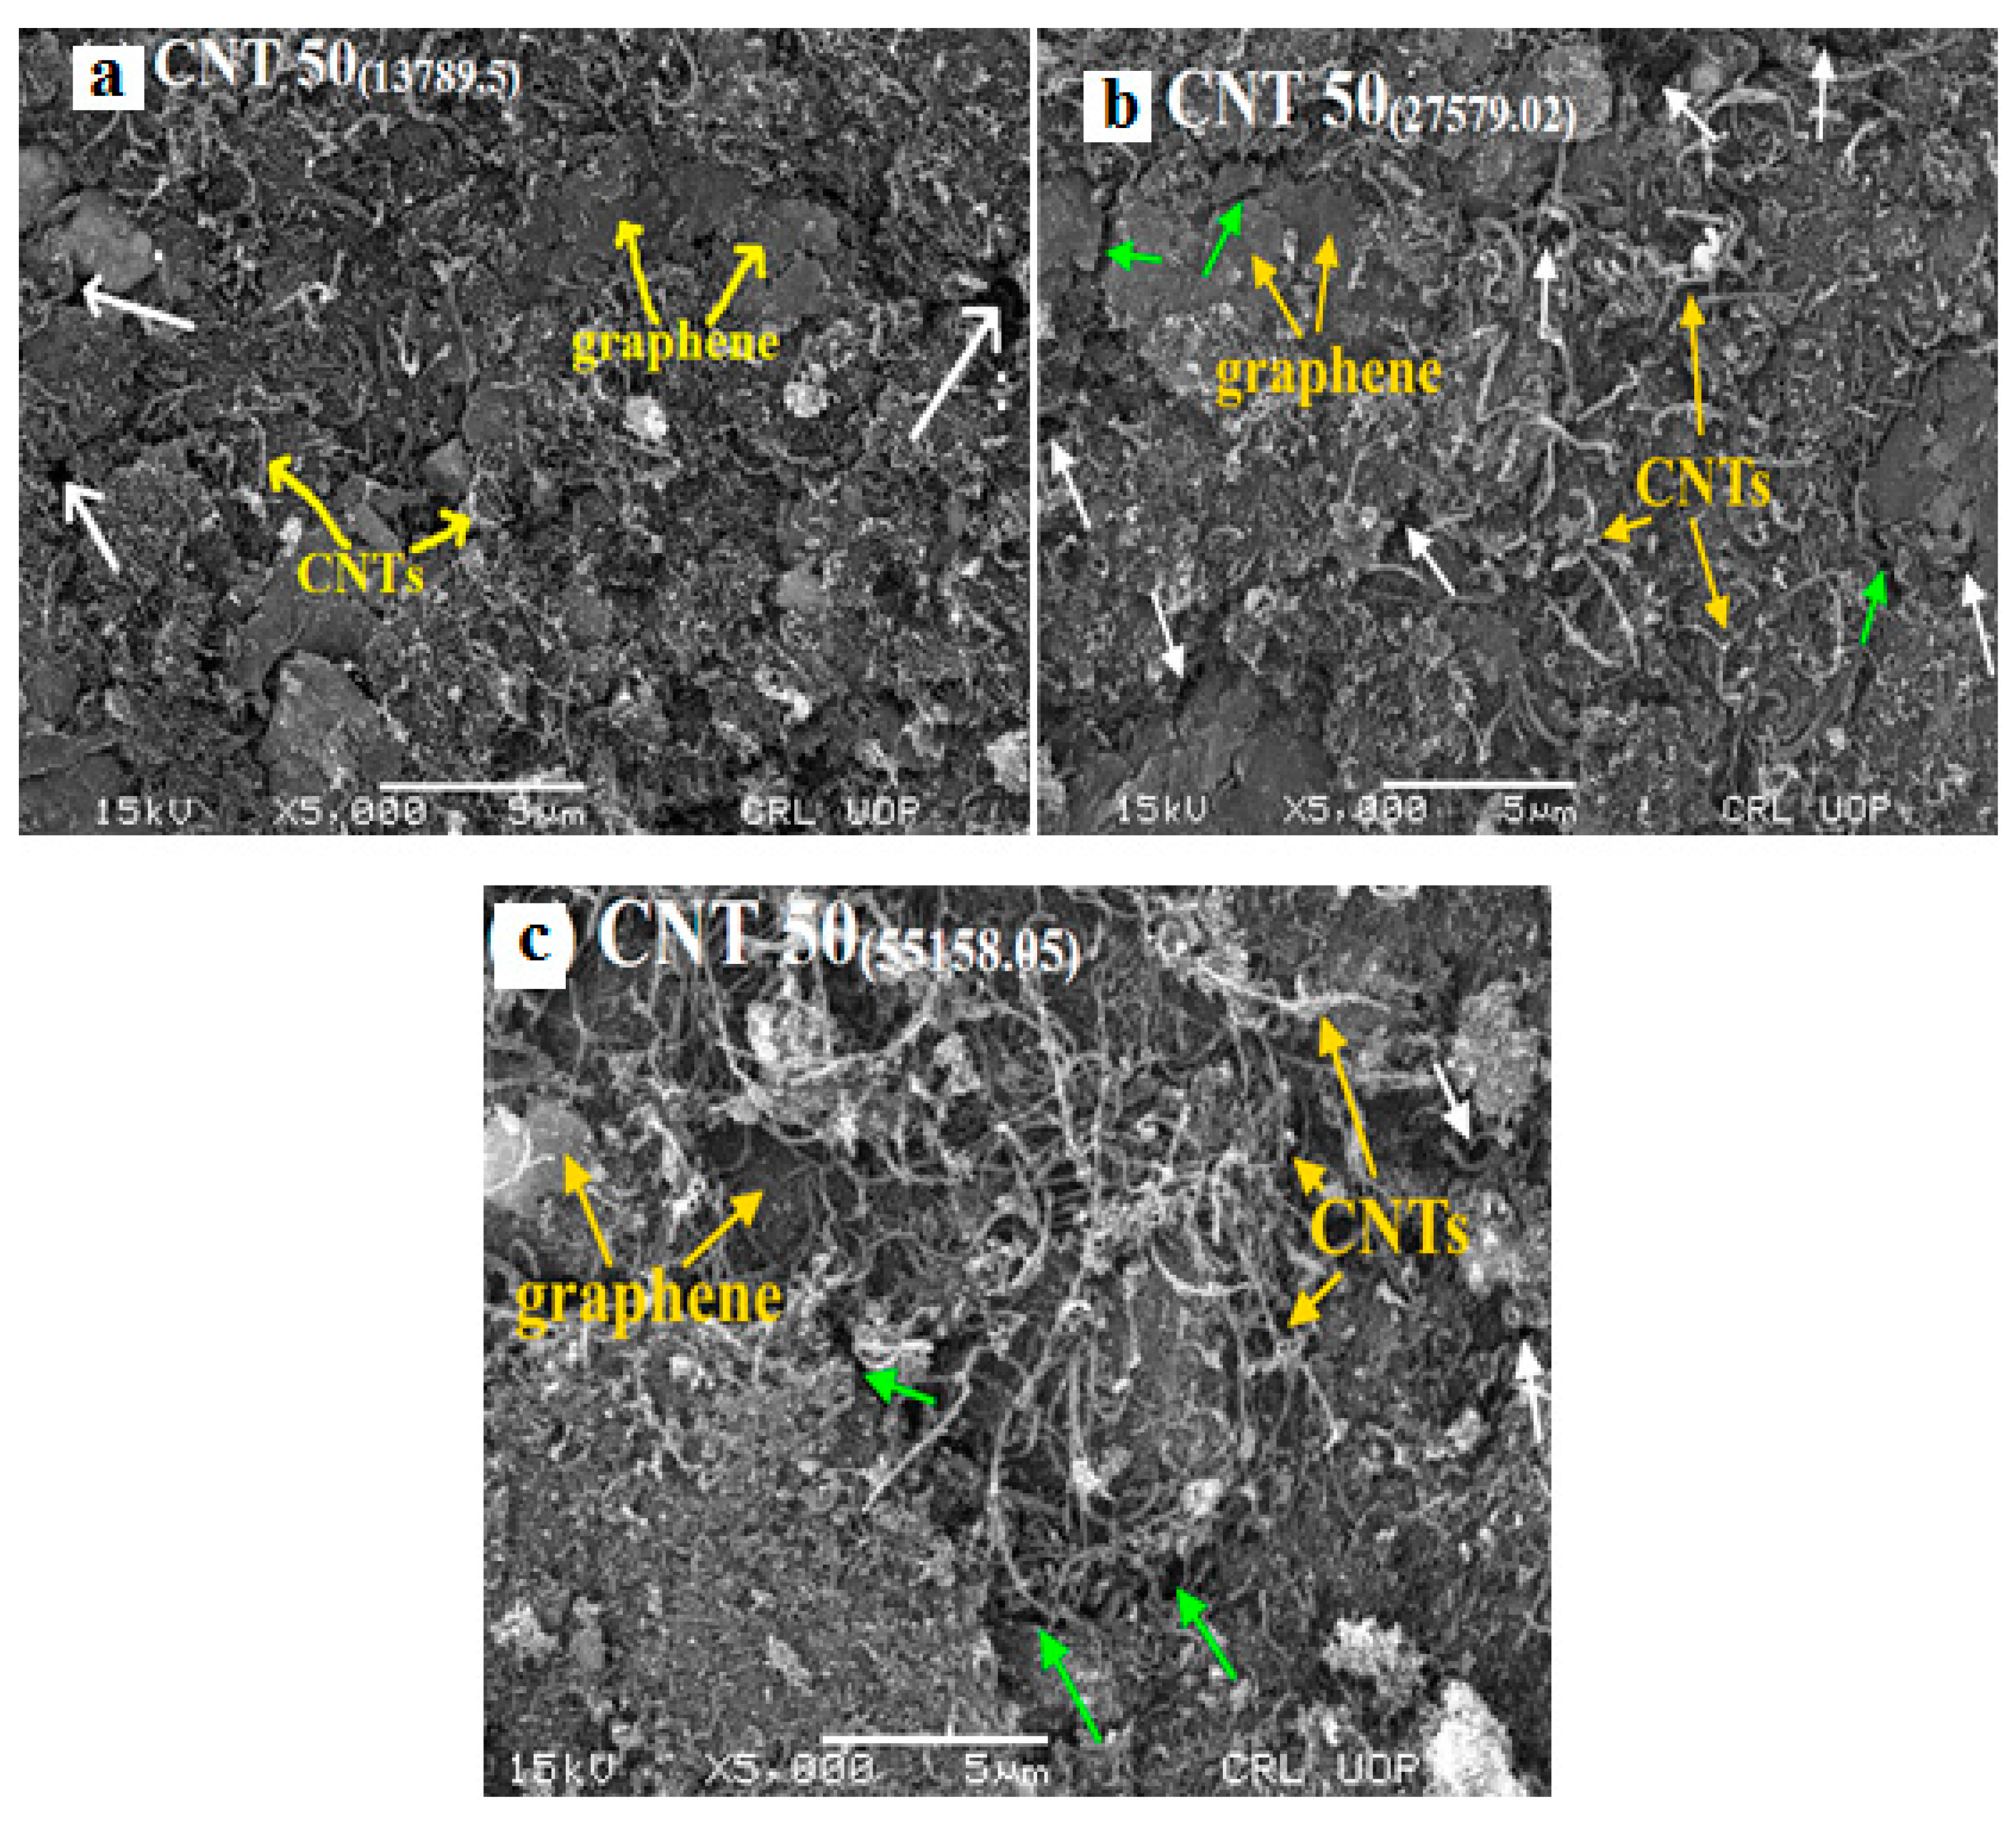
3.1. Scanning Electron Microscopy (SEM)
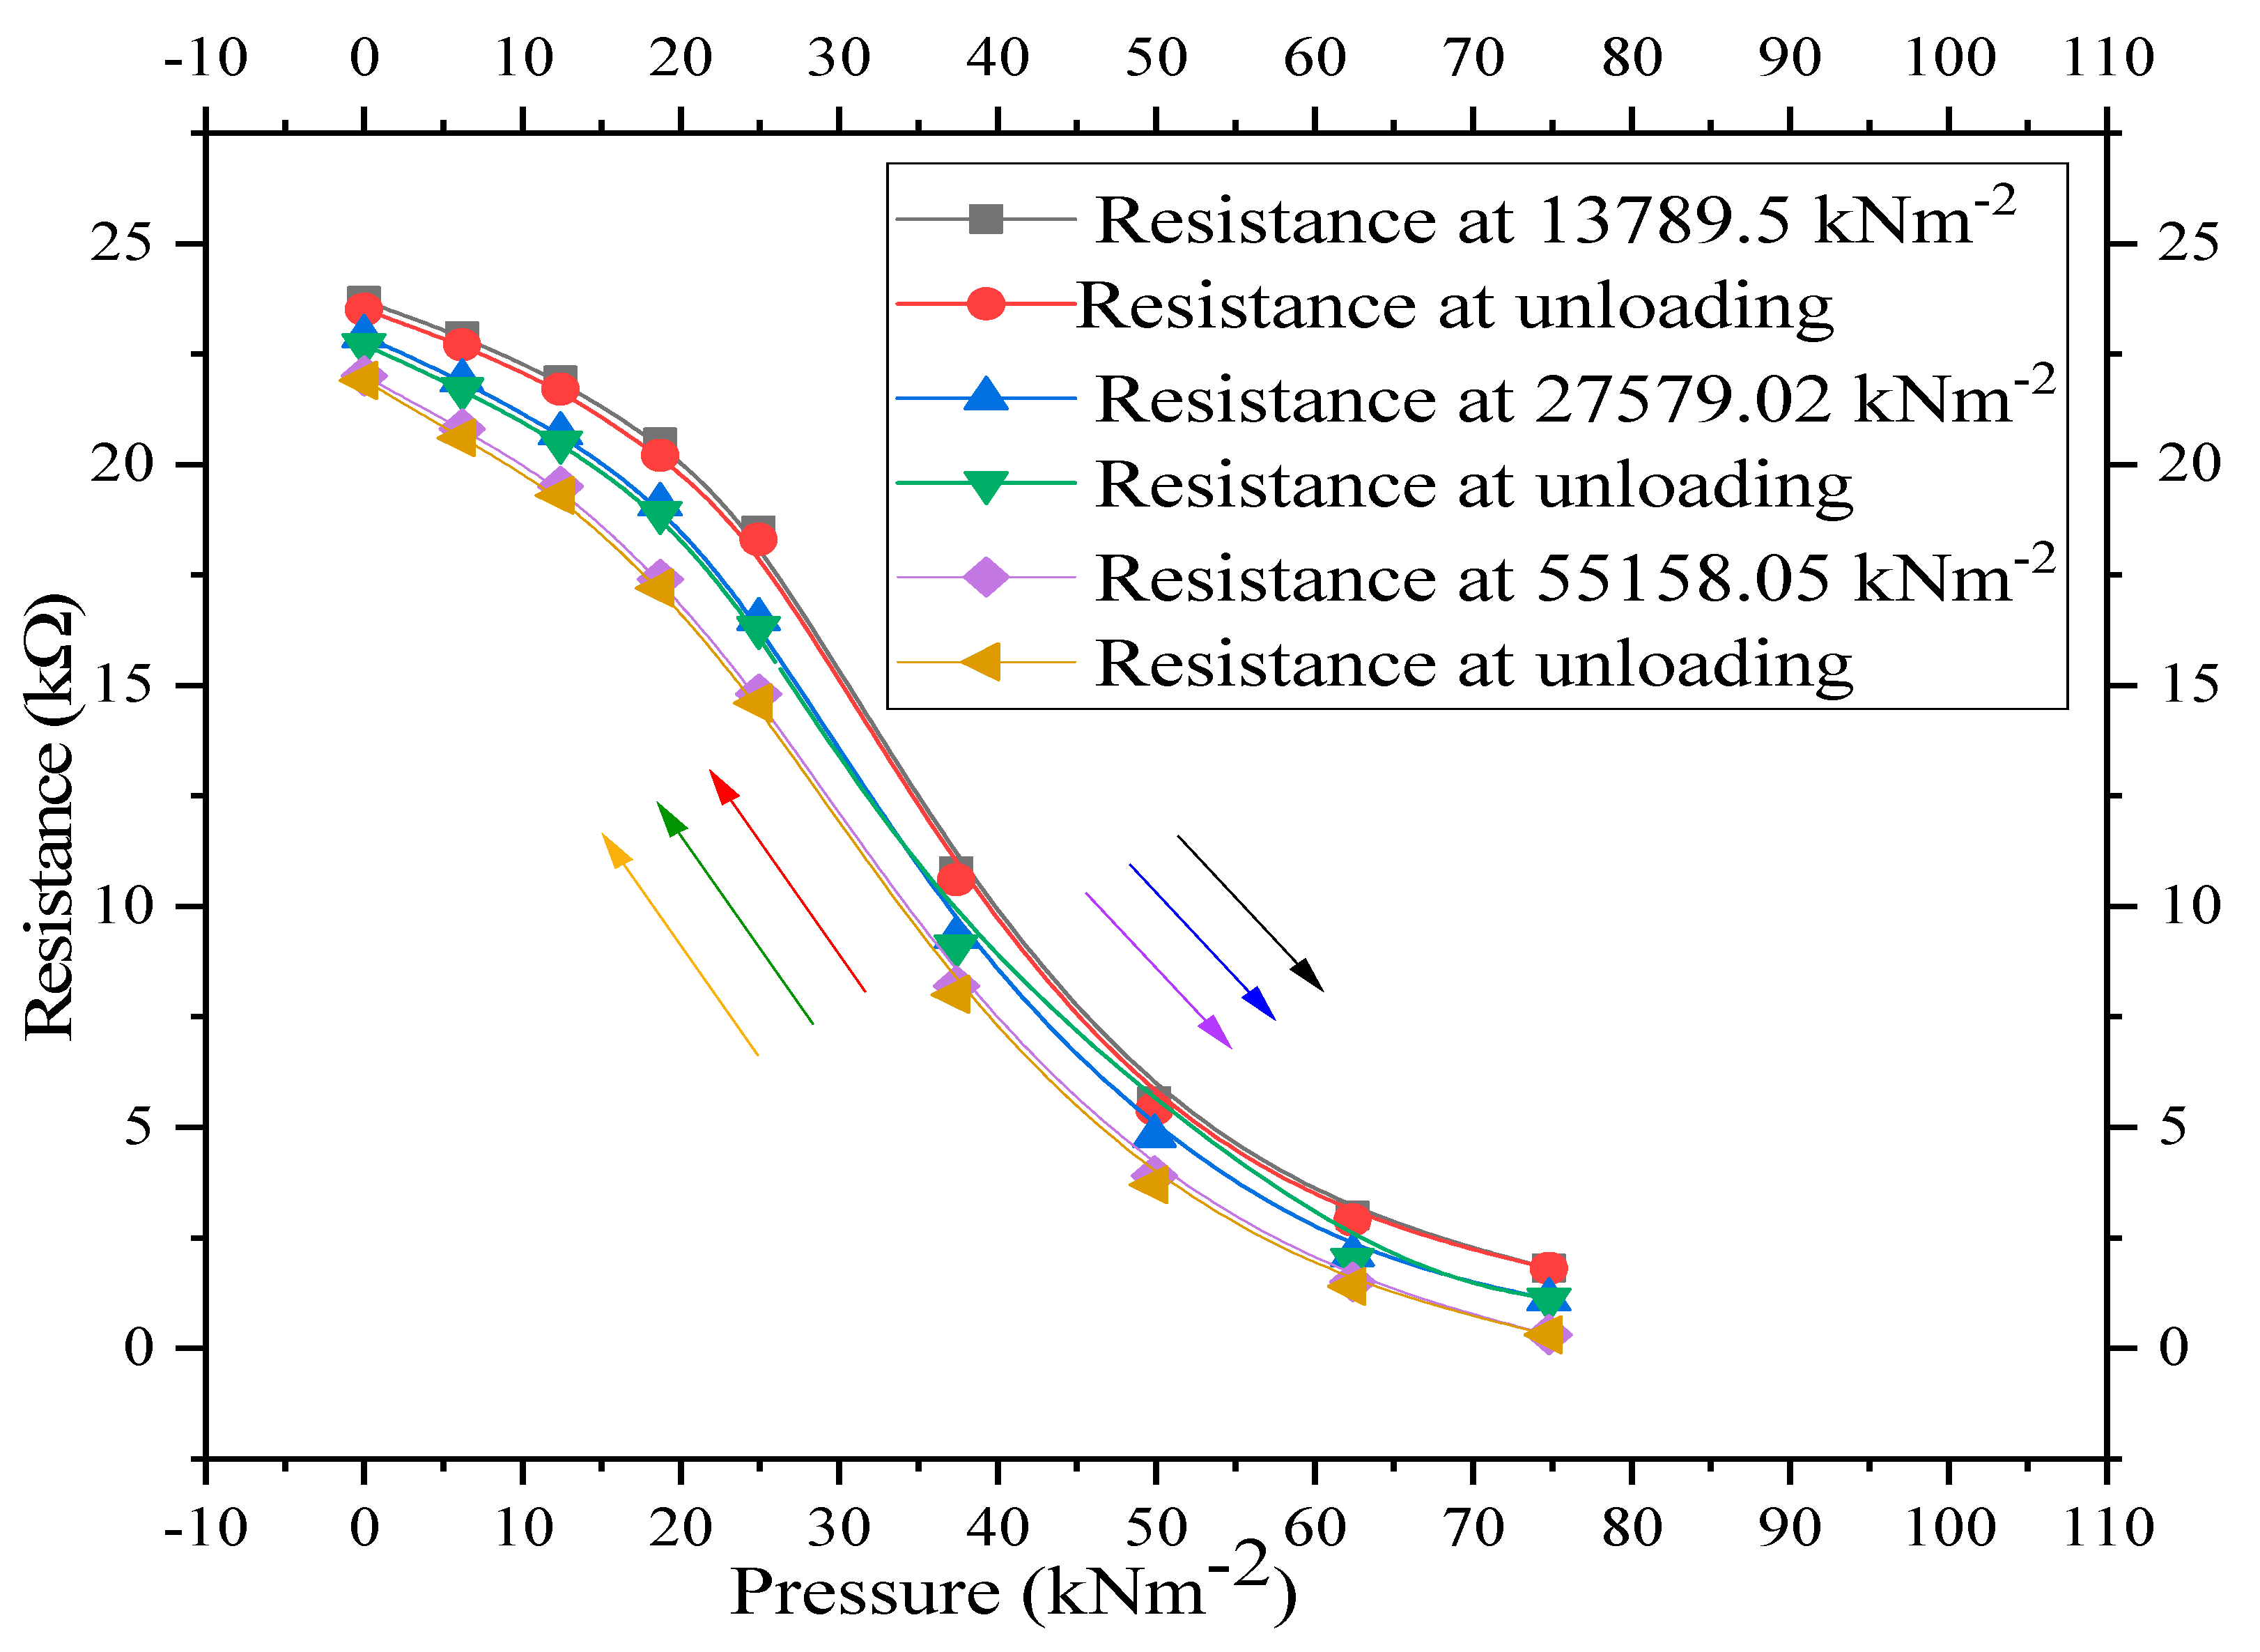
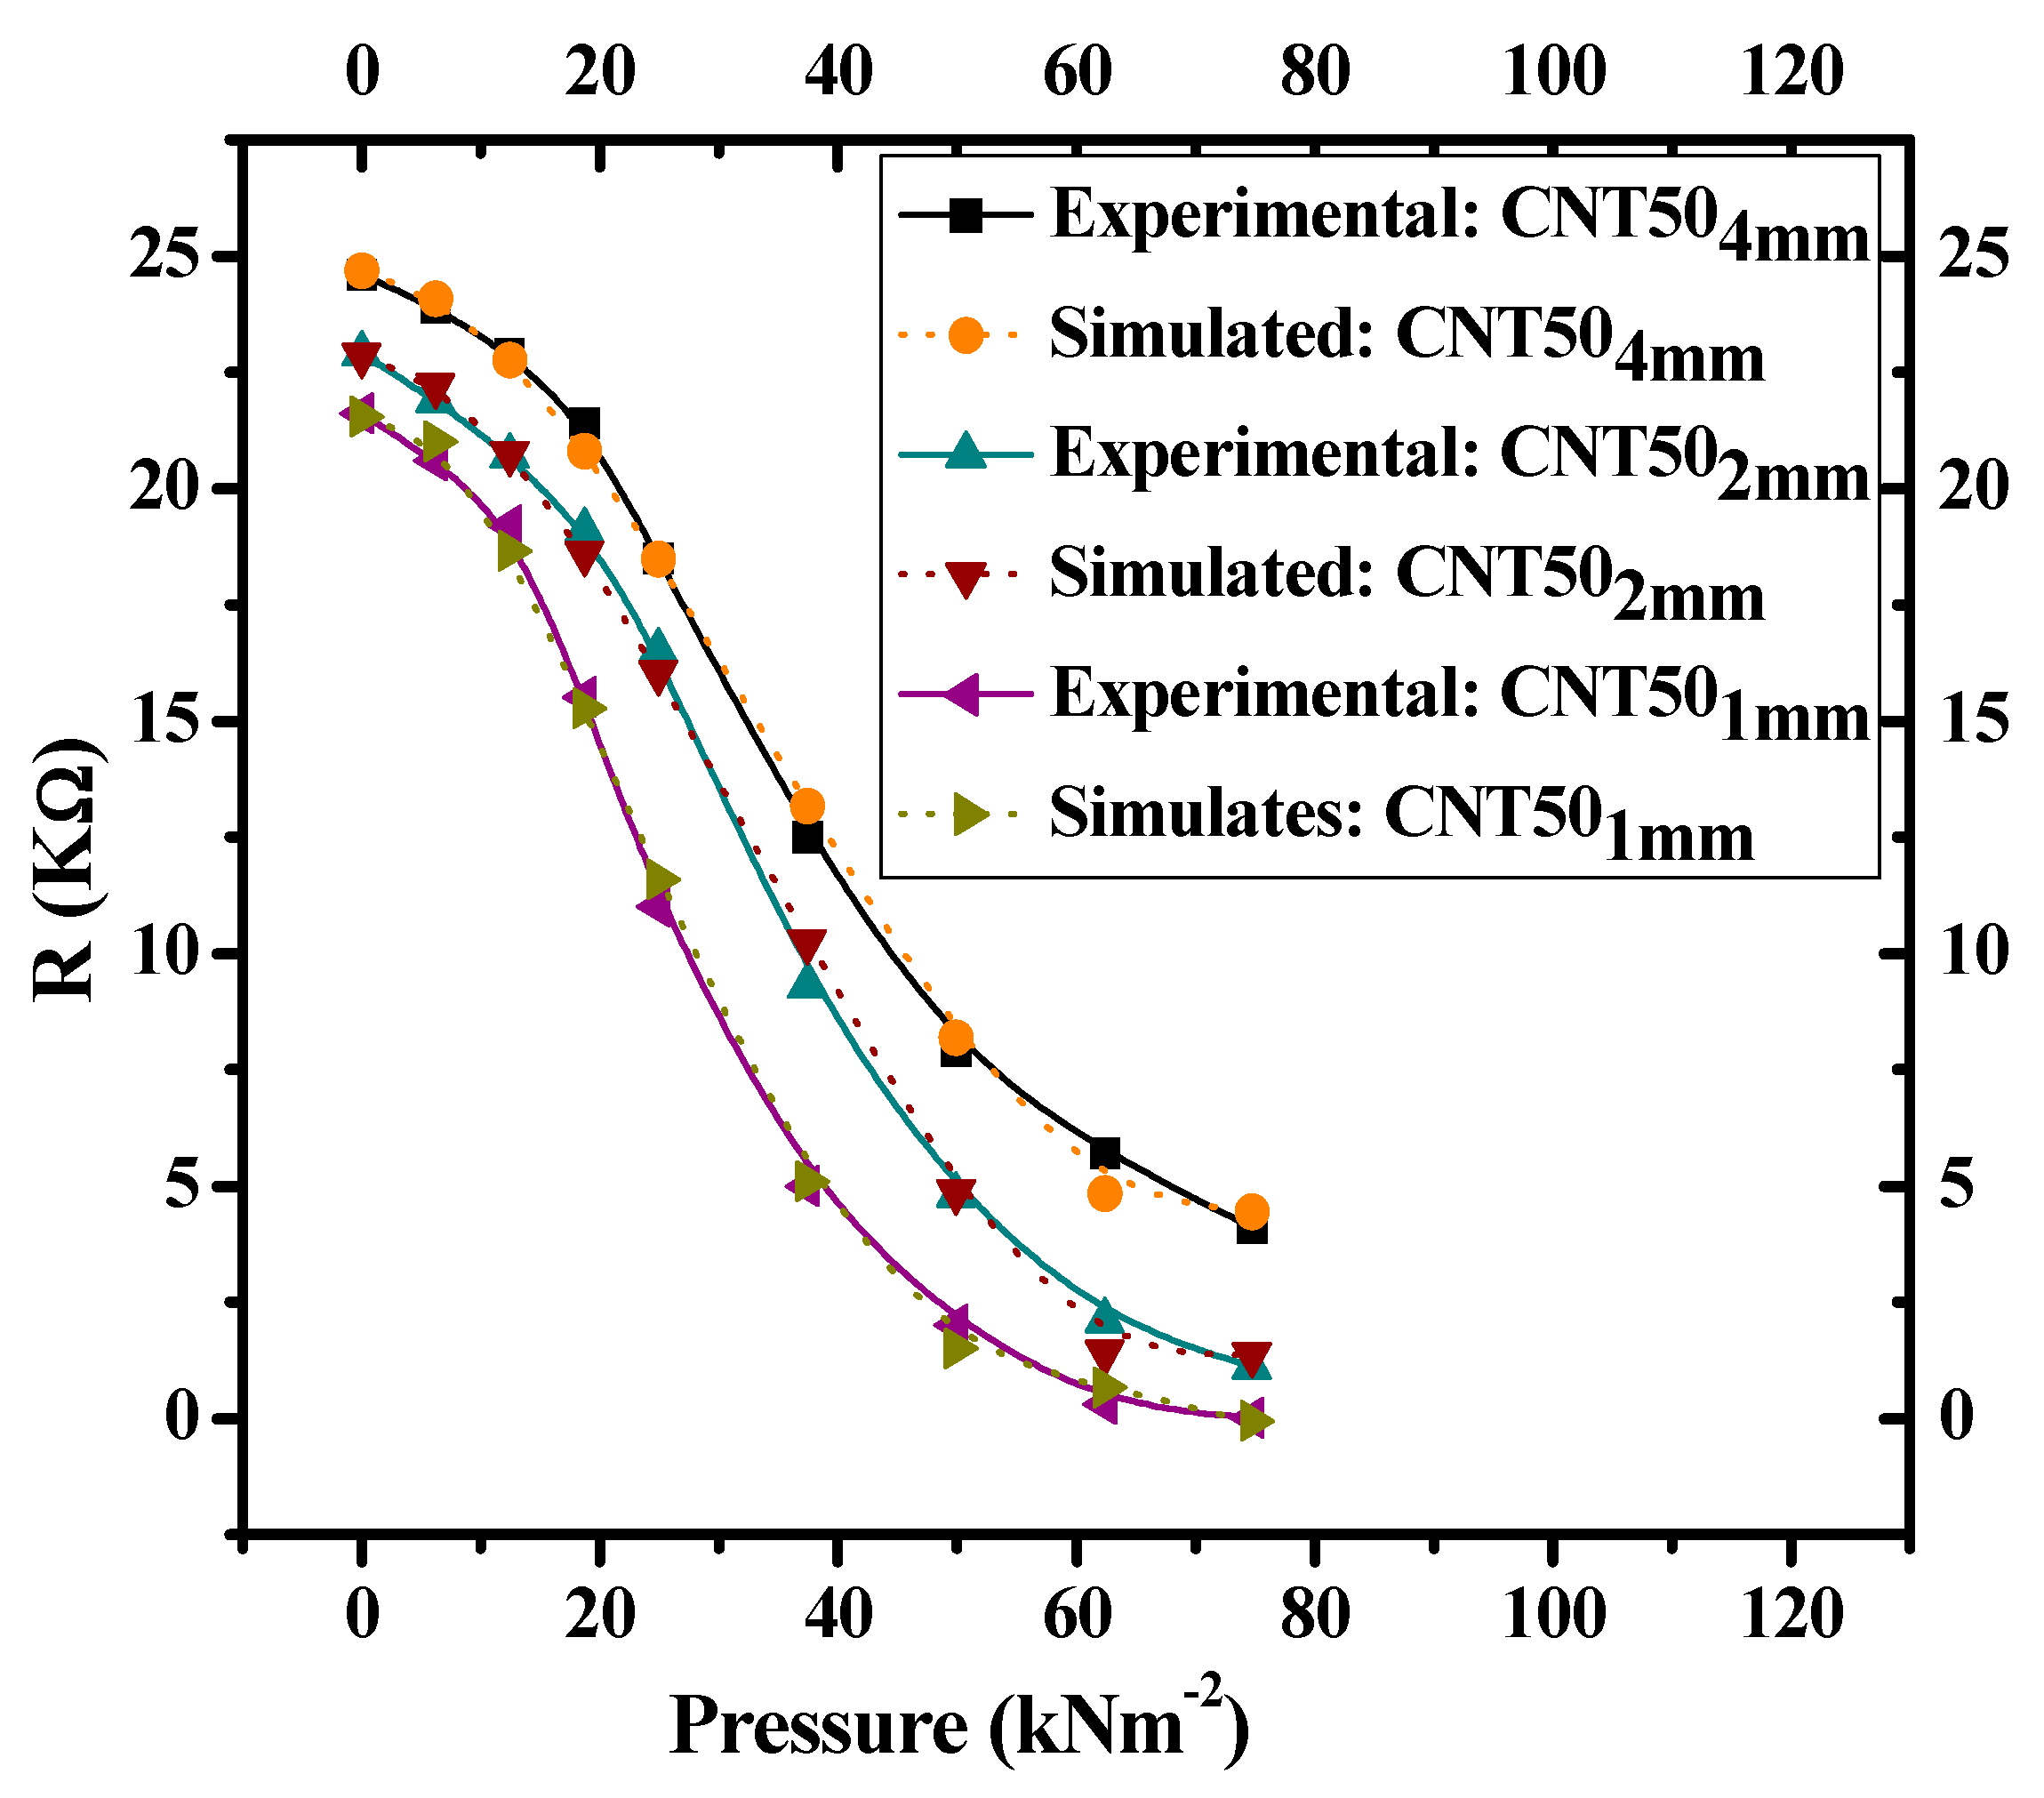
3.2. Resistance Versus Fabrication Pressure
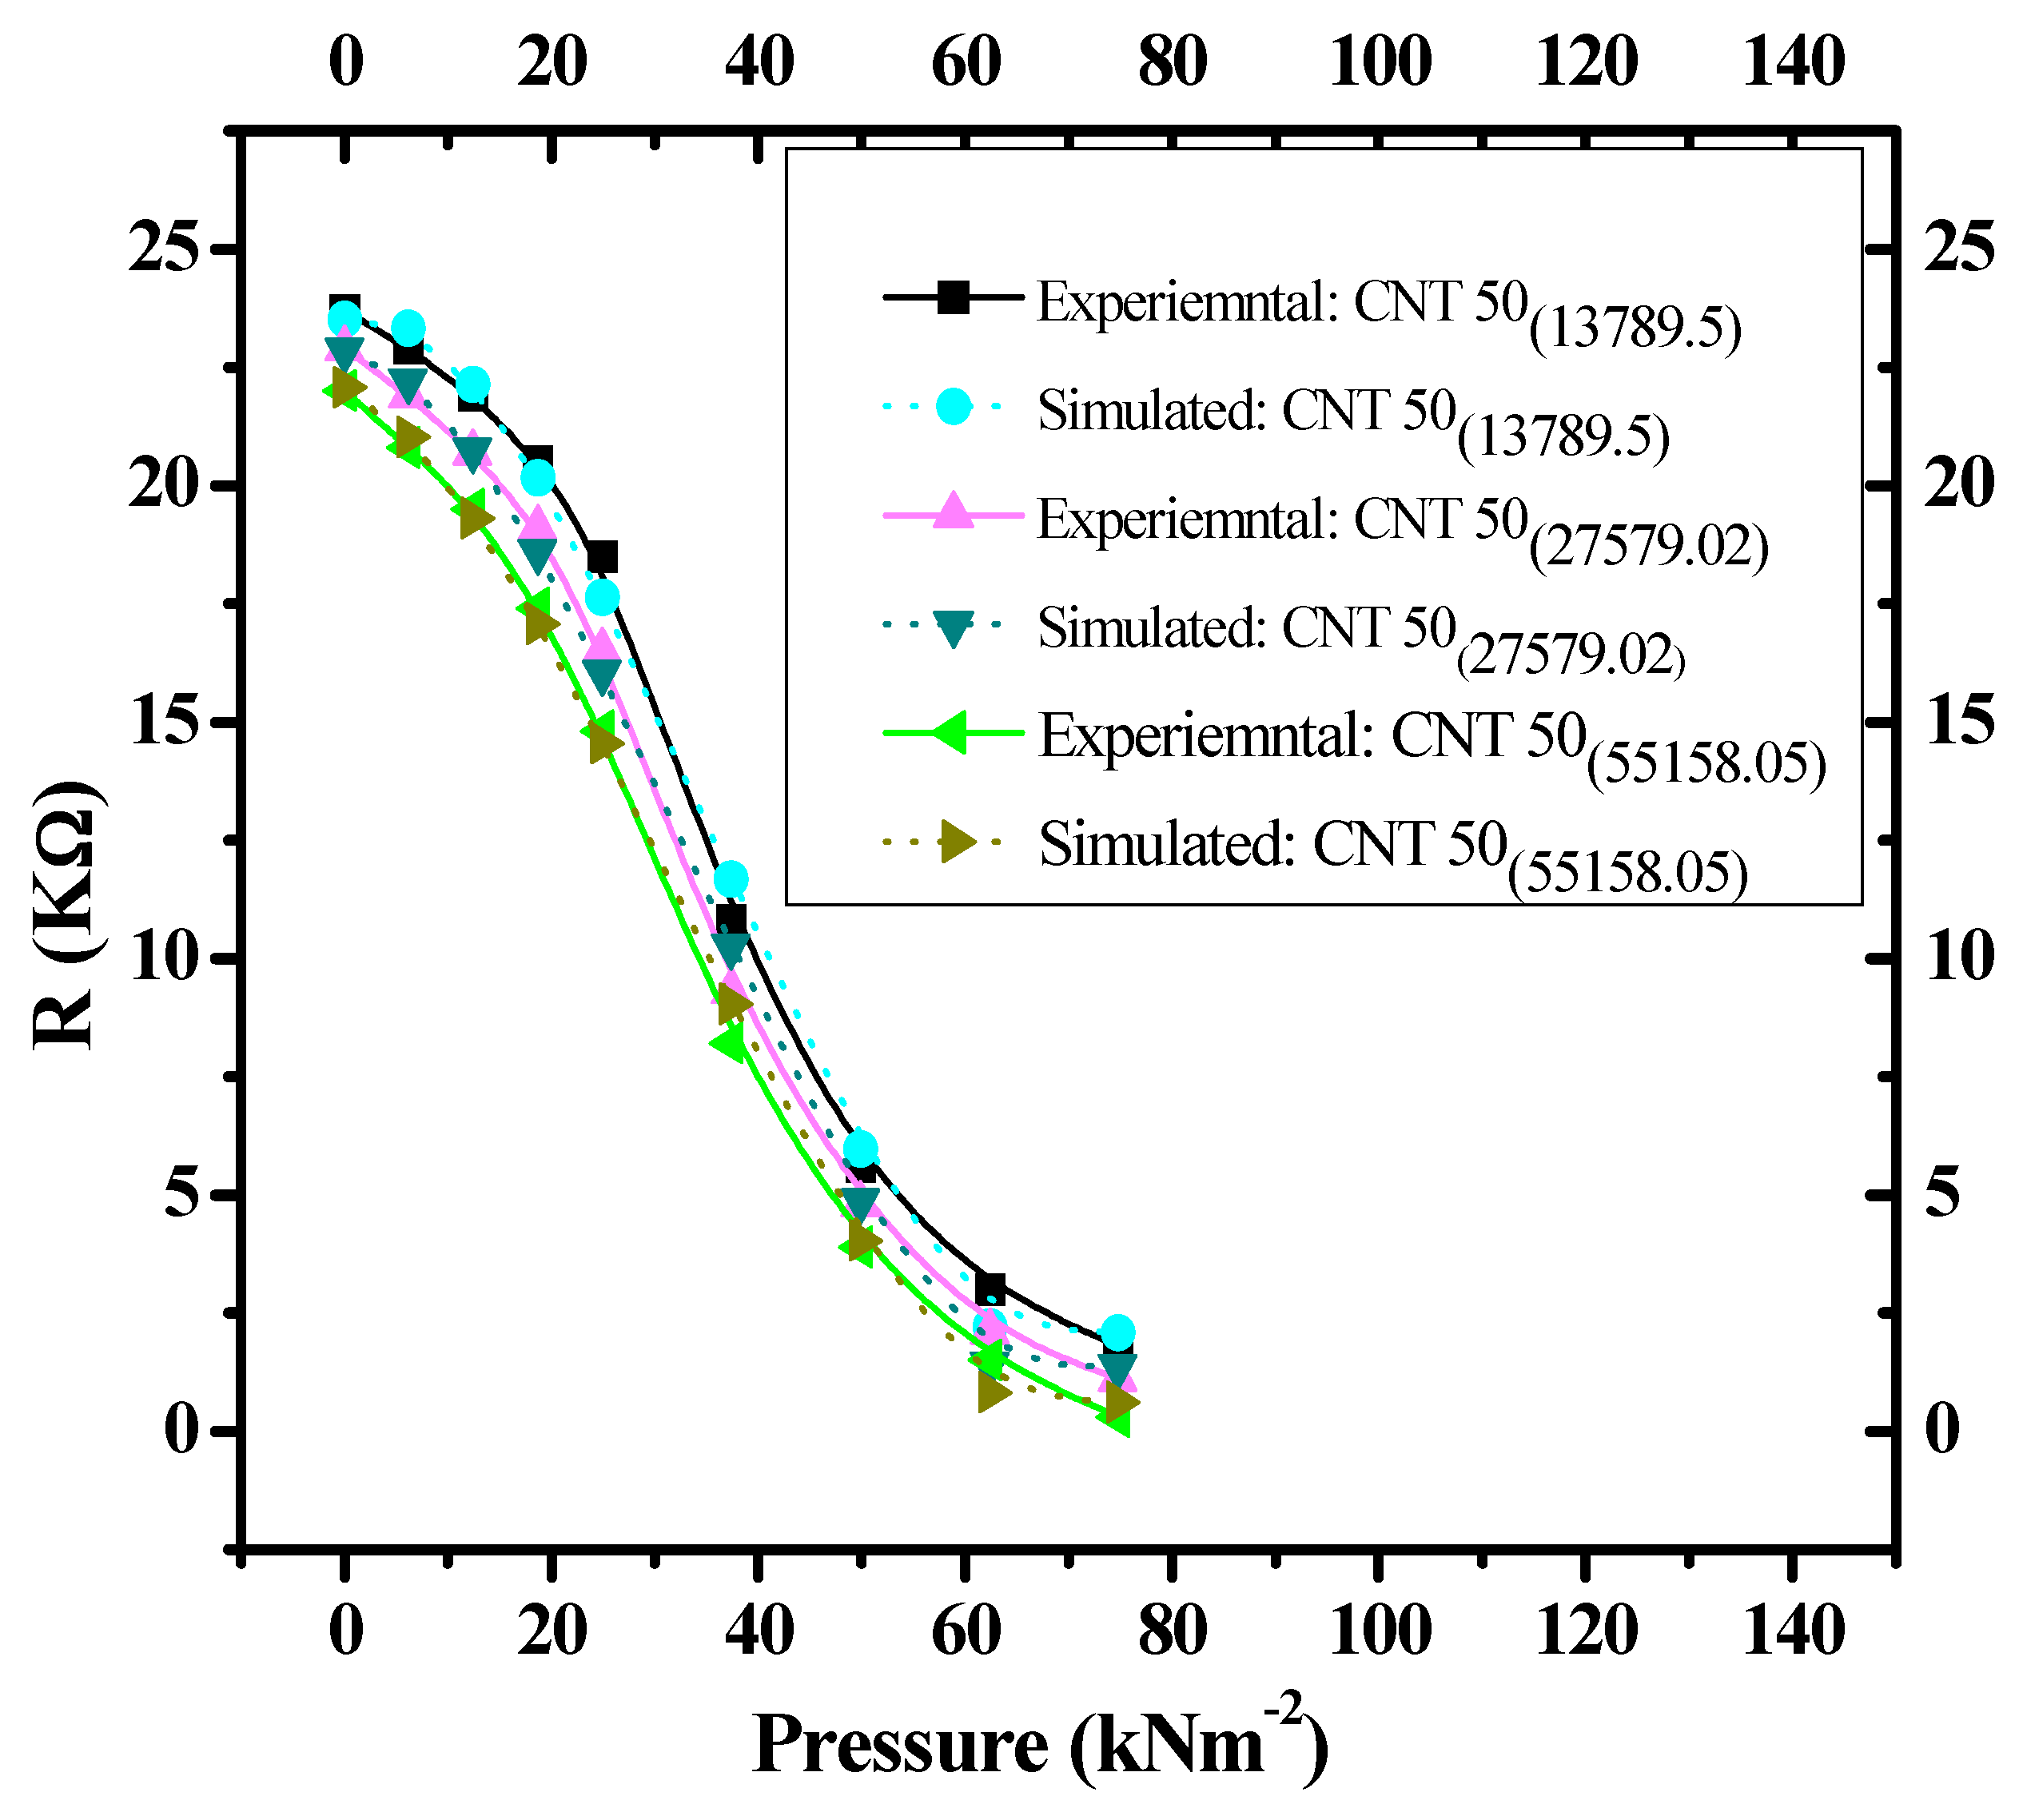
Experimental Versus Simulation
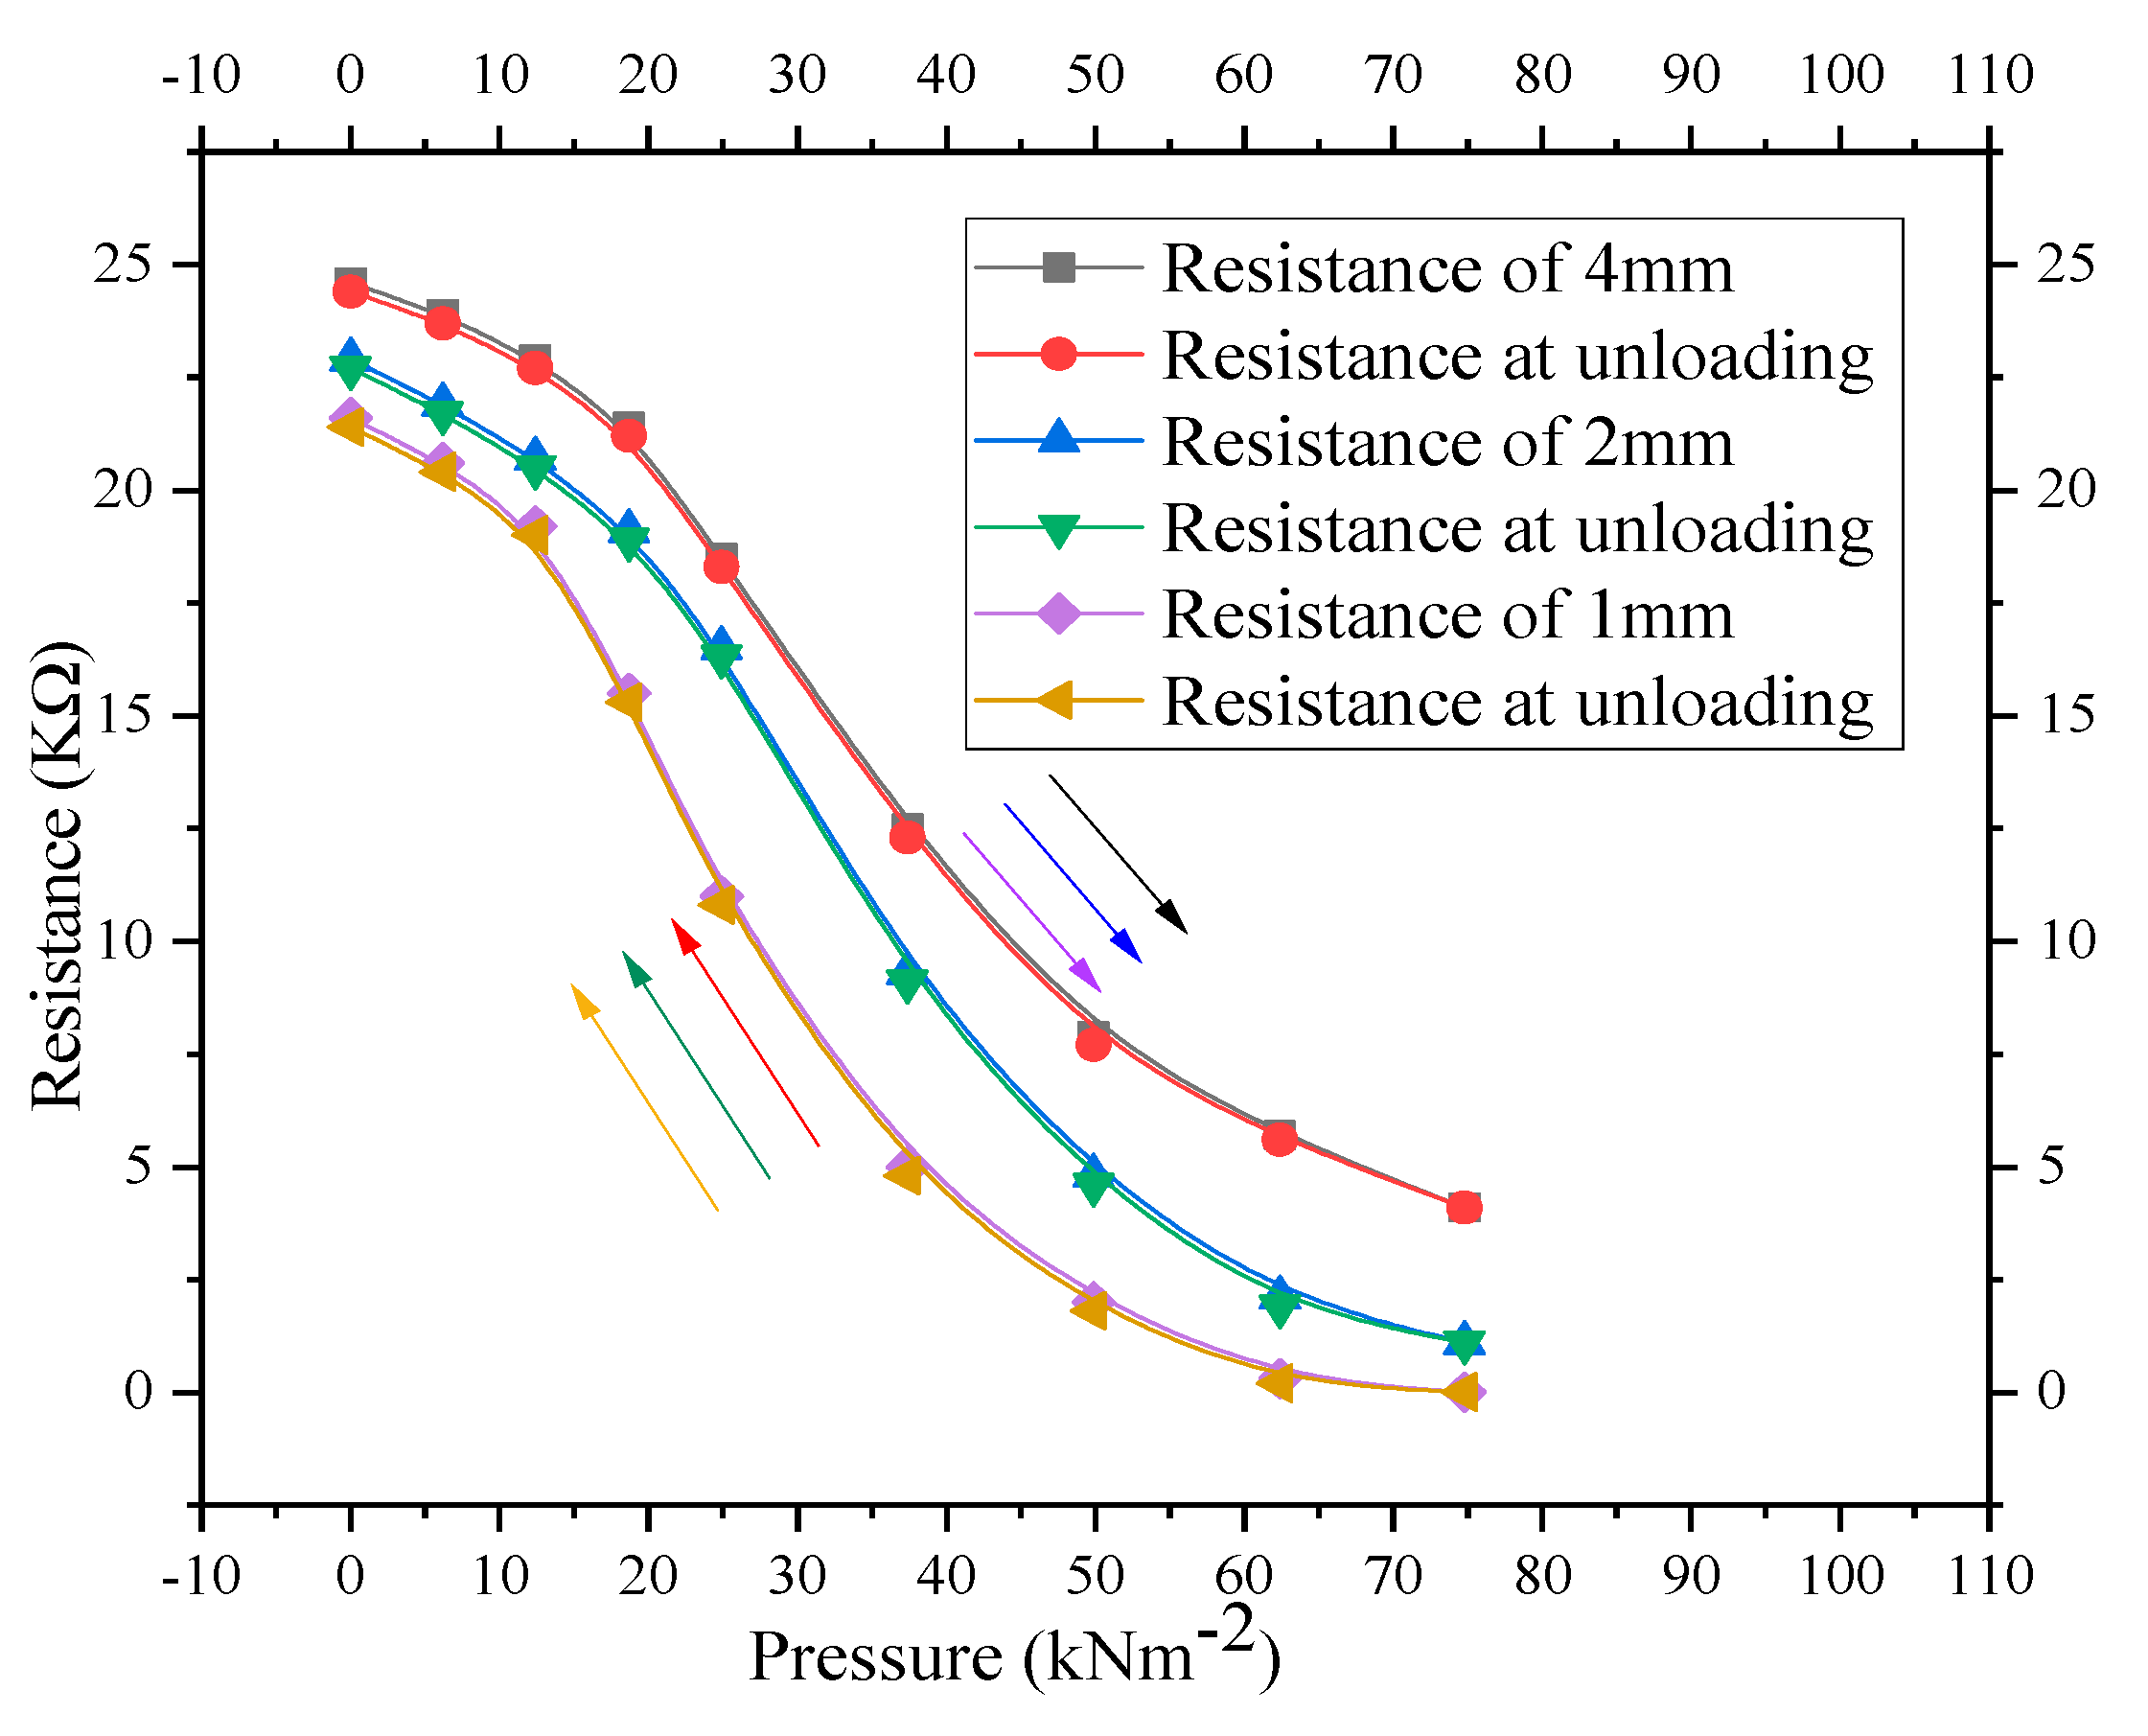
3.3. Resistance Versus Thickness of the Composite
Experimental Versus Simulation
4. Conclusions
Author Contributions
Funding
Institutional Review Board Statement
Informed Consent Statement
Data Availability Statement
Conflicts of Interest
References
- Rashedi, A.; Sridhar, I.; Tseng, K.J. Multi-Objective Material Selection for Wind Turbine Blade and Tower: Ashby’s Ap-proach. Mater. Des. 2012, 37, 521–532. [Google Scholar] [CrossRef]
- Rashedi, A.; Sridhar, I.; Tseng, K. Fracture characterization of glass fiber composite laminate under experimental biaxial loading. Compos. Struct. 2016, 138, 17–29. [Google Scholar] [CrossRef]
- Marinho, B.; Ghislandi, M.; Tkalya, E.; Koning, C.E.; de With, G. Electrical conductivity of compacts of graphene, mul-ti-wall carbon nanotubes, carbon black, and graphite powder. Powder Technol. 2012, 221, 351–358. [Google Scholar] [CrossRef]
- Hofmann, H. Advanced Nanomaterials; Powder Technology, Laboratory: Zürich, Switzerland, 2009. [Google Scholar]
- Kang, S.-T.; Seo, J.-Y.; Park, S.-H. The Characteristics of CNT/Cement Composites with Acid-Treated MWCNTs. Adv. Mater. Sci. Eng. 2015, 2015, 1–9. [Google Scholar] [CrossRef]
- Warner, J.H.; Schaffel, F.; Rummeli, M.; Bachmatiuk, A. Graphene: Fundamentals and Emergent Applications; Newnes: Wolgan Valley, Australia, 2013; p. 101. [Google Scholar]
- Hurst, A.M.; Lee, S.; Petrone, N.; Vandeweert, J.; Van Der Zande, A.M.; Hone, J. A transconductive graphene pressure sensor. In 2013 Transducers & Eurosensors XXVII: The 17th International Conference on Solid-State Sensors, Actuators and Microsystems (Transducers & Eurosensors XXVII); Institute of Electrical and Electronics Engineers (IEEE): New York, NY, USA, 2013; pp. 586–589. [Google Scholar]
- Khan, A. Characterization of Organic Materials for Electromechanical Sensors. Ph.D. Thesis, Ghulam Ishaq Khan Institute of Engineering Sciences & Technology, Swabi, Pakistan, 2013. [Google Scholar]
- Mittal, G.; Dhand, V.; Rhee, K.Y.; Park, S.-J.; Lee, W.R. A review on carbon nanotubes and graphene as fillers in reinforced polymer nanocomposites. J. Ind. Eng. Chem. 2015, 21, 11–25. [Google Scholar] [CrossRef]
- Karimov, K.S.; Ahmed, N.; Bashir, M.M.; Aziz, F.; Rizvi, M.Z.; Khan, A.; Tahir, M.; Zaidi, N.A.; Hafeez, M.; Bhatti, A.S. Flexi-ble resistive tensile load cells based on MWCNT/rubber composites. Pigment. Resin Technol. 2015. [CrossRef]
- Karimov, K.S.; Sulaiman, K.; Ahmad, Z.; Akhmedov, K.M.; Mateen, A. Novel pressure and displacement sensors based on carbon nanotubes. Chin. Phys. B 2015, 24, 018801. [Google Scholar] [CrossRef]
- Jureshchi, C.M.; Linares, J.; Rotaru, A.; Ritti, M.H.; Parlier, M.; Dîrtu, M.M.; Wolff, M.; Garcia, Y. Pressure sensor via opti-cal detection based on a 1D spin transition coordination polymer. Sensors 2015, 15, 2388–2398. [Google Scholar] [CrossRef]
- Tian, H.; Shu, Y.; Wang, X.-F.; Mohammad, M.A.; Bie, Z.; Xie, Q.-Y.; Li, C.; Mi, W.-T.; Yang, Y.; Ren, T.-L. A Graphene-Based Resistive Pressure Sensor with Record-High Sensitivity in a Wide Pressure Range. Sci. Rep. 2015, 5. [Google Scholar] [CrossRef]
- Chen, X.; Zheng, X.; Kim, J.-K.; Li, X.; Lee, D.-W. Investigation of graphene piezoresistors for use as strain gauge sensors. J. Vac. Sci. Technol. B 2011, 29, 6. [Google Scholar] [CrossRef]
- Sahatiya, P.; Badhulika, S. Eraser-based eco-friendly fabrication of a skin-like large-area matrix of flexible carbon nanotube strain and pressure sensors. Nanotechnology 2017, 28, 095501. [Google Scholar] [CrossRef]
- Jiang, N.; Namilae, S.; Unnikrishnan, V.U. Silicone/Carbon Nanotube Sheet Biofidelic Piezoresistive Sandwich Composites. J. Eng. Mater. Technol. 2019, 142, 011009. [Google Scholar] [CrossRef]
- Devi, R.; Gill, S.S. A squared bossed diaphragm piezoresistive pressure sensor based on CNTs for low pressure range with enhanced sensitivity. Microsyst. Technol. 2021, 1–9. [Google Scholar] [CrossRef]
- Zhu, S.-E.; Ghatkesar, M.K.; Zhang, C.; Janssen, G.C.A.M. Graphene based piezoresistive pressure sensor. Appl. Phys. Lett. 2013, 102, 161904. [Google Scholar] [CrossRef]
- Lv, B.; Chen, X.; Liu, C.A. Highly Sensitive Piezoresistive Pressure Sensor Based on Graphene Oxide/Polypyrrole@ Polyu-rethane Sponge. Sensors 2020, 20, 1219. [Google Scholar] [CrossRef]
- Ali, A.; Khan, A.; Karimov, K.S.; Ali, A.; Khan, A.D. Pressure Sensitive Sensors Based on Carbon Nanotubes, Graphene, and Its Composites. J. Nanomater. 2018, 2018, 9592610. [Google Scholar] [CrossRef]
- Fraden, J. Handbook of Modern Sensors: Physics, Designs, and Applications, 2nd ed. Am. J. Phys. 1998, 66, 357–359. [Google Scholar] [CrossRef]
- Kumar, N. Comprehensive Physics; Luxmi Publications (P) LTD: New Delhi, India, 2005. [Google Scholar]
- Karimov, K.S.; Khalid, F.A.; Chani, M.T.S. Carbon nanotubes based strain sensors. Measurement 2012, 45, 918–921. [Google Scholar] [CrossRef]
- Karimov, K.S.; Chani, M.T.S.; Khalid, F.A.; Khan, A.; Khan, R. Carbon nanotube—Cuprous oxide composite based pressure sensors. Chin. Phys. B 2012, 21, 16102. [Google Scholar] [CrossRef]
- Ali, A.; Ali, F.; Irfan, M.; Muhammad, F.; Glowacz, A.; Antonino-Daviu, J.A.; Caesarendra, W.; Qamar, S. Mechanical Pres-sure Characterization of CNT-Graphene Composite Material. Micromachines 2020, 11, 1000. [Google Scholar] [CrossRef]
- Zhu, Y.; Cai, H.; Ding, H.; Pan, N.; Wang, X. Fabrication of Low-Cost and Highly Sensitive Graphene-Based Pressure Sen-sors by Direct Laser Scribing Polydimethylsiloxane. ACS Appl. Mater. Interfaces 2019, 11, 6195–6200. [Google Scholar] [CrossRef] [PubMed]


| Fabricated Sensor | Co (kN−2m2) | C1 (kN−2m2) | C2 (kN−2m2) | C3 (kN−2m2) |
|---|---|---|---|---|
| CNT50 (13,789.5) | 23.51275 | 0.0595 | −0.01548 | 1.45137 × 10⁻⁴ |
| CNT50 (27,579.02) | 22.85745 | −0.02818 | −0.01305 | 1.28144 × 10⁻⁴ |
| CNT50 (55,158.05) | 22.07015 | −0.111 | −0.01037 | 1.07175 × 10⁻⁴ |
Publisher’s Note: MDPI stays neutral with regard to jurisdictional claims in published maps and institutional affiliations. |
© 2021 by the authors. Licensee MDPI, Basel, Switzerland. This article is an open access article distributed under the terms and conditions of the Creative Commons Attribution (CC BY) license (https://creativecommons.org/licenses/by/4.0/).
Share and Cite
Ali, A.; Ali, F.; Rashedi, A.; Armghan, A.; Fazita, M.R.N.; Alenezi, F.; Babu, N.B.K. Fabrication and Characterization of Physical and Mechanical Properties of Carbon Nanotubes—Graphene-Based Sandwich Composite Pressure Sensor. Nanomaterials 2021, 11, 1284. https://doi.org/10.3390/nano11051284
Ali A, Ali F, Rashedi A, Armghan A, Fazita MRN, Alenezi F, Babu NBK. Fabrication and Characterization of Physical and Mechanical Properties of Carbon Nanotubes—Graphene-Based Sandwich Composite Pressure Sensor. Nanomaterials. 2021; 11(5):1284. https://doi.org/10.3390/nano11051284
Chicago/Turabian StyleAli, Asar, Farman Ali, Ahmad Rashedi, Ammar Armghan, M. R. Nurul Fazita, Fayadh Alenezi, and N. B. Karthik Babu. 2021. "Fabrication and Characterization of Physical and Mechanical Properties of Carbon Nanotubes—Graphene-Based Sandwich Composite Pressure Sensor" Nanomaterials 11, no. 5: 1284. https://doi.org/10.3390/nano11051284
APA StyleAli, A., Ali, F., Rashedi, A., Armghan, A., Fazita, M. R. N., Alenezi, F., & Babu, N. B. K. (2021). Fabrication and Characterization of Physical and Mechanical Properties of Carbon Nanotubes—Graphene-Based Sandwich Composite Pressure Sensor. Nanomaterials, 11(5), 1284. https://doi.org/10.3390/nano11051284