Abstract
The use of carbon dots (CDs) with dual emission based on ratiometric fluorescence has been attracting attention in recent times for more accurate ion detection since they help avoid interference from background noise, probe concentration, and complexity. Herein, novel dual-emission nitrogen-doped CDs (NCDs) were prepared by a simple method for Cu2+ and ClO- detection. The NCDs showed excellent anti-interference ability and selectivity for different emissions. In addition, a good linear relationship was observed between the fluorescence intensity (FI) of the NCD solutions in different emissions with Cu2+ (0–90 μM) and ClO− (0–75 μM). The limits of both Cu2+ detection and ClO− were very low, at 17.7 and 11.6 nM, respectively. The NCDs developed herein also showed a good recovery rate in water for Cu2+ and ClO− detection. Hence, they are expected to have a more extensive application prospect in real samples.
1. Introduction
Carbon dots (CDs) are widely used for ion detection [1,2,3], biological imaging [4,5], and disease diagnosis and treatment [6,7] because of their excellent optical properties, good biocompatibility, low biotoxicity, and low cost [8,9,10]. Among these, ion detection is the most common application of CDs, and good results have been achieved for actual sample detection with CDs. CDs are particularly useful for detecting ions because of their good selectivity [11,12,13], low detection limit [14,15], and wide detection range [16,17,18], and hence, they are attracting the increasing interest of the research community. However, the vast majority of CDs used for ion detection display only single emission, which makes the detection system susceptible to background noise and probe concentration, as well as the complexity of the real sample. As a result, the accuracy and application value of the experimental results greatly decrease. Therefore, a new ion detection method needs to be developed that can be used more widely in real-life samples and provide more accurate detection results.
Recently, dual-emission CDs based on ratiometric fluorescence have been used to develop novel methods for more accurate ion detection [19,20,21,22,23,24,25,26,27]. The mechanism depends on the fluorescent properties of the dual-emission CDs. The two different emission centers of these CDs show different levels of sensitivity to ions. The exact content of the detected ions can be calculated by establishing a proportional relationship between the fluorescence intensities of different emission centers. Due to the built-in correction of two distinct emission centers, this method can effectively reduce background interference. Some novel ratiometric CDs have been used as probes to detect different ions. Zhu et al. prepared dual-emission CDs centered at 485 and 644 nm [28]. The fluorescence peak of the CDs at 485 nm was gradually quenched by Cu2+, while that at 644 nm maintained its original intensity throughout. Thus, these CDs could be used as a ratiometric fluorescent sensor for Cu2+ ions. Some ratiometric probes can be used to detect different ions simultaneously [29,30,31,32]. Wang et al. carbonized glutathione in a water/formamide mixture to prepare novel dual-emission CDs [33], which displayed two emissions at 470 and 655 nm. The CDs of the two ions did not interfere with each other; when Fe3+ was added to the CD solutions, the emission center of the CDs at 655 nm displayed a clear quenching. Similarly, when Zn2+ was added to the CD solutions, the emission center of the CDs at 470 nm displayed an obvious quenching effect. Thus, the CDs can be used as a good dual-ratiometric probe for simultaneous detection of Zn2+ and Fe3+.
Although dual-ratiometric probes have significant advantages, very few such probes can accurately detect the common ions. Therefore, it is necessary to develop suitable dual-ratiometric probes for the accurate detection of common ions. This work explores novel dual-ratiometric nitrogen-doped carbon dots (NCDs) and uses them to effectively and simultaneously detect Cu2+ and ClO−.
2. Experimental Section
2.1. Chemicals
For this study, 2,4-dihydroxybenzoic acid and glycine were supplied by Macklin (Shanghai, China). Metal salts (NaClO, CuSO4, MnCl2·4H2O, NaSO3, KH2PO4, Pb(NO3)2, (CH3COO)2Zn, NaF, KCl, NaBr, NaHCO3, BaCl2·2H2O, AgNO3, Na2H2PO2, Ni(NO3)2·6H2O, CaCl2, MgCl2·6H2O, CrCl3·6H2O), and other chemicals such as K2CO3, NaOH, and HCl were supplied by Macklin (Shanghai, China). All raw chemicals were of analytical grade and were used without further purification. Ultrapure water was prepared using a Milli-Q system (Millipore, Burlington, MA, USA).
2.2. Instruments
The microstructure and optical properties of the NCDs were investigated. Transmission electron microscopy (TEM) was performed using FEI Tecnai G2 F20 to observe the morphologies of the NCDs. The chemical composition of the NCDs was analyzed by XPS (Thermo ESCALAB 250Xi). Fourier transform infrared spectroscopy (FT–IR, Nicolet 5700 spectrometer, Thermo Electron Corp, Waltham, MA, USA) was used to identify the chemical structures of the NCDs. Ultraviolet–visible (UV–vis) spectroscopy (UV-2550 Shimadzu, Kyoto, Japan) and fluorescence spectroscopy (Varian Cary Eclipse Agilent, USA) were used to determine the optical properties of the NCDs.
2.3. Synthesis of NCDs
First, 2,4-dihydroxybenzoic acid (2 g), glycine (1 g), and ultrapure water (40 mL) were weighed and placed in a Teflon-lined autoclave. Next, the mixture was heated to 200 °C for 24 h, and the primary product was obtained after allowing the mixture to cool naturally to room temperature. Finally, the NCD solutions were obtained by performing dialysis for 3 days and lyophilized to obtain the final NCD powders.
2.4. Specificity of Cu2+ and ClO− Detection
To elucidate the specificity of the NCDs as probes for ion detection, different ion solutions (2 mM) and NCD solutions (1.0 mg/mL) were added to a 5 mL colorimetric tube. The following ions were used to make the ion solutions: ClO−, Cu2+, Mn2+, SO32-, K+, H2PO4−, NO3−, Zn2+, F−, Cl−, Br−, HCO3−, Ba2+, Pb2+, Ag+, H2PO2−, Ni2+, Ca2+, K+, Mg2+, SO42−, AC−, Cr3+, and CO32−. Their effect on the FI of NCDs was observed at 311 and 497 nm under 458 nm and 515 nm excitation sources, respectively. All experiments were performed more than thrice.
2.5. Determination of the Standard Curve for ClO− and Cu2+ Detection
ClO- and NCD solutions were added in different concentrations (0, 5.0, 10.0, 15.0, 25.0, 35.0, 45.0, 55.0, 65.0, and 75.0 μM) to a 5 mL colorimetric tube, and their FI spectra were recorded under 311 and 497 nm excitations. All experiments were performed more than thrice.
Similarly, Cu2+ and NCD solutions were added in different concentrations (0, 10.0, 20.0, 30.0, 40.0, 50.0, 60.0, 70.0, 80.0, and 90.0 μM) to a 5 mL colorimetric tube, and their FI spectra were also recorded under 311 and 497 nm excitations. All experiments were performed more than thrice.
2.6. Analysis of Real Samples
Real samples (tap water) were first filtered through the 0.22 μm PES water phase membrane. The filtered water samples were then spiked with ClO− and Cu2+ to obtain different concentrations of ClO− and Cu2+ solution (1.0 μM, 2.0 μM, and 3.0 μM). Then, NCDs were added into each of these solutions, and the content of ClO− and Cu2+ in the solutions was quantified by the FI, respectively. All experiments were performed in triplicate.
3. Results and Discussion
The morphology of the as-prepared NCDs was observed using TEM. As shown in Figure 1a, the NCDs possessed a monodisperse spherical structure with uniform sizes. FTIR and XPS were used to determine the chemical composition and surface groups of the NCDs. As shown in Figure 1b, the peaks at 3240 and 3076 cm−1 in the FT–IR spectrum of the CDs correspond to –OH stretching vibrations and –NH2 stretching vibrations, respectively [34,35]. The peaks corresponding to C=O stretching, C=N stretching vibrations, C–N bending modes, C–N bending modes, and C–O stretching vibrations were located at 1606, 1489, 1384, and 1295 cm−1, respectively. This observation indicated the presence of hydrophilic groups (–OH, –COOH, and –NH2) on the surface of the NCDs, which was further confirmed by the XPS spectrum [36,37,38,39,40], as shown in Figure 1c. The XPS spectra of the NCDs showed that they contained C (29.8%), O (69.0%), and N (1.2%) elements. The high-resolution C 1s spectrum of NCDs exhibits four peaks at 284.88, 286.58, and 288.98 eV, corresponding to C-C, C-O/C-N, and C=O, respectively (Figure 1d). The two peaks at 531.08 and 533.48 eV in the high-resolution O 1s spectrum can be assigned to C-O and C=O, respectively (Figure 1e). The high-resolution N 1s spectrum has two peaks at 400.28 eV (C-N) and 402.38 eV (N-H) (Figure 1f).
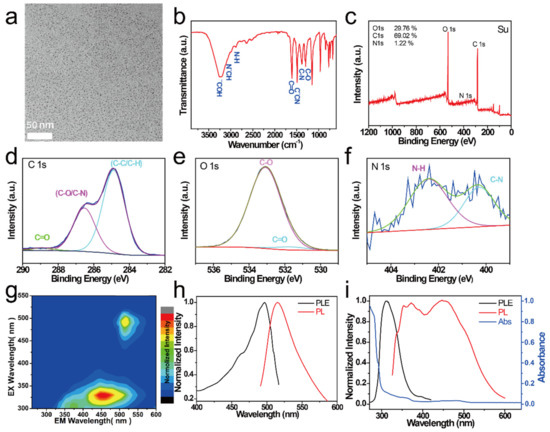
Figure 1.
(a) TEM image, (b) FT–IR spectrum, and (c) XPS spectrum of NCDs. (d) Corresponding high-resolution C1s spectra, (e) O1s spectra, and (f) N1s spectra of NCDs. (g) Excitation–emission color 3D map of NCDs. (h) Excitation (black curve) and fluorescence (FL) spectra (red curve) of NCDs (311 nm excitation). (i) Absorption (blue curve), excitation (black curve), and fluorescence (FL) spectra (red curve) of NCDs (497 nm excitation).
The optical properties of the NCDs were investigated using fluorescence spectra and UV–visible absorption spectra. The excitation–emission 3D color map of the NCDs is shown in Figure 1g; three luminescence centers can be observed, one each at ~372, ~454, and ~515 nm (Figure 1h,i). The centers at 372 and 454 nm were excited by the 311 nm excitation, while the one at 515 nm was excited by the 497 nm excitation. Figure 1i shows the UV–vis absorption spectra of NCDs, where three peaks at 292 nm (π−π*), 360 nm (n−π*), and 478 nm (excitonic absorption band) were clearly observed.
Next, the chemical and optical stabilities of the NCDs were studied. As shown in Figure 2a, no clear change was observed in the FI, which shows that an increase in the concentration of NaCl increases the salt stability of the NCDs. The FI of the NCDs was also detected under UV light (365 nm) exposure (Figure 2b). It was observed that the FI of NCDs changed little with time, implying that NCDs have good stability. When Cu2+ was added to the NCDs, the FI rapidly quenched (<1 min) (Figure 2c). The FI similarly quenched quickly when ClO− was added to the NCDs (Figure 2d). These results show that the NCDs are sensitive to both Cu2+ and ClO−. When Cu2+ and ClO− solutions of different pH were added to the NCDs, the FI of the NCDs did not show a significant change in the pH range of 4–14 (Figure 2e). Hence, it can be inferred that NCDs are not affected by the change in pH. After quenching by Cu2+ and ClO−, the NCD solution shows a good signal response to them between pH of 1 and 14 (Figure 2f).
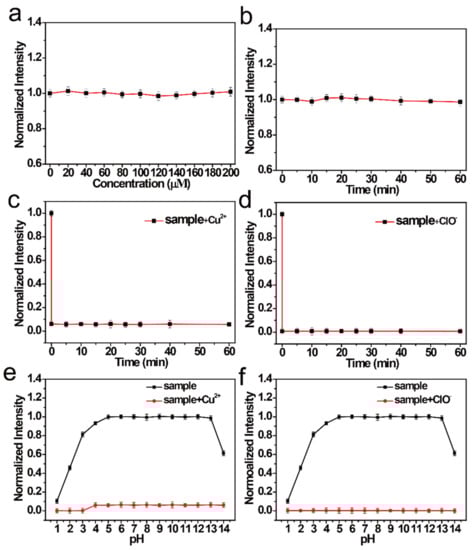
Figure 2.
(a) Normalized FI of NCDs with different concentrations of NaCl. (b) Normalized FI of NCDs at different durations under UV light irradiation. Normalized FI of NCDs (c) with Cu2+ and (d) with ClO− at different response times. Normalized FI of NCDs under different pH values (e) with or without Cu2+ and (f) with or without ClO−.
Different interfering ions were added to the NCD solution to determine the selectivity and sensitivity of the NCDs. Interestingly, interfering ions barely respond to the NCDs at the 454 nm emission center, except for ClO- (Figure 3a). Similarly, they barely respond to the NCDs at the 515 nm emission center, except for Cu2+ (Figure 3c). Hence, it can be suggested that the NCDs can detect Cu2+ and ClO− under different excitations. The anti-interference ability of NCDs was also studied at different emission centers; different interfering ions were added to the NCD solution quenched by Cu2+ and ClO− (Figure 3b,d, respectively). These data show that NCDs have a good anti-interference ability to detect Cu2+ and ClO− in different emission centers.
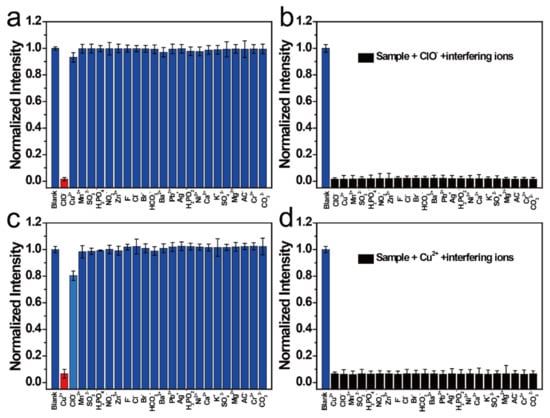
Figure 3.
(a) Normalized FI of NCDs after the addition of various ions. (b) Normalized FI of ClO−-NCDs after the addition of various ions. (c) Normalized FI of NCDs after the addition of various ions. (d) Normalized FI of Cu2+-NCDs after the addition of various ions.
NCDs have good selectivity and sensitivity for the detection of Cu2+ and ClO− in different emission centers. Therefore, the effect of ions on the concentration of the NCDs was studied. The FI of NCDs in the 454 nm emission center gradually weakened with increasing concentration of ClO− (Figure 4a). In contrast, the FI of the NCDs in the 515 nm emission center changed a little with the increasing concentration of ClO−. Hence, NCDs can be used as a novel ratiometric probe for detecting ClO−. Therefore, the relationship between the FI of NCDs in the 454 nm emission center and that of the NCDs in the 515 nm emission center with the same ClO− concentration was further studied. A good linear relationship was observed (Figure 4d). The coefficients (R2) were estimated to be 0.9945 within 0–75 μM by linear fitting. Based on the “three times the standard deviation” rule [41], the limit of detection (LOD) of this probe is estimated to be 11.6 nM. In Figure 4d, the lifetimes of the NCDs decreased with an increase in the quenching degree. The quenching mechanism of the NCDs by ClO− was studied. When ClO− was added to the NCD solution, the strong oxidation destroyed the two emission centers (372 and 454 nm) of the NCDs and enhanced the nonradiative carrier depopulation, leading to a further weakening of the fluorescence intensity. Compared with other probes reported previously, the NCDs probe demonstrated lower LOD and wider range for ClO− detection [12,14,42].
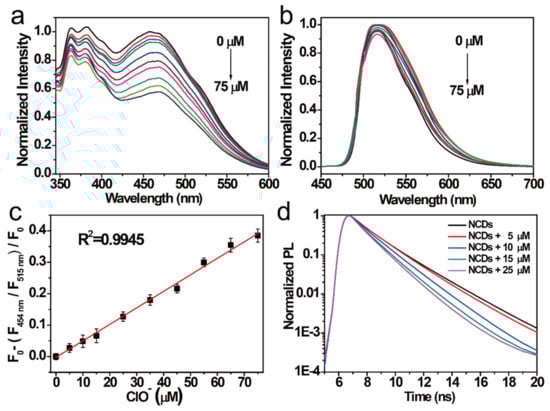
Figure 4.
FI of the NCDs excited by (a) 311 nm radiation and (b) 497 nm radiation after adding different ClO− concentrations (from top to bottom: 0–75 μM). (c) Relationship between the F454 nm/F515 nm ratio versus the ClO- concentrations (0–75 μM). (d) Decay PL spectra of the NCDs quenched by ClO− at different concentrations.
In addition, the relationships between the FI of NCDs at the 454 nm emission center and that at the 515 nm emission center with the same Cu2+ concentrations were studied. The FI of NCDs in the 515 nm emission center gradually weakened with increasing Cu2+, whereas that of NCDs in the 454 nm emission center showed a little change with the same increase in Cu2+ (Figure 5a,b), which is the opposite of the result obtained with ClO−. Thus, NCDs can also be used as a novel ratiometric probe for the simultaneous detection of Cu2+. The linear relationship was further established, and the coefficients (R2) were estimated to be 0.9974 by linear fitting within 0–90 μM. The LOD of this probe was calculated to be 17.7 nM (Figure 5c). The quenching mechanism of the NCDs by Cu2+ was investigated by studying the change in the NCD lifetime (Figure 5d). When Cu2+ was added to the NCD solution, Cu2+ bounded to the surface group of the NCDs by coordination interaction and inhibited the n–π* transition of NCDs in the 515 nm emission center. Similar, compared with other probes reported previously, the NCDs probe demonstrated lower LOD and wider range for Cu2+ detection [43,44,45].
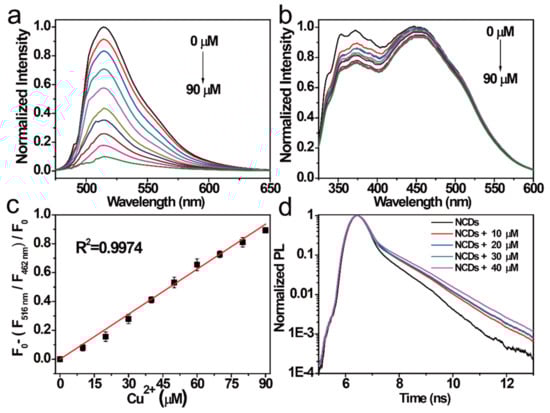
Figure 5.
FI of the NCDs excited by (a) 497 nm radiation and (b) 311 nm radiation after the addition of different Cu2+ concentrations (from top to bottom: 0–90 μM). (c) Relationship between the F515nm/F454 nm ratio versus the Cu2+ concentrations (0–90 μM). (d) Decay PL spectra of the NCDs quenched by Cu2+ at different concentrations.
NCDs have high selectivity, sensitivity, wide detection range, and low detection limit for Cu2+ and ClO− detection. Therefore, it can be used as a probe for Cu2+ and ClO− detection in water samples. Herein, water samples from a lab (tap water 1) and home (tap water 2) were used. Cu2+ and ClO− in different concentrations were added to the NCD solutions in tap water. The concentrations of Cu2+ and ClO− in different tap water samples were calculated using the additive recovery method. The above results exhibited a good recovery rate and good accuracy for both Cu2+ and ClO− detection (Table 1 and Table 2). Thus, NCDs can be used for ion detection with potential applications in real water samples.

Table 1.
Determination of ClO− in tap water samples (n = 3).
Table 2.
Determination of Cu2+ in tap water samples (n = 3).
4. Conclusions
NCDs were synthesized from 2,4-dihydroxybenzoic acid and glycine via a simple hydrothermal method. The NCDs were found to have high selectivity and sensitivity for Cu2+ and ClO− detection in different emissions. In addition, NCDs have a considerably wide detection range and low detection limit for Cu2+ and ClO− detection based on ratiometric fluorescence, respectively. These results imply that NCDs can be used for the detection of Cu2+ and ClO−, with potential applications in real-life water samples.
Author Contributions
Conceptualization, J.G., S.Y.; methodology, J.G.; validation, S.Y., H.L.; formal analysis, A.L., Y.Z.; investigation, J.G., S.Y., H.L.; resources, A.L., H.C.; data curation, J.G., S.Y., H.L.; writing—original draft preparation, J.G.; writing—review and editing, S.Y., H.L.; supervision, J.S., J.Q.; project administration, W.Y., F.Z.; funding acquisition, J.S., J.Q. All authors have read and agreed to the published version of the manuscript.
Funding
This work has been partially supported by the National Key R&D Program of China (2018YFC0910602), National Natural Science Foundation of China (61975132/61775145/61525503/61620106016/61835009/31771584/61835009/61975127), Guangdong Province Key Area R&D Program (2019B110233004), Guangdong Natural Science Foundation 2020A1515010679, Shenzhen Basic Research Project JCYJ20180305125304883, Natural Science Foundation of Shenzhen University (No. 2019108), and the postgraduate innovation development fund project of Shenzhen University.
Data Availability Statement
The data presented in this study are available on request from the corresponding author. The data are not publicly available due to the author’s readiness to provide it on request.
Conflicts of Interest
The authors declare that they have no conflict of interest.
References
- Gao, W.; Song, H.; Wang, X.; Liu, X.; Pang, X.; Zhou, Y.; Gao, B.; Peng, X. Carbon Dots with Red Emission for Sensing of Pt2+, Au3+, and Pd2+ and Their Bioapplications in Vitro and in Vivo. ACS Appl. Mater. Interfaces 2018, 10, 1147–1154. [Google Scholar] [CrossRef] [PubMed]
- Wei, Z.; Li, H.; Liu, S.; Wang, W.; Chen, H.; Xiao, L.; Ren, C.; Chen, X. Carbon Dots as Fluorescent/Colorimetric Probes for Real-Time Detection of Hypochlorite and Ascorbic Acid in Cells and Body Fluid. Anal. Chem. 2019, 91, 15477–15483. [Google Scholar] [CrossRef]
- Yang, P.; Zhu, Z.; Zhang, T.; Zhang, W.; Chen, W.; Cao, Y.; Chen, M.; Zhou, X. Orange-Emissive Carbon Quantum Dots: Toward Application in Wound pH Monitoring Based on Colorimetric and Fluorescent Changing. Small 2019, 15, e1902823. [Google Scholar] [CrossRef] [PubMed]
- Ge, J.; Jia, Q.; Liu, W.; Guo, L.; Liu, Q.; Lan, M.; Zhang, H.; Meng, X.; Wang, P. Red-Emissive Carbon Dots for Fluorescent, Photoacoustic, and Thermal Theranostics in Living Mice. Adv. Mater. 2015, 27, 4169–4177. [Google Scholar] [CrossRef] [PubMed]
- Liu, J.; Geng, Y.; Li, D.; Yao, H.; Huo, Z.; Li, Y.; Zhang, K.; Zhu, S.; Wei, H.; Xu, W.; et al. Deep Red Emissive Carbonized Polymer Dots with Unprecedented Narrow Full Width at Half Maximum. Adv. Mater. 2020, 32, e1906641. [Google Scholar] [CrossRef]
- Hou, L.; Chen, D.; Wang, R.; Zhang, H.; Zhang, Z.; Nie, Z.; Lu, S. Transformable Honeycomb-Like Nanoassemblies of Carbon Dots for Regulated Multisite Delivery and Enhanced Antitumor Chemoimmunotherapy. Angew. Chem. Int. Ed. 2021, 60, 6581–6592. [Google Scholar] [CrossRef]
- Zhu, S.; Meng, Q.; Wang, L.; Zhang, J.; Song, Y.; Jin, H.; Zhang, K.; Sun, H.; Wang, H.; Yang, B. Highly photoluminescent carbon dots for multicolor patterning, sensors, and bioimaging. Angew. Chem. Int. Ed. 2013, 52, 3953–3957. [Google Scholar] [CrossRef]
- Li, H.; Guo, S.; Li, C.; Huang, H.; Liu, Y.; Kang, Z. Tuning Laccase Catalytic Activity with Phosphate Functionalized Carbon Dots by Visible Light. ACS Appl. Mater. Interfaces 2015, 7, 10004–10012. [Google Scholar] [CrossRef]
- Li, H.; Huang, J.; Song, Y.; Zhang, M.; Wang, H.; Lu, F.; Huang, H.; Liu, Y.; Dai, X.; Gu, Z.; et al. Degradable Carbon Dots with Broad-Spectrum Antibacterial Activity. ACS Appl. Mater. Interfaces 2018, 10, 26936–26946. [Google Scholar] [CrossRef]
- Li, H.; Huang, J.; Lu, F.; Liu, Y.; Song, Y.; Sun, Y.; Zhong, J.; Huang, H.; Wang, Y.; Li, S.; et al. Impacts of Carbon Dots on Rice Plants: Boosting the Growth and Improving the Disease Resistance. ACS Appl. Bio Mater. 2018, 1, 663–672. [Google Scholar] [CrossRef]
- Best, Q.A.; Sattenapally, N.; Dyer, D.J.; Scott, C.N.; McCarroll, M.E. pH-Dependent Si-Fluorescein Hypochlorous Acid Fluorescent Probe: Spirocycle Ring-Opening and Excess Hypochlorous Acid-Induced Chlorination. J. Am. Chem. Soc. 2013, 135, 13365–13370. [Google Scholar] [CrossRef]
- Wang, S.; Wu, S.-H.; Fang, W.-L.; Guo, X.-F.; Wang, H. Synthesis of non-doped and non-modified carbon dots with high quantum yield and crystallinity by one-pot hydrothermal method using a single carbon source and used for ClO− detection. Dyes Pigments 2019, 164, 7–13. [Google Scholar] [CrossRef]
- Lin, Y.; Yao, B.; Huang, T.; Zhang, S.; Cao, X.; Weng, W. Selective determination of free dissolved chlorine using nitrogen-doped carbon dots as a fluorescent probe. Microchim. Acta 2016, 183, 2221–2227. [Google Scholar] [CrossRef]
- Huang, Z.; Lin, F.; Hu, M.; Li, C.; Xu, T.; Chen, C.; Guo, X. Carbon dots with tunable emission, controllable size and their application for sensing hypochlorous acid. J. Lumin 2014, 151, 100–105. [Google Scholar] [CrossRef]
- Li, L.-S.; Jiao, X.-Y.; Zhang, Y.; Cheng, C.; Huang, K.; Xu, L. Green synthesis of fluorescent carbon dots from Hongcaitai for selective detection of hypochlorite and mercuric ions and cell imaging. Sens. Actuators B Chem. 2018, 263, 426–435. [Google Scholar] [CrossRef]
- Lee, J.; Park, J.; Lee, H.H.; Park, H.; I Kim, H.; Kim, W.J. Fluorescence switch for silver ion detection utilizing dimerization of DNA-Ag nanoclusters. Biosens. Bioelectron. 2015, 68, 642–647. [Google Scholar] [CrossRef]
- Cayuela, A.; Soriano, M.; Kennedy, S.; Steed, J.; Valcárcel, M. Fluorescent carbon quantum dot hydrogels for direct determination of silver ions. Talanta 2016, 151, 100–105. [Google Scholar] [CrossRef]
- Gao, X.; Lu, Y.; Zhang, R.; He, S.; Ju, J.; Liu, M.; Li, L.; Chen, W. One-pot synthesis of carbon nanodots for fluorescence turn-on detection of Ag+ based on the Ag+-induced enhancement of fluorescence. J. Mater. Chem. C 2015, 3, 2302–2309. [Google Scholar] [CrossRef]
- Wang, K.; Ren, H.; Li, N.; Tan, X.; Dang, F. Ratiometric fluorescence sensor based on cholesterol oxidase-functionalized mesoporous silica nanoparticle@ZIF-8 core-shell nanocomposites for detection of cholesterol. Talanta 2018, 188, 708–713. [Google Scholar] [CrossRef]
- Liang, S.-S.; Qi, L.; Zhang, R.-L.; Jin, M.; Zhang, Z.-Q. Ratiometric fluorescence biosensor based on CdTe quantum and carbon dots for double strand DNA detection. Sens. Actuators B Chem. 2017, 244, 585–590. [Google Scholar] [CrossRef]
- Xu, X.; He, L.; Long, Y.; Pan, S.; Liu, H.; Yang, J.; Hu, X. S-doped carbon dots capped ZnCdTe quantum dots for ratiometric fluorescence sensing of guanine. Sens. Actuators B Chem. 2019, 279, 44–52. [Google Scholar] [CrossRef]
- Qin, S.-J.; Yan, B. Dual-emissive ratiometric fluorescent probe based on Eu3+/C-dots@MOF hybrids for the biomarker diaminotoluene sensing. Sens. Actuators B Chem. 2018, 272, 510–517. [Google Scholar] [CrossRef]
- Liu, M.L.; Chen, B.B.; He, J.H.; Chun, M.L.; Li, Y.F.; Huang, C.Z. Anthrax biomarker: An ultrasensitive fluorescent ratiometry of dipicolinic acid by using terbi-um(III)-modified carbon dots. Talanta 2019, 191, 443–448. [Google Scholar] [CrossRef]
- Ryu, J.; Lee, E.; Lee, K.; Jang, J. A graphene quantum dots based fluorescent sensor for anthrax biomarker detection and its size dependence. J. Mater. Chem. B 2015, 3, 4865–4870. [Google Scholar] [CrossRef]
- Rong, M.C.; Liang, Y.C.; Zhao, D.L.; Chen, B.; Pan, C.; Deng, X.; Chen, Y.; He, Y. A ratiometric fluorescence visual test paper for an anthrax biomarker based on function-alized manganese-doped carbon dots. Sens. Actuators B Chem. 2018, 265, 498–505. [Google Scholar] [CrossRef]
- Chen, H.; Xie, Y.; Kirillov, A.M.; Liu, L.; Yu, M.; Liu, W.; Tang, Y. A ratiometric fluorescent nanoprobe based on terbium functionalized carbon dots for highly sensitive detection of an anthrax biomarker. Chem. Commun. 2015, 51, 5036–5039. [Google Scholar] [CrossRef]
- Rong, M.; Deng, X.; Chi, S.; Huang, L.; Zhou, Y.; Shen, Y.; Chen, X. Ratiometric fluorometric determination of the anthrax biomarker 2,6-dipicolinic acid by using europium(III)-doped carbon dots in a test stripe. Microchim. Acta 2018, 185, 201. [Google Scholar] [CrossRef]
- Zhu, A.; Qu, Q.; Shao, X.; Kong, B.; Tian, Y. Carbon-Dot-Based Dual-Emission Nanohybrid Produces a Ratiometric Fluorescent Sensor for In Vivo Imaging of Cellular Copper Ions. Angew. Chem. Int. Ed. 2012, 51, 7185–7189. [Google Scholar] [CrossRef] [PubMed]
- He, Y.-S.; Pan, C.-G.; Cao, H.-X.; Yue, M.-Z.; Wang, L.; Liang, G.-X. Highly sensitive and selective dual-emission ratiometric fluorescence detection of dopamine based on carbon dots-gold nanoclusters hybrid. Sens. Actuators B Chem. 2018, 265, 371–377. [Google Scholar] [CrossRef]
- Zhai, H.; Bai, Y.; Wang, H.; Qin, J.; Liu, H.; Feng, F. Development of a novel fluorescence ratiometric glucose sensor based on carbon dots and a potential fluorophore m-dihydroxybenzene. Anal. Methods 2018, 10, 5380–5386. [Google Scholar] [CrossRef]
- Xia, Y.K.; Wang, L.L.; Li, J.; Chen, X.Q.; Lan, J.M.; Yan, A.; Lei, Y.; Yang, H.H.; Chen, J.H. A Ratiometric Fluorescent Bioprobe Based on Carbon Dots and Acridone Derivate for Signal Am-plification Detection Exosomal microRNA. Anal. Chem. 2018, 90, 8969–8976. [Google Scholar] [CrossRef]
- Wu, Y.; Wei, P.; Pengpumkiat, S.; Schumacher, E.A.; Remcho, V.T. A novel ratiometric fluorescent immunoassay for human α-fetoprotein based on carbon nanodot-doped silica nanoparticles and FITC. Anal. Methods 2016, 8, 5398–5406. [Google Scholar] [CrossRef]
- Wang, Y.L.; Lao, S.Y.; Ding, W.; Zhang, Z.D.; Liu, S.Y. A novel ratiometric fluorescent probe for detection of iron ions and zinc ions based on dual-emission carbon dots. Sens. Actuators B Chem. 2019, 284, 186–192. [Google Scholar] [CrossRef]
- Dubois, M.; Guérin, K.; Pinheiro, J.; Fawal, Z.; Masin, F.; Hamwi, A. NMR and EPR studies of room temperature highly fluorinated graphite heat-treated under fluorine atmosphere. Carbon 2004, 42, 1931–1940. [Google Scholar] [CrossRef]
- Hamwi, A.; Daoud, M.; Cousseins, J. Graphite fluorides prepared at room temperature 1. Synthesis and characterization. Synth. Met. 1988, 26, 89–98. [Google Scholar] [CrossRef]
- Shi, W.; Guo, F.; Li, M.; Shi, Y.; Tang, Y. N-doped carbon dots/CdS hybrid photocatalyst that responds to visible/near-infrared light irradiation for enhanced photocatalytic hydrogen production. Sep. Purif. Technol. 2019, 212, 142–149. [Google Scholar] [CrossRef]
- Shi, W.; Guo, F.; Li, M.; Shi, Y.; Wu, M.; Tang, Y. Enhanced visible-light-driven photocatalytic H2 evolution on the novel nitrogen-doped carbon dots/CuBi2O4 microrods composite. J. Alloy. Compd. 2019, 775, 511–517. [Google Scholar] [CrossRef]
- Li, H.; Ye, S.; Guo, J.; Wang, H.; Yan, W.; Song, J.; Qu, J. Biocompatible carbon dots with low-saturation-intensity and high-photobleaching-resistance for STED nanoscopy imaging of the nucleolus and tunneling nanotubes in living cells. Nano Res. 2019, 12, 3075–3084. [Google Scholar] [CrossRef]
- Guo, F.; Li, M.; Ren, H.; Huang, X.; Shu, K.; Shi, W.; Lu, C. Facile bottom-up preparation of Cl-doped porous g-C3N4 nanosheets for enhanced photocatalytic degradation of tetracycline under visible light. Sep. Purif. Technol. 2019, 228, 115770. [Google Scholar] [CrossRef]
- Hwang, T.-Y.; Choi, Y.; Song, Y.; Eom, N.S.A.; Kim, S.; Cho, H.-B.; Myung, N.V.; Choa, Y.-H. A noble gas sensor platform: Linear dense assemblies of single-walled carbon nanotubes (LACNTs) in a multi-layered ceramic/metal electrode system (MLES). J. Mater. Chem. C 2018, 6, 972–979. [Google Scholar] [CrossRef]
- Shellaiah, M.; Simon, T.; Kien, S.W.; Ko, F.-H. Simple bare gold nanoparticles for rapid colorimetric detection of Cr3+ ions in aqueous medium with real sample applications. Sens. Actuators B 2016, 226, 44–51. [Google Scholar] [CrossRef]
- Guo, J.; Lin, Y.; Huang, H.; Zhang, S.; Huang, T.; Weng, W. One-pot fabrication of fluorescent carbon nitride nanoparticles with high crystallinity as a highly selective and sensitive sensor for free chlorine. Sens. Actuators B Chem. 2017, 244, 965–971. [Google Scholar] [CrossRef]
- Guo, S.; Lu, S.; Xu, P.; Ma, Y.; Zhao, L.; Zhao, Y.; Gu, W.; Xue, M. Biomimetic synthesis of needle-like fluorescent calcium phosphate/carbon dot hybrid composites for cell labeling and copper ion detection. Dalton Trans. 2016, 45, 7665–7671. [Google Scholar] [CrossRef]
- Ma, X.; Dong, Y.; Sun, H.; Chen, N. Highly fluorescent carbon dots from peanut shells as potential probes for copper ion: The optimization and analysis of the synthetic process. Mater. Today Chem. 2017, 5, 1–10. [Google Scholar] [CrossRef]
- Boonmee, C.; Noipa, T.; Tuntulani, T.; Ngeontae, W.; Boonme, C. Cysteamine capped CdS quantum dots as a fluorescence sensor for the determination of copper ion exploiting fluorescence enhancement and long-wave spectral shifts. Spectrochim. Acta Part A Mol. Biomol. Spectrosc. 2016, 169, 161–168. [Google Scholar] [CrossRef] [PubMed]
Publisher’s Note: MDPI stays neutral with regard to jurisdictional claims in published maps and institutional affiliations. |
© 2021 by the authors. Licensee MDPI, Basel, Switzerland. This article is an open access article distributed under the terms and conditions of the Creative Commons Attribution (CC BY) license (https://creativecommons.org/licenses/by/4.0/).