Article

Detailed Calorimetric Analysis of Mixed Micelle Formation from Aqueous Binary Surfactants for Design of Nanoscale Drug Carriers

1
MTA-SZTE Lendület “Momentum” Noble Metal Nanostructures Research Group, Interdisciplinary Excellence Center, Department of Physical Chemistry and Materials Science, Faculty of Science and Informatics, University of Szeged, Rerrich Béla Square 1, H-6720 Szeged, Hungary
2
MTA-SZTE Biomimetic Systems Research Group, Department of Medical Chemistry, University of Szeged, Dóm Square 8, H-6720 Szeged, Hungary
3
Faculty of Non-Ferrous Metals, AGH University of Science and Technology, Mickiewicza Ave. 30, 30-059 Krakow, Poland
*
Author to whom correspondence should be addressed.
Nanomaterials 2021, 11(12), 3288; https://doi.org/10.3390/nano11123288
Submission received: 10 November 2021 / Revised: 29 November 2021 / Accepted: 1 December 2021 / Published: 3 December 2021
(This article belongs to the Special Issue Nanomaterials for Applied Nanotechnology and Nanoscience)

Abstract

:
While numerous papers have been published according to the binary surfactant mixtures, only a few articles provide deeper information on the composition dependence of the micellization, and even less work attempts to apply the enhanced feature of the mixed micelles. The most important parameter of the self-assembled surfactants is the critical micelle concentration (cmc), which quantifies the tendency to associate, and provides the Gibbs energy of micellization. Several techniques are known for determining the cmc, but the isothermal titration calorimetry (ITC) can be used to measure both cmc and enthalpy change (ΔmicH) accompanying micelle formation. Outcomes of our calorimetric investigations were evaluated using a self-developed routine for handling ITC data and the thermodynamic parameters of mixed micelle formation were obtained from the nonlinear modelling of temperature- and composition- dependent enthalpograms. In the investigated temperature and micelle mole fractions interval, we observed some intervals where the cmc is lower than the ideal mixing model predicted value. These equimolar binary surfactant mixtures showed higher solubilization ability for poorly water-soluble model drugs than their individual compounds. Thus, the rapid and fairly accurate calorimetric analysis of mixed micelles can lead to the successful design of a nanoscale drug carrier.

1. Introduction

Surfactants have been part of our everyday lives for nearly two thousand years, and have been an increasingly used family of compounds in our modern society since the Industrial Revolution [1]. Due to their unique molecular structure, in addition to their commonly known detergent properties, they are widely used as solubilizing [2], stabilizing [3] and emulsifying [4] industrial chemicals and nanomaterials, yet more than half of the amount produced goes to households as a detergent. Enormous amounts of surfactants are produced globally year by year; in 2007 over 3 million tons were produced in Western Europe alone [5]. These surfactants go down the drain and into the water treatment facilities for processing [6]. Despite international regulations to protect our environment, their transport into aquatic life remains a continuous risk, so reducing the quantity produced through applied surfactants is one of today’s important technological challenges [7,8].
Development of environmentally friendly and sustainable technologies requires a comprehensive knowledge of the physicochemical rules that determine the solution and interfacial behavior of surfactants [9]. Much of this knowledge is available in the form of accepted and proven regularities, but due to the extremely diverse use and structural diversity of organic compounds, research to understand the properties of surfactants is still ongoing [10,11,12]. Of these, the study of the co-presence of surfactants with different chemical structures is a separate topic. The formation of mixed micelles, described as an association of two different surfactant molecules, has been a studied phenomenon for decades [13,14], but those physicochemical rules which can describe their formation (cmc value of mixed surfactant systems) and composition (molar fraction in the mixed micelles) are still undetermined. While calorimetric studies of the formation of surfactant micelles formed by individual molecules have been reported by many researchers [15], significantly fewer studies deal with micelle formation in mixed surfactant solutions [16,17]. In contrast, studies that look for a relation between the formation (and composition) and practical applicability of mixed micelles, either theoretically [18] or experimentally [19], are much less common in the literature.
However, mixed micelles of surfactants in aqueous solutions also have varied industrial application (food-, pharmaceutical-, petrochemical industry etc.) [19,20,21,22,23]. When there are adequate synergistic interactions between the individual components of micelles the critical micelle concentration (cmc) of the binary surfactant mixture can be lower and binary mixed micelle is thermodynamically more stable than the single surfactant containing micelle [24]. Deeper understanding of the origin of non-ideal and synergistic behavior may help to design more efficient surfactant mixtures, and in this way reduce the amount of the applied chemicals.
Precise and detailed exploration of this phenomenon is crucial as it may provide deeper information about the synergetic effect in the mixed micelle formation. For this aim, this paper demonstrates a systematic approach by analysis of quantitative calorimetric data for the characterization of aqueous associated colloids from mixed surfactants. Two surfactants with different chemical structures were selected for the experiments where their individual and mixed micelle formation were characterized by ITC method. Based on the results of the calorimetric studies, we tried to determine and analyze the value of the thermodynamic parameters of the formation of mixed micelles as functions of the composition of the bulk phase. Besides, a solubilized amount of a poorly water-soluble model drug was tested by an acidimetric method for finding a relationship between solubilization capability and composition of the mixed micellar system.

2. Materials and Methods

Nonionic- (2-[4-(2,4,4-trimethylpentan-2-yl)phenoxy]ethanol/Triton X-100, hereinafter denoted by TX) and cationic (N,N,N-Trimethylhexadecan-1-aminium bromide/CTABr, hereinafter denoted by CT) surfactants and other chemicals such as benzoic acid (benzenecarboxylic acid/BAc), sodium hydroxide (NaOH) and phenolphthalein (3,3-Bis(4-hydroxyphenyl)-2-benzofuran-1(3H)-one/phph) were purchased from Sigma-Aldrich Hungary Ltd., Budapest, Hungary. The surfactant solutions, their equimolar mixture-containing solutions and alkali measuring solution for acid–base titrations were prepared in a 100-mL volumetric flask and then diluted in deionized water (18 MΩ cm−1 Milli Q, Millipore, Burlington, MA, United States) to the desired concentration. All the starting materials were used without further purification. A syringe filter with a pore diameter of 0.45 µm (Millex-HA mixed cellulose esters (MCE) membrane) was used to filter the saturated and solubilized benzoic acid and surfactants containing colloid systems.
Thermometric titration experiments were performed with a computer-controlled VP-ITC (PTC Ltd., Mosonmagyaróvár, Hungary) power-compensation micro calorimeter (MicroCal) at 293.15, 298.15, 303.15, 308.15 and 313.15 K to determine the cmc (mM) and ΔmicH (kJ∙mol−1) of the nonionic- and cationic surfactants and their mixtures. During the calorimetric titrations, the sample cell was filled with 1.4 mL deionized water, and it was titrated under constant stirring with 300 μL of surfactant solution in aliquots of 10 μL in periodic time intervals of 5 min. The enthalpograms (calorimeter power signal vs. time) were evaluated by means of Origin Microcal 7.1. software (PTC Ltd., Mosonmagyaróvár, Hungary). The extracted enthalpograms (enthalpy of injection per mole of injected surfactant vs surfactant concentration at sample cell) were successfully described by using a modified version of Boltzmann equation [25,26] which has been used to improve the precision of the determination of the characteristic parameters (cmc, ΔmicH).

3. Results and Discussion

During the isothermal titration calorimetric (ITC) measurements, the thermal effect accompanying the dissociation of the individual micelles (CT and TX) was recorded in the solutions of the separate surfactants (θTX-100 = 0.0 and 1.0) and their mixtures (θTX-100 = 0.2; 0.4; 0.6 and 0.8) as a function of time. As an intermediate note, the molar fraction in the mixture (θ1 and θ2) is not the same as the molar fraction describing the whole system (n1, n2 and n3), see the detailed description in Appendix A.

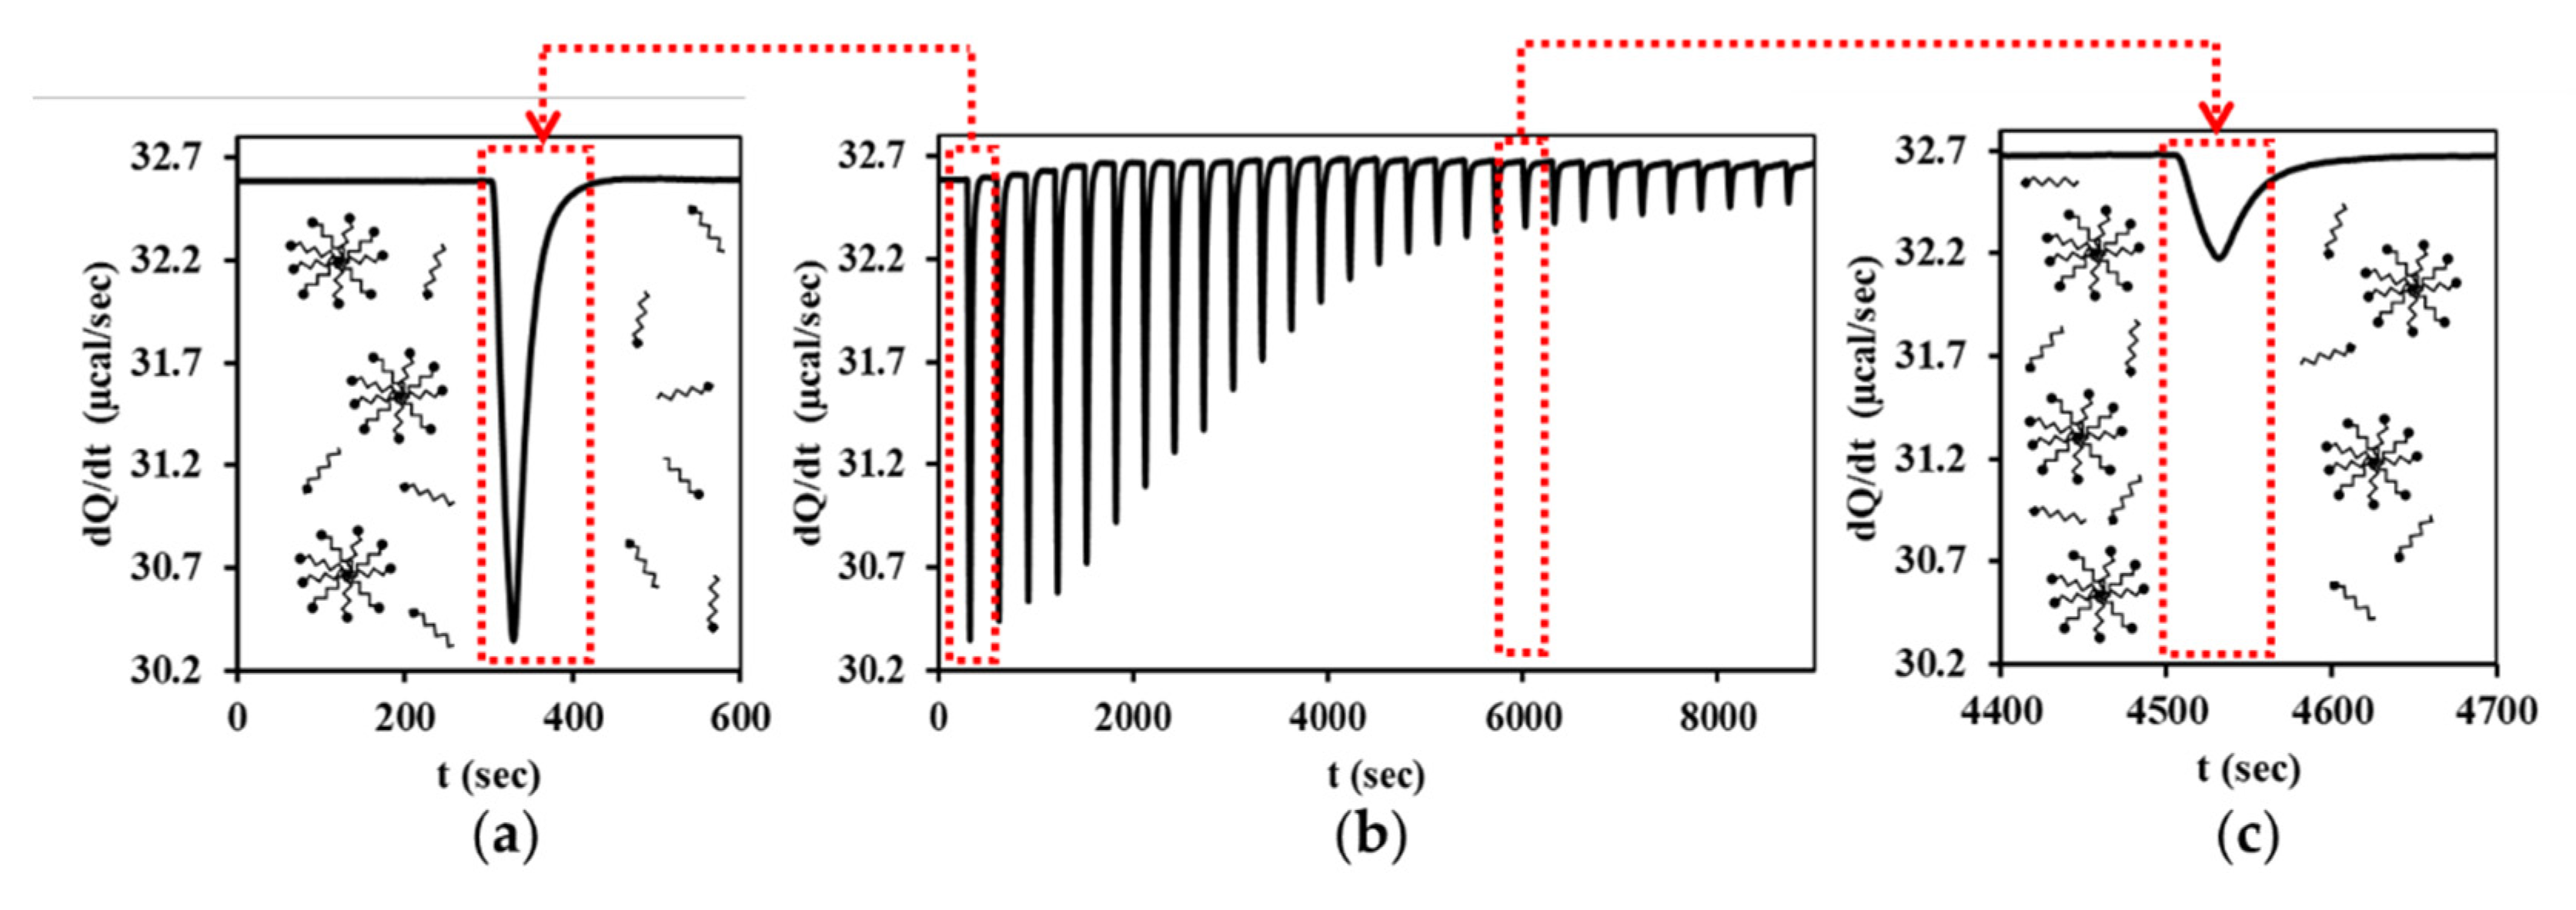
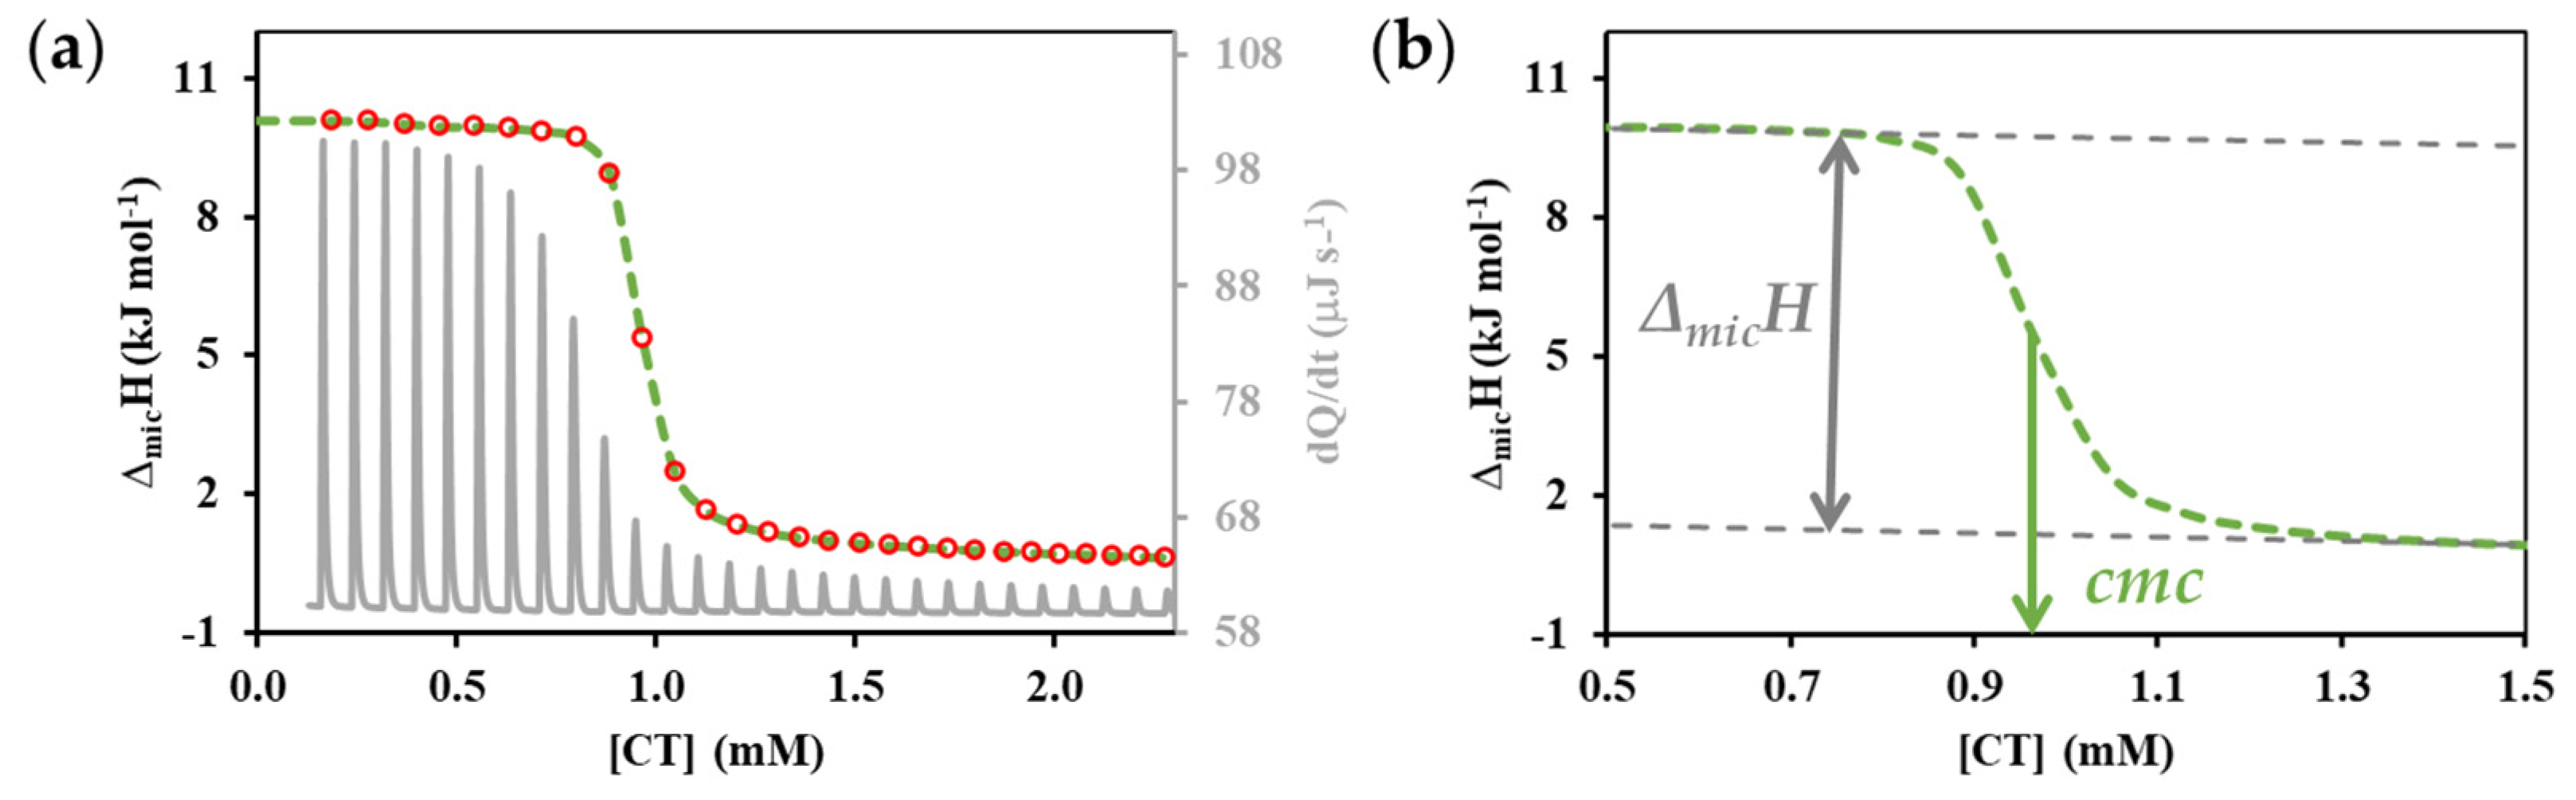
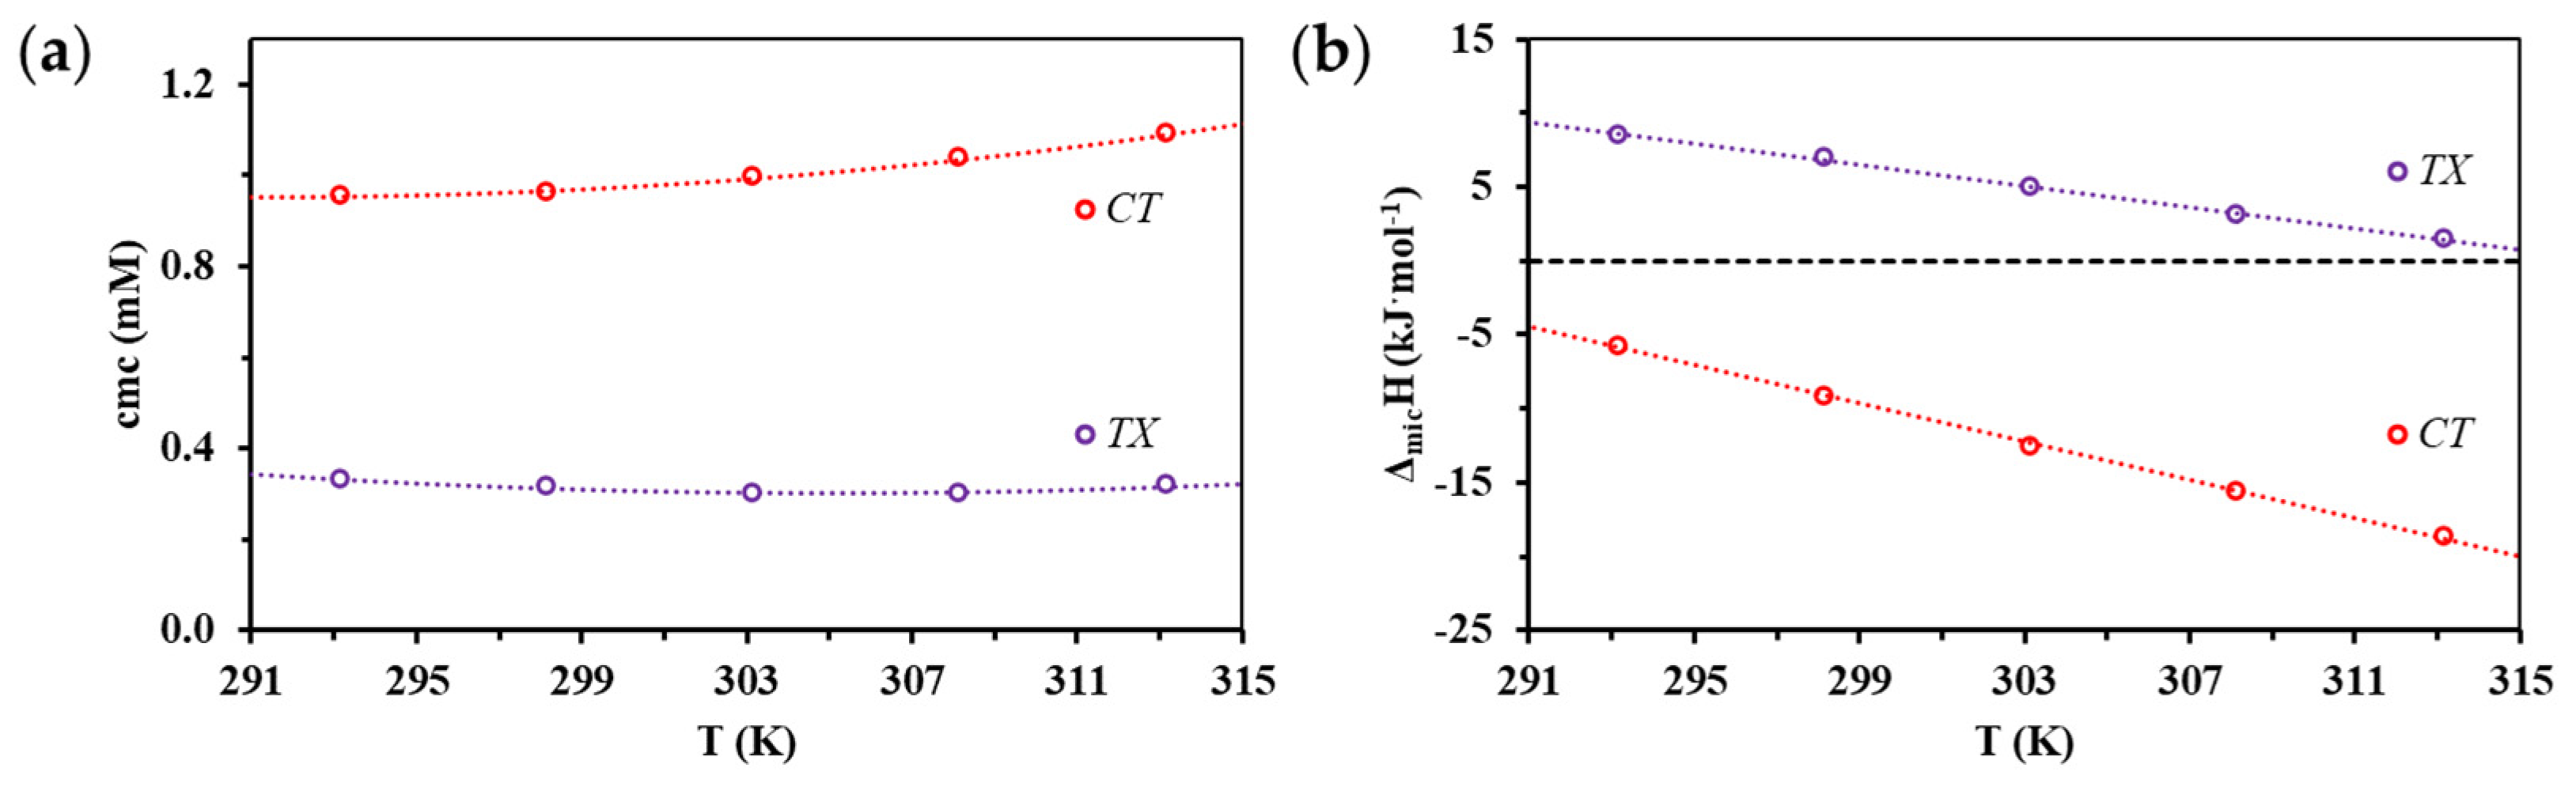
3.1. Micelle Formation of Individual Surfactants

For successful ITC measurements, the sample dosing syringe of the device contained a surfactant solution with a concentration of about 8–10 times higher than actual cmc. The calorimetric curve shown in the middle of Figure 1 was recorded during the addition of the nonionic surfactant (TX) to a measuring chamber filled with deionized water. When a surfactant solution with a concentration greater than cmc is added to deionized water, the micelles initially dissociate into their monomers, as can be seen to the right (a) side of Figure 1. The largest calorimetric signals (heat flux: dQ/dt) can be measured as a function of time in this pre-micellar range. By further sample addition, a transition range (b) is reached where the concentration of surfactant in the measuring cell is already high enough to avoid the dissociation of micelles. Finally exceeding cmc (post-micellar phase) only the dilution of the association colloid can be monitored, as shown in (c) part of Figure 1 schematically.
For the quantitative evaluation of the measurement results, the enthalpy changes for the given dilution state and in our case for the dissociation process must be calculated from the differential peaks of the calorimetric signal sequence (dQ/dt vs. t) shown in the middle part of Figure 1 for each dosing step. The value of the enthalpy change (ΔmicH) corresponding to the area of each peak in relation to the amount of surfactant in the injected solution is given in Origin Microcal 7.1. software, calculated during an appropriate integration process. This calculation step provides the typically sigmodal enthalpograms (ΔmicH/kJ∙mol−1 vs. [surfactant]/mM) of the ITC procedure shown in Figure 2, which can be evaluated using nonlinear parameter estimation method, which is presented through the example of the other surfactant (CT) component. The x coordinate of the inflection points of the sigmoidal curve (the corresponding concentration value on the x-axis) provides the cmc value and the difference in enthalpy values characterizing the pre- and post-micellar range determines the magnitude of the enthalpy change (ΔmicH) attributable to micelle formation, as shown in part (b) of Figure 2. The Boltzmann equation based method [27,28] of calculating provides two fundamental parameters (cmc and ΔmicH) which are described in detail by the Supplement Materials through the evaluation of the enthalpogram of the nonionic component. Based on the nonlinear regression estimated coefficients of the calculated enthalpograms, the cmc of the ionic surfactant (Figure 2b) was found 0.964 ± 0.005 mM and the enthalpy change attributable to exothermic micelle formation was ΔmicH0 = −9.16 ± 0.77 kJ mol−1, for the nonionic (TX) compounds (Figure S1b) the cmc was observed 0.319 ± 0.003 mM and endothermic micelle formation corresponds to an enthalpy of 6.96 ± 0.72 kJ mol−1.
Since, in addition to the change in composition, we also aimed to observe the effects of temperature change, the demicellization of the association colloid formed by the two compounds was studied at several temperatures. Figure 3a summarizes the temperature dependence of the cmc of the tested surfactants determined by ITC studies. Based on the temperature dependence, the enthalpy change accompanying micelle formation (ΔmicHvH) can be calculated according to the van’t Hoff equation, as shown in part (a) and (b) of Figure S2 in the Supporting Material. However, due to the nature of calorimetric measurements, the value of the (ΔmicH) can be obtained directly and more accurately from the experimental data, thus these enthalpy values are indicated in Figure 3b.
According to the result of ITC studies at the entire examined temperature range, the formation of CT micelles is exothermic, while the formation of TX micelles is the result of an endothermic process.

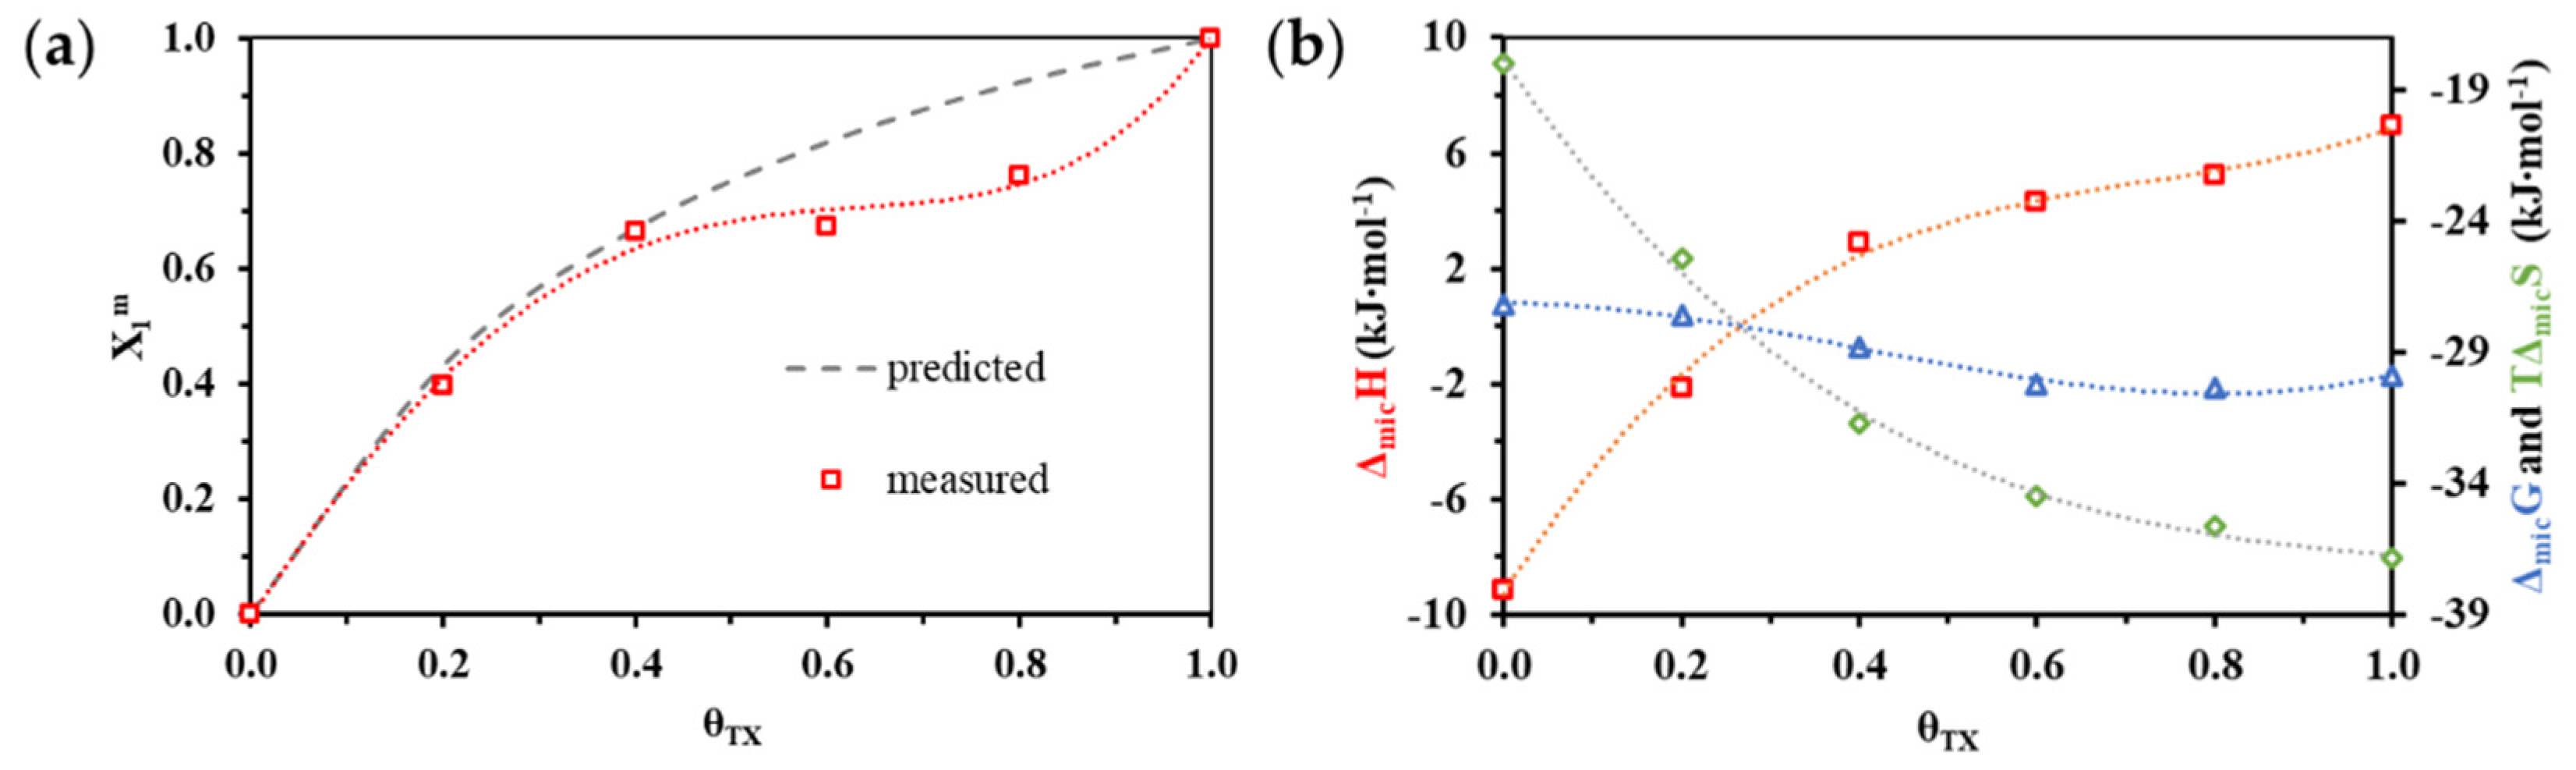
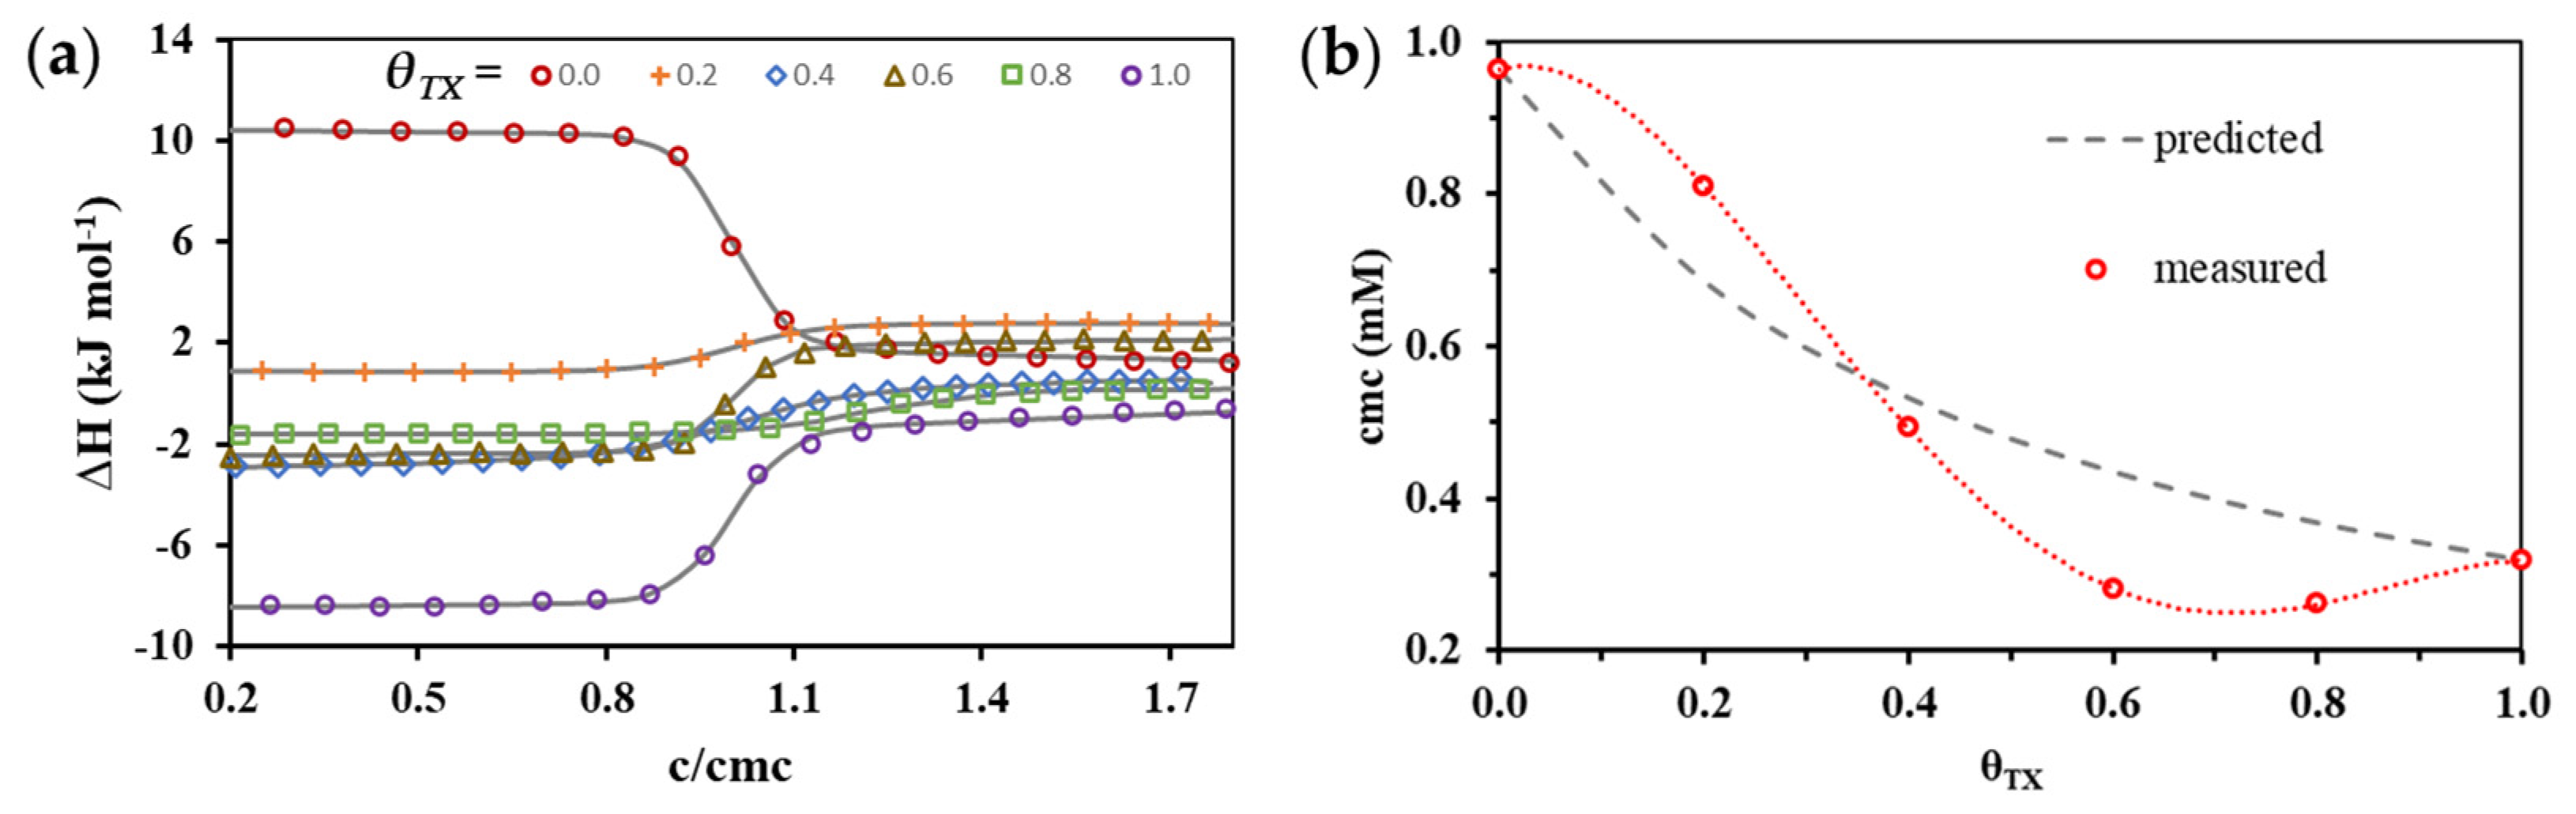
3.2. Thermodynamics (cmc, ΔmicG, ΔmicH and ΔmicS) of Mixed Micelle Formation

Following studies on the formation of micelles from individual CT and TX molecules, solutions were prepared using these surfactants in which the relative molecular fractions (θ) of the two surfactants varied from 0 to 1, respectively, by 0.2 units, while their concentration (ten times larger than the predicted cmc) was a function of ideal behavior values calculated from the theoretical work by Clint [29] (detailed explanation can be found in S.3 part of the Supplement Materials). Since, in addition to the change in composition, we also wanted to study the effect of the change in temperature, the demicellization of the association colloids formed by the two compounds and presumably of mixed composition was examined at several temperatures. In the series of measurements, ITC tests were performed at 293, 298, 303, 308 and 313 K, respectively, for all compositions (θTX = 0.2; 0.4; 0.6 and 0.8), so after the evaluation of the 20 entalpograms, the together with data on pure components, a data set of cmc and a ΔmicH was available. The collective representation of the enthalpograms makes it very difficult to distinguish the data belonging to each measurement, in this way in Figure 4 only the results of the measurements performed at 298 K are presented in a representative way. In addition, for clarity, the concentration axis of Figure 4a was normalized to the enthalpograms of each composition with their respective cmc values, which are summarized in Table 1.
Looking at the enthalpograms summarized in Figure 4a, it can be concluded that even the appearance of small amounts of surfactants with different chemical structures dramatically changes the thermodynamic characteristics accompanying the formation of mixed micelles. The exothermic process accompanying the formation of micelles formed by CT loses the heat release character in the presence of TX. Otherwise, the endothermic property of the formation of micelles formed by pure TX is also decreasing when the ionic component appears in the mixture.
In addition, it can be stated that in aqueous solutions of pure surfactants and their mixtures the largest difference between the calculated and measured cmc values occurs when the nonionic component is present more than 50% in the mixture, as it can be seen in Figure 4b. In the case of a smaller amount the measured cmc value exceeds the predicted value, so we cannot identify an advantageous effect. In contrast, examination of the mixtures showed a favorable influence on the nonionic (TX) component in the 0.4 to 0.8 molar fraction range, resulting in lower micelle formation concentrations than expected. The numerical experimental data of Figure 4b are summarized in Table 1 where be-side the cmc and ΔmicH values and their standard deviations are also listed.
Having the cmc determined by the calorimetric measurements, the composition of the mixed micelles (X1m) is possible based on the calculation procedure provided by Rubingh [30] and discussed in our earliest work [17]. Figure 5a shows the change in the composition (X1m) of the mixed micelles as a function of the molar fraction of the nonionic component in the mixture at 298 K. In addition to the molecular fractions calculated with knowledge of the experimental cmc values, the gray dashed line indicates the evolution of the predicted molecular fractions assuming the ideal behavior [31] (detailed explanation can be found in S.3 part of the Supplement Materials). It can be clearly seen in Figure 5b that the composition of the mixed micelles for the θTX = 0.6 and 0.8 surfactant ratios differ significantly from the molar fraction assuming the ideal behavior (dashed grey lines). In the micelles, the nonionic component is present in smaller amounts than expected in this region, and the enrichment of the cationic surfactant characterizes the composition of the association colloid.
Based on the results of ITC measurements the enthalpy change of micelle formation (ΔmicH) is available, while Gibbs free energy change (ΔmicG) of the association of surfactant monomers can be calculated from the cmc values and knowing the latter parameters, the entropy term (TΔmicG) can also be calculated. Alteration of these state functions can be seen in Figure 5b as a function of composition of bulk phase (θTX) at 298 K. The evolution of the state functions in the case of enthalpy and Gibbs free energy may suggest that an inflection point in the composition range indicates the molar ratios of outstanding significance. To demonstrate the importance of this assumption, the first derivatives of state functions are compared in the following with the results of the solubilization experiments.

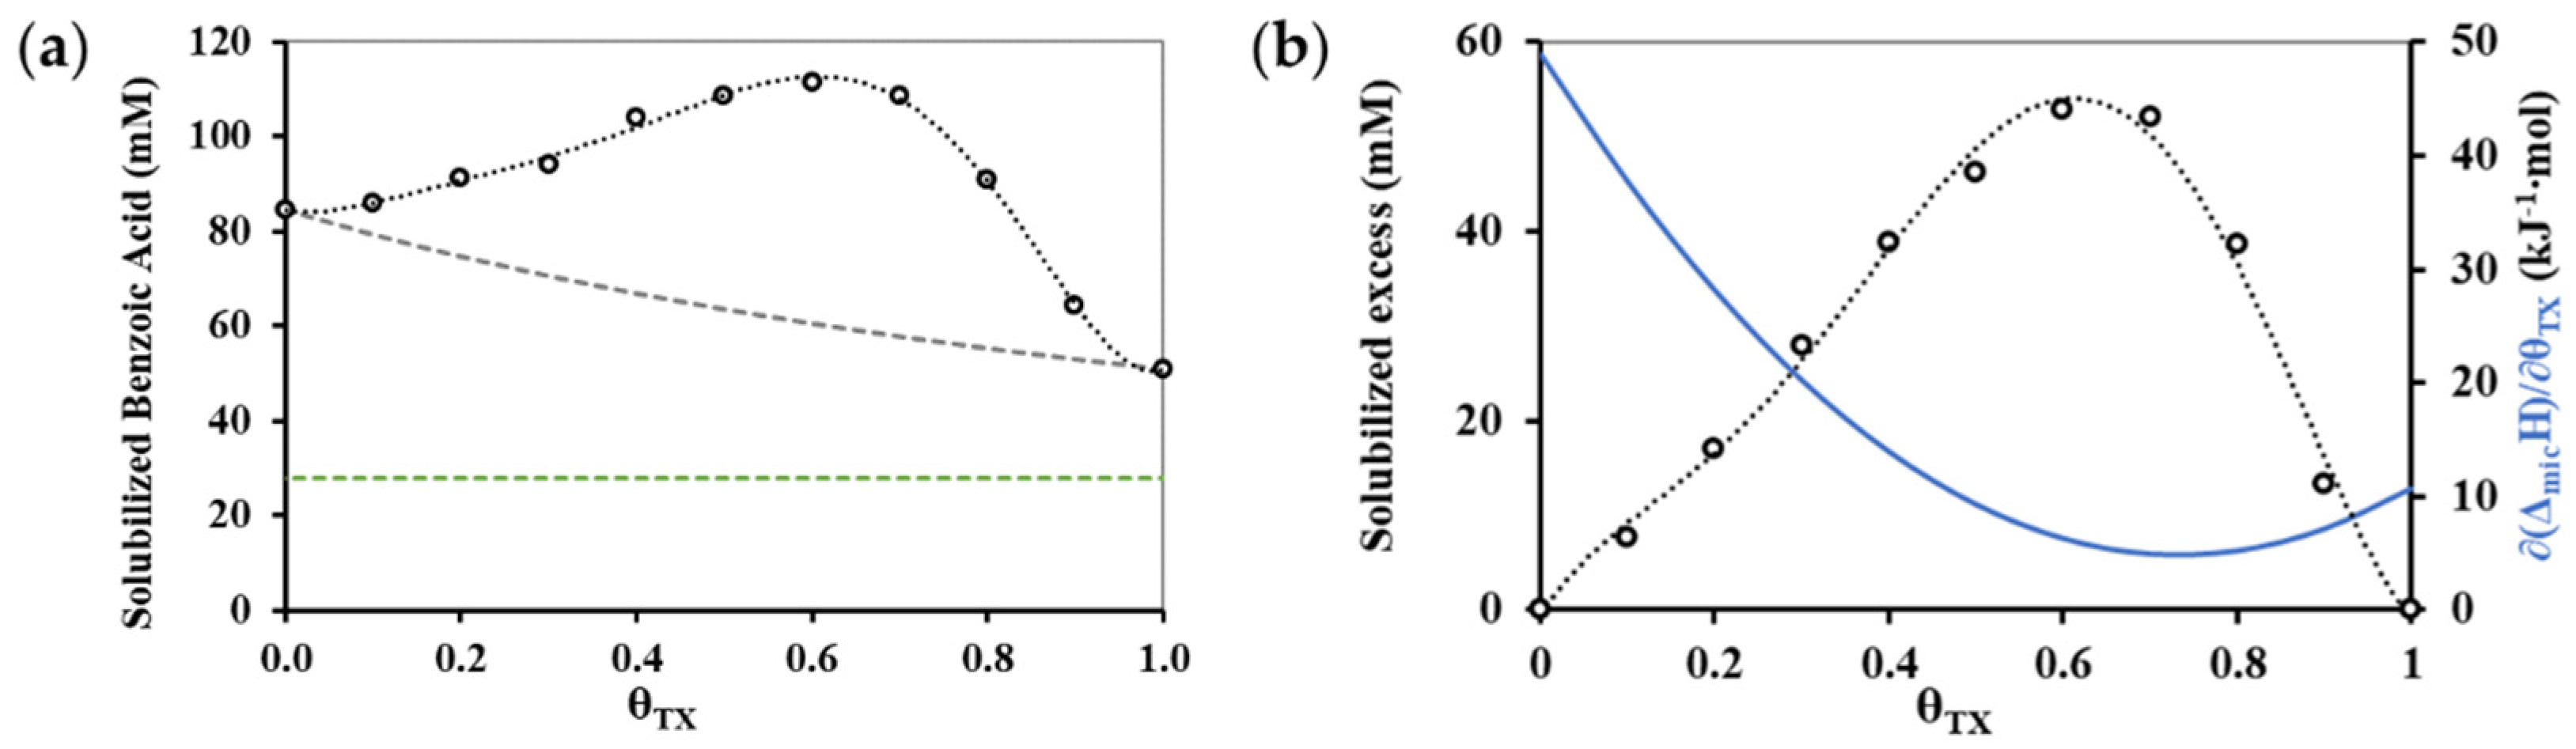
3.3. Composition Dependence of Solubilization Capability of Mixed Micelles

Besides the calorimetric characterization of mixed micelle formation, the solubilisation capabilities of the binary surfactant mixtures were also determined for a model drug using simple acidimetric titration method. During these measurements, a surfactant mixture solution with a 100 mL volume of a surfactant mixture solution with a concentration of 0.06 M at ten different molar fractions (θTX = 0.1; 0.2; 0.3 … 1.0) was prepared from TX and CT surfactants. Weights of 0.5 g of benzoic acid samples were measured into Erlenmeyer flasks and added to 20 mL of the respective surfactant mixture to the solid benzoic acid using automatic pipette. The solution was sonicated for 4 min to aid complete dissolution. After filtration, 5 mL of the filtrate were diluted twice with deionized water and titrated with a predetermined concentration of NaOH solution. Three replicates were made with pure (θTX = 0.0 and 1.0) and mixed (θTX = 0.2; 0.4; 0.6 and 0.8) surfactant solutions. The benzoic acid concentration could be determined from the volume of NaOH consumed during the titration and from the concentration ([NaOH] = 0.0959 M) of alkali solution. To calculate the solubilized benzoic acid concentration, we need to know the saturation concentration of benzoic acid in deionized water, which was also determined by titration and was found 0.0278 M. The difference between the total dissolved benzoic acid concentration and the saturation concentration gives the concentration of solubilized benzoic acid which is presented in Figure 6a as a function of composition of surfactant mixture in the bulk phase.
Experimental and calculated data of Figure 6a are summarized in Table 2 where beside the volume of alkali solution (required for neutralization) and solubilized amount of benzoic acid and standard deviations of these values are also listed. An even clearer picture emerges of the effect of the composition on solubilization ability when the solubilized excess is presented as shown in Figure 6b. The value of the excess can be obtained by calculating the solubilization capacity as stated by the ideal behavior [29], and based on the solubilization ability of the pure components. These predicted values are then subtracted from the experimentally determined data and presented in Figure 6b beside the first derivative of the enthalpy change of micelle formation (∂(ΔmicH)/∂θTX). Figure 6b proves that the minimum of the first derivatives of enthalpy function is located at a composition that can be characterized by maximum solubilization capability.

4. Conclusions

Summarizing the results of the presented investigations, we can state that due to the universal nature of the isothermal titration calorimetric method, the value of critical micelle concentration (cmc) and the enthalpy change of micelle formation (ΔmicH)/∂θTX) were successfully determined for unique surfactants as well as their mixtures. Due to this technique, we were able to determine the cmc of both individual surfactants and mixtures, so we had the opportunity to calculate the temperature dependence of the thermodynamic parameters and determine their standard deviation. Based on the results of ITC experiments in the investigated bulk phase mole fractions range, there are some compositions where the critical micelle concentration is lower than the ideal mixing model calculated value. Finally, we found that the equimolar binary surfactant mixtures showed higher solubilization capacity for poorly water-soluble model drugs than their individual compounds. Therefore, we can conclude that the thermodynamically beneficial compositions of mixed micelles have an advantageous property for application. Namely, they showed an enhanced ability for solubilizing a poorly water-soluble model drug. Thus, the fast and precise calorimetric analysis of mixed micelles could be a productive tool for the development of nanoscale drug carriers.

Supplementary Materials

The following are available online at https://www.mdpi.com/article/10.3390/nano11123288/s1, Figure S1: Calculation of the initial concentration (cmc) and enthalpy change (ΔmicH) attributable to micelle formation knowing the parameters (A1A6) of the Boltzmann equation fitted to the experimental enthalpogram, Figure S2. (a) Natural-based logarithm of cmc of CT and TX surfactants as a function of temperature to form the van ‘t Hoff representation; (b) Changes in the micellization enthalpy of CT and TX surfactants as a function of temperature as determined by ITC studies (ΔmicH red and lilac circles) and by the temperature dependence of cmcmicHvH red and lilac diamonds), Table S1. ITC determined cmc and ΔmicH values and their standard deviation of the nonionic (TX) surfactant at different temperatures, Table S2. ITC determined cmc and ΔmicH values and their standard deviation of the cationic (CT) surfactant at different temperatures.

Author Contributions

Conceptualization, Á.J., E.C. and M.W.; methodology, L.S., N.V. and D.U.; software, Á.J.; investigation, L.S. and N.V.; data curation, D.U.; writing—original draft preparation, Á.J., D.U., M.W. and E.C.; writing—review, Á.J. and E.C.; funding acquisition, E.C. All authors have read and agreed to the published version of the manuscript.

Funding

The research was supported by the GINOP-2.3.2-15-2016-00038 and GINOP-2.3.2-15-2016-00060 and the authors gratefully admit the financial support of the National Research, Development, and Innovation Office-NKFIH through the FK131446 and PD137938 projects. E. Csapó thanks the financial support of the “Momentum” Program of the Hungarian Academy of Sciences (LP2021-5/2021.) The research was partially supported by the ÚNKP-21-4-SZTE-516 new National Excellence Program of the Ministry for Innovation and Technology from the source of the National Research, Development and Innovation Fund.

Institutional Review Board Statement

Not applicable.

Informed Consent Statement

Not applicable.

Data Availability Statement

The data presented in this study are available on request from the corresponding author. All of the raw data are not presented due to their type and large number.

Conflicts of Interest

The authors declare no conflict of interest.

Appendix A

θ1 = n1/(n1 + n2),
where θ1 is the mole fraction of the material arbitrarily chosen as the first surfactant and n1 and n2 are the amounts of the two surfactants in the two-phase and three-component systems. Thus, it is necessary that θ1 + θ2 = 1 and X1 + X2 + X3 = 1 correlations are always fulfilled. Since surfactants can adsorb in the interfacial layer and to form associates in the bulk phase, it is worthwhile to define mole fractions to determine the composition of the adsorption layer and micelles. In the adsorption layer enriched in the interfacial layer, the molar fraction of surfactant 1 is X 1σ, which is defined by n1σ and n2σ, respectively, while X 1m is determined by the molar fraction characterizing the composition of the micelle, which is determined by n1m and n2m.
By examining a surfactant solution, the system can be divided into two phases (air and water) and two components (water and dissolved surfactant). The introduction of the two phases is necessary because, due to the directed location of the detergent at the interface, the air also becomes the determining phase. If only these two components are present, the composition of the solution can be described by two parameters: the molar fraction of water (X1) and the surfactant (X2). When a second surfactant is added to the solution, the system must also be characterized by two phases, but with three components: X1, X2 and the molar fraction of the other surfactant, i.e., X3. Since in this case X1 is much larger than X2 and X3, it is more fortunate to use the relative molar fractions of the two surfactants to characterize the composition of the “surfactant mixture” in the following context, according to the following equation.

References

  1. Sagir, M.; Mushtaq, M.; Tahir, M.S.; Tahir, M.B.; Shaik, A.R. Surfactants. In Surfactants for Enhanced Oil Recovery Applications; Springer International Publishing: Cham, Switzerland, 2020; pp. 1–11. [Google Scholar]
  2. Malik, N.A. Drug Solubilization by Surfactants: Experimental Methods and Theoretical Perspectives. Mini Rev. Med. Chem. 2021, 21. [Google Scholar] [CrossRef] [PubMed]
  3. Pisárčik, M.; Lukáč, M.; Jampílek, J.; Bilka, F.; Bilková, A.; Pašková, L.; Devínsky, F.; Horáková, R.; Březina, M.; Opravil, T. Silver nanoparticles stabilized with phosphorus-containing heterocyclic surfactants: Synthesis, physico-chemical properties, and biological activity determination. Nanomaterials 2021, 11, 1883. [Google Scholar] [CrossRef] [PubMed]
  4. Durval, I.J.B.; Ribeiro, B.G.; Aguiar, J.S.; Rufino, R.D.; Converti, A.; Sarubbo, L.A. Application of a Biosurfactant Produced by Bacillus cereus UCP 1615 from Waste Frying Oil as an Emulsifier in a Cookie Formulation. Fermentation 2021, 7, 189. [Google Scholar] [CrossRef]
  5. Cirelli, A.F.; Ojeda, C.; Castro, M.J.L.; Salgot, M. Surfactants in Sludge-Amended Agricultural Soils: A Review. Org. Farming Pest Control. Remediat. Soil Pollut. 2009, 227–251. [Google Scholar] [CrossRef]
  6. Ivanković, T.; Hrenović, J. Surfactants in the environment. Arh. Hig. Rada Toksikol. 2010, 61, 95–110. [Google Scholar] [CrossRef] [PubMed] [Green Version]
  7. Rebello, S.; Asok, A.K.; Mundayoor, S.; Jisha, M.S. Surfactants: Toxicity, remediation and green surfactants. Environ. Chem. Lett. 2014, 12, 275–287. [Google Scholar] [CrossRef]
  8. Lourenço, M.J.; Alexandre, J.; Huisman, C.; Paredes, X.; de Castro, C.N. The balance between energy, environmental security, and technical performance: The regulatory challenge of nanofluids. Nanomaterials 2021, 11, 1871. [Google Scholar] [CrossRef]
  9. Al Sabagh, A.M.; Abdel-Hamid, T.M.; Abdel-Salam, F.H.; El-Din, M.R.N.; Mohamed, A. Surface activity and thermodynamic properties of some green surfactants from wastes in formation water at reservoir conditions. J. Dispers. Sci. Technol. 2020, 41, 1–14. [Google Scholar] [CrossRef]
  10. Al-Soufi, W.; Novo, M. A Surfactant Concentration Model for the Systematic Determination of the Critical Micellar Concentration and the Transition Width. Molecules 2021, 26, 5339. [Google Scholar] [CrossRef]
  11. Vitková, Z.; Tárník, M.; Pavlovičová, J.; Vitko, A.; Oremusová, J.; Murgaš, J.; Babinec, A. From Static to Dynamic Modeling of Surfactants Micellization. Tenside Surfactants Deterg. 2021, 58, 4–12. [Google Scholar] [CrossRef]
  12. Perinelli, D.R.; Cespi, M.; Lorusso, N.; Palmieri, G.F.; Bonacucina, G.; Blasi, P. Surfactant Self-Assembling and Critical Micelle Concentration: One Approach Fits All? Langmuir 2020, 36, 5745–5753. [Google Scholar] [CrossRef]
  13. Noor, S.; Taj, M.B.; Rehman, A.; Naz, I. Comparative solubilization of reactive dyes in single and mixed surfactants. J. Dispers. Sci. Technol. 2021. [Google Scholar] [CrossRef]
  14. Staples, E.; Penfold, J.; Tucker, I. Adsorption of Mixed Surfactants at the Oil-Water Interface. J. Phys. Chem. B 2000, 104, 606–614. [Google Scholar] [CrossRef]
  15. Loh, W.; Brinatti, C.; Tam, K.C. Use of isothermal titration calorimetry to study surfactant aggregation in colloidal systems. Biochim. Biophys. Acta -Gen. Subj. 2016, 1860, 999–1016. [Google Scholar] [CrossRef] [PubMed]
  16. Sikorska, E.; Wyrzykowski, D.; Szutkowski, K.; Greber, K.; Lubecka, E.A.; Zhukov, I. Thermodynamics, size, and dynamics of zwitterionic dodecylphosphocholine and anionic sodium dodecyl sulfate mixed micelles. J. Therm. Anal. Calorim. 2016, 123, 511–523. [Google Scholar] [CrossRef] [Green Version]
  17. Juhász, Á.; Tabajdi, R.; Dékány, I.; Csapó, E. Thermodynamic Characterization of Temperature- and Composition-Dependent Mixed Micelle Formation in Aqueous Medium. J. Surfactants Deterg. 2017, 20, 1291–1299. [Google Scholar] [CrossRef] [Green Version]
  18. Storm, S.; Jakobtorweihen, S.; Smirnova, I. Solubilization in mixed micelles studied by molecular dynamics simulations and COSMOmic. J. Phys. Chem. B 2014, 118, 3593–3604. [Google Scholar] [CrossRef]
  19. Rao, J.; McClements, D.J. Lemon oil solubilization in mixed surfactant solutions: Rationalizing microemulsion & nanoemulsion formation. Food Hydrocoll. 2012, 26, 268–276. [Google Scholar] [CrossRef]
  20. Kumar, A.; Kansal, S.K.; Ibhadon, A.O.; Mehta, S.K. Mixed surfactant (altering chain length and head group) aggregates as an effective carrier for tuberculosis drug. Chem. Phys. Lipids 2018, 215, 11–17. [Google Scholar] [CrossRef]
  21. Zhang, C.; Wang, Y.; Zhao, Y.; Liu, H.; Zhao, Y.; Li, X.; Lin, Q. Biodegradable Micelles for NIR/GSH-Triggered Chemophototherapy of Cancer. Nanomaterials 2019, 9, 91. [Google Scholar] [CrossRef] [Green Version]
  22. Guo, J.X.; Zhang, S.L.; Yang, Y.Q.; Yu, Z.J.; Li, L.; Wang, Y.S.; Zhang, L.S. Temperature-resistant and salt-tolerant mixed surfactant system for EOR in the Tahe Oilfield. Pet. Sci. 2021, 18, 667–678. [Google Scholar] [CrossRef]
  23. Shibaev, A.V.; Aleshina, A.L.; Arkharova, N.A.; Orekhov, A.S.; Kuklin, A.I.; Philippova, O.E. Disruption of cationic/anionic viscoelastic surfactant micellar networks by hydrocarbon as a basis of enhanced fracturing fluids clean-up. Nanomaterials 2020, 10, 2353. [Google Scholar] [CrossRef] [PubMed]
  24. Khan, A.; Marques, E.F. Synergism and polymorphism in mixed surfactant systems. Curr. Opin. Colloid Interface Sci. 1999, 4, 402–410. [Google Scholar] [CrossRef] [Green Version]
  25. Páhi, A.B.; Király, Z.; Mastalir, Á.; Dudás, J.; Puskás, S.; Vágó, Á. Thermodynamics of micelle formation of the counterion coupled gemini surfactant bis(4- (2-dodecyl) benzenesuifonate)-jeffamine salt and its dynamic adsorption on sandstone. J. Phys. Chem. B 2008, 112, 15320–15326. [Google Scholar] [CrossRef] [PubMed]
  26. Páhi, A.B.; Király, Z.; Puskás, S. Mass spectrometric characterization of the non-ionic gemini surfactant Surfynol 465 and a microcalorimetric study of its micelle formation in water. Colloids Surf. A Physicochem. Eng. Asp. 2009, 345, 13–17. [Google Scholar] [CrossRef]
  27. Heintz, A.; Lehmann, J.K.; Kozlova, S.A.; Balantseva, E.V.; Bazyleva, A.B.; Ondo, D. Micelle formation of alkylimidazolium ionic liquids in water and in ethylammonium nitrate ionic liquid: A calorimetric study. Fluid Phase Equilib. 2010, 294, 187–196. [Google Scholar] [CrossRef]
  28. Prasad, M.; Chakraborty, I.; Rakshit, A.K.; Moulik, S.P. Critical evaluation of micellization behavior of nonionic surfactant MEGA 10 in comparison with ionic surfactant tetradecyltriphenylphosphonium bromide studied by microcalorimetric method in aqueous medium. J. Phys. Chem. B 2006, 110, 9815–9821. [Google Scholar] [CrossRef]
  29. Clint, J.H. Micellization of mixed nonionic surface active agents. J. Chem. Soc. Faraday Trans. 1 Phys. Chem. Condens. Phases 1975, 71, 1327–1334. [Google Scholar] [CrossRef]
  30. Holland, P.M.; Rubingh, D.N. Nonideal multicomponent mixed micelle model. J. Phys. Chem. 1983, 87, 1984–1990. [Google Scholar] [CrossRef]
  31. Rodríguez, J.L.; Minardi, R.M.; Schulz, E.P.; Pieroni, O.; Schulz, P.C. The Composition of Mixed Micelles Formed by Dodecyl Trimethyl Ammonium Bromide and Benzethonium Chloride in Water. J. Surfactants Deterg. 2012, 15, 147–155. [Google Scholar] [CrossRef]
Figure 1. ITC raw data for the titration of nonionic surfactant (TX) at 25 °C in the middle (b) of the graph and a schematic representation of the calorimetric signals and processes characteristic of the pre- (a) and post-micellar (c) phases.
Nanomaterials 11 03288 g001
Figure 2. (a) Measured ITC raw data (grey continuous curve) and enthalpogram (red circles) for the titration of ionic surfactant (CT) at 298 K where the dashed green curve indicates the calculated enthalpogram; (b) The sigmoidal Boltzmann equation-based model curve of the measured enthalpogram with a schematic illustration of the parameters (ΔmicH and cmc) that can be calculated from the nonlinear parameter estimation.
Nanomaterials 11 03288 g002
Figure 3. (a) Changes in cmc of CT and TX surfactants determined by ITC as a function of temperature; (b) Enthalpy change of micellization of CT and TX surfactants as a function of temperature.
Nanomaterials 11 03288 g003
Figure 4. (a) Evolution of normalized enthalpograms from pure (θTX = 0.0 and 1.0) and mixed (θTX = 0.2; 0.4; 0.6 and 0.8) micelle formation at 25 °C; (b) Change of cmc values (red dots) determined from enthalpograms of pure (θTX = 0.0 and 1.0) and mixed (θTX = 0.2; 0.4; 0.6 and 0.8) micelle formation and calculated [29] cmc values (dashed line) as a function of composition of bulk phase (θTX).
Nanomaterials 11 03288 g004
Figure 5. (a) Change of experimental (X1m values as red squares) and predicted (dashed line calculated by Motomura’s theory [31]) mixed micelle structure as a function of bulk phase composition (θTX) at 298 K; (b) Variation of thermodynamic parameters (ΔmicG, ΔmicH and TΔmicS) determined from enthalpograms of pure (θTX = 0.0 and 1.0) and mixed (θTX = 0.2; 0.4; 0.6 and 0.8) micelle formation as a function of composition of bulk phase (θTX) at 298 K.
Nanomaterials 11 03288 g005
Figure 6. (a) Mixed (θTX = 0.2; 0.4; 0.6 and 0.8) and pure (θTX = 0.0 and 1.0) micelles solubilized amount of benzoic acid at 298 K as a function of bulk phase composition (dashed grey line indicates the ideal behavior suggested [29] solubilized amount, while dashed green line indicates the solubility of benzoic acid in water); (b) Change of solubilized excess (calculated from the experimental and predicted solubilized amount of benzoic acid) and the first derivative of the enthalpy change of micelle formation (∂(ΔmicH)/∂θTX) against the bulk phase composition at 298 K.
Nanomaterials 11 03288 g006
Table 1. ITC determined cmc and ΔmicH values and their standard deviation of the mixed surfactant systems at whole composition (θTX) range at 298 K temperature.
θTXcmc (mM)ΔmicH (kJ mol−1)
0.0 10.964 ± 0.005−9.16 ± 0.77
0.20.810 ± 0.009−2.14 ± 0.07
0.40.493 ± 0.0032.92 ± 0.06
0.60.281 ± 0.0024.28 ± 0.28
0.80.261 ± 0.0025.22 ± 0.36
1.0 20.319 ± 0.0036.96 ± 0.72
1 Corresponds to the pure ionic (CTABr) component. 2 Corresponds to the pure nonionic (Triton X-100) component.
Table 2. Mixed micelles solubilized an amount of benzoic acid at whole composition (θTX) range and 298 K temperature, determined by acid–base titrations.
θTXVNaOH (mL)Solubilized Amount (mM)
0.0 14.10 ± 0.1050.8 ± 1.9
0.14.77 ± 0.0663.6 ± 1.1
0.26.20 ± 0.1091.0 ± 1.9
0.37.10 ± 0.10108.3 ± 1.9
0.47.27 ± 0.06111.5 ± 1.1
0.57.10 ± 0.10108.3 ± 1.9
0.66.87 ± 0.06103.8 ± 1.1
0.76.33 ± 0.0693.6 ± 1.1
0.86.20 ± 0.1091.0 ± 1.9
0.95.90 ± 0.1085.3 ± 1.9
1.0 25.83 ± 0.0684.0 ± 1.1
1 Corresponds to the pure ionic (CTABr) component. 2 Corresponds to the pure nonionic (Triton X-100) component.
Publisher’s Note: MDPI stays neutral with regard to jurisdictional claims in published maps and institutional affiliations.

