Article

Up-Converting Luminescence and Temperature Sensing of Er3+/Tm3+/Yb3+ Co-Doped NaYF4 Phosphors Operating in Visible and the First Biological Window Range

1
School of Physics and Optoelectronic Engineering, Shandong University of Technology, Zibo 255000, China
2
Department of Physics, Harbin Institute of Technology, Harbin 150001, China
*
Authors to whom correspondence should be addressed.
Nanomaterials 2021, 11(10), 2660; https://doi.org/10.3390/nano11102660
Submission received: 10 September 2021 / Revised: 8 October 2021 / Accepted: 9 October 2021 / Published: 10 October 2021

Abstract

:
Accurate and reliable non-contact temperature sensors are imperative for industrial production and scientific research. Here, Er3+/Tm3+/Yb3+ co-doped NaYF4 phosphors were studied as an optical thermometry material. The typical hydrothermal method was used to synthesize hexagonal Er3+/Tm3+/Yb3+ co-doped NaYF4 phosphors and the morphology was approximately rod-like. The up-conversion emissions of the samples were located at 475, 520, 550, 650, 692 and 800 nm. Thermo-responsive emissions from the samples were monitored to evaluate the relative sensing sensitivity. The thermal coupled energy level- and non-thermal coupled energy level-based luminescence intensity ratio thermometry of the sample demonstrated that these two methods can be used to test temperature. Two green emissions (520 and 550 nm), radiated from 2H11/2/4S3/2 levels, were monitored, and the maximum relative sensing sensitivities reached to 0.013 K−1 at 297 K. The emissions located in the first biological window (650, 692 and 800 nm) were monitored and the maximum relative sensing sensitivities reached to 0.027 (R692/650) and 0.028 K−1 (R692/800) at 297 K, respectively. These results indicate that Er3+/Tm3+/Yb3+ co-doped NaYF4 phosphors have potential applications for temperature determination in the visible and the first biological window ranges.

1. Introduction

Temperature (T) is an important physical parameter in many fields, like scientific research, industrial production and biotherapy. Accurate T can usually be detected via contacting the temperature sensors, such as with thermal resistance, thermocouples and semiconductor temperature sensors. However, these temperature sensors limit their applications in temperature exploration when the measured objects are displayed in electromagnetic noise environments or beings. Thus, it is crucial to explore non-contact temperature sensors, such as IR thermography, Raman spectroscopy, and luminescence [1,2,3,4,5,6]. The non-contact temperature sensor based on temperature-dependent luminescence properties has drawn a lot of attention for its high resolution, stability and repeatability [7].
For lanthanide ion-doped materials, their luminescence intensity, peak position, emission band width, emission lifetime and luminescence intensity ratio (LIR) have been extensive researched for non-contact optical thermometry [7,8,9,10,11]. One of the most interesting developments is LIR-based temperature sensing as it is not influenced by pressure, light source and/or atmosphere [12]. Er3+ doped nanomaterials are promising in LIR-based temperature sensing for their evident green emissions from 2H11/2/4S3/2 and excellent thermal coupling properties [13,14,15,16]. Thus, we choose Er3+ as one of the doped rare earth ions and the green emissions can be used as the detected signal in the visible range for thermometry. However, the green emissions have obvious absorption and limited penetration depth in biological tissues [17,18]. Therefore, the selected emissions shall be located in biological windows when the object is located in biological tissues [18]. Under 980 nm laser excitation, Tm3+ can emit red (650 nm) and near-infrared emissions (692 and 800 nm) [19], which can be used as the detected signal in the first biological window (650–1000 nm).
The non-thermal coupled levels have also been used in LIR thermometry because of their high sensing sensitivity [20,21,22]. For example, high relative sensing sensitivity (0.0034 K−1) was obtained in NaLuF4:Yb/Er/Ho nano-rods at 503 K, which is based on the emissions at 659 and 547 nm [23]. Therefore, non-thermal coupled level-based LIR thermometry is an excellent method for temperature measuring, which can promote relative sensing sensitivity and select suitable wavebands.
Herein, Er3+/Tm3+/Yb3+ were selected as the doped ions, with which Er3+/Tm3+ acted as the emitting centers and Yb3+ acted as the sensitizer. In this study, we selected hexagonal phase NaYF4 as the host matrix due to its relatively excellent chemical and thermal stabilities and its low phonon energy (~370 cm−1) [24]. The rod-like NaYF4: Er3+, Tm3+, and Yb3+ phosphors were prepared through the hydrothermal method. The emissions (450–850 nm) from Er3+/Tm3+/Yb3+ co-doped NaYF4 phosphors were systemically investigated. High relative temperature sensitivity was achieved via choosing suitable LIR of green emissions and the emissions located in the first biological window. We can take advantages of this multi-band noninvasive thermometry in harsh environments or biological tissues.

2. Experimental Details

2.1. Sample Preparation

2.1.1. Materials

Y(NO3)3·6H2O (99.9%), Yb(NO3)3·6H2O (99.9%), Tm(NO3)3·6H2O (99.9%), Er(NO3)3·6H2O (99.9%) were all purchased from the Jining Zhong Kai New Type Material Science Co., Ltd, Jining, China. Ammonium fluoride (AR), sodium hydroxide (AR), oleic acid (AR) and cyclohexane (AR) were purchased from the Tianjin Tianli Chemical reagent Co. Ltd, Tianjin, China. All the chemicals were used directly without further purification.

2.1.2. Preparation of NaYF4: 2 mol% Er3+, 20 mol% Yb3+ and NaYF4: 2 mol% Er3+, 0.5 mol% Tm3+, 20 mol% Yb3+ Phosphors

The Er/Yb co-doped NaYF4 phosphors were prepared using the hydrothermal method. The preparation processes are described below. First, calculated amounts of sodium hydroxide were dissolved into 2 mL deionized water. Second, 10 mL absolute ethyl alcohol and 18 mL oleic acid were added to the nitrate solution and then stirred for 5 min at room temperature to form a faint yellow solution. Third, 5 mL aqueous solution which contained calculated amount of Y(NO3)3·6H2O, Yb(NO3)3·6H2O and Er(NO3)3·6H2O was added. Then 5 mL ammonium fluoride aqueous was immediately added. After stirring for 30 min at room temperature, the mixed solution was transferred into a 50 mL autoclave and heated at 180 °C for 12 h in a vacuum drying oven. After cooling down to room temperature and adding a certain percentage of ethanol and cyclohexane, the khaki suspension was centrifuged (8000 rpm, 2 min) for collection and washed three times with ethanol and deionized water. Finally, the phosphors were obtained after drying at 60 °C for 10 h. The Er/Tm/Yb co-doped NaYF4 phosphors were prepared using the same method, except for the amount of Y(NO3)3·6H2O, Yb(NO3)3·6H2O, Tm(NO3)3·6H2O and Er(NO3)3·6H2O.

2.2. Instruments

X-ray diffraction (XRD) patterns of the sample were tested using an X-ray diffractometer (D8–02, BrukerAXS, Karlsruhe, Germany). The morphology was tested using a transmission electron microscope (TEM: Tecnai G2 F20, FEI, Hillsboro, OR, USA). The spectra of the samples were tested through the iHR550 grating spectrograph (iHR550, Horiba, Paris, France). The 980 nm laser used to excite the sample was purchased from the Beijing Kipling Photoelectric technology Co., Ltd, Beijing, China. (model: K980F14CC-10.00 W). For the thermometry experiments, we introduced a Linkam THMS 600 heating stage to heat the sample. Then the temperature of the sample was measured by thermocouple. The spectra of the sample at certain temperatures were acquired using the iHR550 grating spectrometer (iHR550, Horiba, Paris, France).

3. Results and Discussions
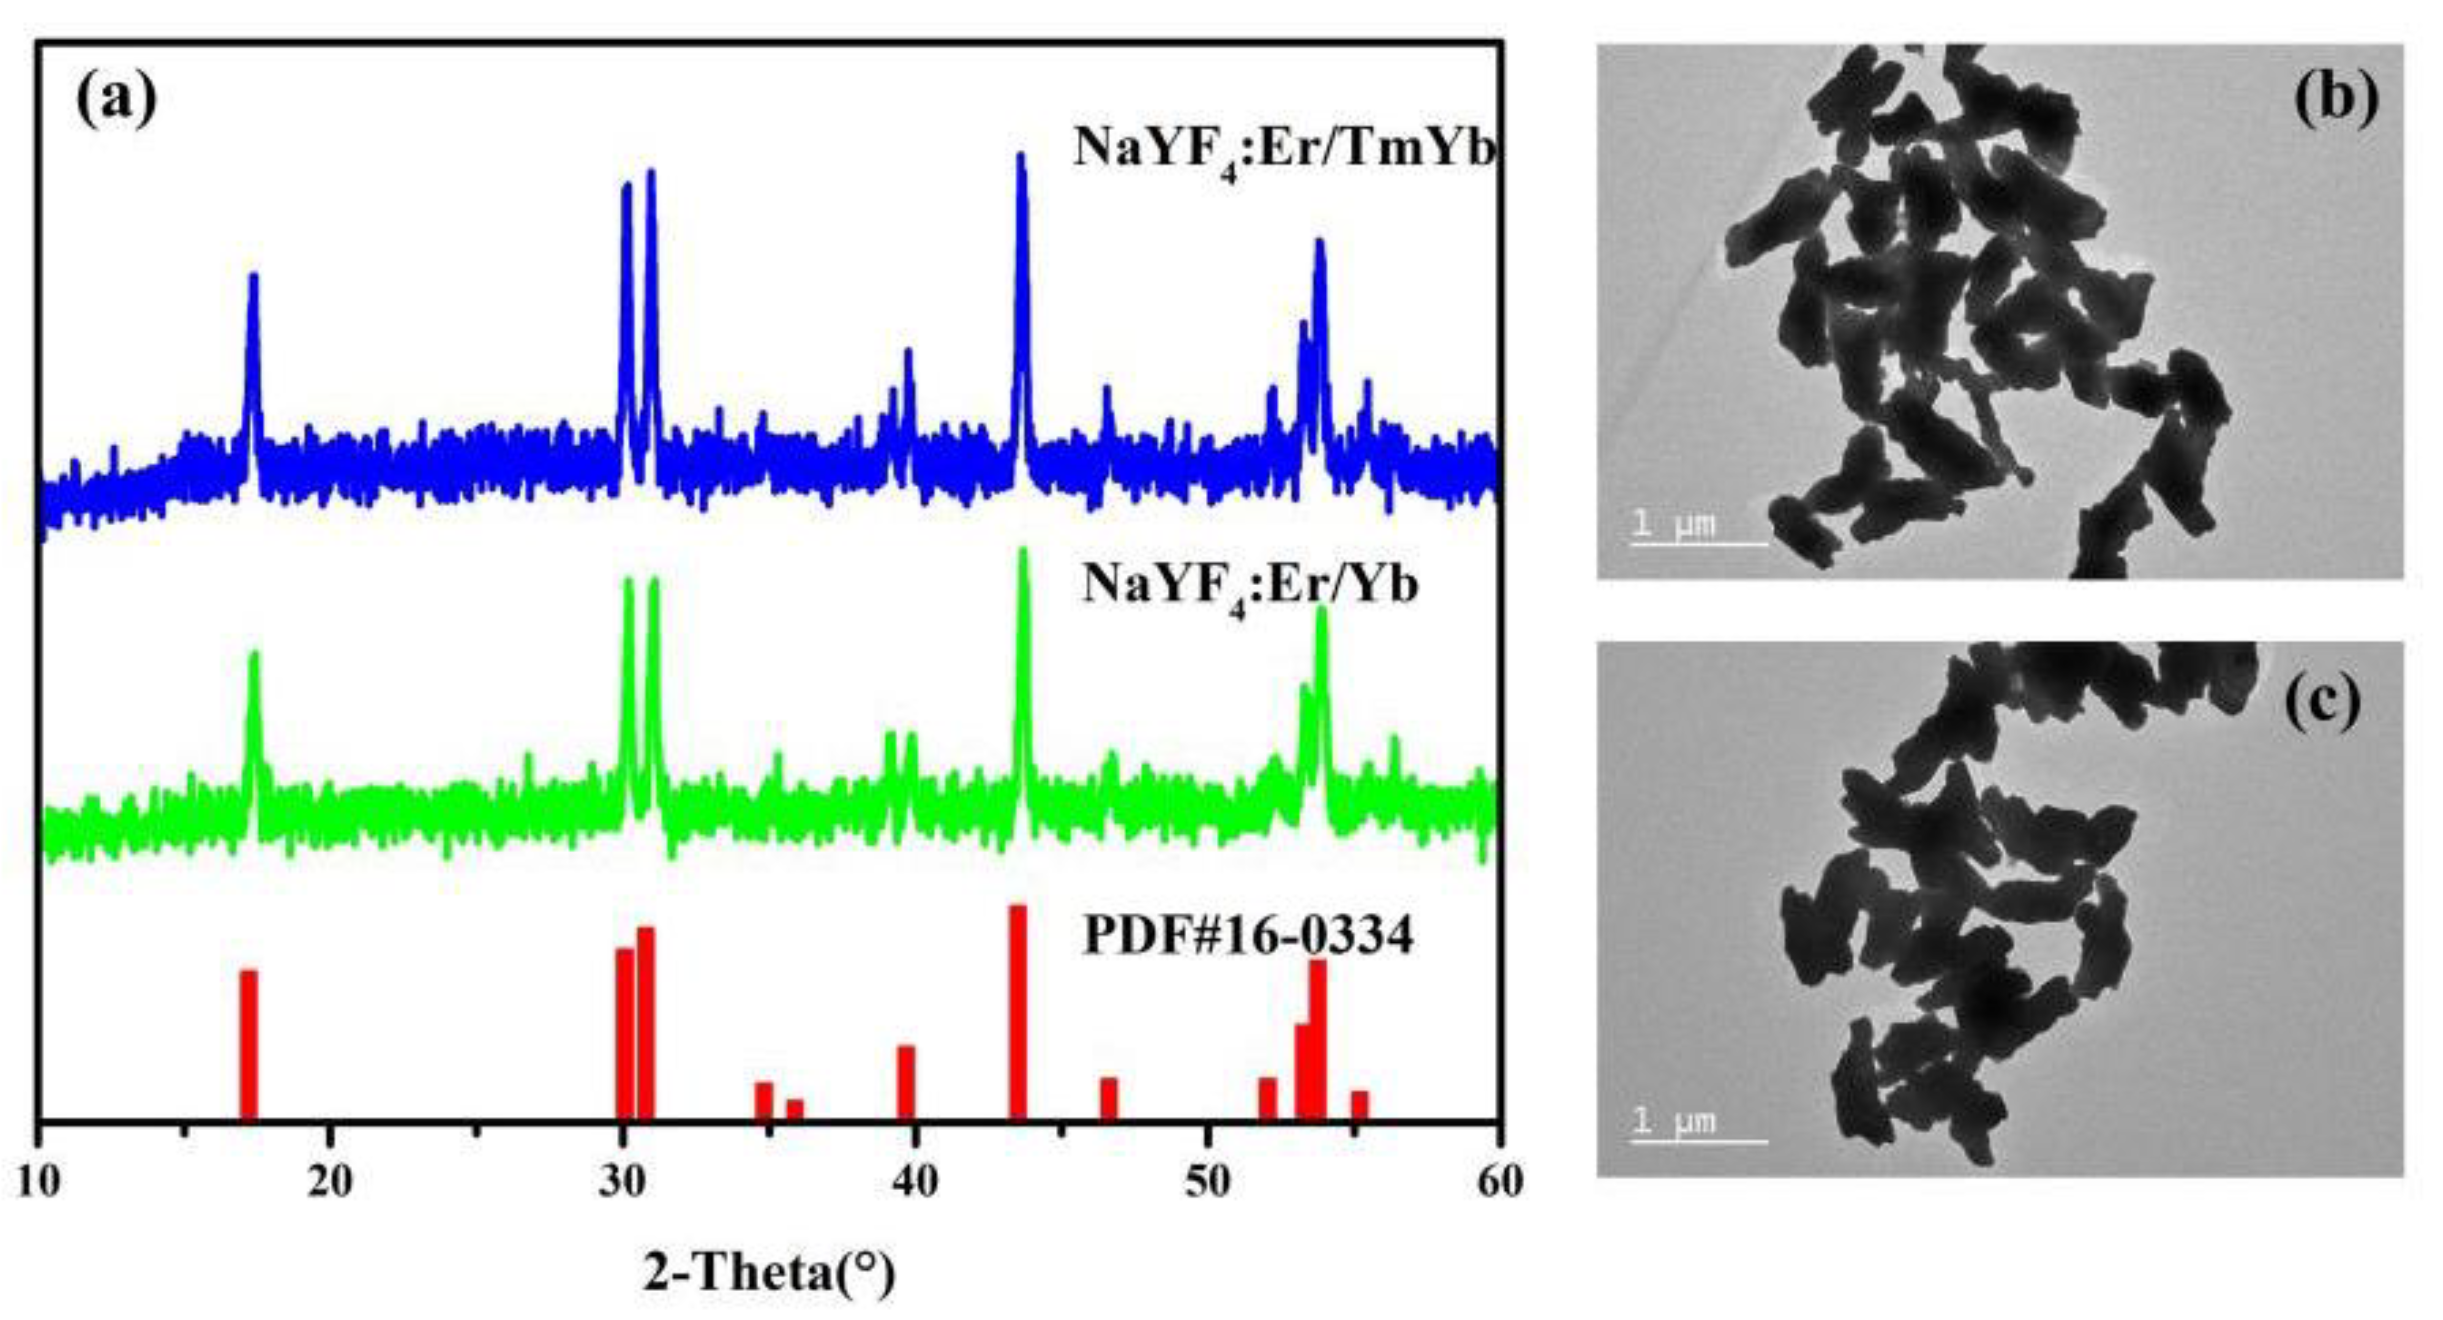
3.1. XRD Analysis

The XRD patterns of NaYF4: Er/Yb and NaYF4: Er/Tm/Yb phosphors are presented in Figure 1a. The XRD patterns of the samples can be indexed to hexagonal NaYF4 crystal (the JCPDS standard card no. 16-0334), indicating that the dopants (Er, Tm and Yb ions) are successfully incorporated into the host lattice and do not cause significant changes to the crystal structure. Figure 1b,c show the TEM images of the samples. Two samples’ morphologies are approximately rod-like. The lengths of the rods are ~890 nm and the length–diameter ratios are ~3.3.

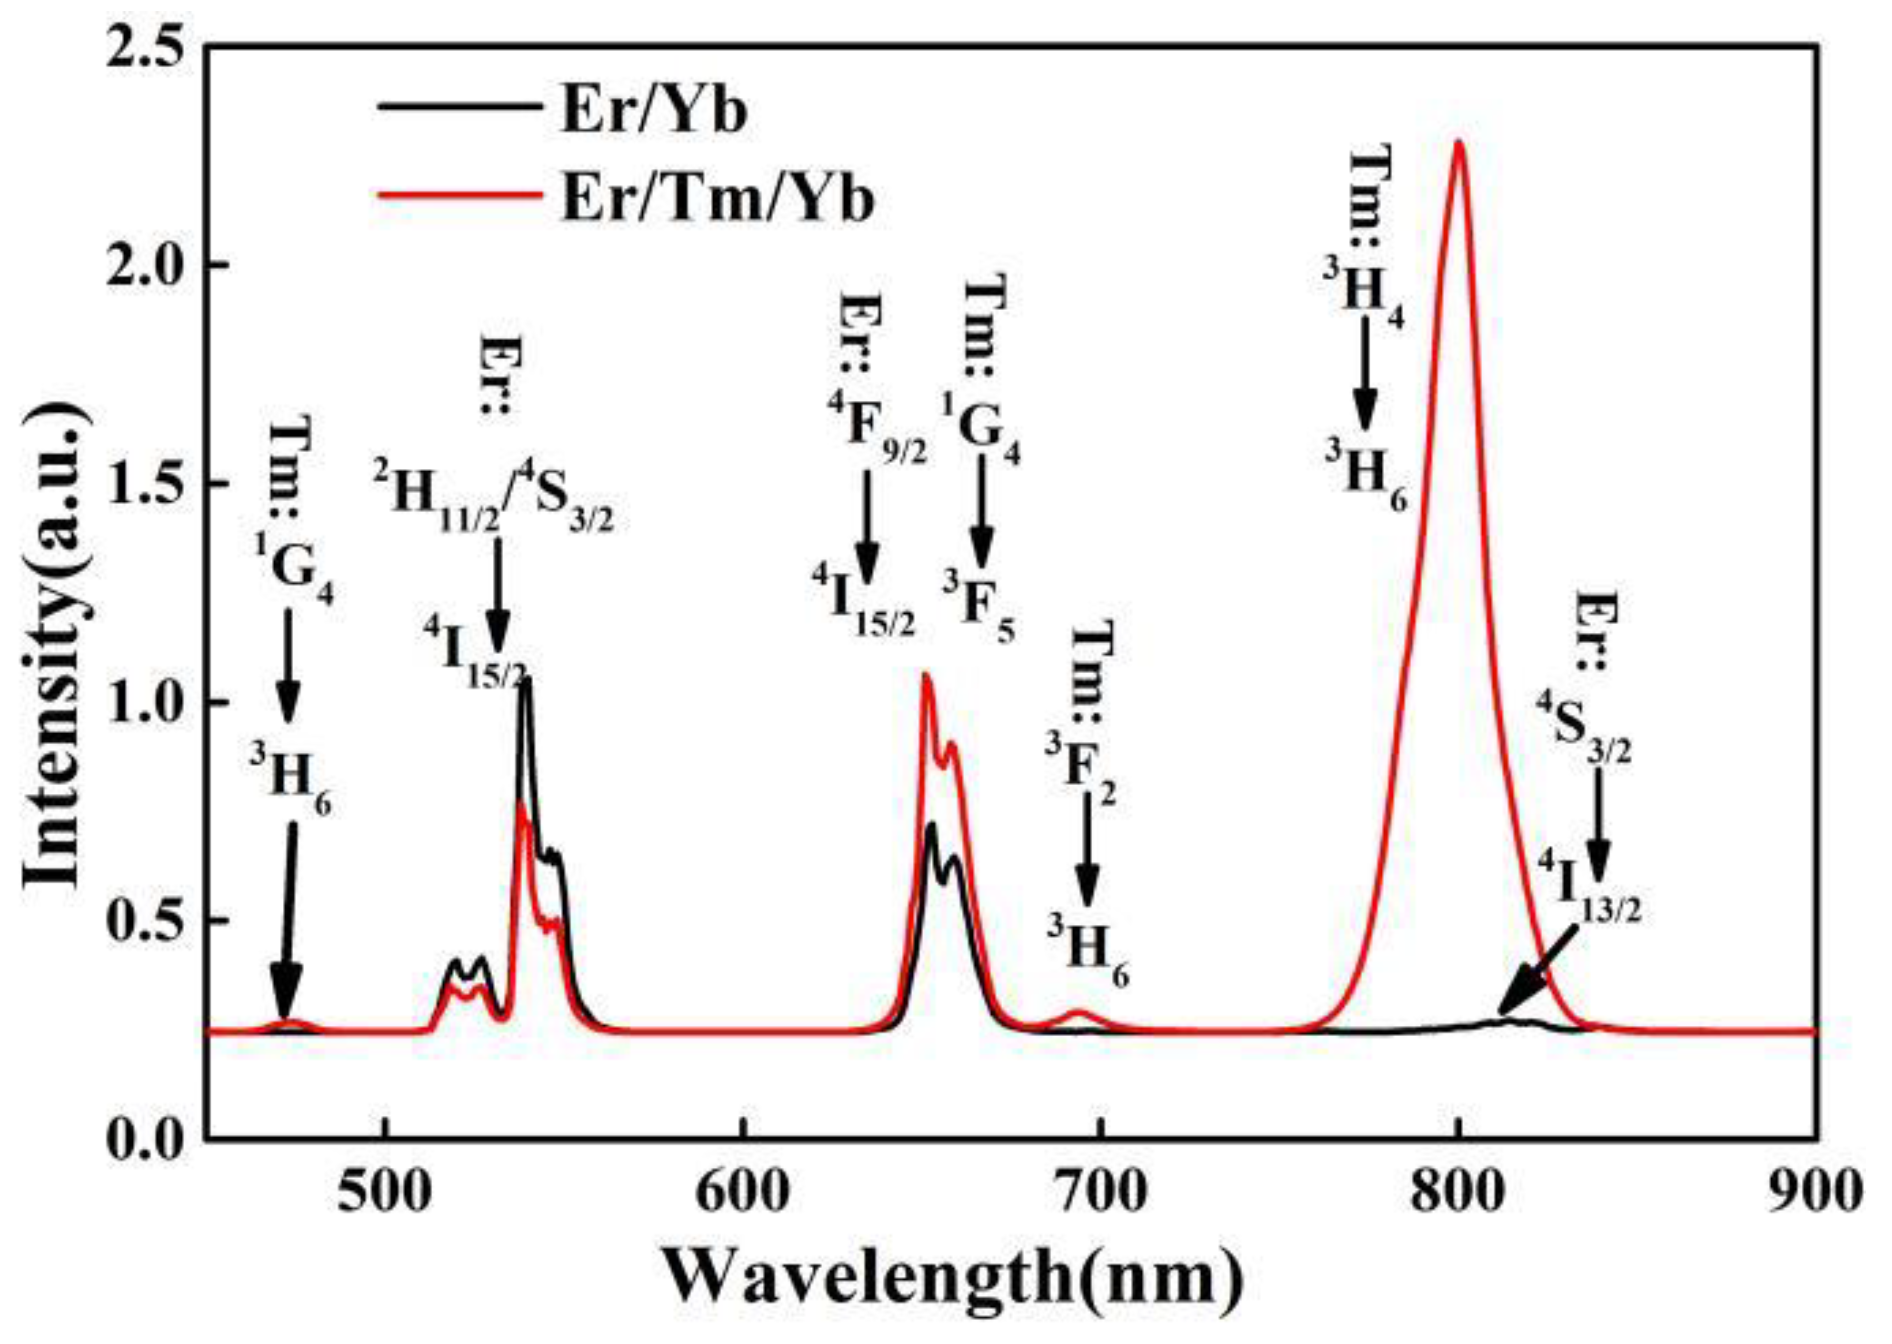
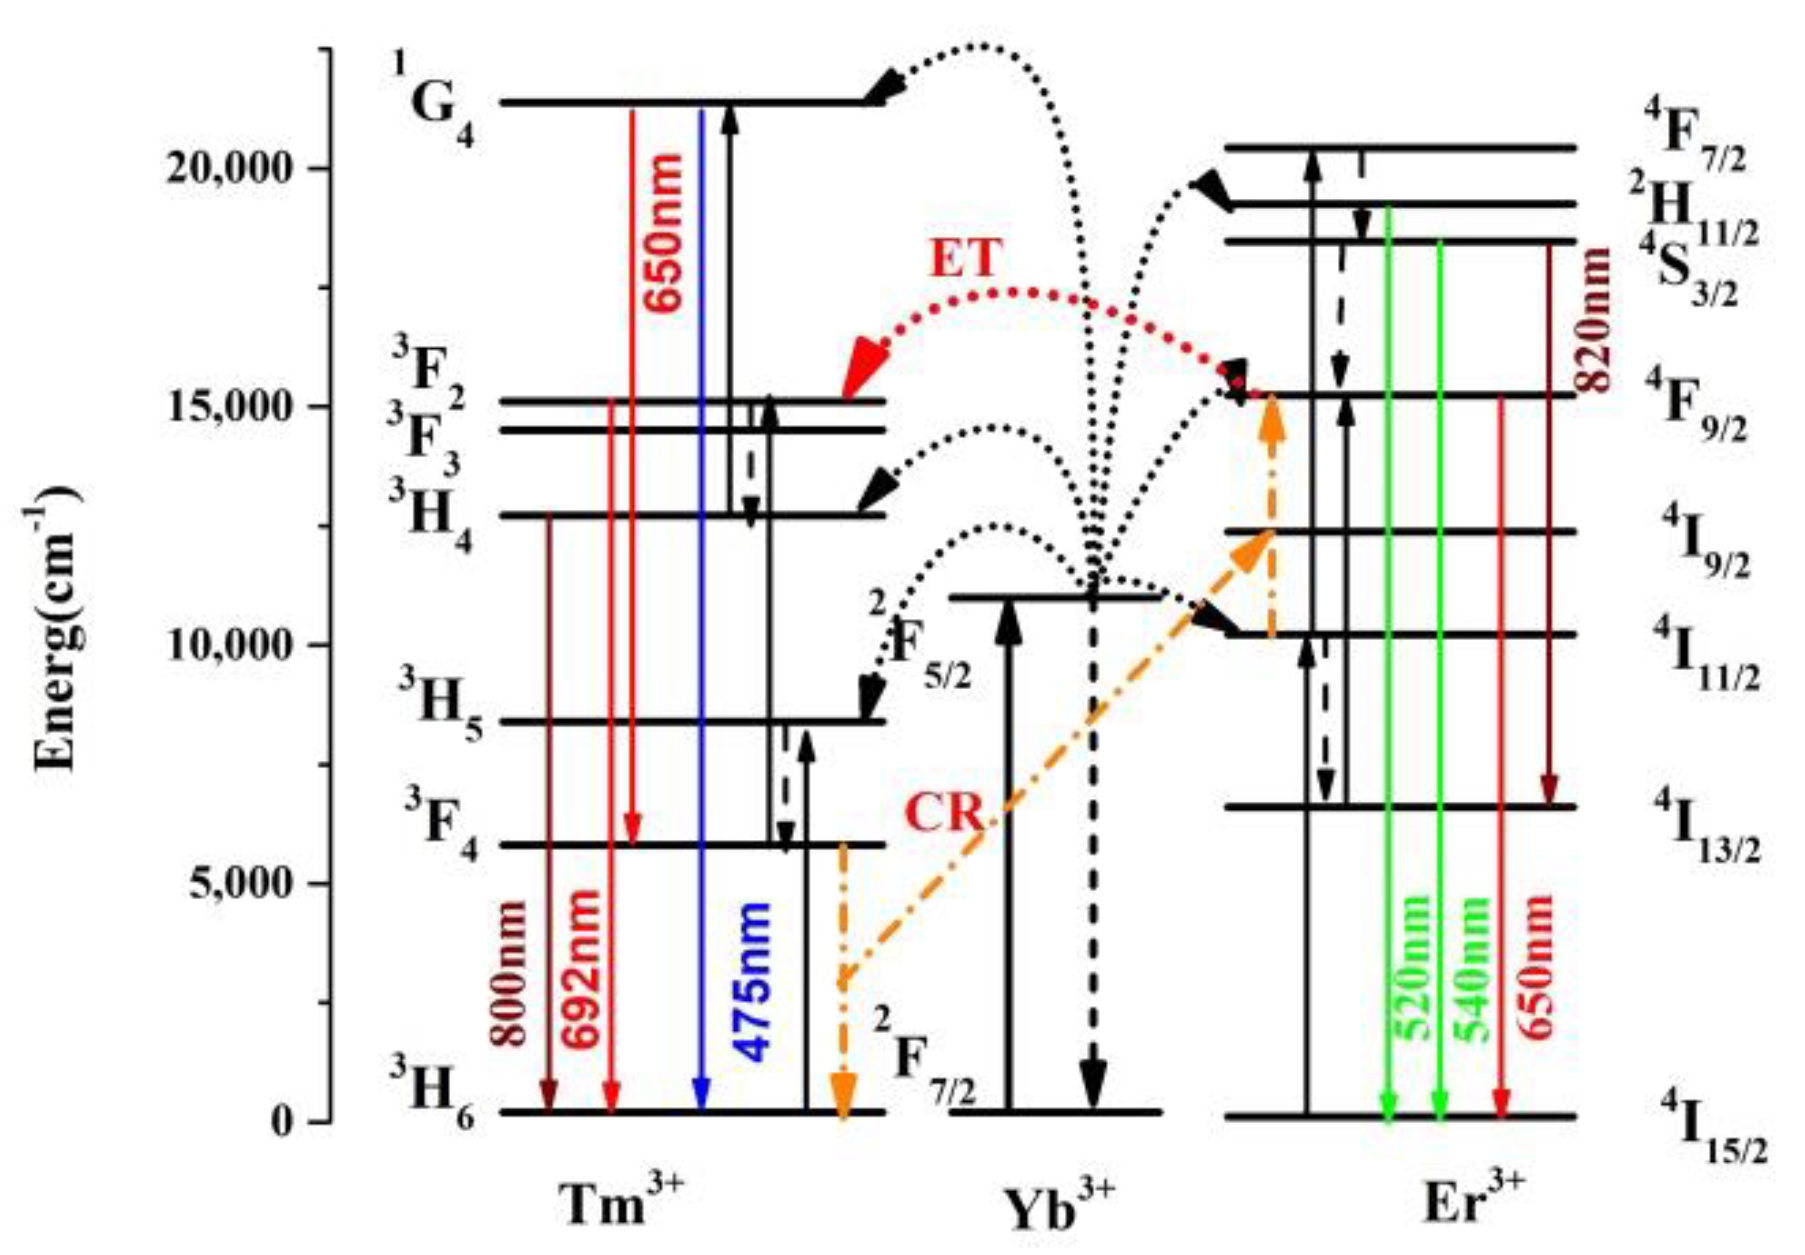
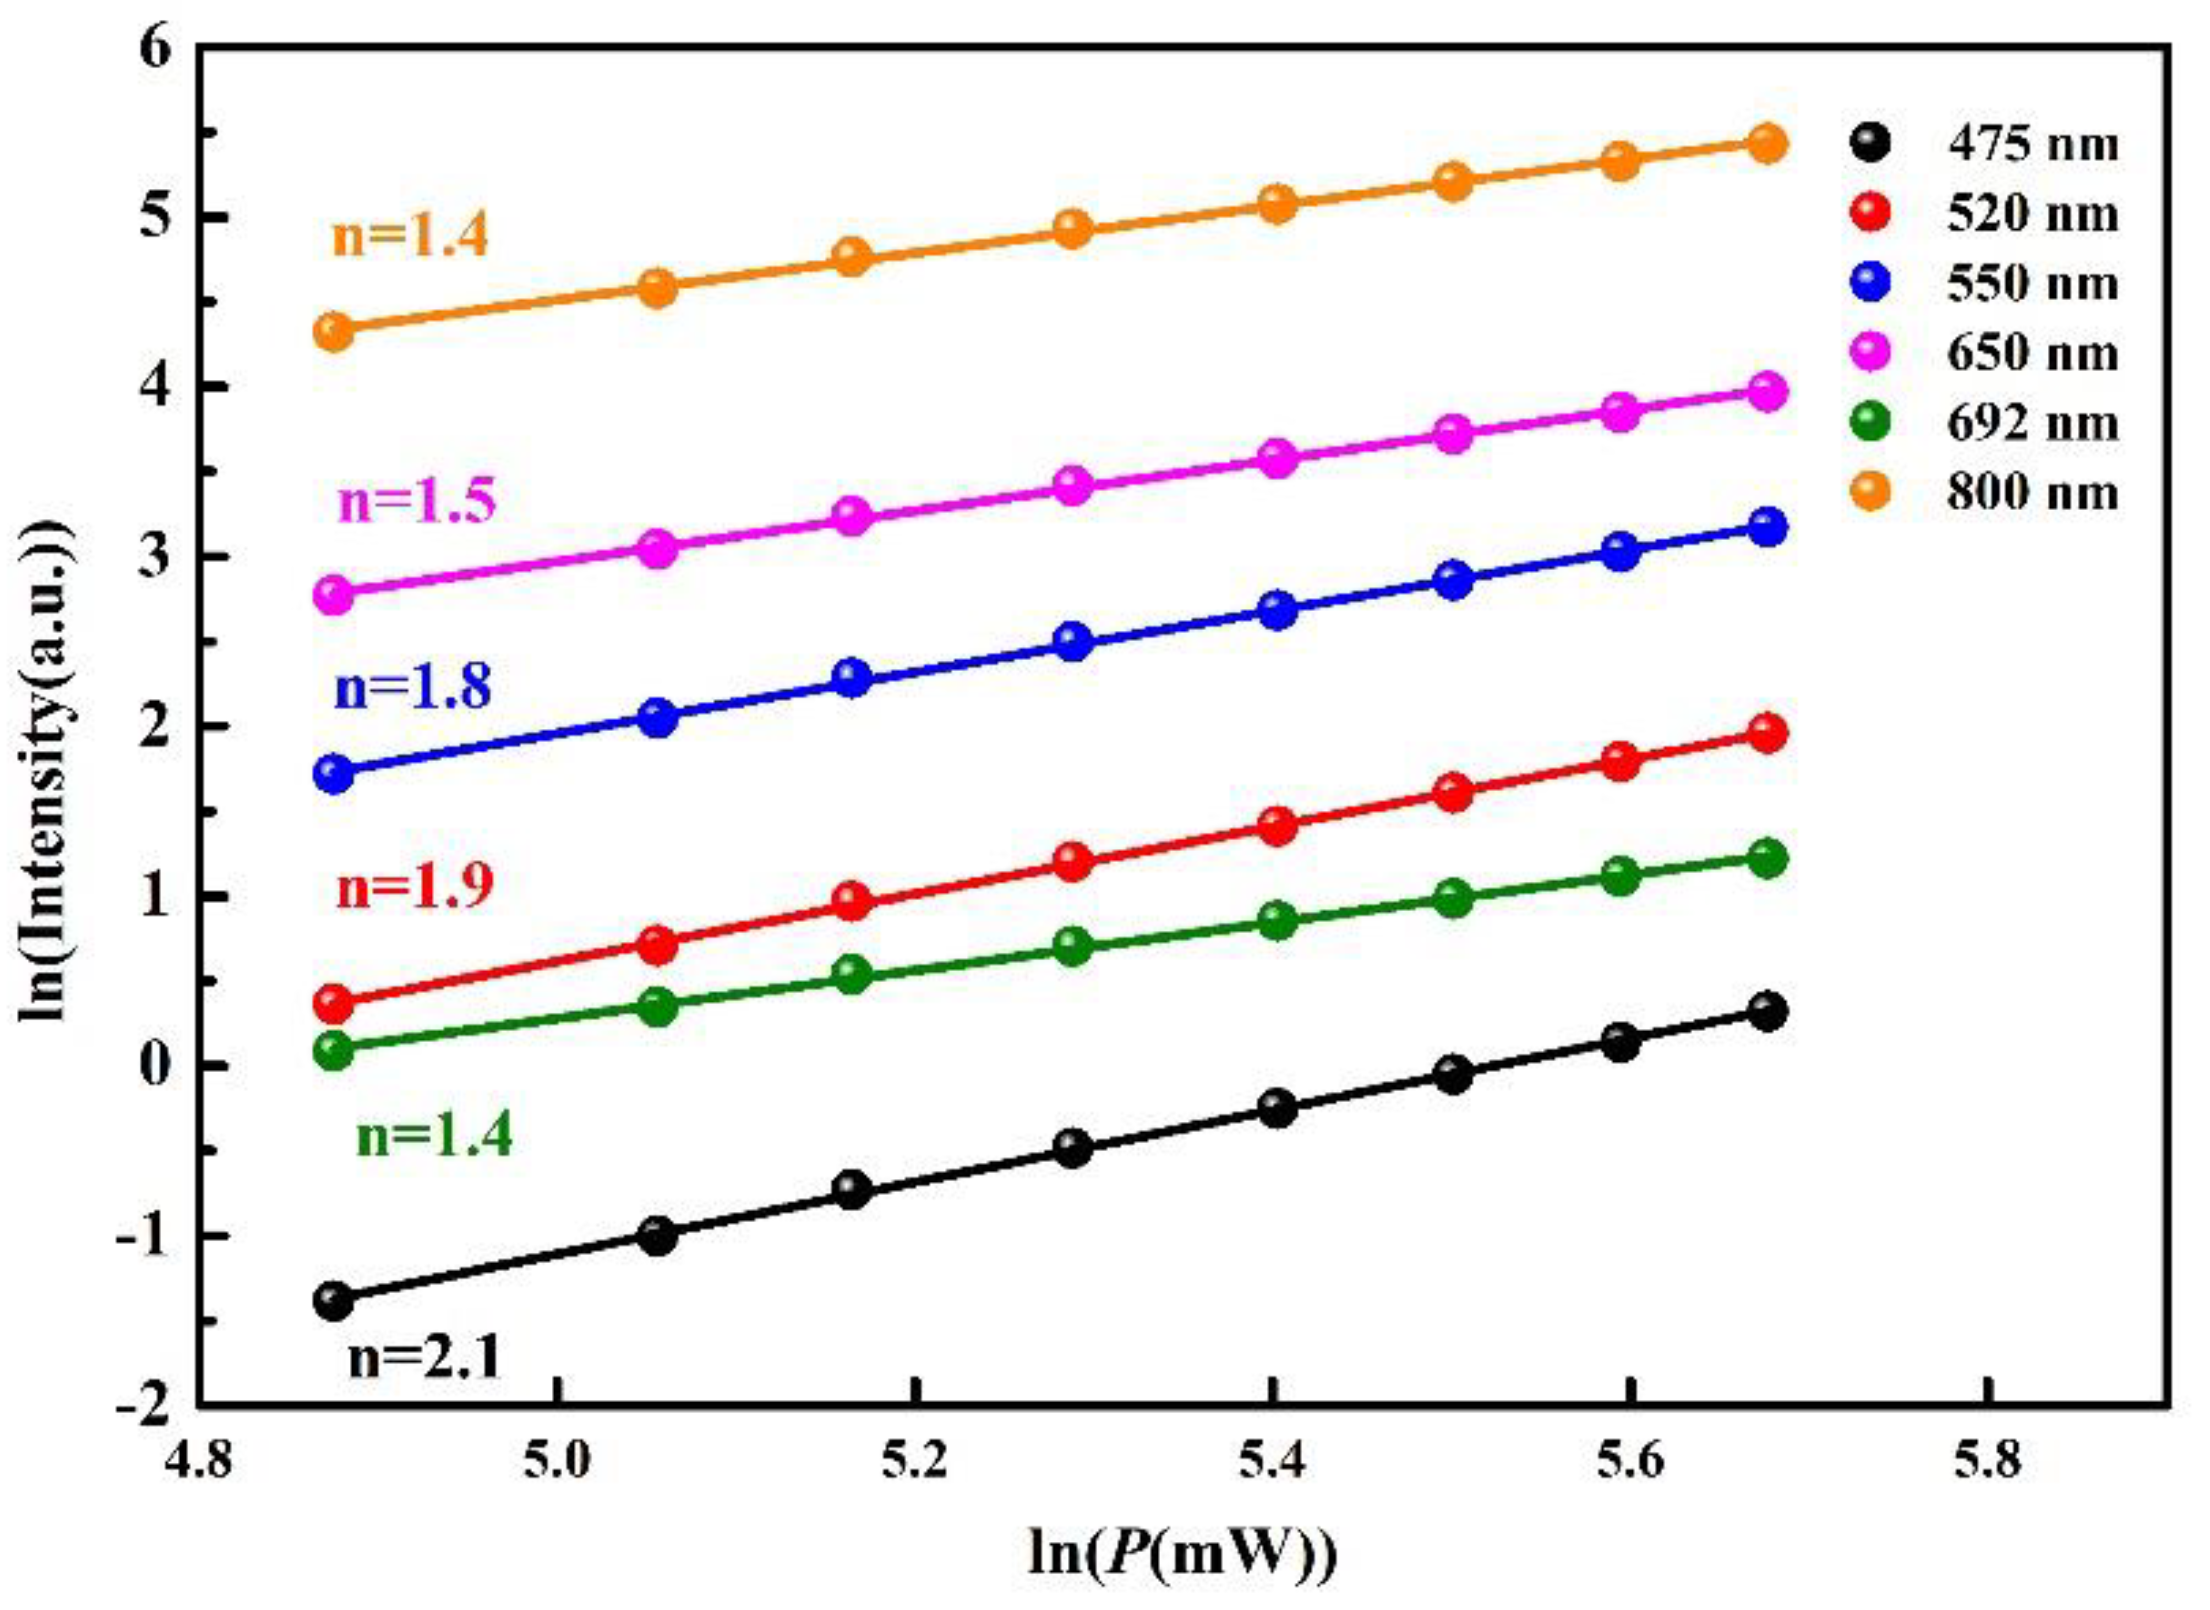
3.2. Power Dependent Up-Conversion Luminescence

To investigate the emission spectra of the synthesized Er/Yb and Er/Tm/Yb co-doped NaYF4 phosphors, the samples were excited under a 980 nm semiconductor laser. As shown in Figure 2, the emissions radiated from Er/Yb co-doped NaYF4 phosphors are located at 520, 550, 650 and 820 nm, which originated from the transitions of 2H11/24I15/2 (Er3+: 525 nm), 4S3/24I15/2 (Er3+: 550 nm), 4F9/24I15/2(Er3+: 650 nm) and 4S3/24I13/2 (Er3+: 820 nm), respectively. The emissions radiated from Er/Tm/Yb co-doped NaYF4 phosphors are located at 475, 520, 550, 650, 692 and 800 nm. The extra emissions are derived from the transitions of 1G43H6 (Tm3+: 475 nm), 1G43F4 (Tm3+: 650 nm), 3F23H6 (Tm3+: 692 nm) and 3H43H6 (Tm3+: 800 nm). It can be found from the emission spectrum of Er/Tm/Yb co-doped NaYF4 phosphors that the 820 nm emission is almost invisible because of the intense 800 nm emission peak. The detailed energy levels and the possible up-conversion processes in Er3+, Tm3+, Yb3+ co-doped materials are displayed in Figure 3. Under the excitation of a 980 nm laser, the energy level Yb3+: 2F5/2 is populated through ground state absorption (GSA). The energy level Er3+: 4I13/2 is populated through the energy transferred from Yb3+ (4I15/2 (Er3+) +2F5/2 (Yb3+) → 4I11/2 (Er3+) +2F7/2 (Yb3+)). The energy level Er3+: 4F7/2 is populated via the energy transferred from Yb3+ (4I11/2 (Er3+) +2F5/2 (Yb3+) → 4F7/2 (Er3+) +2F7/2 (Yb3+)). After non-radiative relaxation from energy level 4F7/2 to 2H11/2, 4S3/2, and further to 4F9/2, green (2H11/2,4S3/24I15/2) red (4F9/24I15/2) and the emissions located at 820 nm (4S3/24I13/2) occur. In addition, the population of 4F9/2 state can be obtained via another process: 4I13/2(Er3+) +2F5/2 (Yb3+) → 4F9/2 (Er3+) +2F7/2 (Yb3+), where the energy level Er3+: 4I13/2 is accumulated from Er3+: 4I11/2 through non-radiative relaxation. The energy level Tm3+: 3H5 is populated through the energy transferred from Yb3+ (3H6 (Tm3+) +2F5/2 (Yb3+) → 3H5 (Tm3+) +2F7/2 (Yb3+)). The energy levels Tm3+: 3F2 and 1G4 are populated via the energy transferred from Yb3+ (3F4 (Tm3+) +2F5/2 (Yb3+) → 3F2 (Tm3+) +2F7/2 (Yb3+) and 3H4 (Tm3+) +2F5/2 (Yb3+) → 1G4 (Tm3+) +2F7/2 (Yb3+)). Blue and red, the emissions located at 692 and 800 nm, are radiated from the transitions 1G43H6, 1G43F4, 3F23H6 and 3H43H6, respectively. Apart from the up-conversion processes between Er-Yb and Tm-Yb, the energy transfer (ET: 4F9/2 (Er3+) → 3F2(Tm3+)) and cross relaxation (CR: 3F4 (Tm3+) + 4I11/2 (Er3+) → 3H6 (Tm3+) + 4F9/2 (Er3+)) occur. The ET and CR can increase the emission intensities at 692 and 650 nm, respectively. The decrease of the green emission is caused by CR, which can reduce the energy excited to 4F7/2 (Er3+).
In order to obtain the number of photons required for up-conversion processes, the variation law (IPn) of excitation power (p) dependent emission intensity (I) is shown in Figure 4. The slopes of the fitting line in the lnI-lnP plot represents the photons (n) participating in the up-conversion processes [25]. The values of n are 2.1, 1.9, 1.8, 1.5, 1.8, 1.5, 1.4 and 1.4 for 475, 520, 550, 650, 692 and 800 nm emissions, respectively. Therefore, the emission of blue comes from the three-photon process and the other emissions derive from the two-photon process. The participating photons, calculated from the slopes, are consistent with the up-conversion processes in Figure 3.

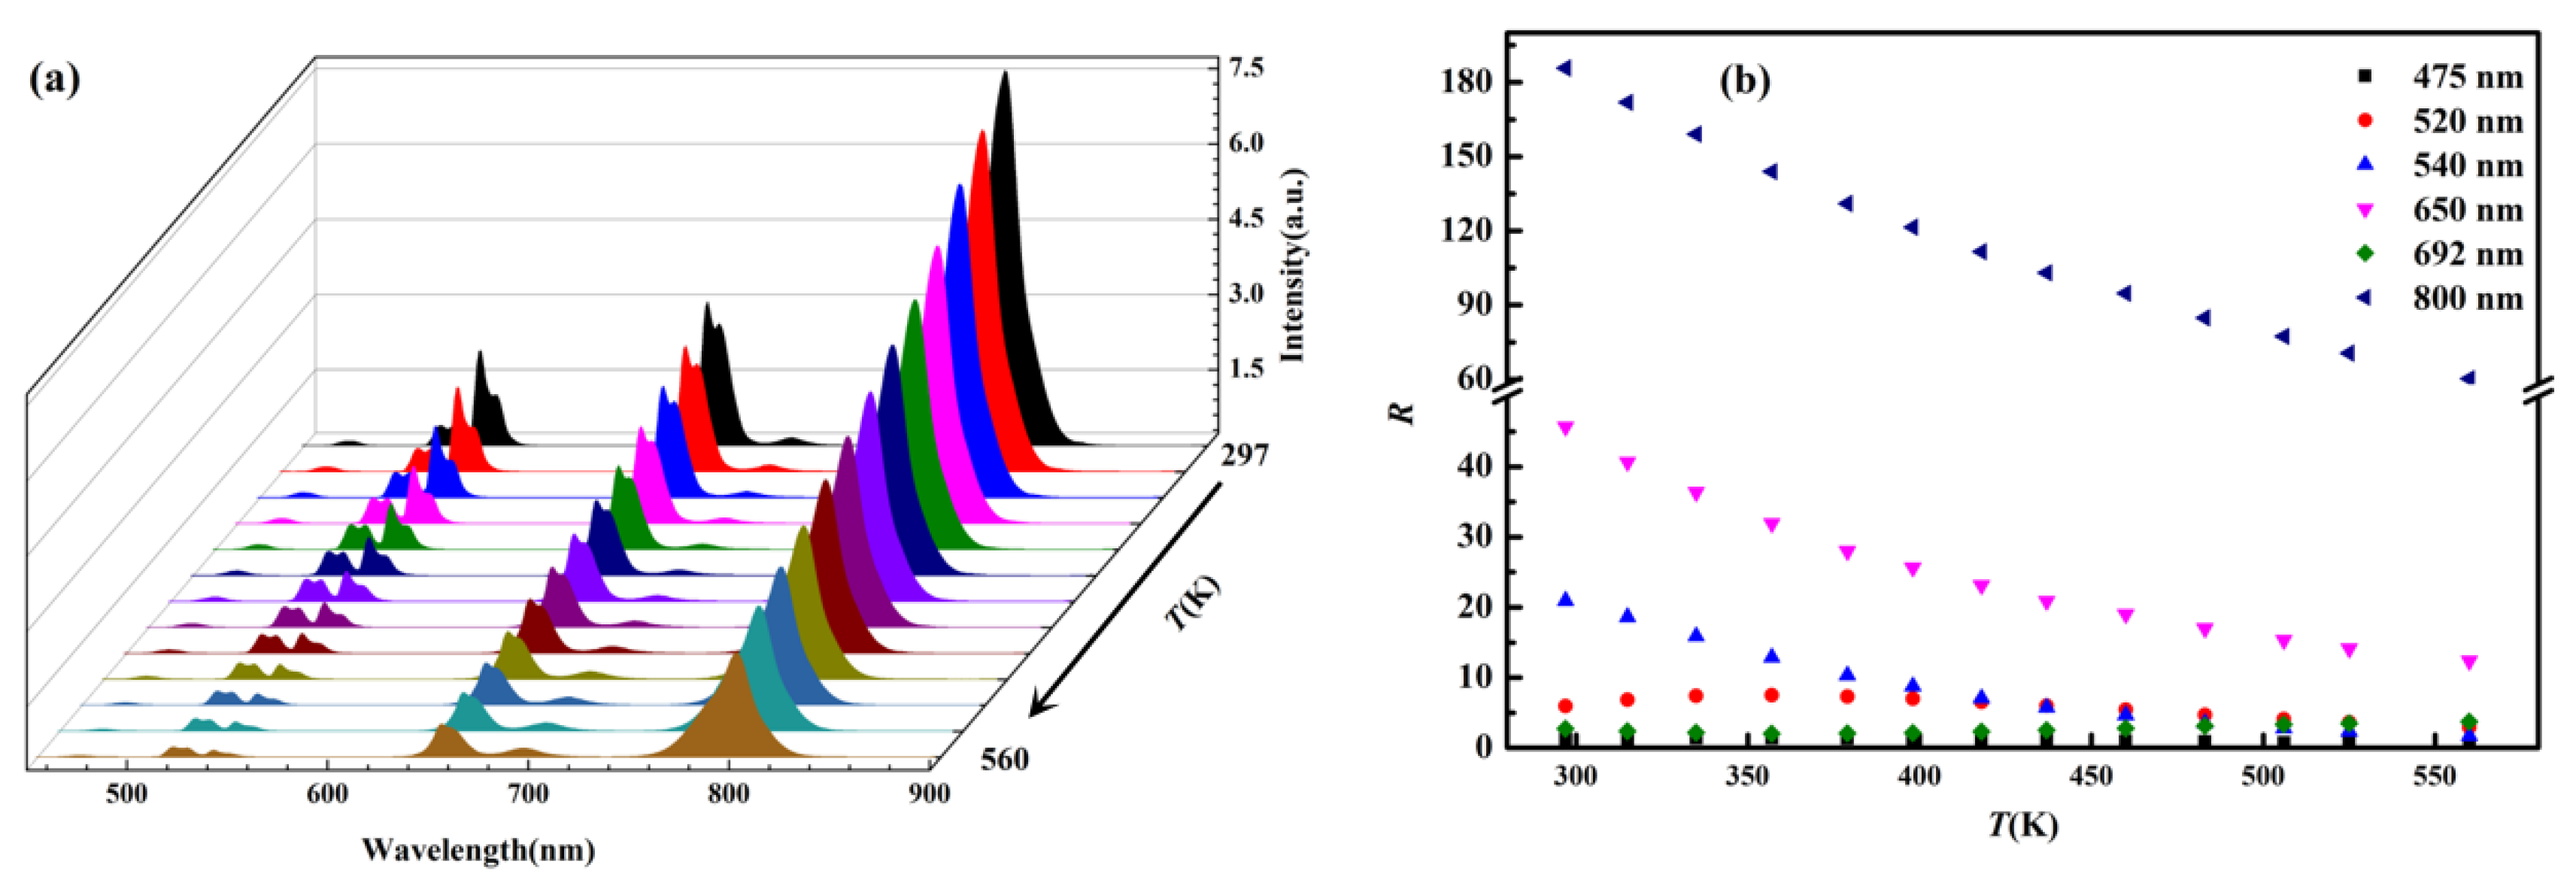
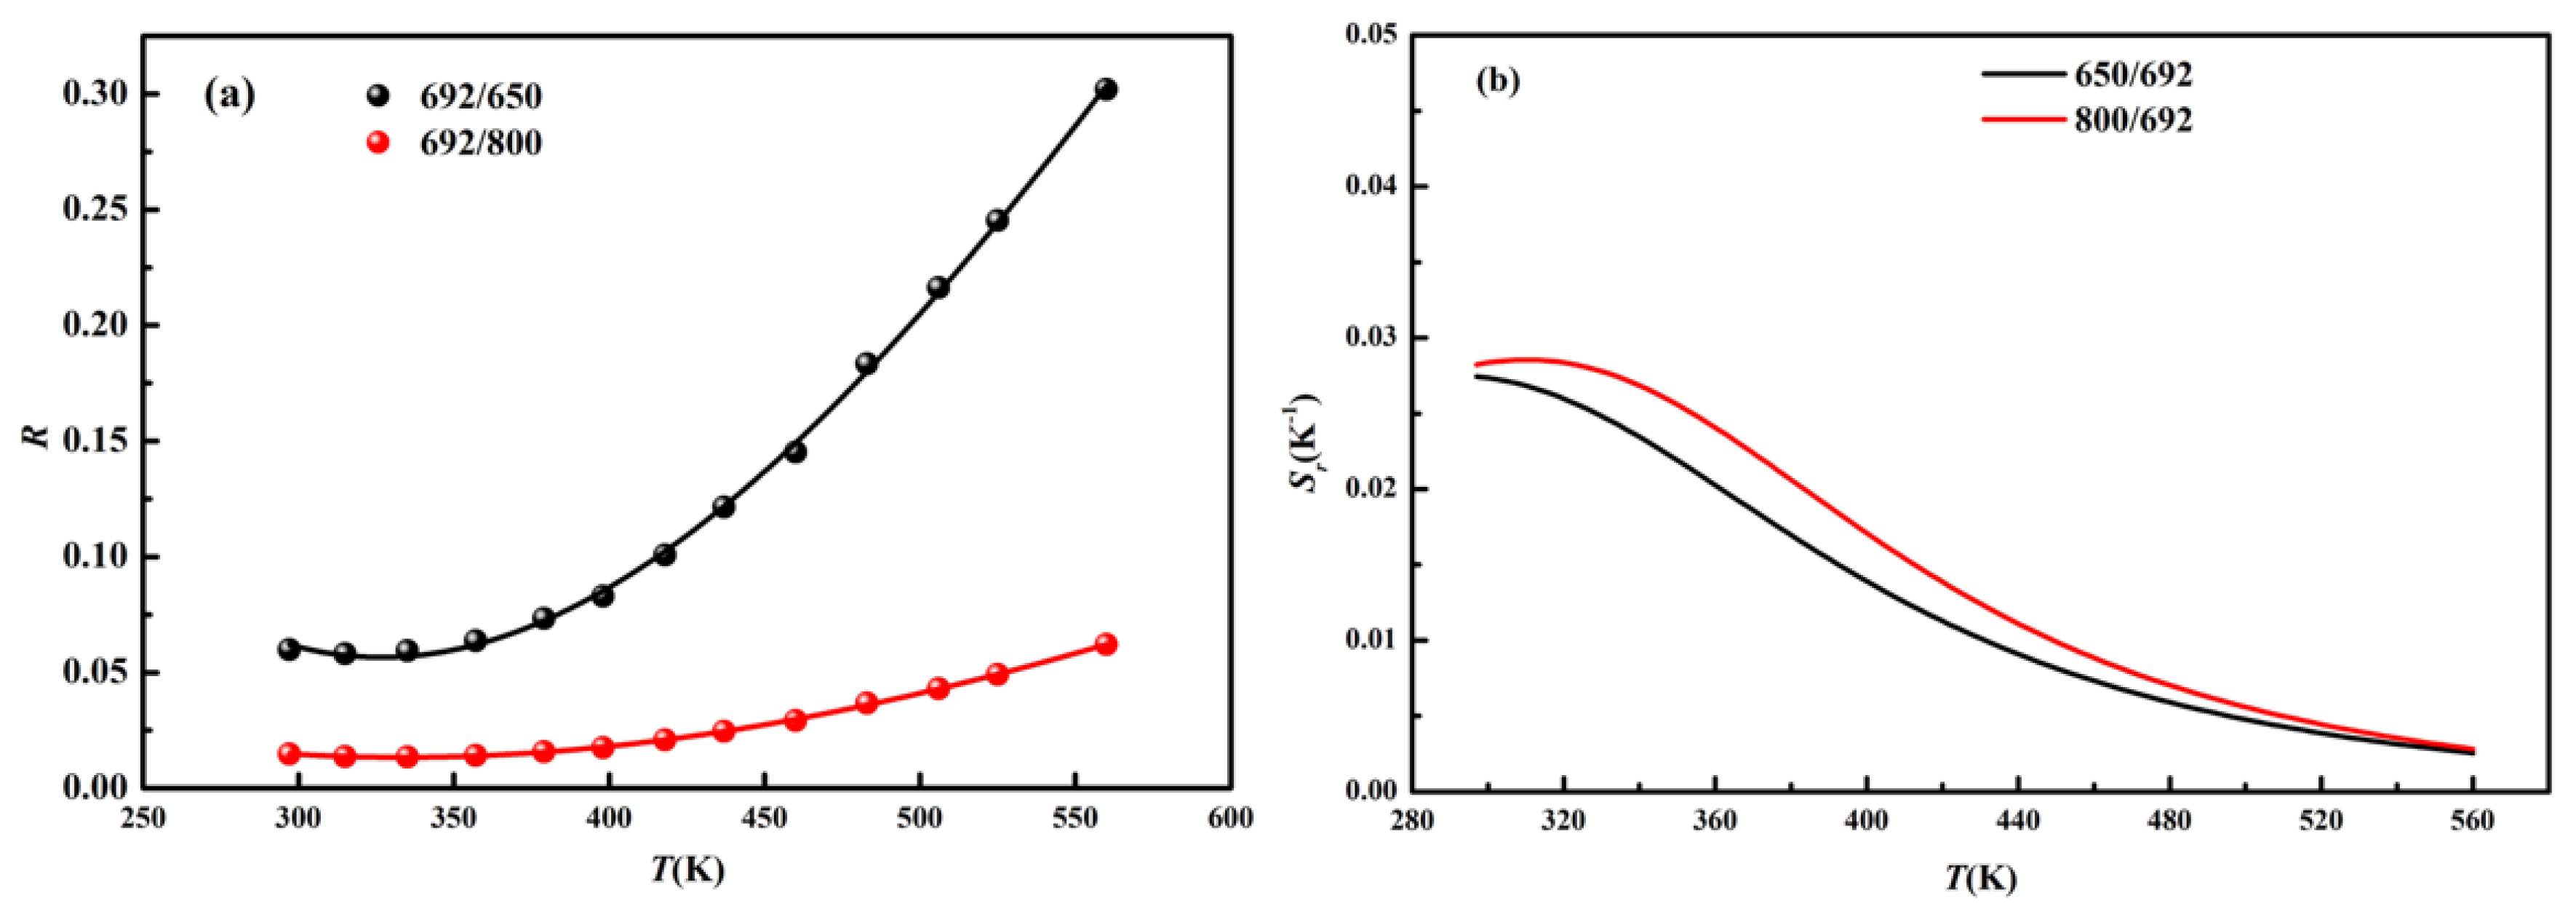
3.3. Temperature-Dependent Up-Conversion Luminescence

In order to analyze the variation law of up-conversion luminescence as the temperature changes, the emission spectra were obtained when the NaYF4: Er3+, Tm3+, Yb3+ phosphors were heated by heating stage. The up-conversion spectra of the sample at different temperatures are displayed in Figure 5a and the temperature-dependent integrated intensity of the emissions located at different wavelengths are displayed in Figure 5b. As can be seen, most of the emissions radiated from the sample decrease with increasing temperature except for the emissions located at 520 and 692 nm. The reason for emission decreases is that the non-radiative transition increases with the increase of temperature. However, the emission increases at 520 and 692 nm are due to the thermal excitation from the adjacent lower energy levels (4S3/22H11/2 (Er3+)/3H43F2 (Tm3+)).
To measure temperature via LIR, we chose the emissions located at 520 and 550 nm as the detected signals in the visible range and the emissions located at 650, 692 and 800 nm as the signals in the first biological window. For thermal coupled energy levels, the relationship between luminescence intensity ratio (520 and 550 nm) and temperature can be mathematically expressed as follows [26,27]
L I R = I h i g h I l o w = C e x p ( Δ E k T )
where Ihigh and Ilow are the integrated intensities of the green emissions corresponding to the transition of high energy level to ground state (2H11/24I15/2) and low energy level to ground state (4S3/24I15/2). Δ E is the energy gap between high and low energy levels. k is the Boltzmann constant. C is a parameter related to the degeneracy, the radiative probabilities of the transitions and the angular frequency [26,27]. Using the integrated areas under the 520 and 550 nm bands and applying Equation (1), a perfect fit (R > 0.99) to the determined band intensity ratio was obtained. The temperature-dependent LIR of 520 and 550 nm (R520/550) is shown in Figure 6a, in which the fitting function is R = 13.9exp(−1141/T). In order to compare the thermometry ability with other research, we calculated the relative sensing sensitivity (Sr) using the expression that follows [28]
S r   =   1 R   d R d T
The temperature dependent Sr of R520/550 is shown in Figure 6b and the value of relative sensing sensitivity decreases as the temperature increases from 297 to 560 K. The maximum value reaches to 0.013 K−1 (297 K).
In order to explore its thermometry ability in biological tissues, we studied the LIR of the emissions located in the first biological window (650, 692 and 800 nm). The temperature-dependent ratios of R692/650 and R692/800 are shown in Figure 7a. For the non-thermal coupled energy levels, the temperature-dependent ratios are fitted via the cubic function R = B 0 + B 1 T + B 2 T 2 + B 3 T 3 [29] and the fitting parameters are displayed in Table 1. To evaluate the sensing capacity, the relative sensing sensitivities are calculated through Expression (2) and the sensitivity curves are displayed in Figure 7b. The relative sensing sensitivities of R692/650 and R692/800 decrease as the temperature increases from 297 to 560 K. The maximum values reach to 0.027 and 0.028 K−1 (297 K), respectively. To compare the thermometry capacity of NaYF4: Er/Tm/Yb phosphors, the relevant parameters from other research are listed in Table 2. As can be seen, the sensing sensitivities of our samples are relatively high among these works based on thermal coupled levels and non-thermal coupled levels.

4. Conclusions

In summary, NaYF4: Er3+, Tm3+, Yb3+ phosphors were prepared through the typical hydrothermal method. The up-conversion luminescence and temperature-dependent emissions were studied under 980 nm laser excitation. The slopes in the lnI-lnP plot are 2.1, 1.9, 1.8, 1.5, 1.8, 1.5, 1.4 and 1.4 for 475, 520, 550, 650, 692 and 800 nm emissions, respectively. This implies that the 475, 520, 550, 650, 692 and 800 nm emissions are three-photon, two-photon, two-photon, two-photon, two-photon and two-photon processes, respectively. Moreover, the thermal coupled energy level- and non-thermal coupled energy level-based LIR thermometry of the sample demonstrates that these two methods can be used to test temperature. The maximum relative sensing sensitivities of R520/550, R692/650 and R692/800 reach to 0.013, 0.027 and 0.028 K−1 at 297 K, respectively. The results reveal that Er/Tm/Yb co-doped NaYF4 phosphors have great potential in LIR-based temperature sensing at room temperature. Meanwhile, the emissions for thermometry can alter from the visible range to the first biological window based on the actual requirements.

Author Contributions

J.L. performed the manuscript writing. Y.W. and X.Z. discussed the results. L.L. and H.H. corrected the manuscript. All authors have read and agreed to the published version of the manuscript.

Funding

The work was financially supported by the National Natural Science Foundation of China (Grant No. 12004217) and the Natural Science Foundation of Shandong Province (Grant No. ZR201910230199 and ZR201910230202).

Data Availability Statement

The data are available from the corresponding author upon reasonable request.

Conflicts of Interest

The authors declare no conflict of interest.

References

  1. Wang, X.D.; Wolfbeis, O.S.; Meier, R.J. Luminescent probes and sensors for temperature. Chem. Soc. Rev. 2013, 42, 7834–7869. [Google Scholar] [CrossRef]
  2. Usamentiaga, R.; Venegas, P.; Guerediaga, J.; Vega, L.; Molleda, J.; Bulnes, F.G. Infrared thermography for temperature measurement and non-destructive testing. Sensors 2014, 14, 12305–12348. [Google Scholar] [CrossRef] [Green Version]
  3. Artlett, C.P.; Pask, H.M. Optical remote sensing of water temperature using Raman spectroscopy. Opt. Express 2015, 23, 31844–31856. [Google Scholar] [CrossRef]
  4. Kalytchuk, S.; Polakova, K.; Wang, Y.; Froning, J.P.; Cepe, K.; Rogach, A.L.; Zboril, R. Carbon dot nanothermometry: Intracellular photoluminescence lifetime thermal sensing. ACS Nano 2017, 11, 1432–1442. [Google Scholar] [CrossRef] [PubMed]
  5. Hemmer, E.; Acosta-Mora, P.; Mendez-Ramos, J.; Fischer, S. Optical nanoprobes for biomedical applications: Shining a light on upconverting and near-infrared emitting nanoparticles for imaging, thermal sensing, and photodynamic therapy. J. Mater. Chem. B 2017, 5, 4365–4392. [Google Scholar] [CrossRef] [PubMed]
  6. Wu, Y.; Liu, J.; Ma, J.; Liu, Y.; Wang, Y.; Wu, D. Ratiometric nanothermometer based on rhodamine dye-incorporated F127-melamine-formaldehyde polymer nanoparticle: Preparation, characterization, wide-range temperature sensing, and precise intracellular thermometry. ACS Appl. Mater. Interfaces 2016, 8, 14396–14405. [Google Scholar] [CrossRef] [PubMed]
  7. Brites, C.D.; Lima, P.P.; Silva, N.J.; Millán, A.; Amaral, V.S.; Palacio, F.; Carlos, L.D. Thermometry at the nanoscale. Nanoscale 2012, 4, 4799–4829. [Google Scholar] [CrossRef] [PubMed] [Green Version]
  8. Zhou, S.; Jiang, S.; Wei, X.; Chen, Y.; Duan, C.; Yin, M. Optical thermometry based on upconversion luminescence in Yb3+/Ho3+ co-doped NaLuF4. J. Alloys Compd. 2014, 588, 654–657. [Google Scholar] [CrossRef]
  9. Zhou, S.; Jiang, G.; Li, X.; Jiang, S.; Wei, X.; Chen, Y.; Yin, M.; Duan, C. Strategy for thermometry via Tm3+-doped NaYF4 core-shell nanoparticles. Opt. Lett. 2014, 39, 6687–6690. [Google Scholar] [CrossRef] [PubMed]
  10. Kusama, H.; Sovers, O.J.; Yoshioka, T. Line shift method for phosphor temperature measurements. Jpn. J. Appl. Phys. 1976, 15, 2349. [Google Scholar] [CrossRef]
  11. Yu, J.; Sun, L.; Peng, H.; Stich, M.I. Luminescent terbium and europium probes for lifetime based sensing of temperature between 0 and 70 °C. J. Mater. Chem. 2010, 20, 6975–6981. [Google Scholar] [CrossRef]
  12. Wang, Z.; Jiao, H.; Fu, Z. Investigating the luminescence behaviors and temperature sensing properties of rare-earth-doped Ba2In2O5 phosphors. Inorg. Chem. 2018, 57, 8841–8849. [Google Scholar] [CrossRef] [PubMed]
  13. Du, P.; Yu, J.S. Effect of molybdenum on upconversion emission and temperature sensing properties in Na0.5Bi0.5TiO3:Er/Yb ceramics. Ceram. Inter. 2015, 41, 6710–6714. [Google Scholar] [CrossRef]
  14. Belkhir, N.H.; Toncelli, A.; Parchur, A.K.; Alves, E.; Maalej, R. Efficient temperature sensing using photoluminescence of Er/Yb implanted GaN thin films. Sens. Actuat. B Chem. 2017, 248, 769–776. [Google Scholar] [CrossRef] [Green Version]
  15. Xu, L.; Liu, J.; Pei, L.; Xu, Y.; Xia, Z. Enhanced up-conversion luminescence and optical temperature sensing in graphitic C3N4 quantum dots grafted with BaWO4: Yb3+, Er3+ phosphors. J. Mater. Chem. C 2019, 7, 6112–6119. [Google Scholar] [CrossRef]
  16. Gao, X.; Song, F.; Ju, D.; Zhou, A.; Khan, A.; Chen, Z.; Feng, M.; Liu, L. Room-temperature ultrafast synthesis, morphology and upconversion luminescence of K0.3Bi0.7F2.4:Yb3+/Er3+ nanoparticles for temperature-sensing application. CrystEngComm 2020, 22, 7066–7074. [Google Scholar] [CrossRef]
  17. Wang, Y.; Song, S.; Zhang, S.; Zhang, H. Stimuli-responsive nanotheranostics based on lanthanide-doped upconversion nanoparticles for cancer imaging and therapy: Current advances and future challenges. Nano Today 2019, 25, 38–67. [Google Scholar] [CrossRef]
  18. Xu, L.; Li, J.; Lu, K.; Wen, S.; Chen, H.; Shahzad, M.K.; Liu, L. Sub-10 nm NaNdF4 nanoparticles as near-infrared photothermal probes with self-temperature feedback. ACS Appl. Nano Mater. 2020, 3, 2517–2526. [Google Scholar] [CrossRef]
  19. Joshi, R.; Perala, R.S.; Shelar, S.B.; Ballal, A.; Singh, B.P.; Ningthoujam, R.S. Super Bright Red Upconversion in NaErF4:0.5%Tm@NaYF4:20%Yb Nanoparticles for Anti-counterfeit and Bioimaging Applications. ACS Appl. Mater. Interfaces 2020, 13, 3481–3490. [Google Scholar] [CrossRef]
  20. Wang, Z.; Jiao, H.; Fu, Z. Investigation on the up-conversion luminescence and temperature sensing properties based on non-thermally coupled levels of rare earth ions doped Ba2In2O5 phosphor. J. Lumin. 2019, 206, 273–277. [Google Scholar] [CrossRef]
  21. de Sousa Filho, P.C.; Alain, J.; Lemenager, G.; Larquet, E.; Fick, J.; Serra, O.A.; Gacoin, T. Colloidal rare earth vanadate single crystalline particles as ratiometric luminescent thermometers. J. Phys. Chem. C 2019, 123, 2441–2450. [Google Scholar] [CrossRef]
  22. Wang, J.; Lin, H.; Cheng, Y.; Cui, X.; Gao, Y.; Ji, Z.; Xu, J.; Wang, Y. A novel high-sensitive upconversion thermometry strategy: Utilizing synergistic effect of dual-wavelength lasers excitation to manipulate electron thermal distribution. Sens. Actuat. B Chem. 2019, 278, 165–171. [Google Scholar] [CrossRef]
  23. Runowski, M.; Bartkowiak, A.; Majewska, M.; Martín, I.R.; Lis, S. Upconverting lanthanide doped fluoride NaLuF4:Yb3+-Er3+-Ho3+-optical sensor for multi-range fluorescence intensity ratio (FIR) thermometry in visible and NIR regions. J. Lumin. 2018, 201, 104–109. [Google Scholar] [CrossRef]
  24. Suyver, J.F.; Grimm, J.; Van Veen, M.K.; Biner, D.; Krämer, K.W.; Güdel, H.U. Upconversion spectroscopy and properties of NaYF4 doped with Er3+, Tm3+ and/or Yb3+. J. Lumin. 2006, 117, 1–12. [Google Scholar] [CrossRef]
  25. Zhou, J.; Chen, G.; Zhu, Y.; Huo, L.; Mao, W.; Zou, D.; Sun, X.; Wu, E.; Zhang, H.; Zhang, J.; et al. Intense multiphoton upconversion of Yb3+-Tm3+ doped β-NaYF4 individual nanocrystals by saturation excitation. J. Mater. Chem. C 2015, 3, 364–369. [Google Scholar] [CrossRef]
  26. Maurya, A.; Bahadur, A.; Dwivedi, A.; Choudhary, A.K.; Yadav, T.P.; Vishwakarma, P.K.; Rai, S.B. Optical properties of Er3+, Yb3+ co-doped calcium zirconate phosphor and temperature sensing efficiency: Effect of alkali ions (Li+, Na+ and K+). J. Phys. Chem. Solids 2018, 119, 228–237. [Google Scholar] [CrossRef]
  27. Hao, H.; Zhang, X.; Wang, Y.; Liang, L. Color modulation and temperature sensing investigation of Gd2O3: 1 mol% Er3+, 1 mol% Yb3+ phosphors under different excitation condition. J. Lumin. 2019, 215, 116556. [Google Scholar] [CrossRef]
  28. Zhang, J.; Jin, C. Electronic structure, upconversion luminescence and optical temperature sensing behavior of Yb3+-Er3+/Ho3+ doped NaLaMgWO6. J. Alloys Compd. 2019, 783, 84–94. [Google Scholar] [CrossRef]
  29. Lu, H.; Hao, H.; Gao, Y.; Li, D.; Shi, G.; Song, Y.; Wang, Y.; Zhang, X. Optical sensing of temperature based on non-thermally coupled levels and upconverted white light emission of a Gd2(WO4)3 phosphor co-doped with in Ho(III), Tm(III), and Yb(III). Microchim. Acta 2017, 184, 641–646. [Google Scholar] [CrossRef]
  30. Mikalauskaite, I.; Pleckaityte, G.; Skapas, M.; Zarkov, A.; Katelnikovas, A.; Beganskiene, A. Emission spectra tuning of upconverting NaGdF4: 20%Yb, 2%Er nanoparticles by Cr3+ co-doping for optical temperature sensing. J. Lumin. 2019, 213, 210–217. [Google Scholar] [CrossRef]
  31. Dantelle, G.; Reita, V.; Delacour, C. Luminescent Yb3+,Er3+-Doped α-La(IO3)3 Nanocrystals for Neuronal Network Bio-Imaging and Nanothermometry. Nanomaterials 2021, 11, 479. [Google Scholar] [CrossRef] [PubMed]
  32. Cao, J.; Zhang, J.; Li, X. Upconversion luminescence of Ba3La(PO4)3:Yb3+-Er3+/Tm3+ phosphors for optimal temperature sensing. Appl. Opt. 2018, 57, 1345–1350. [Google Scholar] [CrossRef] [PubMed]
  33. Stopikowska, N.; Runowski, M.; Woźny, P.; Goderski, S.; Lis, S. Improving temperature resolution of luminescent nanothermometers working in the near-infrared range using non-thermally coupled levels of Yb3+ & Tm3+. J. Lumin. 2020, 228, 117643. [Google Scholar]
  34. Lu, K.; Yi, Y.; Xu, L.; Sun, X.; Liu, L.; Li, H. Temperature-independent lifetime and thermometer operated in a biological window of upconverting NaErF4 nanocrystals. Nanomaterials 2020, 10, 24. [Google Scholar] [CrossRef] [PubMed] [Green Version]
  35. Kalinichev, A.A.; Kurochkin, M.A.; Kolomytsev, A.Y.; Khasbieva, R.S.; Kolesnikov, E.Y.; Lähderanta, E.; Kolesnikov, I.E. Yb3+/Er3+- codoped GeO2-PbO-PbF2 glass ceramics for ratiometric upconversion temperature sensing based on thermally and non-thermally coupled levels. Opt. Mater. 2019, 90, 200–207. [Google Scholar] [CrossRef]
  36. Xu, W.; Zhao, D.; Zhu, X.; Zheng, L.; Zhang, Z.; Cao, W. NIR to NIR luminescence thermometry in core/multishells-structured nanoparticles operating in the biological window. J. Lumin. 2020, 225, 117358. [Google Scholar] [CrossRef]
  37. Chen, G.; Lei, R.; Wang, H.; Huang, F.; Zhao, S.; Xu, S. Temperature-dependent emission color and temperature sensing behavior in Tm3+/Yb3+: Y2O3 nanoparticles. Opt. Mater. 2018, 77, 233–239. [Google Scholar] [CrossRef]
  38. Chen, S.; Song, W.; Cao, J.; Hu, F.; Guo, H. Highly sensitive optical thermometer based on FIR technique of transparent NaY2F7:Tm3+/Yb3+ glass ceramic. J. Alloys Compd. 2020, 825, 154011. [Google Scholar] [CrossRef]
  39. Li, Z.; Lin, L.; Feng, Z.; Huang, L.; Wang, Z.; Zheng, Z. Wide-range temperature sensing of NaYF4: Ho3+ nanoparticles by multi-emissions in dual spectral ranges. J. Lumin. 2021, 232, 117873. [Google Scholar] [CrossRef]
  40. Xia, H.; Lei, L.; Xia, J.; Hua, Y.; Deng, D.; Xu, S. Yb/Er/Tm tri-doped Na3ZrF7 upconversion nanocrystals for high performance temperature sensing. J. Lumin. 2019, 209, 8–13. [Google Scholar] [CrossRef]
Figure 1. (a) XRD patterns of NaYF4: Er/Yb and NaYF4: Er/Tm/Yb phosphors; TEM images of (b) NaYF4: Er/Yb and (c) NaYF4: Er/Tm/Yb phosphors (the scale bare is 1 μm).
Nanomaterials 11 02660 g001
Figure 2. Up-conversion spectra of the samples under 980 nm laser excitation (5 W/cm2).
Nanomaterials 11 02660 g002
Figure 3. Schematic energy levels and the possible up-conversion processes in Er3+, Tm3+, Yb3+ co-doped materials.
Nanomaterials 11 02660 g003
Figure 4. Ln-ln plot of emission intensity against the excitation power for NaYF4:Er/Tm/Yb phosphors.
Nanomaterials 11 02660 g004
Figure 5. (a) Up-conversion luminescence of the sample at different temperatures; (b) temperature-dependent integrated intensity of the emissions located at different wavelengths.
Nanomaterials 11 02660 g005
Figure 6. (a) Temperature dependent R520/550; (b) Sr of R520/550.
Nanomaterials 11 02660 g006
Figure 7. (a) Temperature-dependent ratios of R692/650 and R692/800; (b) Sr of R692/650 and R692/800.
Nanomaterials 11 02660 g007
Table 1. The fitting parameters of R692/650 and R692/800.
ParameterR692/650R692/800
B00.940.17
B1−0.0061−0.0010
B21.3 × 10−51.9 × 10⁻⁶
B3−6.7 × 10⁻⁹−7.9 × 10⁻¹⁰
Table 2. Comparison of relative sensing sensitivities in LIR thermometry.
MaterialsWavelengths (nm)Temperature Range (K)Sr(K−1)
(Temperature, K)
Ref.
NaGdF4: Yb/Er520/55077–5000.0112 (298)[30]
La(IO3)3: Yb/Er520/550298–3430.012 (298)[31]
Ba3La(PO4)3: Yb/Er520/550298–4980.0117 (298)[32]
Ba3La(PO4)3: Yb/Tm690/792303–5030.0211 (303)[32]
YF3: Yb/Tm940/800303–3450.008 (310)[33]
NaErF4@NaGdF4806/654303–5930.0058 (303)[34]
GeO2-PbO-PbF2: Yb/Er520/650300–4660.01 (300)[35]
NaYbF4/NaYF4: Tm/Yb/NaYF4800/1800303–4230.0033 (300)[36]
Y2O3: Yb/Tm684/490303–5730.0151 (445)[37]
NaY2F7: Yb/Tm678/700307–5670.016 (415)[38]
NaYF4: Ho961/1183113–4730.008 (367)[39]
Na3ZrF7: Yb/Er/Tm800/673313–3930.0176 (313)[40]
NaYF4: Er/Tm/Yb520/550297–5600.013 (297)This work
692/650297–5600.027 (297)This work
692/800297–5600.028 (297)This work
Publisher’s Note: MDPI stays neutral with regard to jurisdictional claims in published maps and institutional affiliations.

