Performance Evaluation of Porous Graphene as Filter Media for the Removal of Pharmaceutical/Emerging Contaminants from Water and Wastewater

 ,
,  , , , ,

Abstract
1. Introduction
2. Materials and Methods
2.1. Materials
2.1.1. Nano-Adsorbent Preparation and Pharmaceuticals
2.1.2. Water Samples
2.2. Methods
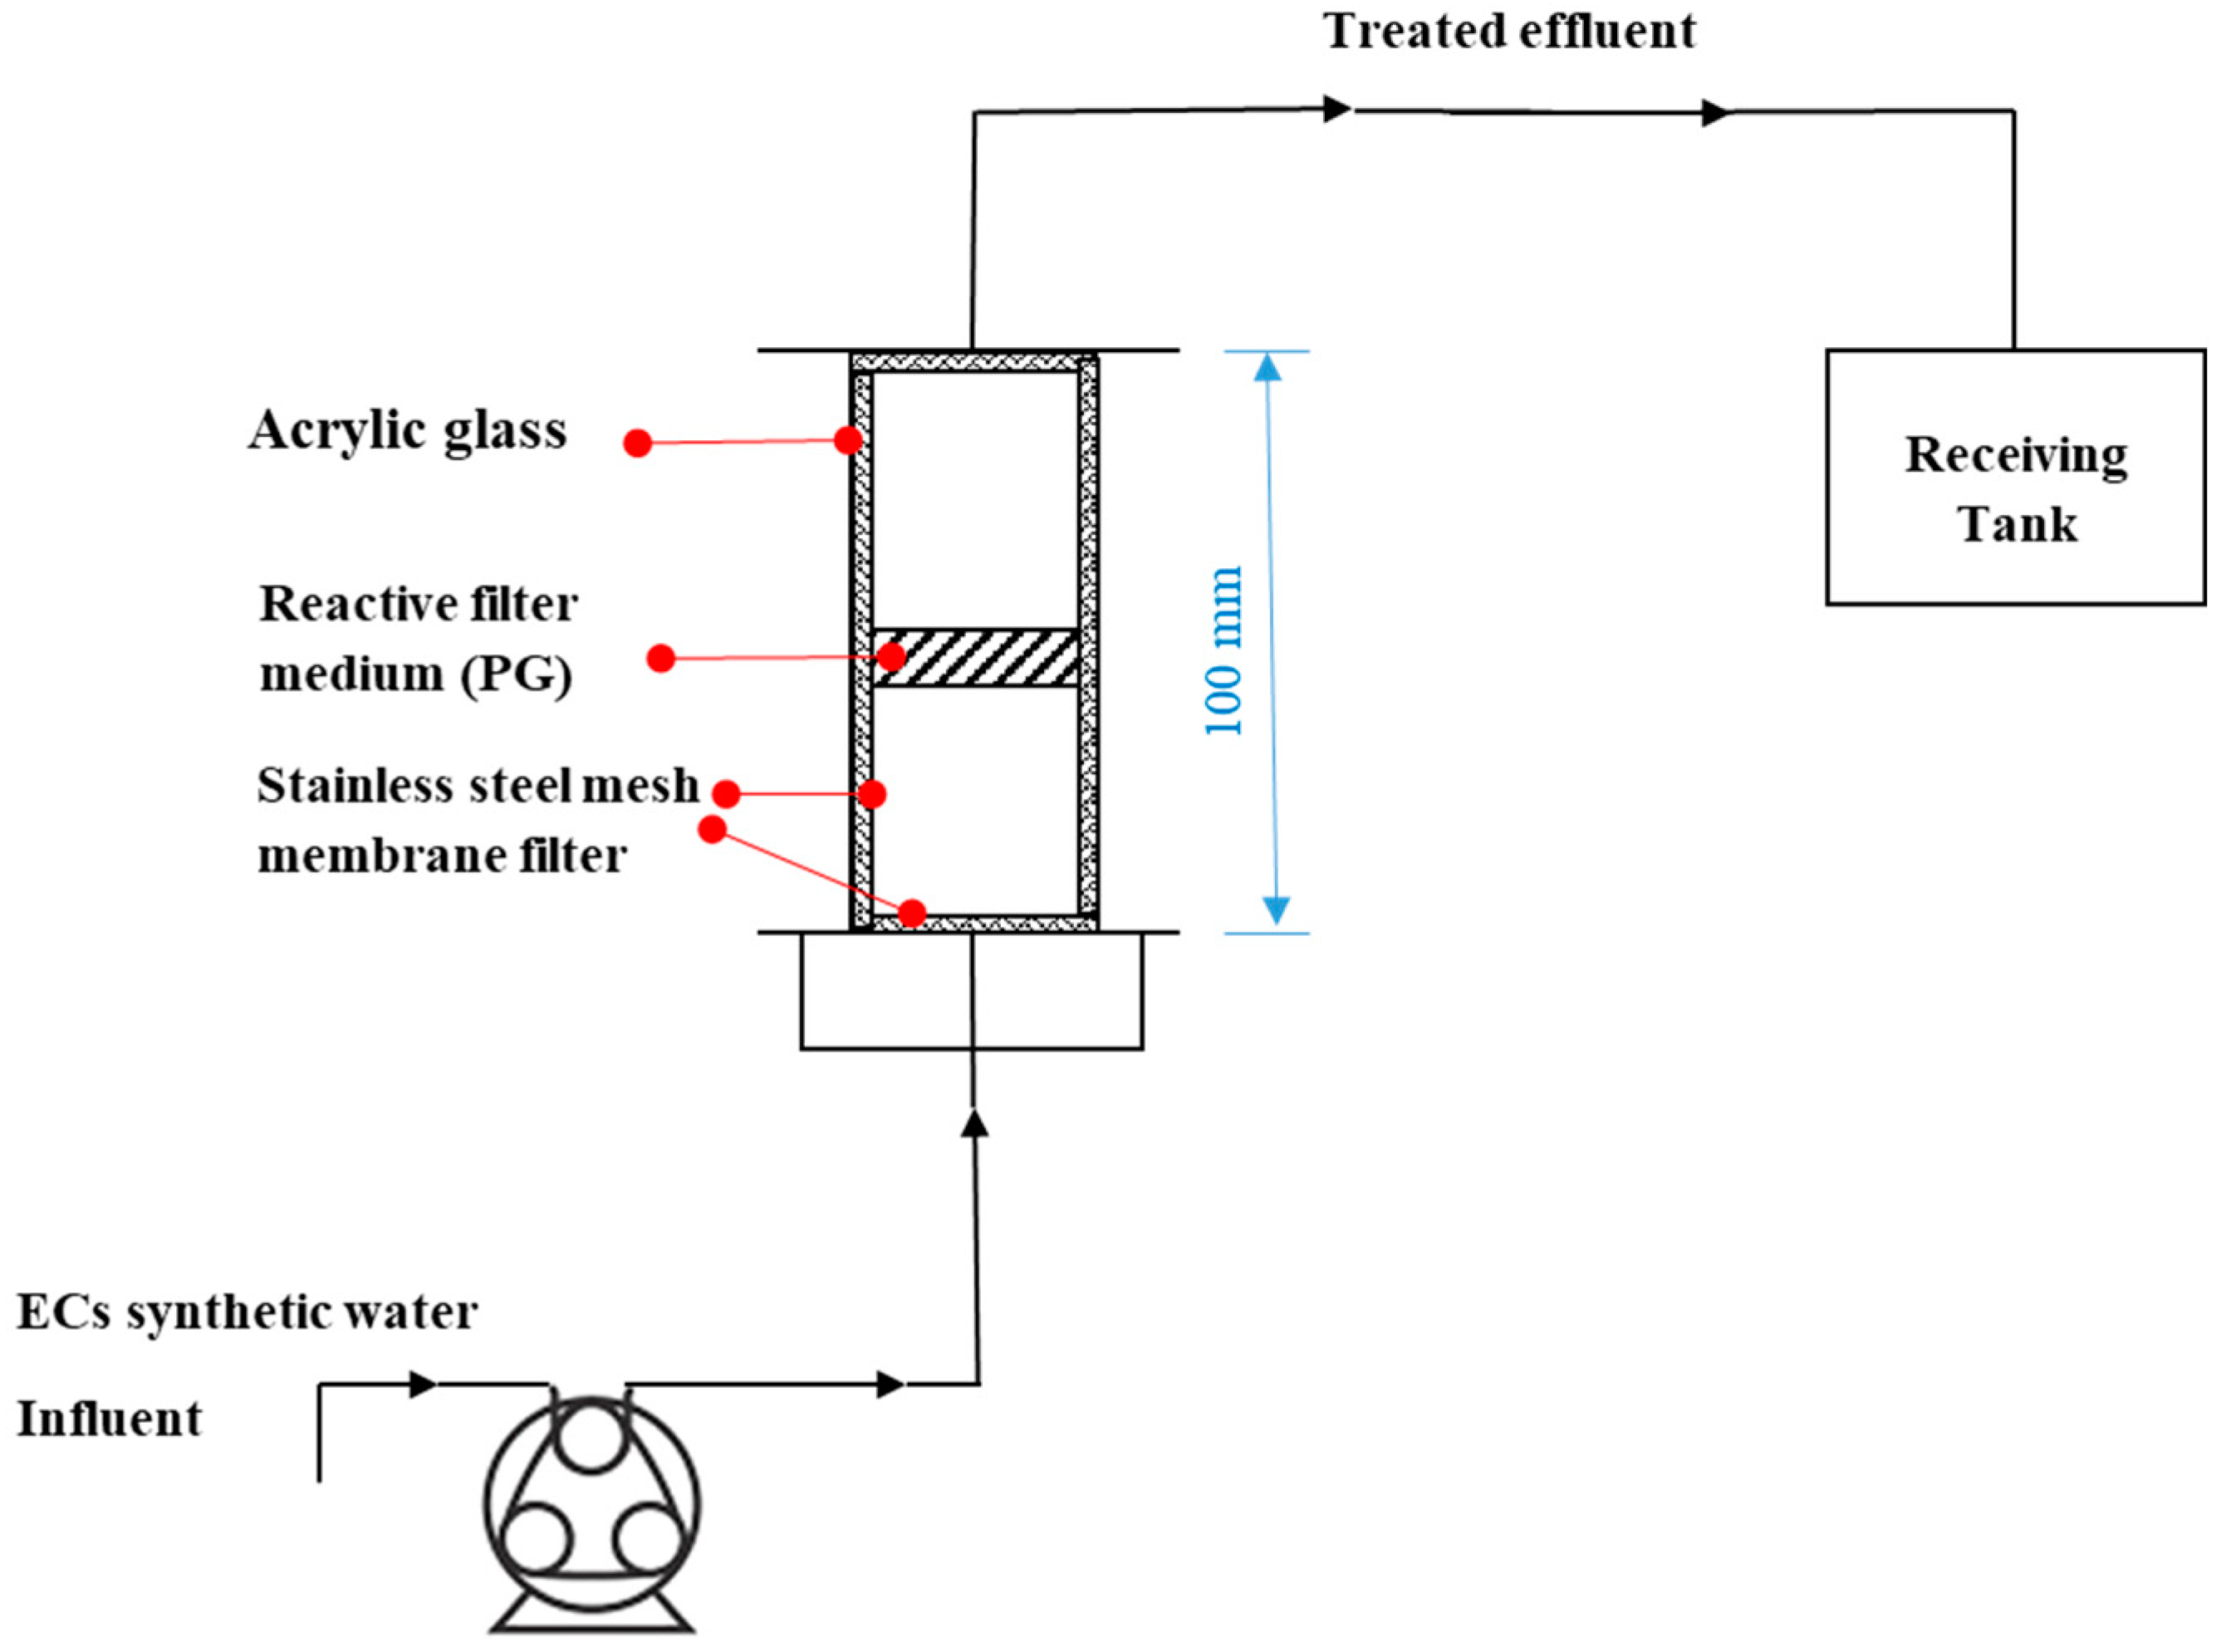
2.2.1. Column Tests
2.2.2. Columns Assembly
2.2.3. Column Sorption Tests
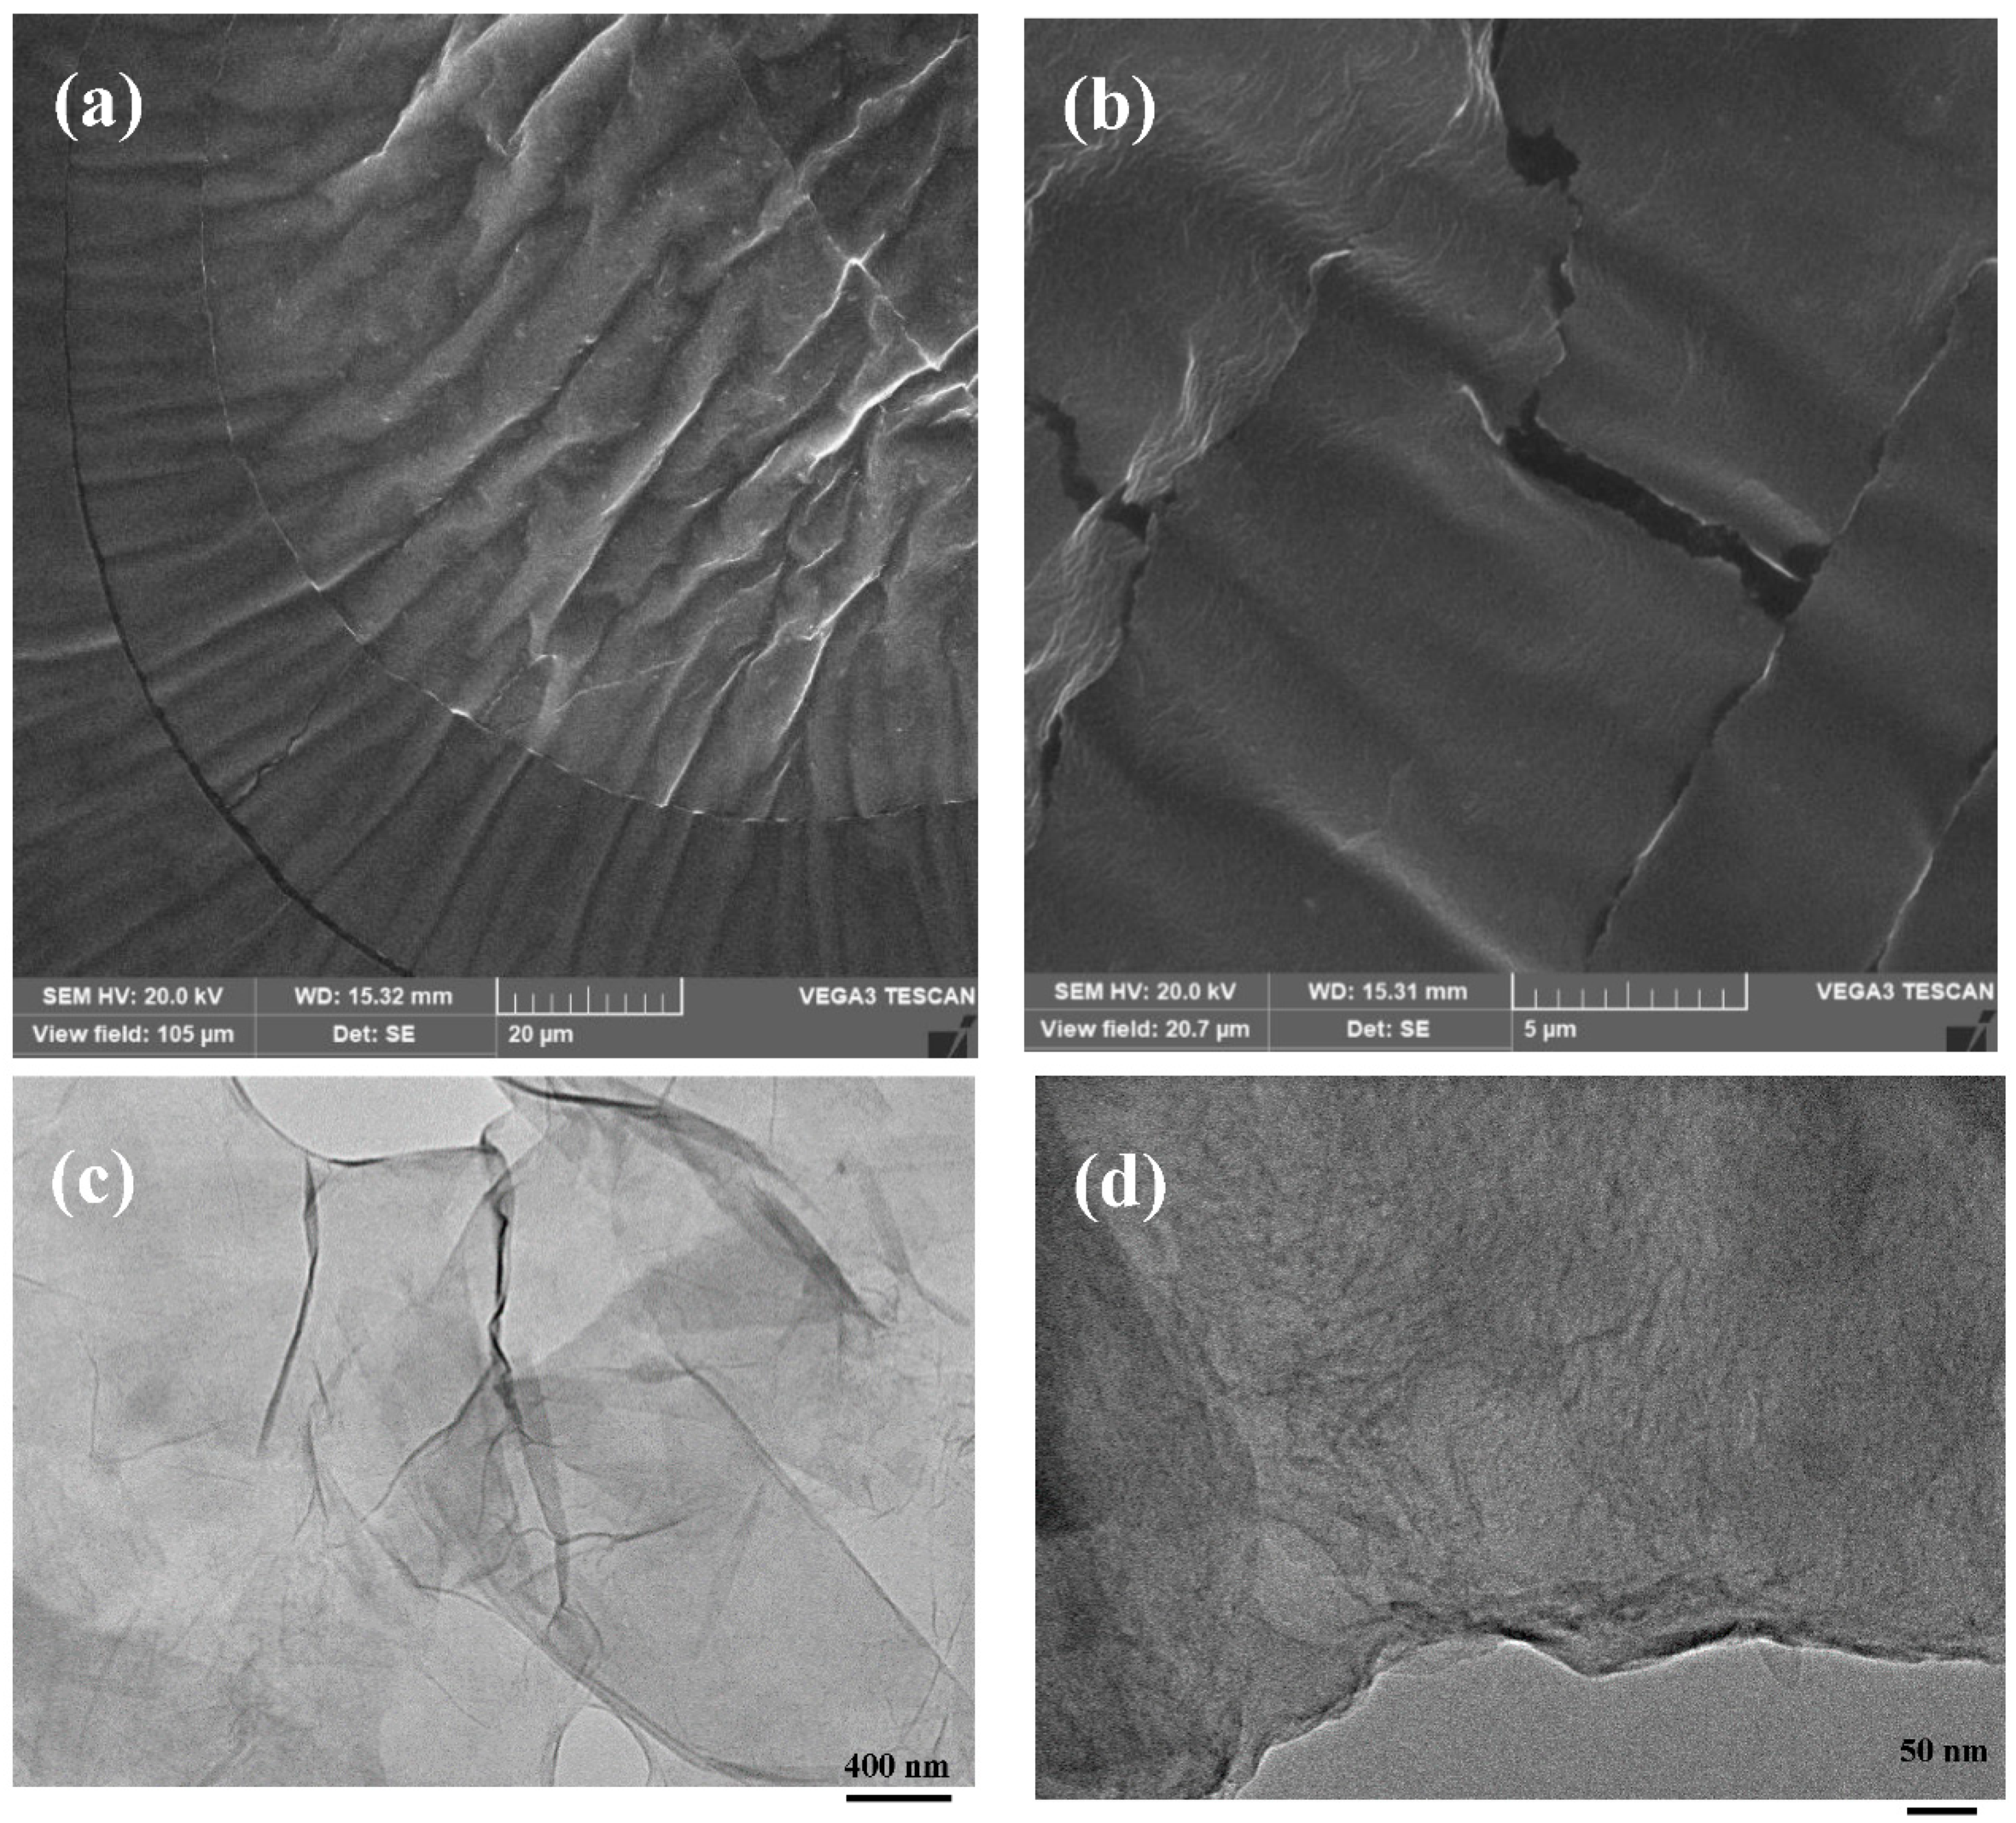
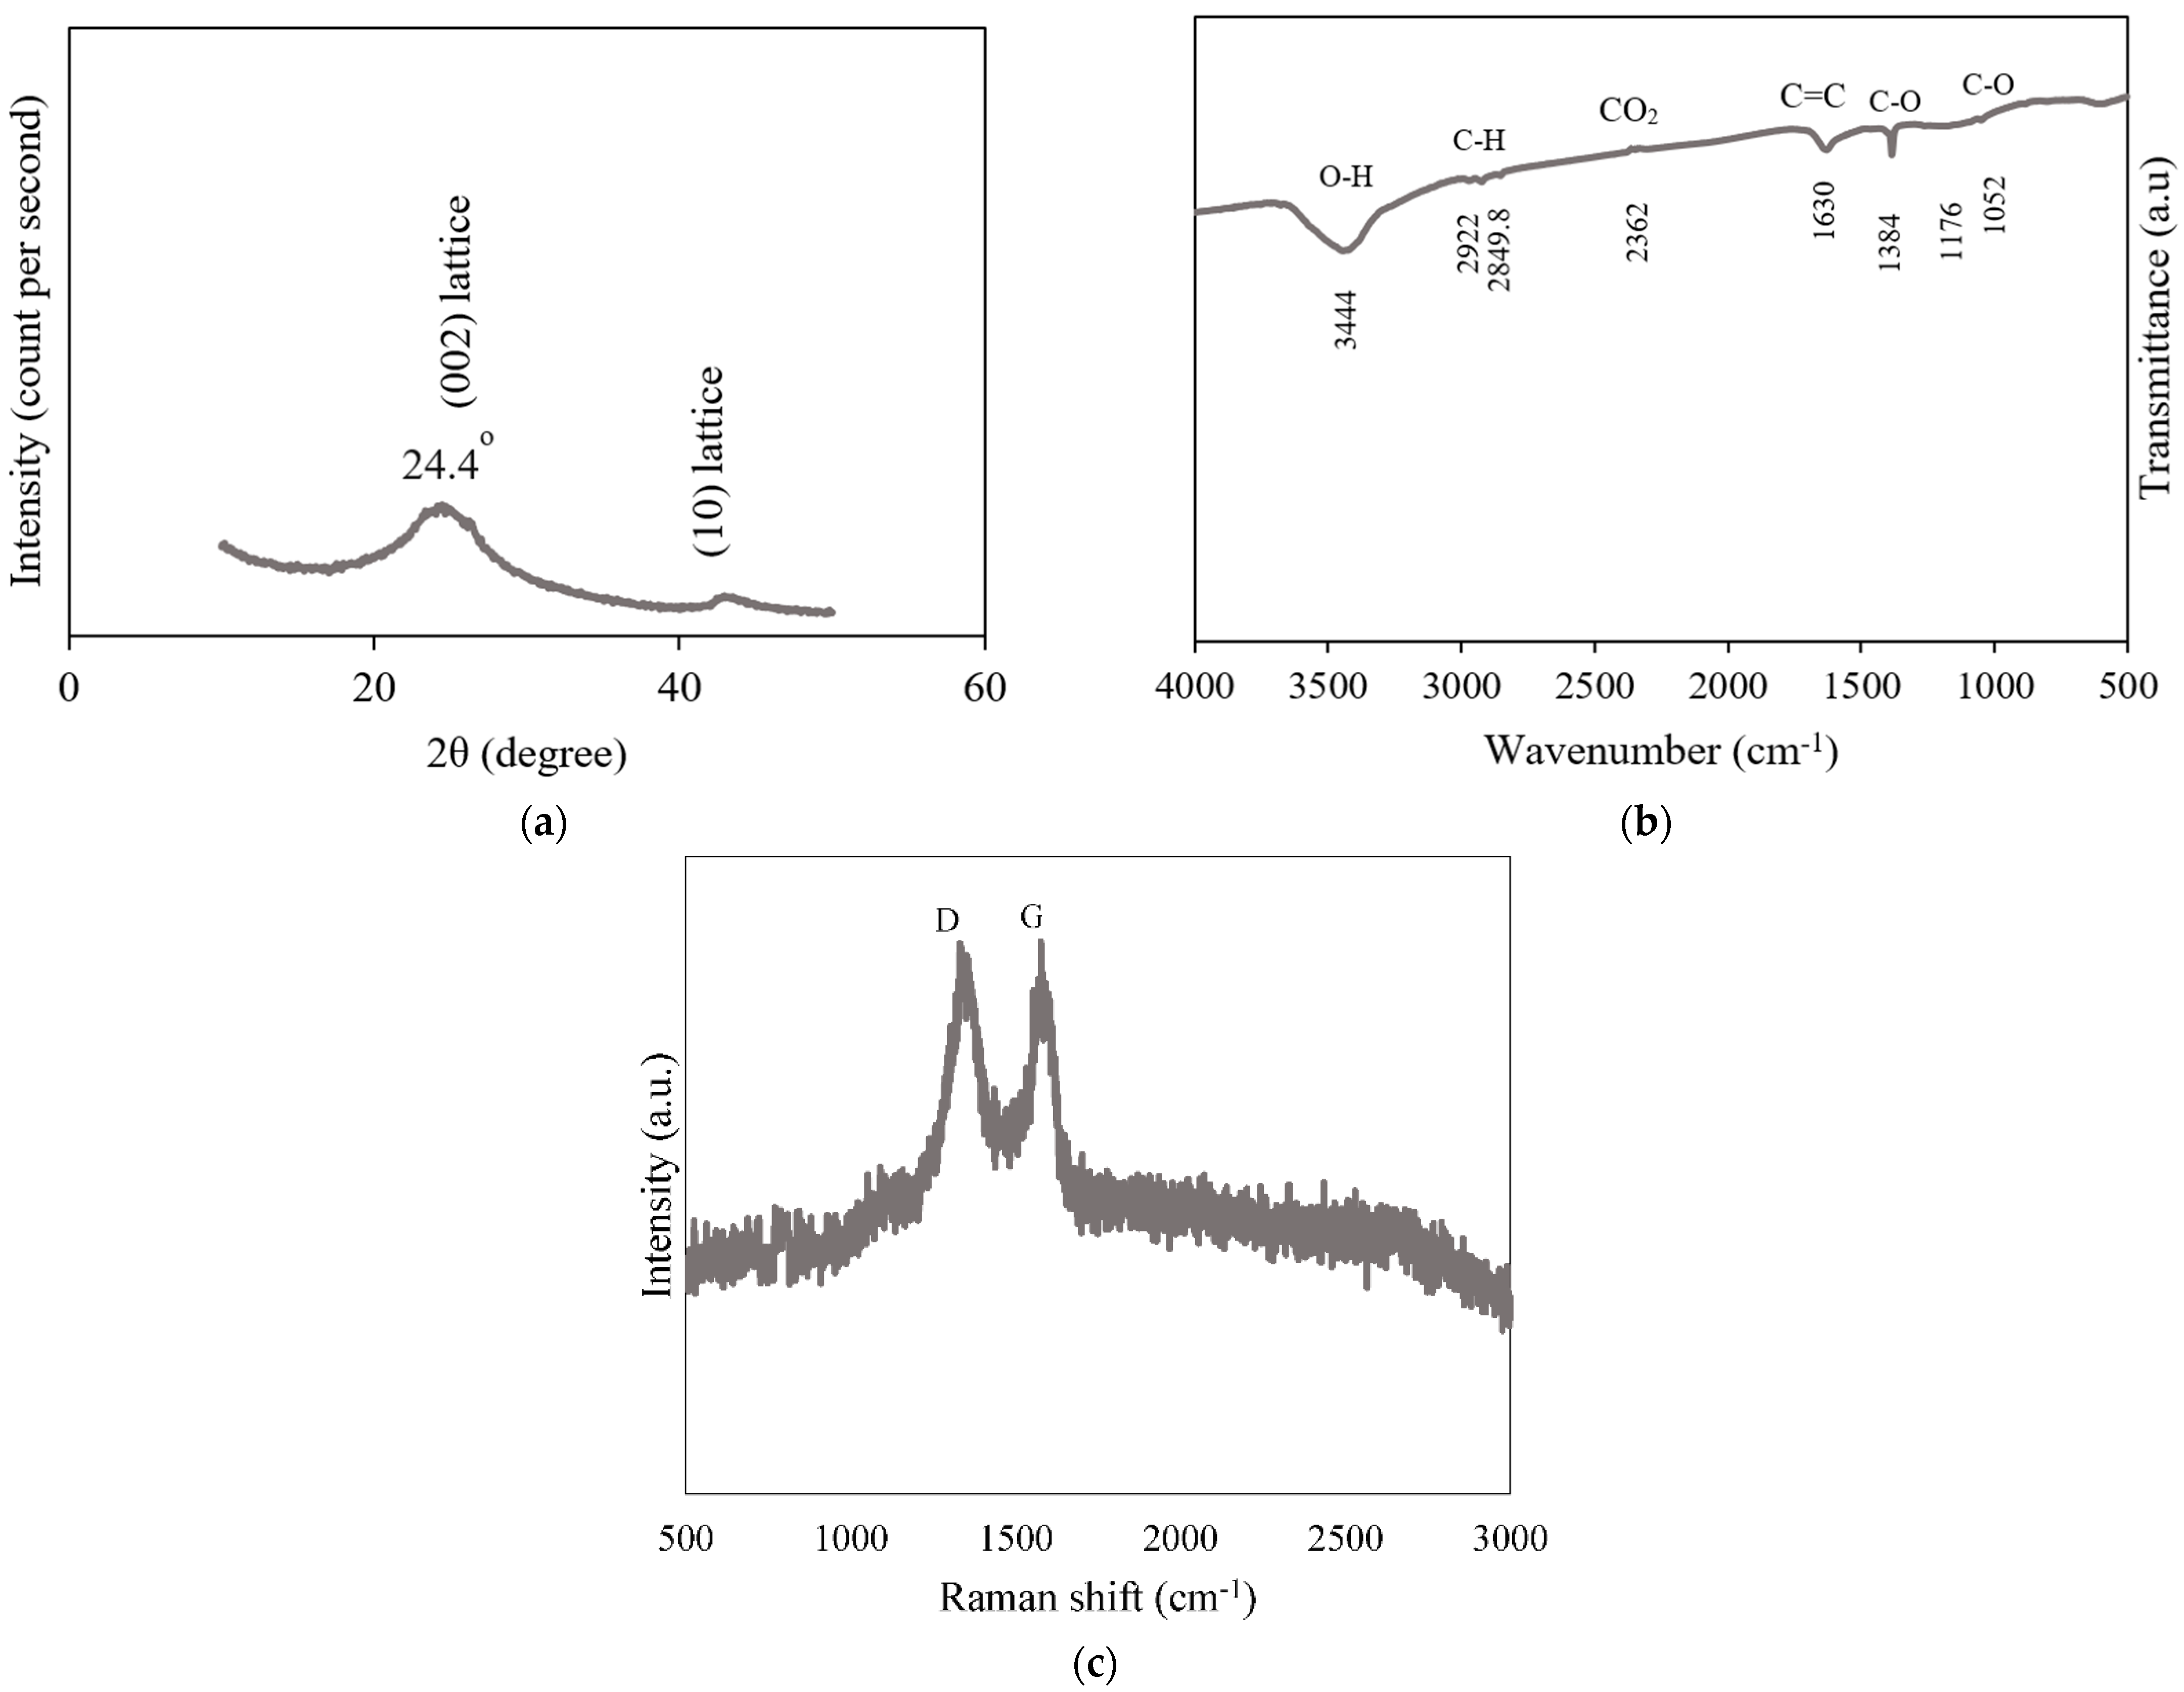
2.2.4. Characterisation Methods
3. Results and Discussion
3.1. Material Properties
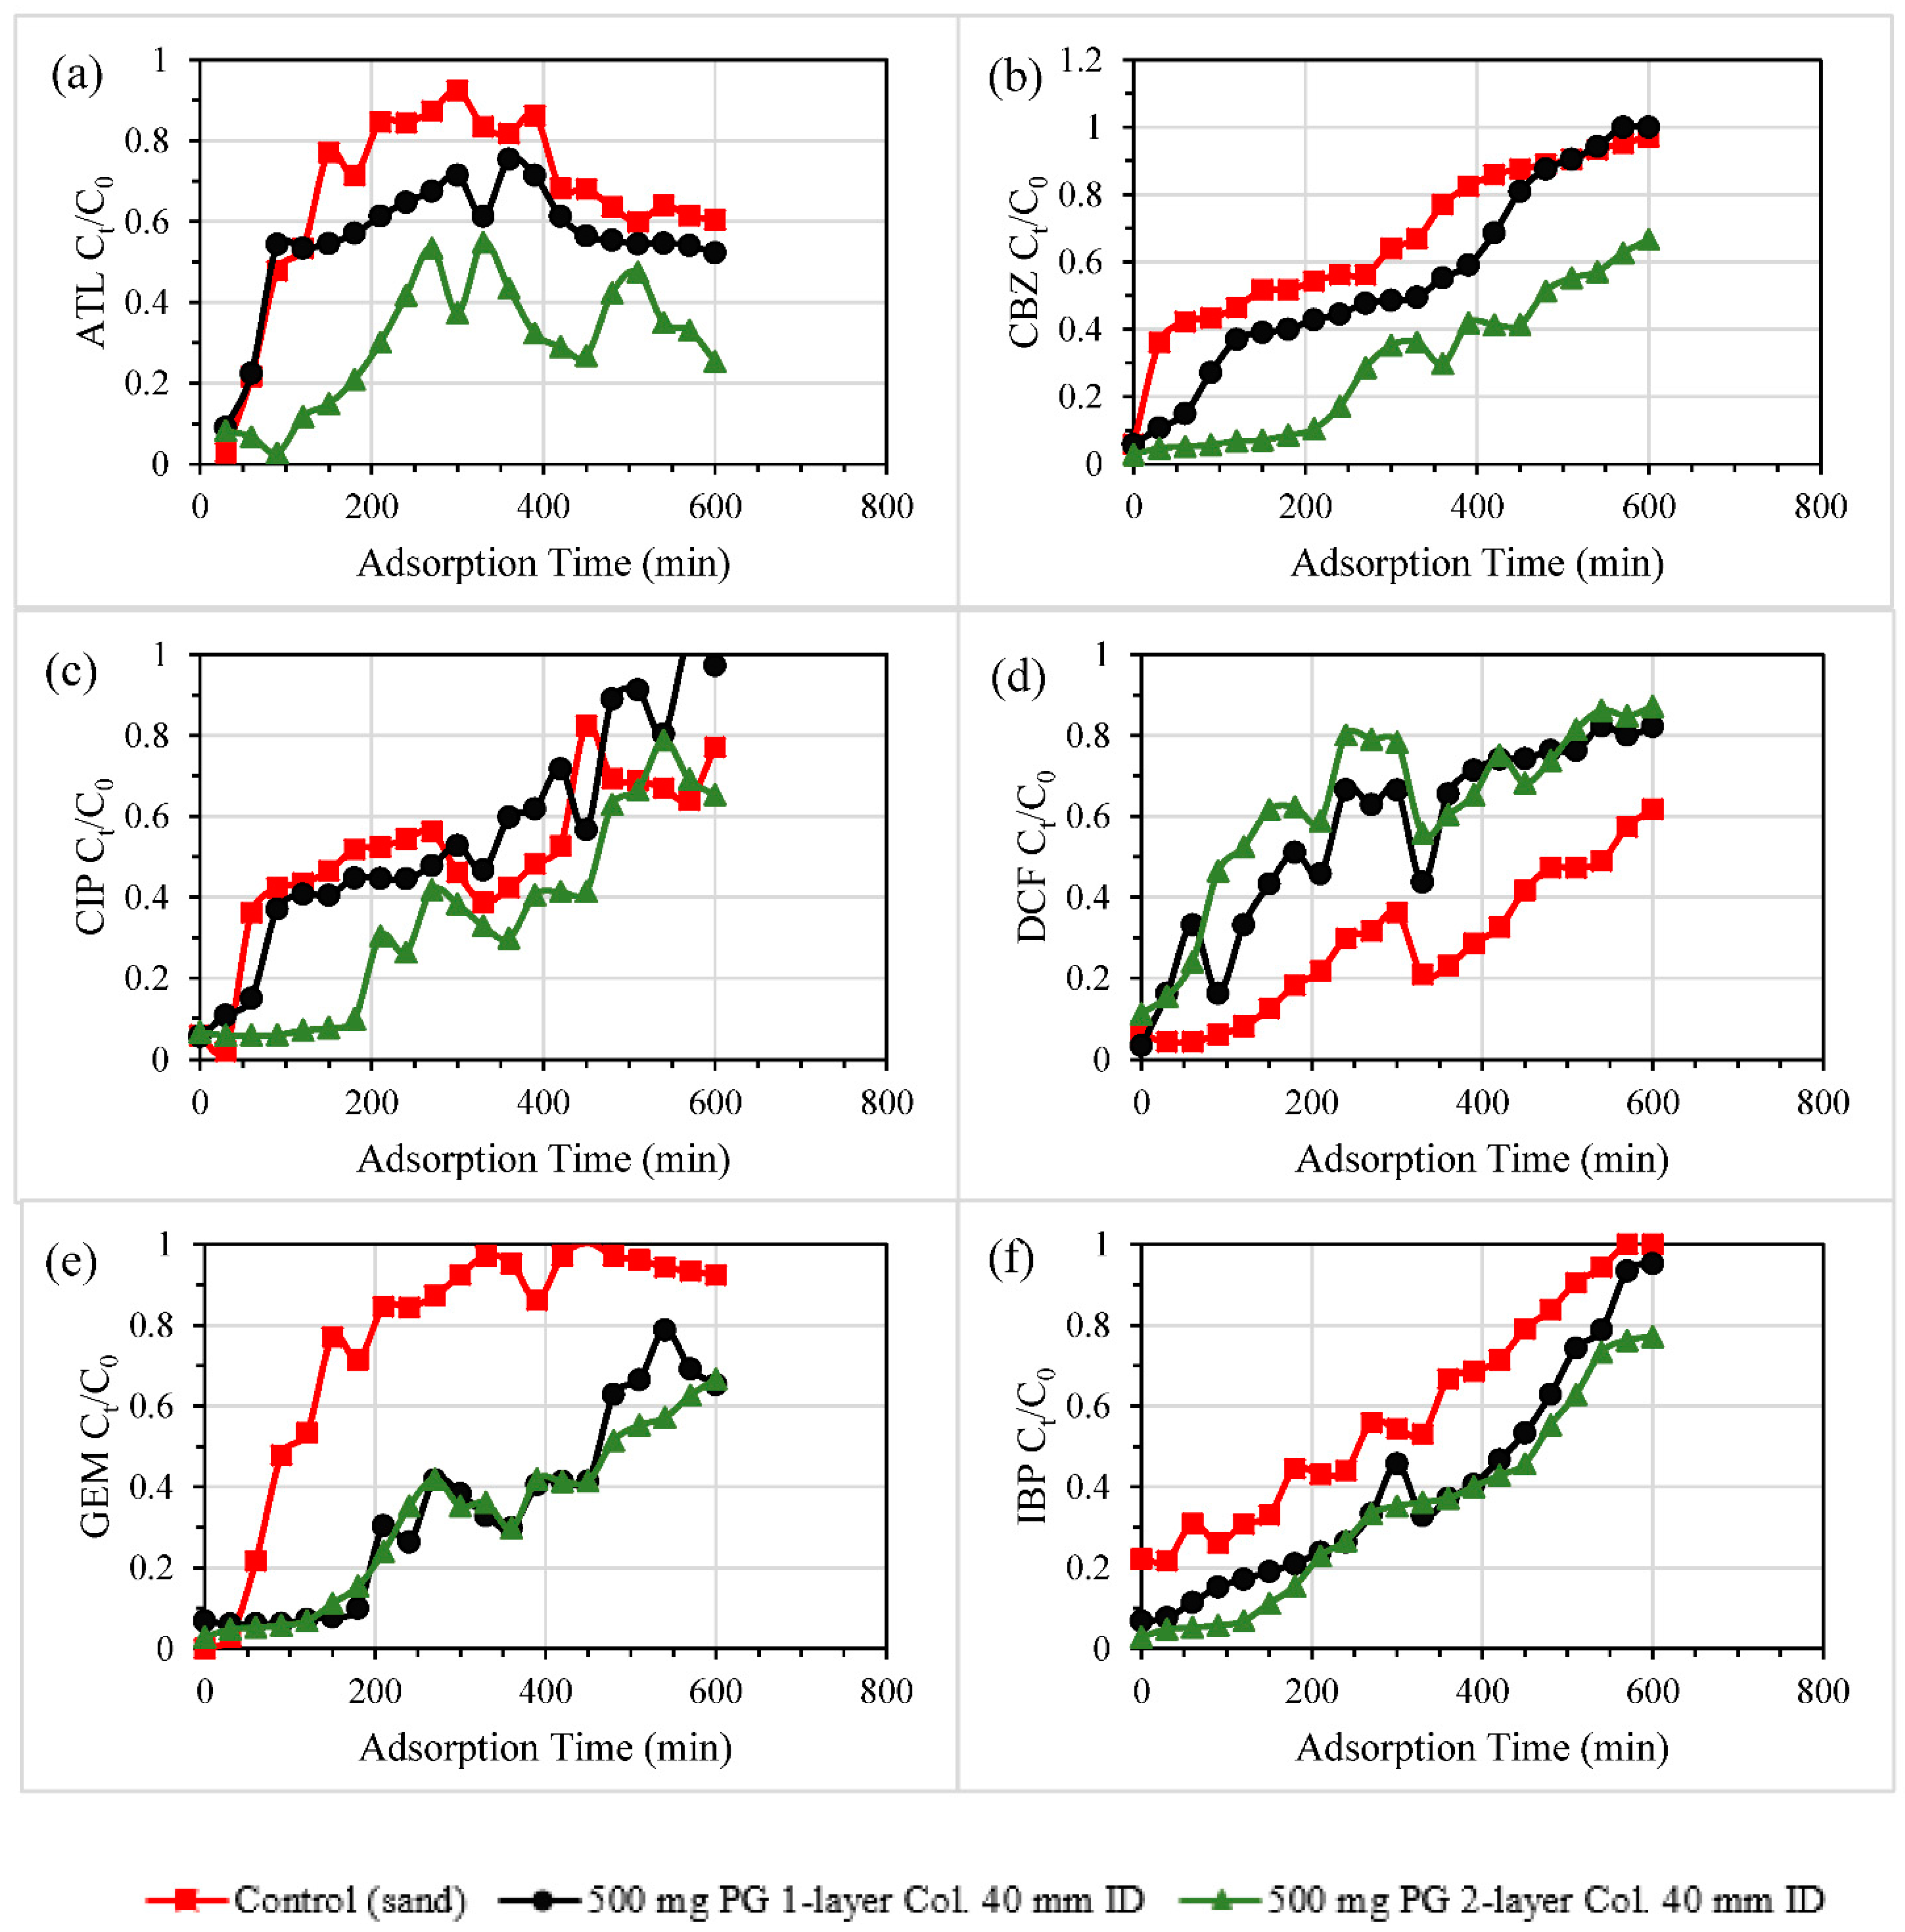
3.2. ECs Removal in PG-Sand Columns
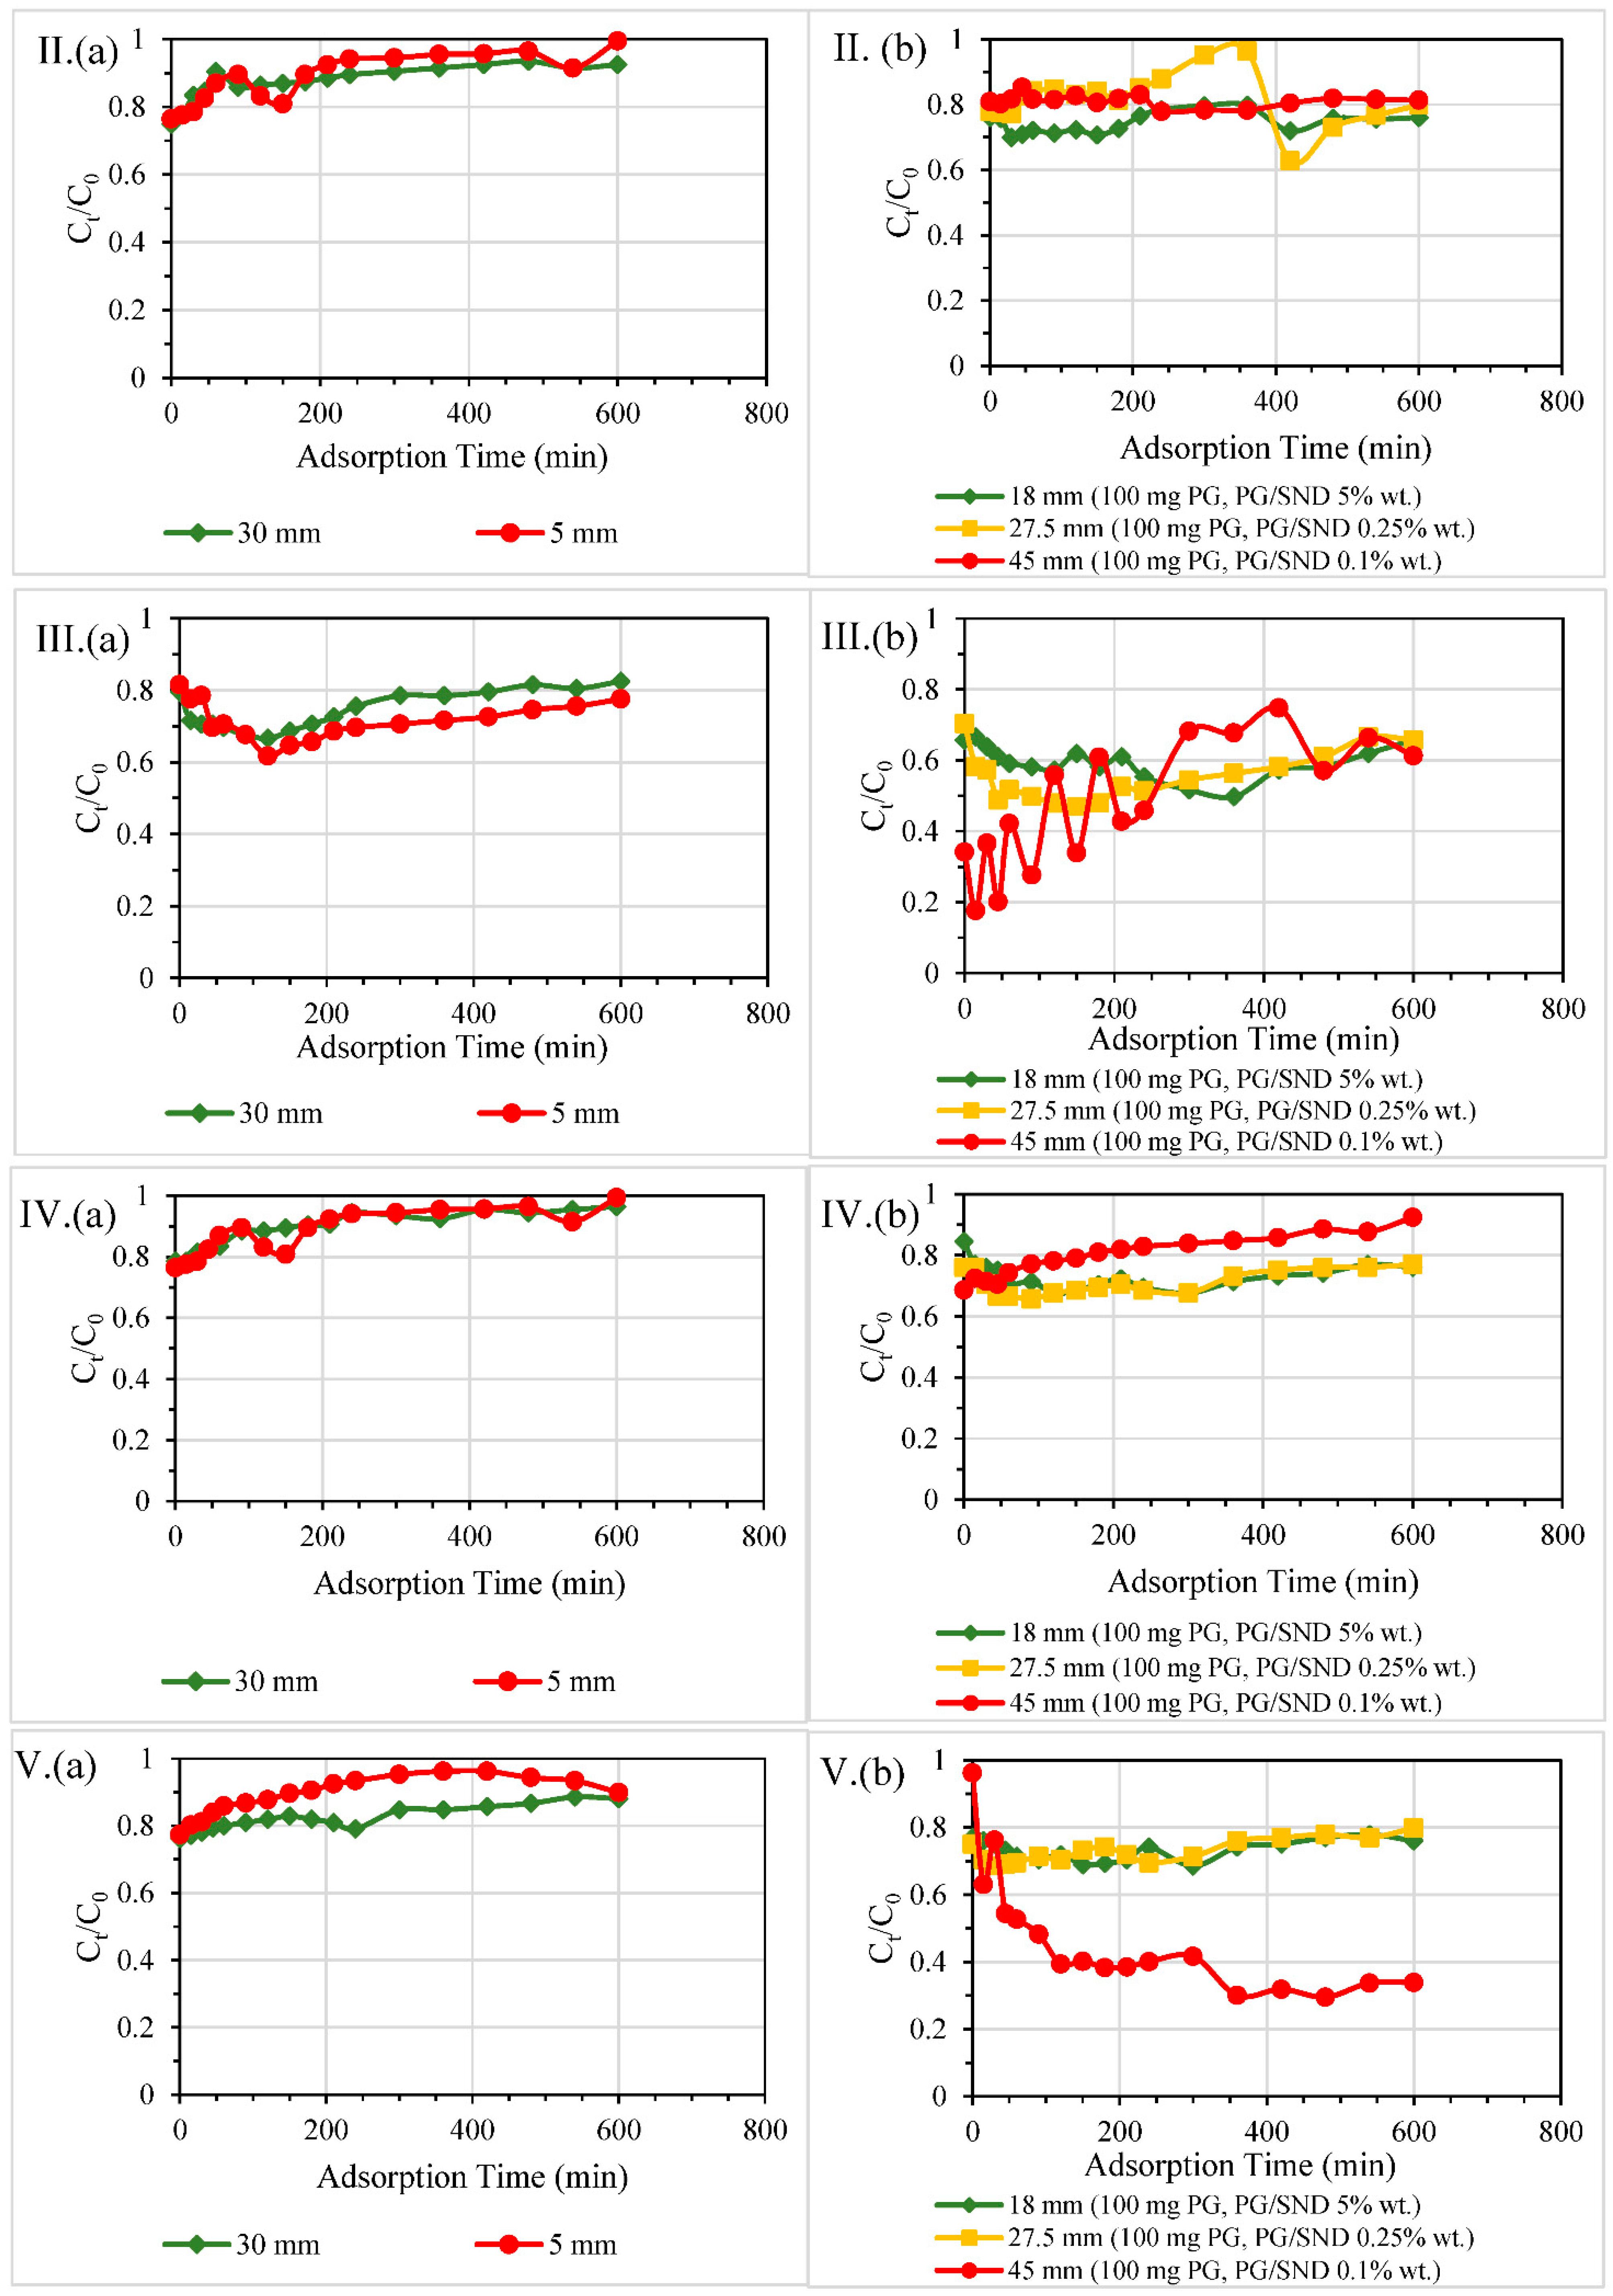
3.2.1. Single and Double-Layered Configurations
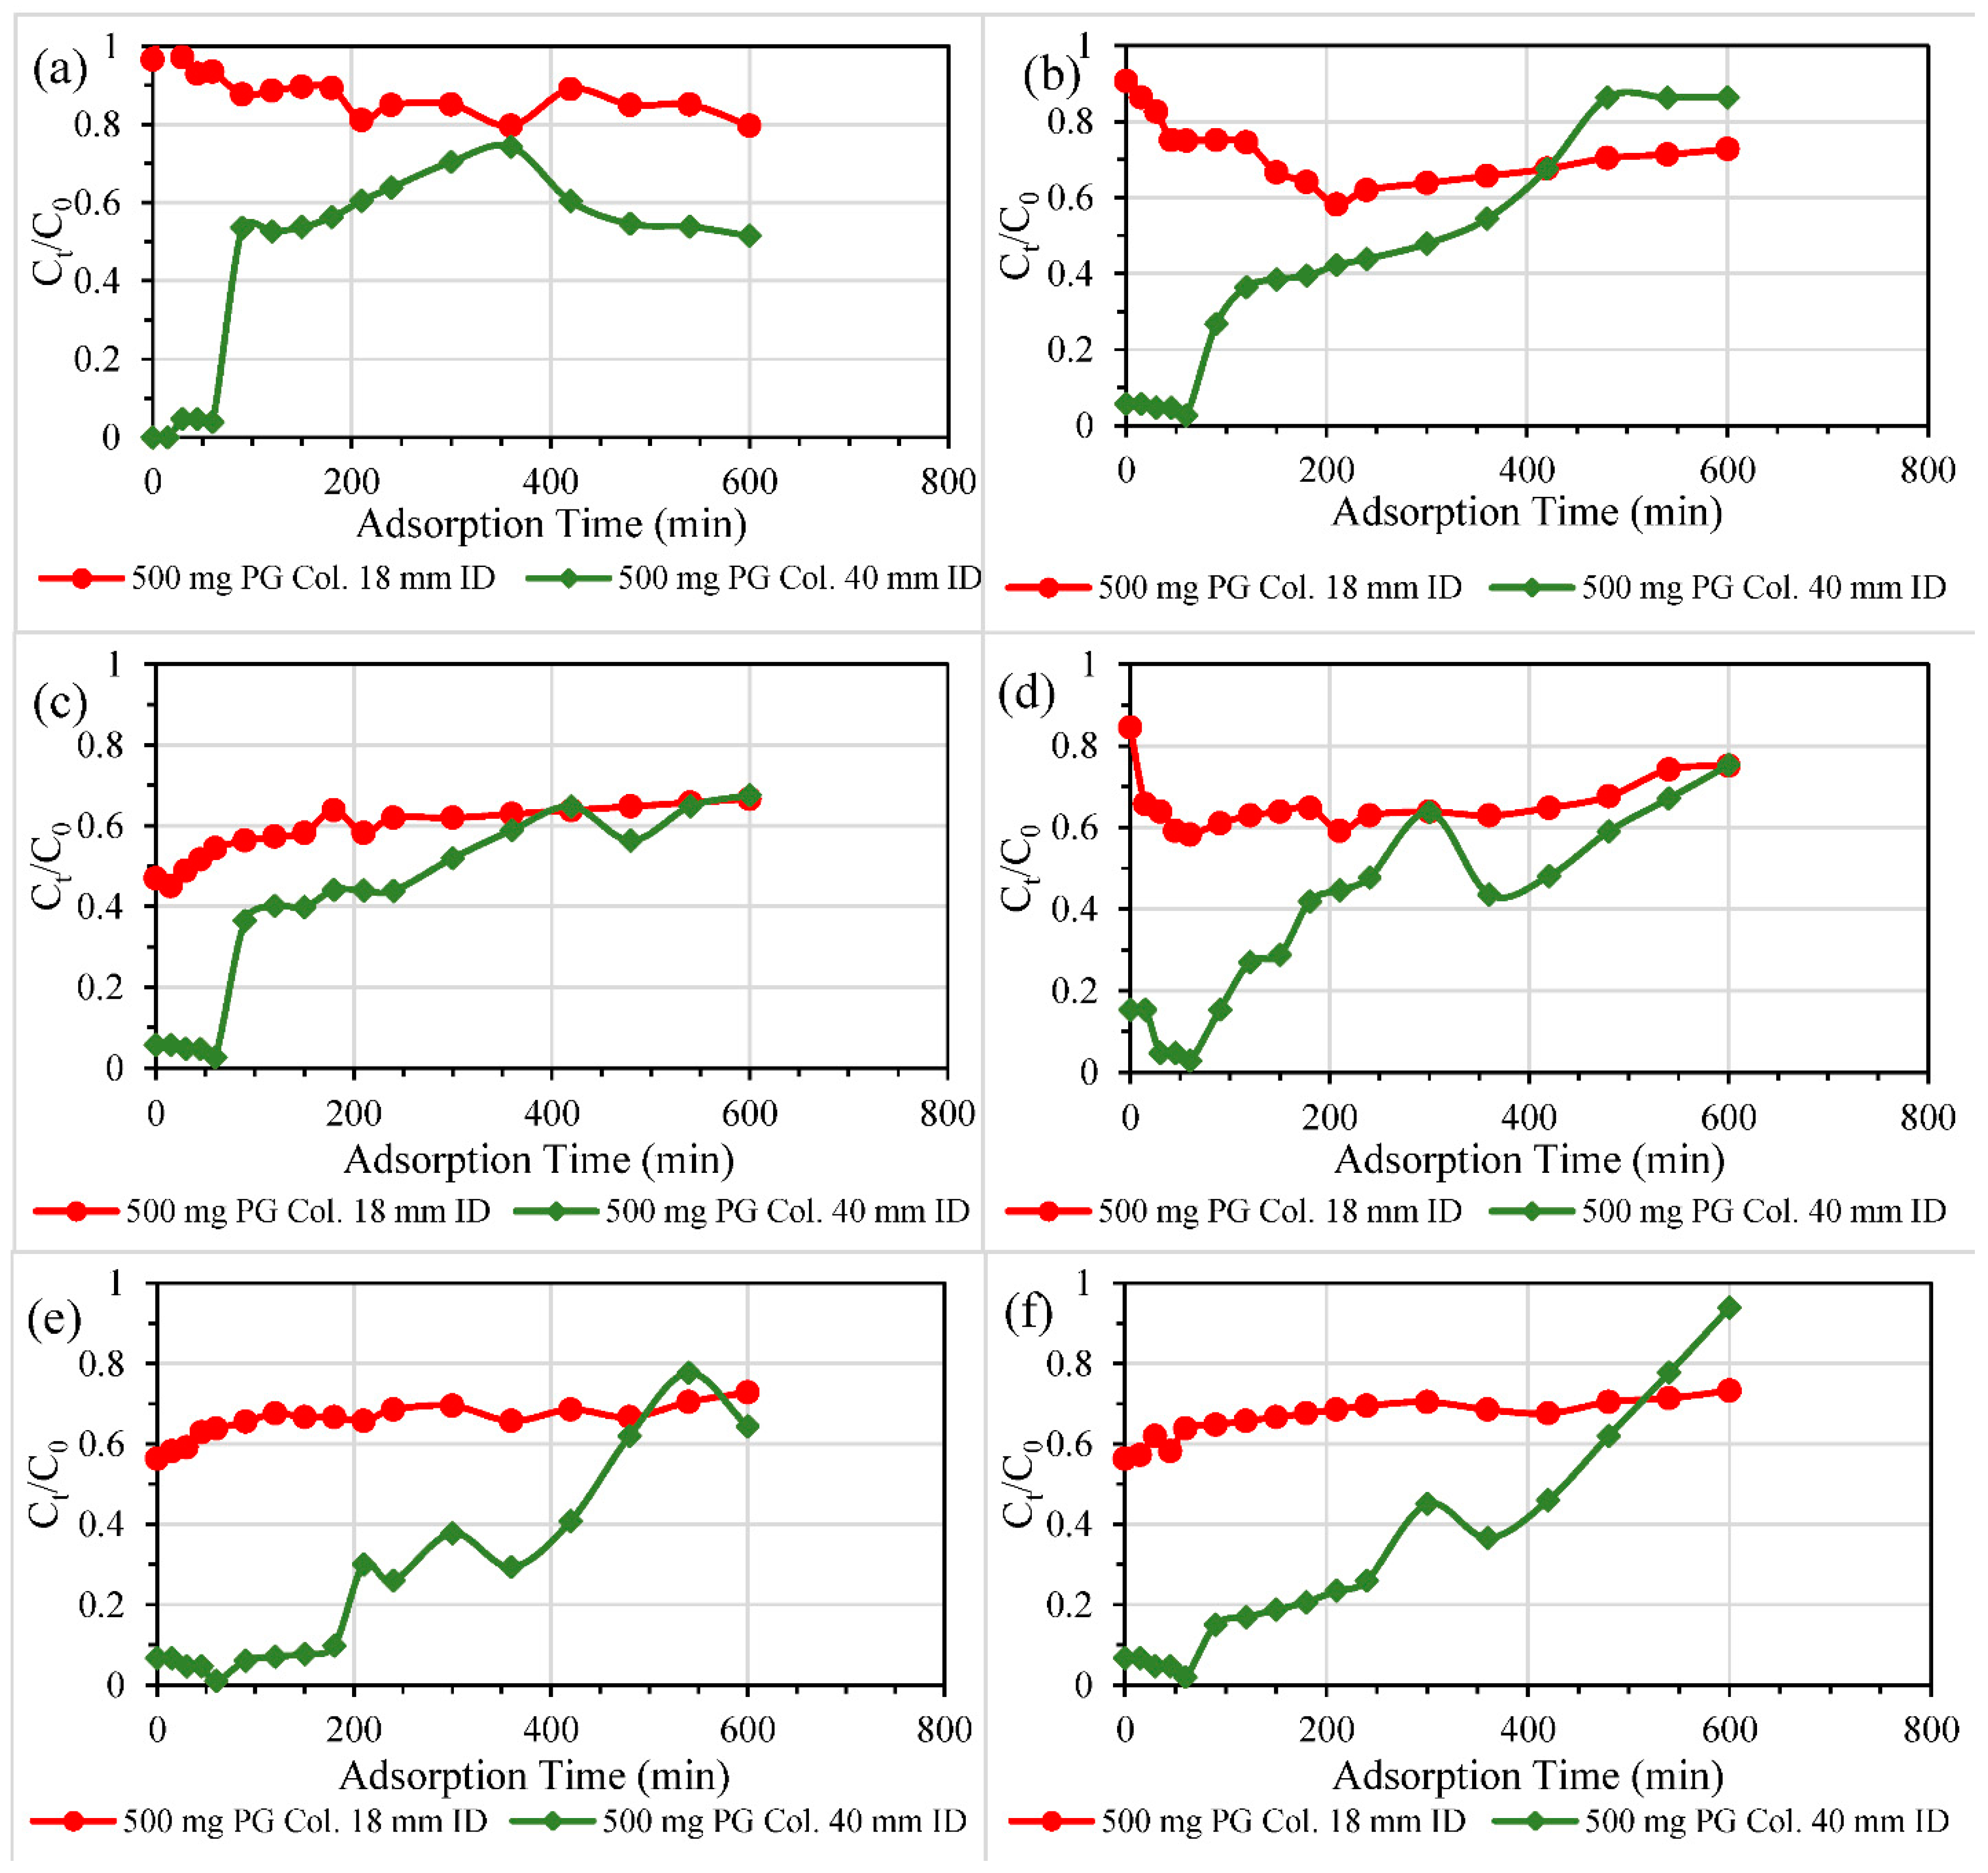
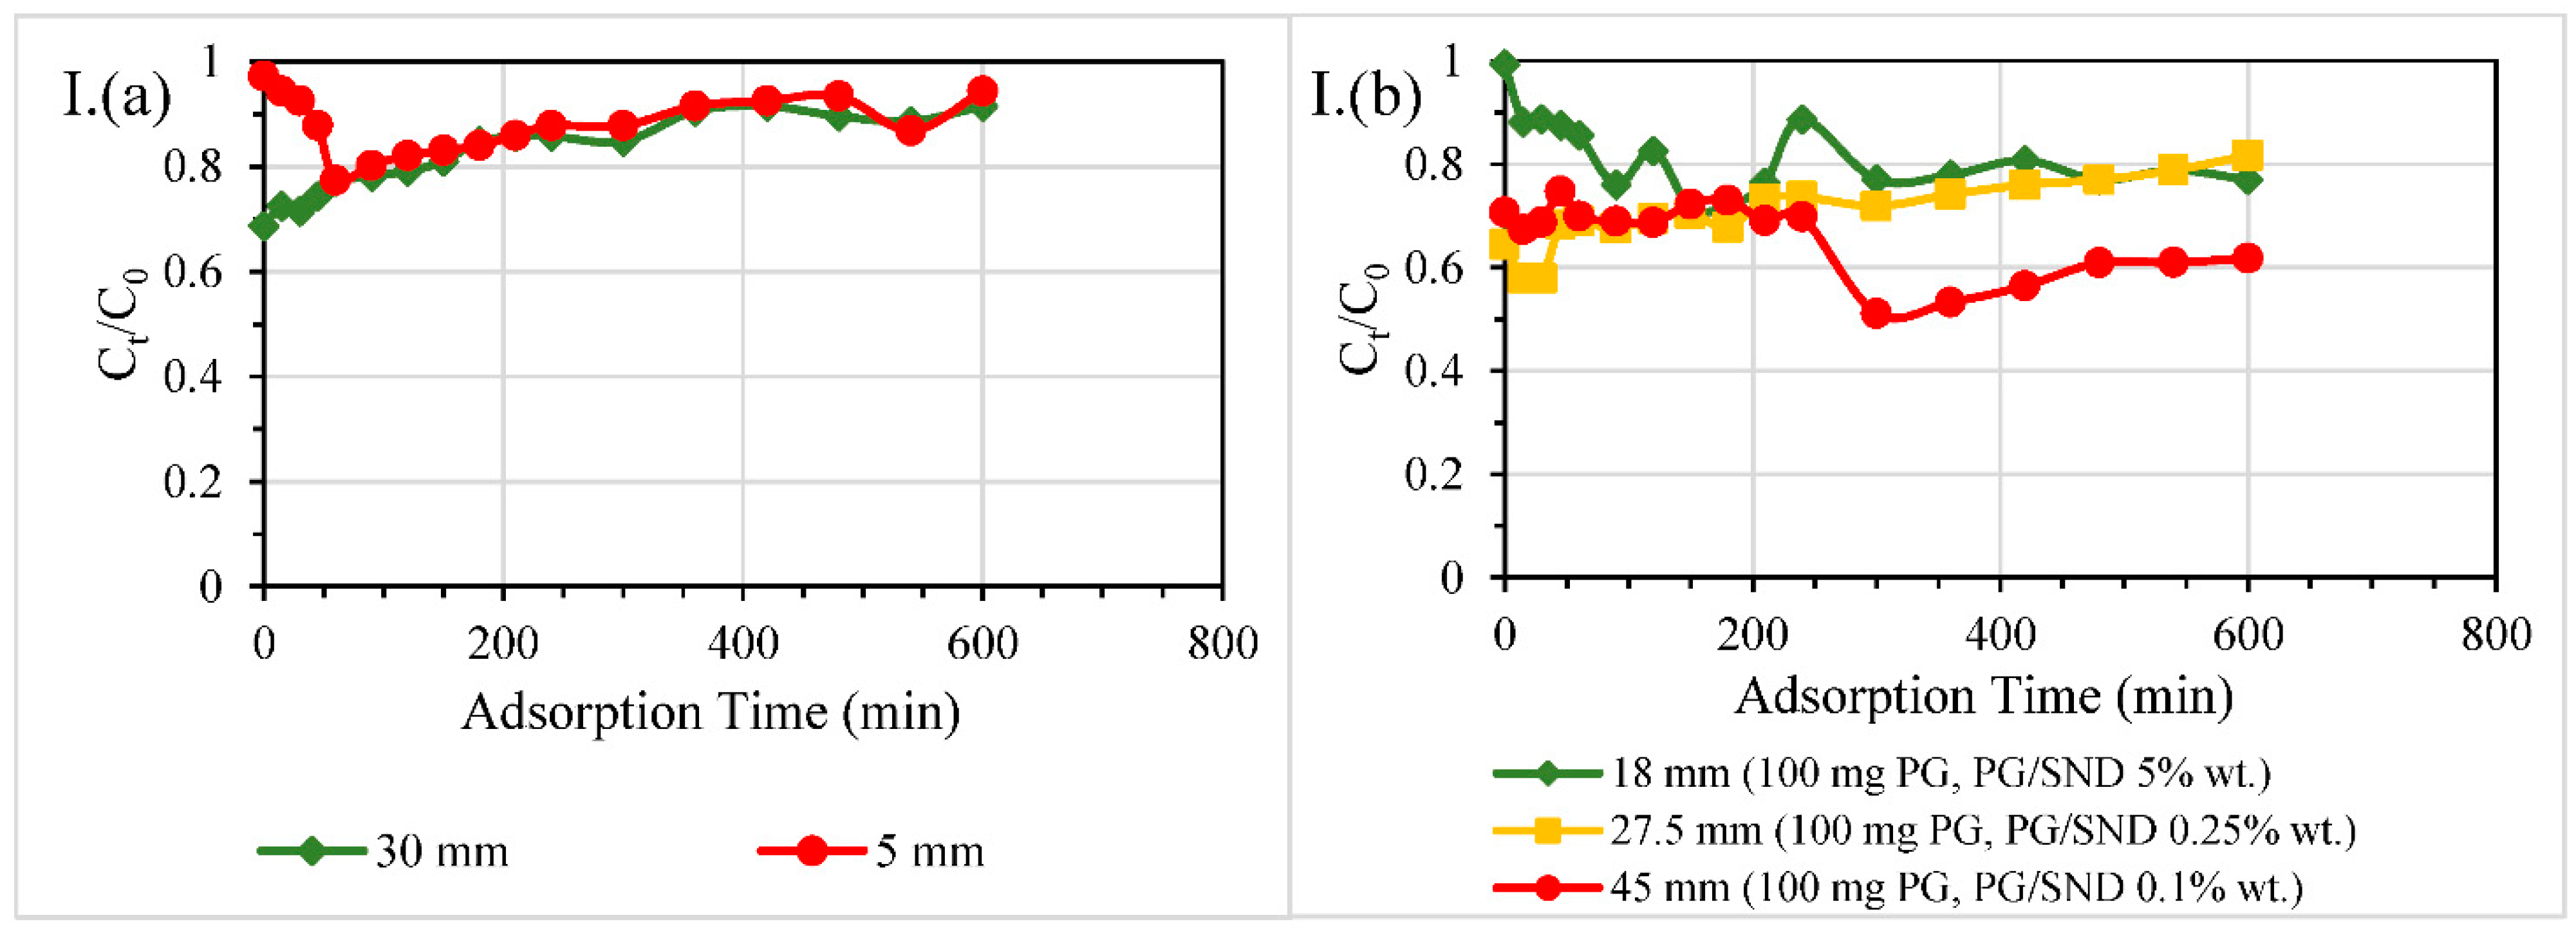
3.2.2. Size of Columns
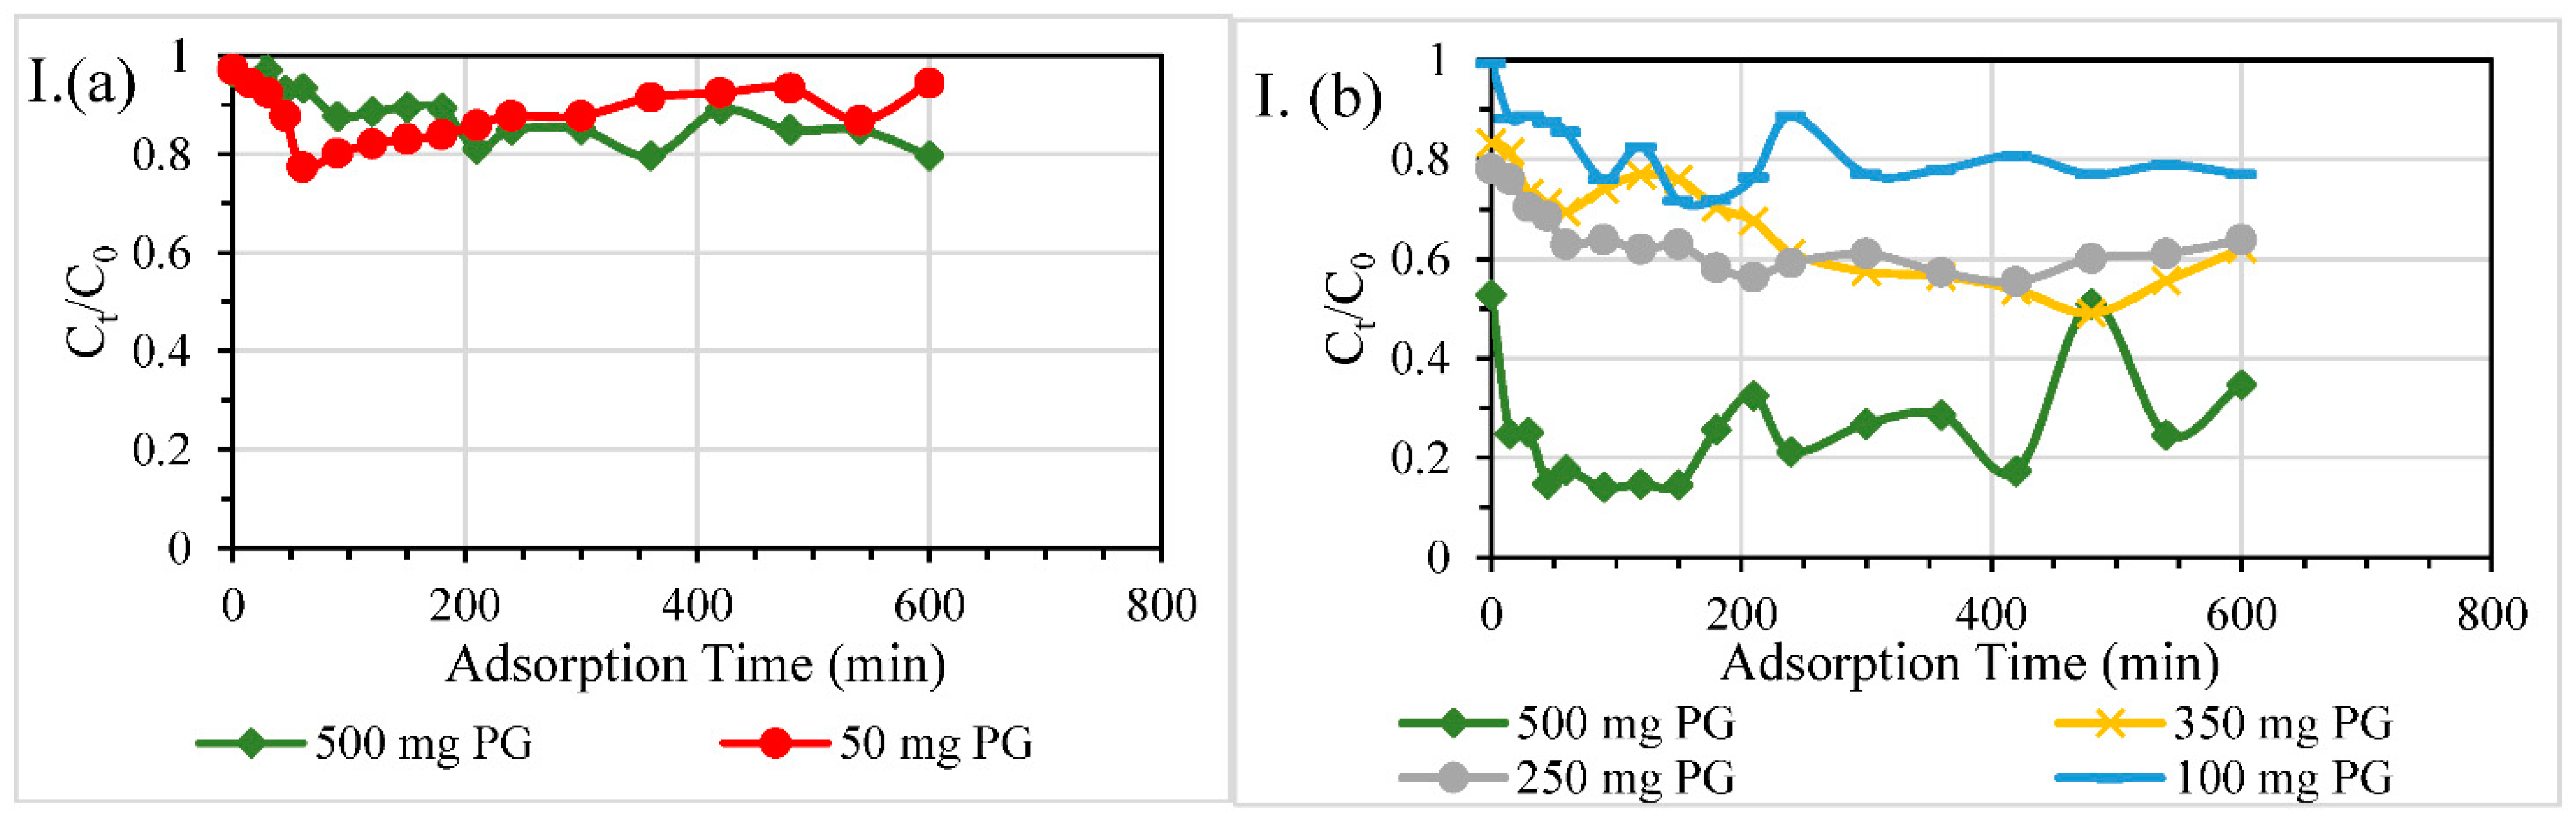
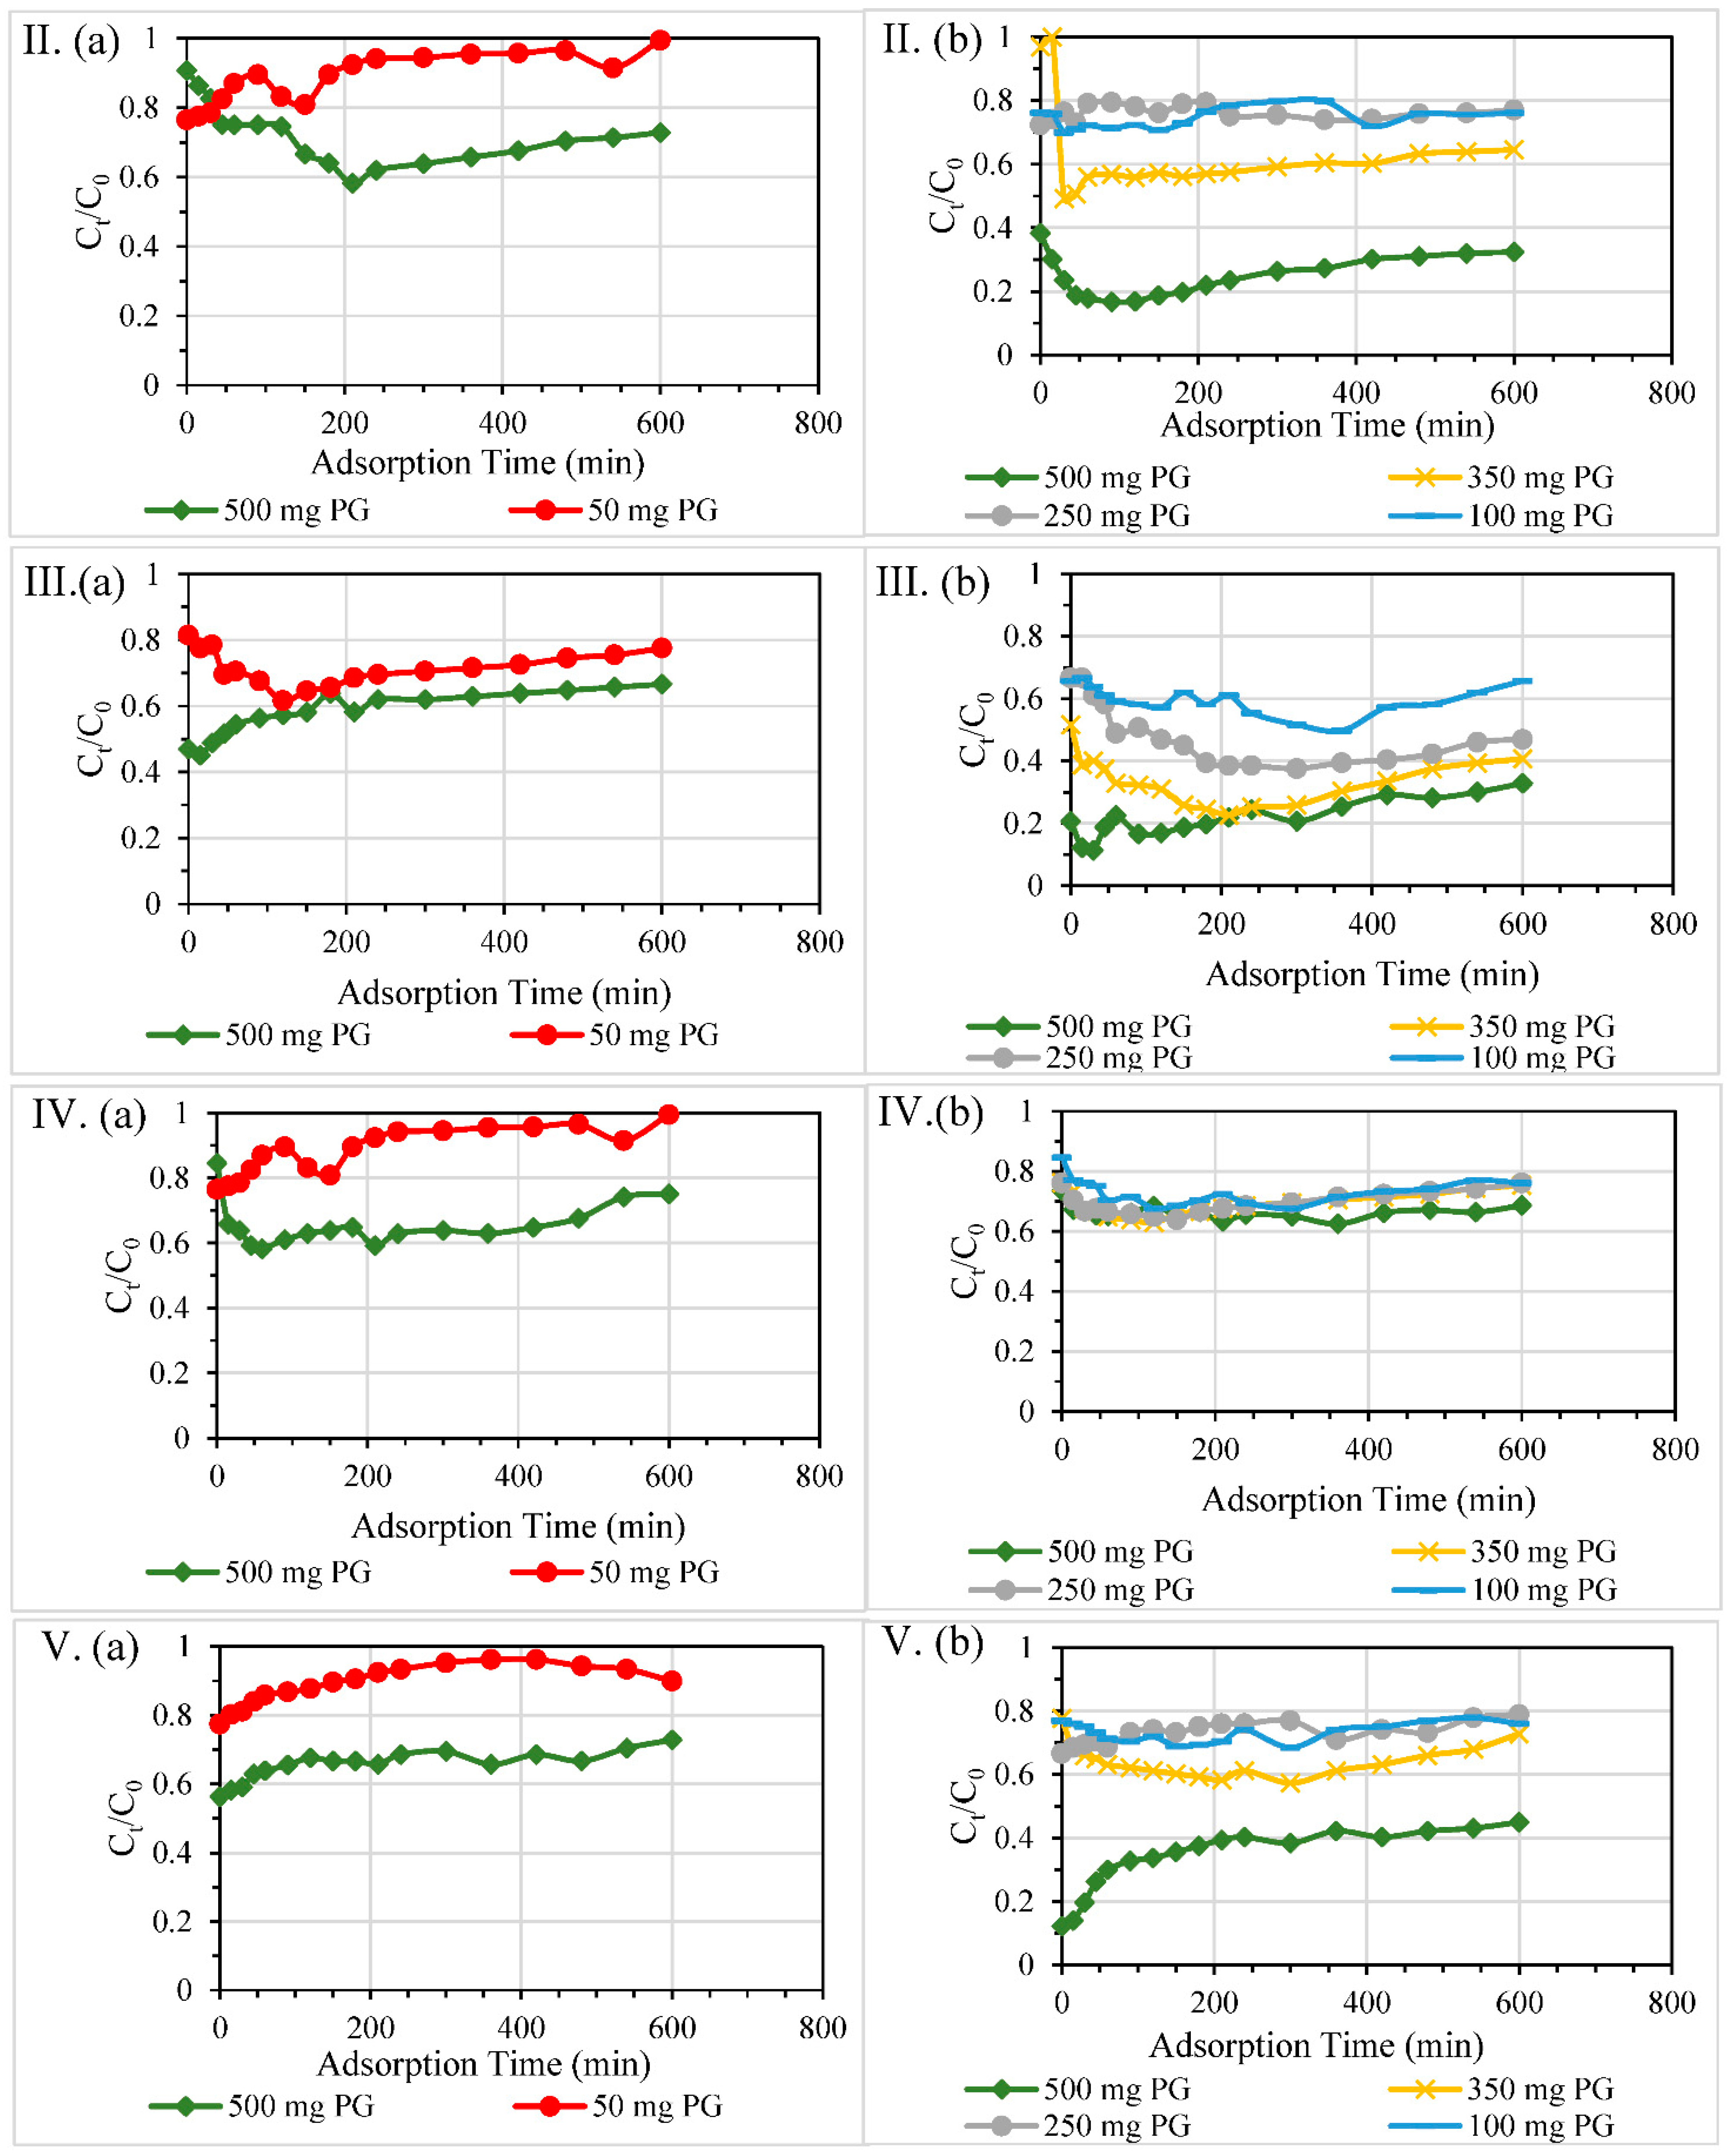
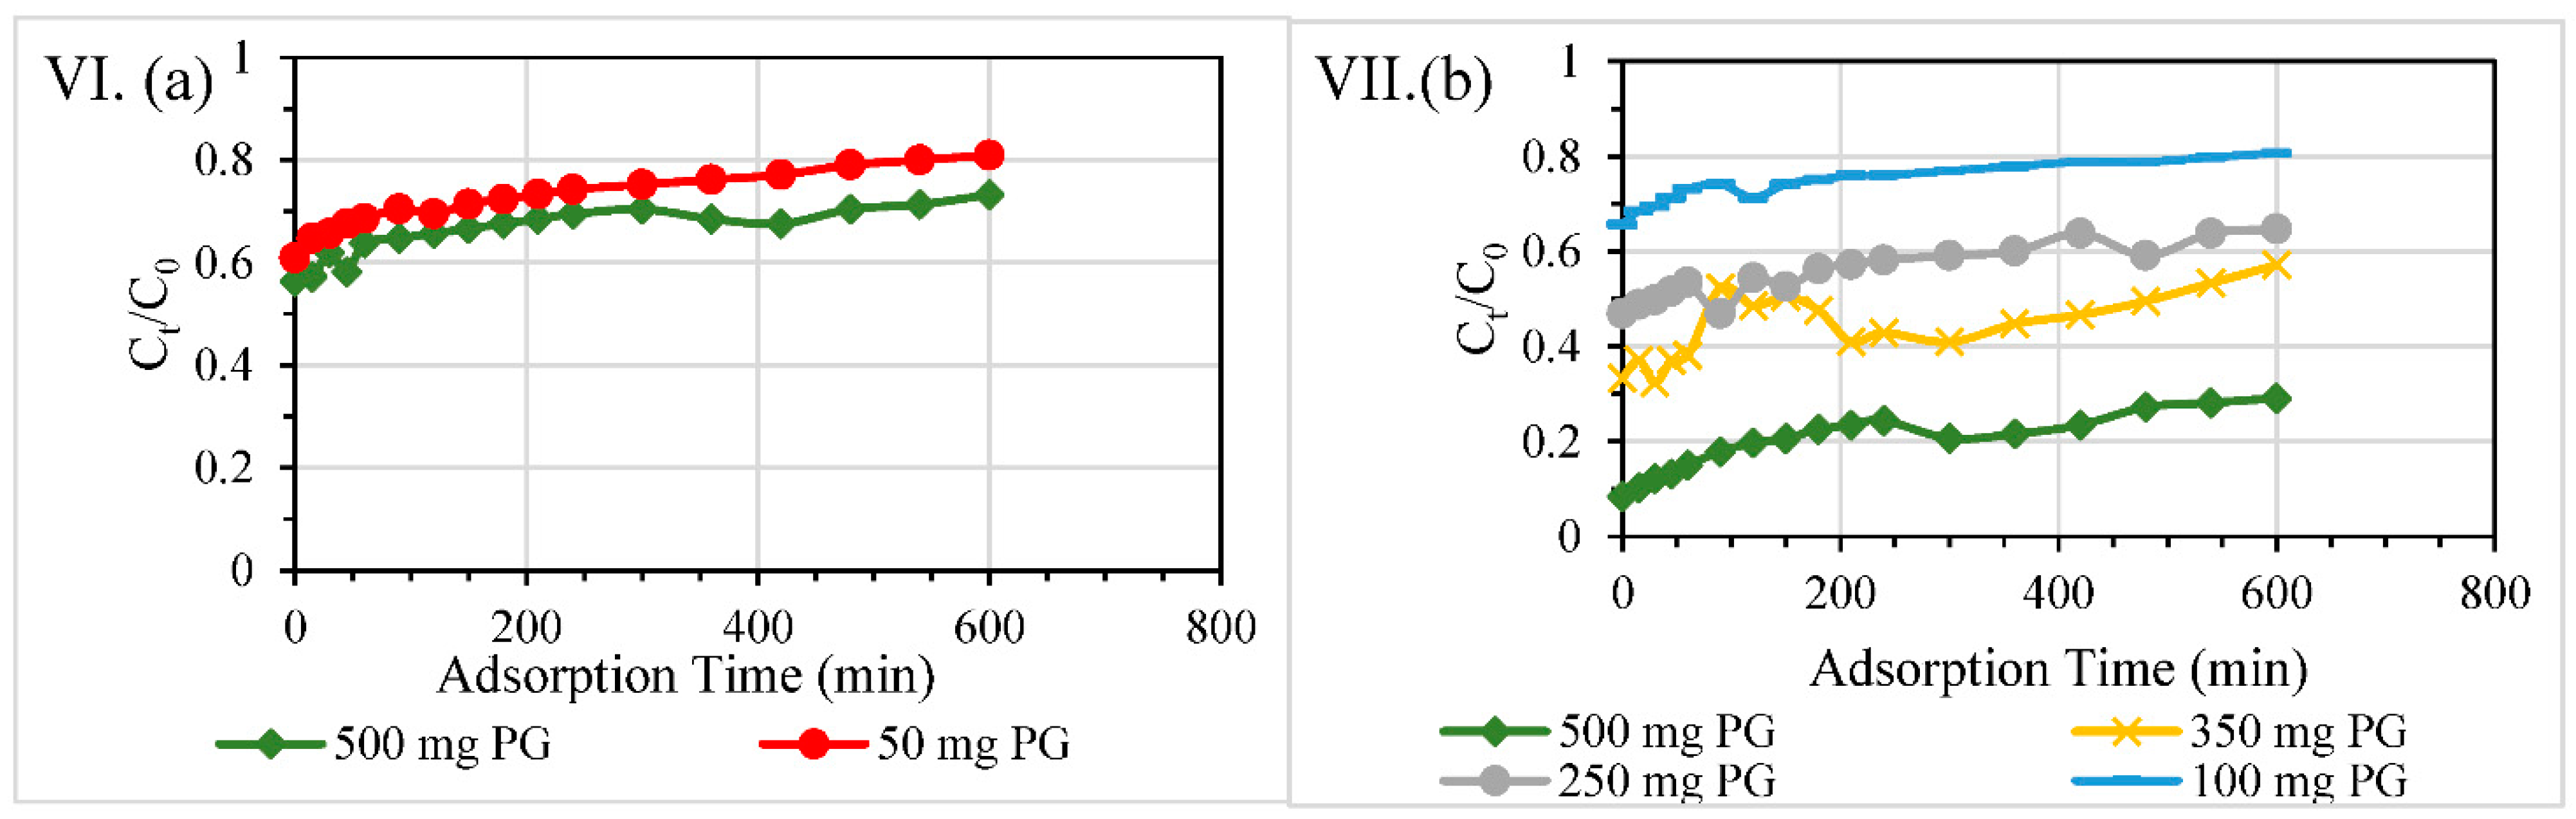
3.2.3. Dosage of PG
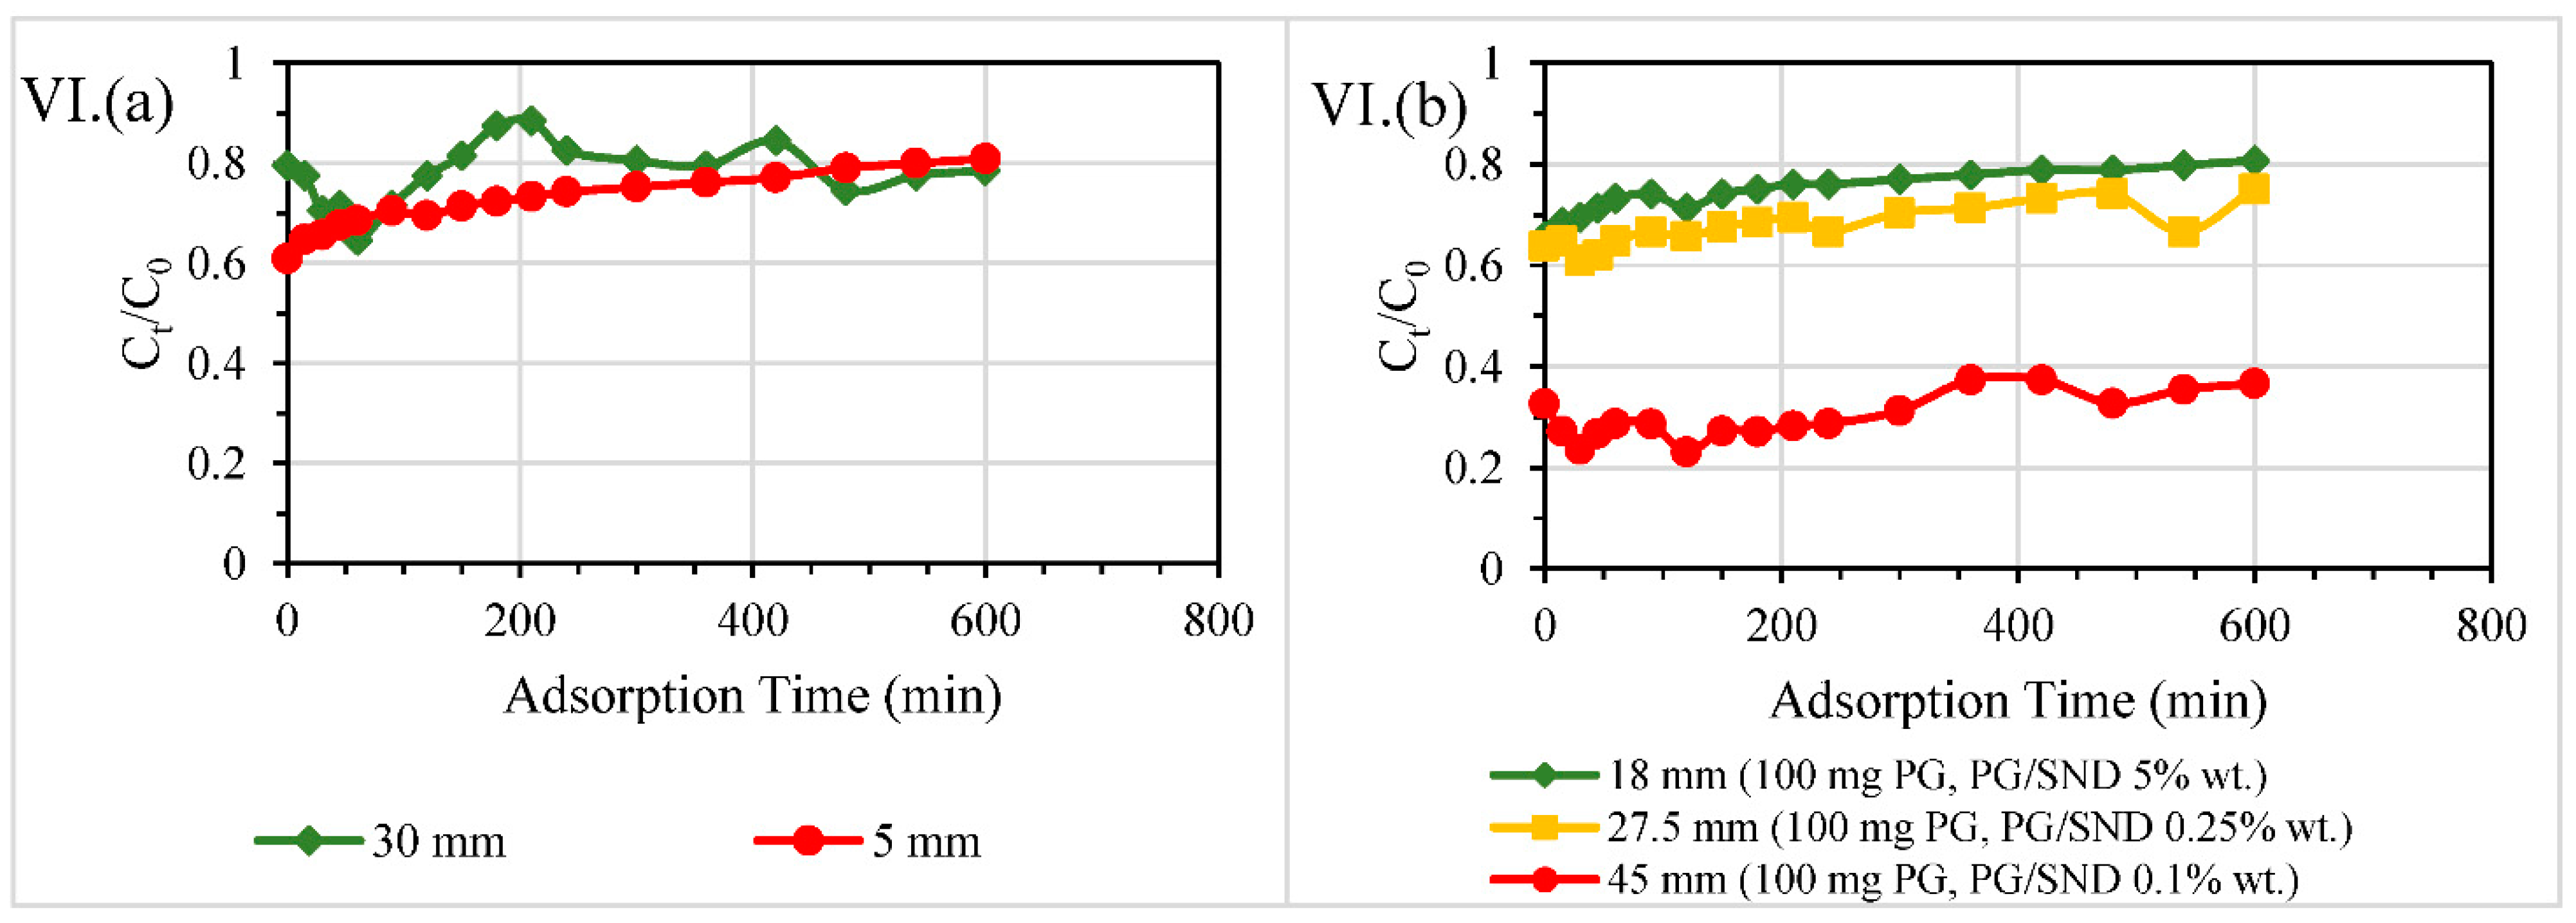
3.2.4. Different Reactive Bed Heights at Fixed PG Dosages
3.2.5. Overall Efficiencies of Column Filters
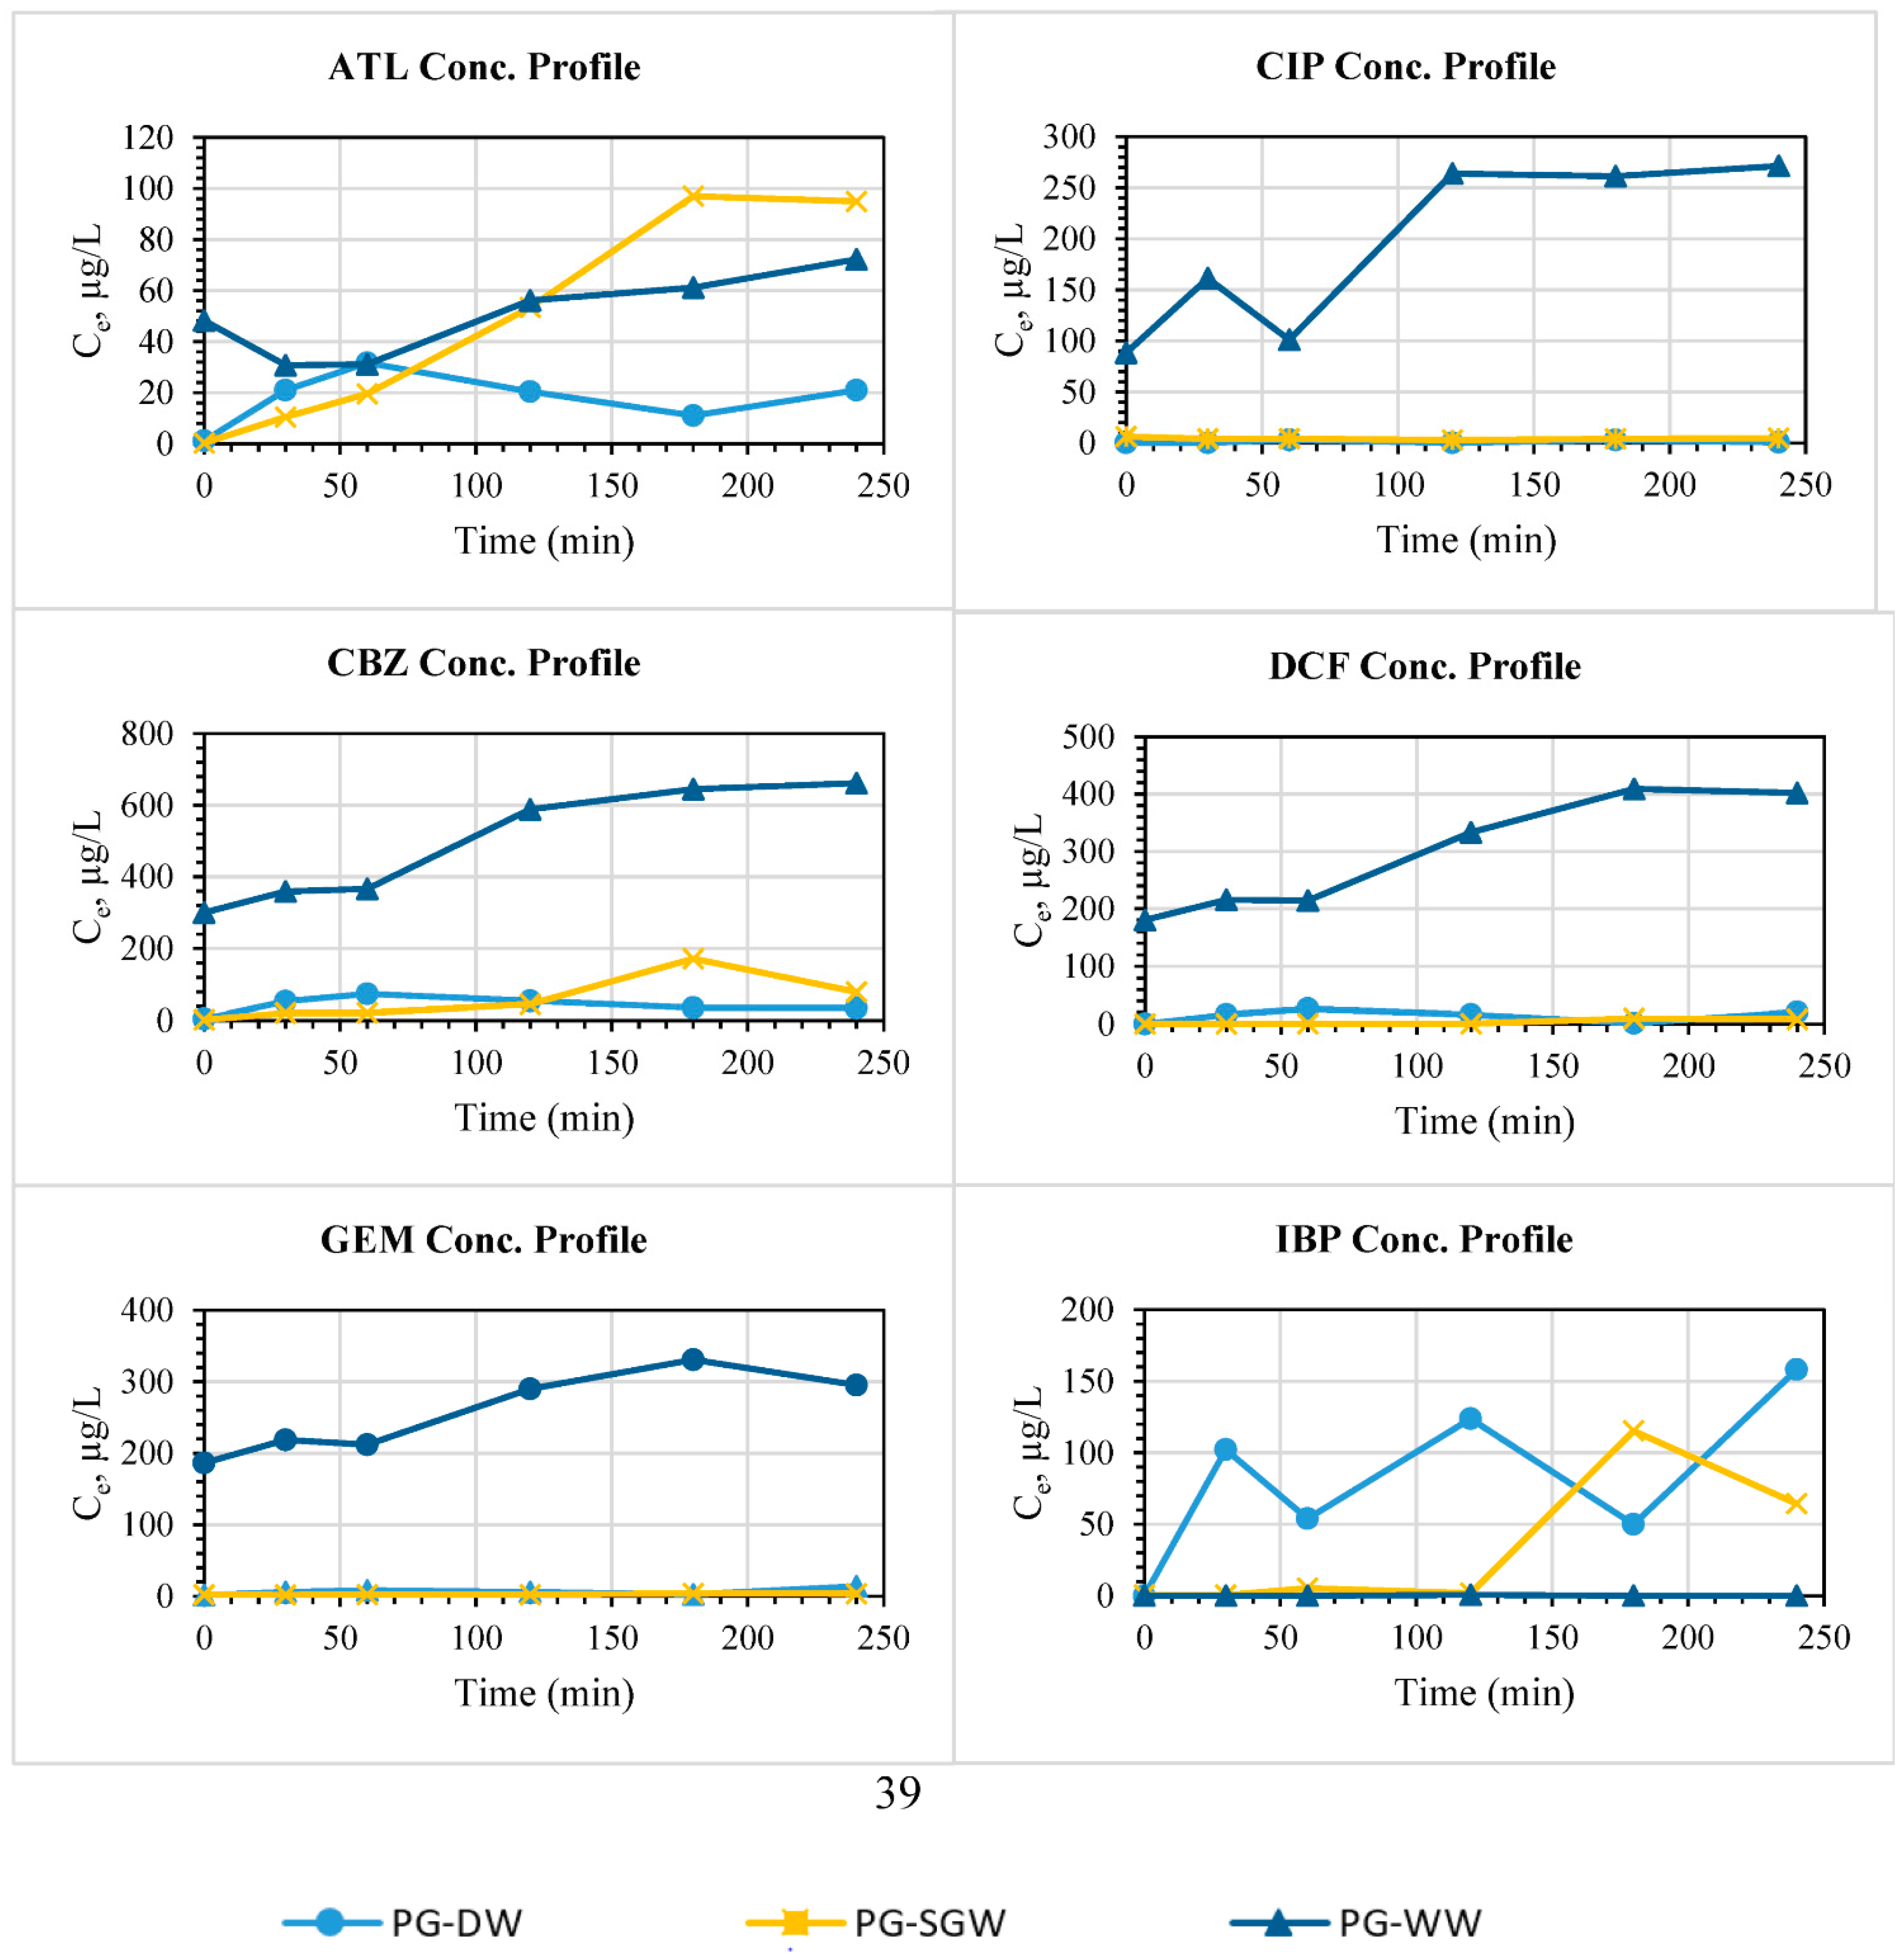
3.2.6. Real Samples and Interference Studies
4. Conclusions
Supplementary Materials
Author Contributions
Funding
Institutional Review Board Statement
Informed Consent Statement
Data Availability Statement
Acknowledgments
Conflicts of Interest
References
- Rehman, M.S.U.; Rashid, N.; Ashfaq, M.; Saif, A.; Ahmad, N.; Han, J.-I. Global risk of pharmaceutical contamination from highly populated developing countries. Chemosphere 2015, 138, 1045–1055. [Google Scholar] [CrossRef] [PubMed]
- Ok, Y.S.; Kim, S.-C.; Kim, K.-R.; Lee, S.S.; Moon, D.H.; Lim, K.J.; Sung, J.-K.; Hur, S.-O.; Yang, J.E. Monitoring of selected veterinary antibiotics in environmental compartments near a composting facility in Gangwon Province, Korea. Environ. Monit. Assess. 2011, 174, 693–701. [Google Scholar] [CrossRef] [PubMed]
- Sirés, I.; Brillas, E. Remediation of water pollution caused by pharmaceutical residues based on electrochemical separation and degradation technologies: A review. Environ. Int. 2012, 40, 212–229. [Google Scholar] [CrossRef] [PubMed]
- Jones, O.A.; Lester, J.N.; Voulvoulis, N. Pharmaceuticals: A threat to drinking water? Trends Biotechnol. 2005, 23, 163–167. [Google Scholar] [CrossRef]
- Safiullah, S.; Mohammad, G.; Sabur, M.; Howlader, B. Treatment of pharmaceutical effluent by photochemical oxidation on titanium dioxide. Asian J. Water Environ. Pollut. 2012, 9, 45–52. [Google Scholar]
- Azizullah, A.; Khattak, M.N.K.; Richter, P.; Häder, D.-P. Water pollution in Pakistan and its impact on public health—A review. Environ. Int. 2011, 37, 479–497. [Google Scholar] [CrossRef]
- Oaks, J.L.; Gilbert, M.; Virani, M.Z.; Watson, R.T.; Meteyer, C.U.; Rideout, B.A.; Shivaprasad, H.; Ahmed, S.; Chaudhry, M.J.I.; Arshad, M. Diclofenac residues as the cause of vulture population decline in Pakistan. Nature 2004, 427, 630–633. [Google Scholar] [CrossRef]
- Rivera-Utrilla, J.; Sánchez-Polo, M.; Ferro-García, M.Á.; Prados-Joya, G.; Ocampo-Pérez, R. Pharmaceuticals as emerging contaminants and their removal from water. A review. Chemosphere 2013, 93, 1268–1287. [Google Scholar] [CrossRef]
- Bridgeman, J. Public perception towards water recycling in California. Water Environ. J. 2004, 18, 150–154. [Google Scholar] [CrossRef]
- Teodosiu, C.; Gilca, A.-F.; Barjoveanu, G.; Fiore, S. Emerging pollutants removal through advanced drinking water treatment: A review on processes and environmental performances assessment. J. Clean. Prod. 2018, 197, 1210–1221. [Google Scholar] [CrossRef]
- Sophia, A.C.; Lima, E.C. Removal of emerging contaminants from the environment by adsorption. Ecotoxicol. Environ. Saf. 2018, 150, 1–17. [Google Scholar] [CrossRef] [PubMed]
- Betts, K.S. Technology solutions: Keeping drugs out of drinking water. Environ. Sci. Technol. 2002, 36, 377A–378A. [Google Scholar] [CrossRef] [PubMed][Green Version]
- Tauber, R. Quantitative Analysis of Pharmaceuticals in Drinking Water from Ten Canadian Cities; Enviro-Test Laboratories/Xenos Division: Ontario, Canada, 2003. [Google Scholar]
- Heberer, T. Tracking persistent pharmaceutical residues from municipal sewage to drinking water. J. Hydrol. 2002, 266, 175–189. [Google Scholar] [CrossRef]
- Kyzas, G.Z.; Koltsakidou, A.; Nanaki, S.G.; Bikiaris, D.N.; Lambropoulou, D.A. Removal of beta-blockers from aqueous media by adsorption onto graphene oxide. Sci. Total Environ. 2015, 537, 411–420. [Google Scholar] [CrossRef]
- Cai, N.; Larese-Casanova, P. Sorption of carbamazepine by commercial graphene oxides: A comparative study with granular activated carbon and multiwalled carbon nanotubes. J. Colloid Interface Sci. 2014, 426, 152–161. [Google Scholar] [CrossRef]
- Zhu, X.; Tsang, D.C.; Chen, F.; Li, S.; Yang, X. Ciprofloxacin adsorption on graphene and granular activated carbon: Kinetics, isotherms, and effects of solution chemistry. Environ. Technol. 2015, 36, 3094–3102. [Google Scholar] [CrossRef]
- Banerjee, P.; Das, P.; Zaman, A.; Das, P. Application of graphene oxide nanoplatelets for adsorption of ibuprofen from aqueous solutions: Evaluation of process kinetics and thermodynamics. Process. Saf. Environ. Prot. 2016, 101, 45–53. [Google Scholar] [CrossRef]
- Khalil, A.M.E.; Memon, F.A.; Tabish, T.A.; Salmon, D.; Zhang, S.; Butler, D. Nanostructured porous graphene for efficient removal of emerging contaminants (pharmaceuticals) from water. Chem. Eng. J. 2020, 398, 125440. [Google Scholar] [CrossRef]
- Tabish, T.A.; Memon, F.A.; Gomez, D.E.; Horsell, D.W.; Zhang, S. A facile synthesis of porous graphene for efficient water and wastewater treatment. Sci. Rep. 2018, 8, 1–14. [Google Scholar] [CrossRef]
- Rizzo, L.; Fiorentino, A.; Grassi, M.; Attanasio, D.; Guida, M. Advanced treatment of urban wastewater by sand filtration and graphene adsorption for wastewater reuse: Effect on a mixture of pharmaceuticals and toxicity. J. Environ. Chem. Eng. 2015, 3, 122–128. [Google Scholar] [CrossRef]
- Yuan, W.; Chen, J.; Shi, G. Nanoporous graphene materials. Mater. Today 2014, 17, 77–85. [Google Scholar] [CrossRef]
- Zhang, L.L.; Zhao, X.; Stoller, M.D.; Zhu, Y.; Ji, H.; Murali, S.; Wu, Y.; Perales, S.; Clevenger, B.; Ruoff, R.S. Highly conductive and porous activated reduced graphene oxide films for high-power supercapacitors. Nano Lett. 2012, 12, 1806–1812. [Google Scholar] [CrossRef] [PubMed]
- Dong, S.; Sun, Y.; Wu, J.; Wu, B.; Creamer, A.E.; Gao, B. Graphene oxide as filter media to remove levofloxacin and lead from aqueous solution. Chemosphere 2016, 150, 759–764. [Google Scholar] [CrossRef] [PubMed]
- Sheng, P.; Dong, Y.; Vochozka, M. Analysis of cost-effective methods to reduce industrial wastewater emissions in China. Water 2020, 12, 1600. [Google Scholar] [CrossRef]
- Abed, S.N.; Scholz, M. Chemical simulation of greywater. Environ. Technol. 2016, 37, 1631–1646. [Google Scholar] [CrossRef] [PubMed]
- Goebel, K.; Rolim, C.M.B. Validation of UV spectrophotometric and HPLC methods for quantitative determination of atenolol in pharmaceutical preparations. Lat. Am. J. Pharm 2007, 26, 765–770. [Google Scholar]
- Zadbuke, N.; Shahi, S.; Jadhav, A.; Borde, S. Development and validation of UV-visible spectroscopic method for estimation of carbamazepine in bulk and tablet dosage form. Int. J. Pharm. Pharm. Sci. 2016, 8, 234–238. [Google Scholar]
- Cazedey, E.C.L.; Salgado, H.R.N. Spectrophotometric determination of ciprofloxacin hydrochloride in ophthalmic solution. Adv. Anal. Chem. 2012, 2, 74–79. [Google Scholar] [CrossRef]
- Jauris, I.; Matos, C.; Saucier, C.; Lima, E.; Zarbin, A.; Fagan, S.; Machado, F.; Zanella, I. Adsorption of sodium diclofenac on graphene: A combined experimental and theoretical study. Phys. Chem. Chem. Phys. 2016, 18, 1526–1536. [Google Scholar] [CrossRef]
- Parikh Vikas, C.; Karkhanis, V. Spectrophotometric estimation of gemfibrozil in bulk and pharmaceutical dosage forms. Int. Res. J. Pharm. 2011, 2, 106–109. [Google Scholar]
- Wang, G.; Shen, X.; Yao, J.; Park, J. Graphene nanosheets for enhanced lithium storage in lithium ion batteries. Carbon 2009, 47, 2049–2053. [Google Scholar] [CrossRef]
- Reinhold, C.; Fischer, E.; Peterlin, A. Evaluation of small-angle X-ray scattering of polymers. J. Appl. Phys. 1964, 35, 71–74. [Google Scholar] [CrossRef]
- Kumar, N.; Das, S.; Bernhard, C.; Varma, G. Effect of graphene oxide doping on superconducting properties of bulk MgB2. Supercond. Sci. Technol. 2013, 26, 095008. [Google Scholar]
- Liu, T.; Li, Y.; Du, Q.; Sun, J.; Jiao, Y.; Yang, G.; Wang, Z.; Xia, Y.; Zhang, W.; Wang, K.; et al. Adsorption of methylene blue from aqueous solution by graphene. Colloids Surf. B Biointerfaces 2012, 90, 197–203. [Google Scholar] [CrossRef] [PubMed]
- Fan, Z.; Zhao, Q.; Li, T.; Yan, J.; Ren, Y.; Feng, J.; Wei, T. Easy synthesis of porous graphene nanosheets and their use in supercapacitors. Carbon 2012, 50, 1699–1703. [Google Scholar] [CrossRef]
- Zhang, M.; Bao, W.X.; Liu, X.L.; Yu, B.Z.; Ren, Z.Y.; Bai, J.T.; Fan, H.M. Large-scale synthesis of porous graphene through nanoscale carbothermal reduction etching. J. Mater. Sci. 2015, 50, 7875–7883. [Google Scholar] [CrossRef]
- Zhang, Y.; Wan, Q.; Yang, N. Recent advances of porous graphene: Synthesis, functionalization, and electrochemical applications. Small 2019, 15, 1903780. [Google Scholar] [CrossRef]
- Ferrari, A.C. Raman spectroscopy of graphene and graphite: Disorder, electron—Phonon coupling, doping and nonadiabatic effects. Solid State Commun. 2007, 143, 47–57. [Google Scholar] [CrossRef]
- Shubair, T.; Eljamal, O.; Khalil, A.M.; Matsunaga, N. Multilayer system of nanoscale zero valent iron and Nano-Fe/Cu particles for nitrate removal in porous media. Sep. Purif. Technol. 2018, 193, 242–254. [Google Scholar] [CrossRef]
- Maamoun, I.; Eljamal, O.; Khalil, A.M.E.; Sugihara, Y.; Matsunaga, N. Phosphate removal through nano-zero-valent iron permeable reactive barrier; column experiment and reactive solute transport modeling. Transp. Porous Media 2018, 125, 395–412. [Google Scholar] [CrossRef]
- Khalil, A.M.; Eljamal, O.; Amen, T.W.; Sugihara, Y.; Matsunaga, N. Scrutiny of interference effect of ions and organic matters on water treatment using supported nanoscale zero-valent iron. Environ. Earth Sci. 2018, 77, 489. [Google Scholar] [CrossRef]
- Tabish, T.A. Graphene-based materials: The missing piece in nanomedicine? Biochem. Biophys. Res. Commun. 2018, 504, 686–689. [Google Scholar] [CrossRef] [PubMed]


| Contaminant | Test | Diameter of Column, mm | Material Dosage | Packing Height, mm | HRT through Reactive Layer, min | Overall Removal Efficiency % |
|---|---|---|---|---|---|---|
| ATL | Different cross sectional areas | 18 | 500 mg PG | 25 | 11.45 | 64.32 |
| 40 | 500 mg PG | 5 | 11.31 | 82.80 | ||
| Different PG doses | 18 | 500 mg PG | 25 | 11.45 | 64.32 | |
| 18 | 50 mg PG | 10 | 4.58 | 67.455 | ||
| 40 | 500 mg PG (PG/SND 0.5% wt.) | 45 | 47.50 | 90.08 | ||
| 40 | 100 mg PG (PG/SND 0.5% wt.) | 18 | 19.00 | 67.58 | ||
| 40 | 250 mg PG (PG/SND 0.5% wt.) | 27.5 | 29.03 | 74.85 | ||
| 40 | 350 mg PG (PG/SND 0.5% wt.) | 30 | 31.67 | 73.34 | ||
| Different packing heights at constant dosage | 18 | 50 mg PG (PG/SND 0.25% wt.) | 30 | 6.41 | 69.00 | |
| 18 | 50 mg PG | 10 | 4.58 | 67.46 | ||
| 40 | 100 mg PG (PG/SND 0.5% wt.) | 18 | 19.00 | 67.58 | ||
| 40 | 100 mg PG (PG/SND 0.25% wt.) | 27.5 | 29.03 | 71.85 | ||
| 40 | 100 mg PG (PG/SND 0.1% wt.) | 45 | 47.50 | 73.71 |
| Contaminant | Test | Diameter of Column, mm | Material Dosage | Packing Height, mm | HRT through Reactive Layer, min | Overall Removal Efficiency % |
|---|---|---|---|---|---|---|
| CBZ | Different cross sectional area | 18 | 500 mg PG | 25 | 11.45 | 71.50 |
| 40 | 500 mg PG | 5 | 11.31 | 85.20 | ||
| Different PG doses | 18 | 500 mg PG | 25 | 11.45 | 71.50 | |
| 18 | 50 mg PG | 10 | 4.58 | 64.92 | ||
| 40 | 500 mg PG (PG/SND 0.5% wt.) | 45 | 47.50 | 90.27 | ||
| 40 | 100 mg PG (PG/SND 0.5% wt.) | 18 | 19.00 | 70.27 | ||
| 40 | 250 mg PG (PG/SND 0.5% wt.) | 27.5 | 29.03 | 69.53 | ||
| 40 | 350 mg PG (PG/SND 0.5% wt.) | 30 | 31.67 | 75.42 | ||
| Different packing heights at constant dosage | 18 | 50 mg PG (PG/SND 0.25% wt.) | 30 | 6.41 | 67.03 | |
| 18 | 50 mg PG | 10 | 4.58 | 64.92 | ||
| 40 | 100 mg PG (PG/SND 0.5% wt.) | 18 | 19.00 | 70.27 | ||
| 40 | 100 mg PG (PG/SND 0.25% wt.) | 27.5 | 29.03 | 67.25 | ||
| 40 | 100 mg PG (PG/SND 0.1% wt.) | 45 | 47.50 | 67.56 |
| Contaminant | Test | Diameter of Column, mm | Material Dosage | Packing Height, mm | HRT through Reactive Layer, min | Overall Removal Efficiency % |
|---|---|---|---|---|---|---|
| CIP | Different cross sectional area | 18 | 500 mg PG | 25 | 11.45 | 76.71 |
| 40 | 500 mg PG | 5 | 11.31 | 85.85 | ||
| Different PG doses | 18 | 500 mg PG | 25 | 11.45 | 76.71 | |
| 18 | 50 mg PG | 10 | 4.58 | 70.42 | ||
| 40 | 500 mg PG (PG/SND 0.5% wt.) | 45 | 47.50 | 91.42 | ||
| 40 | 100 mg PG (PG/SND 0.5% wt.) | 18 | 19.00 | 76.32 | ||
| 40 | 250 mg PG (PG/SND 0.5% wt.) | 27.5 | 29.03 | 81.10 | ||
| 40 | 350 mg PG (PG/SND 0.5% wt.) | 30 | 31.67 | 86.93 | ||
| Different packing heights at constant dosage | 18 | 50 mg PG (PG/SND 0.25% wt.) | 30 | 6.41 | 72.18 | |
| 18 | 50 mg PG | 10 | 4.58 | 70.42 | ||
| 40 | 100 mg PG (PG/SND 0.5% wt.) | 18 | 19.00 | 76.32 | ||
| 40 | 100 mg PG (PG/SND 0.25% wt.) | 27.5 | 29.03 | 78.08 | ||
| 40 | 100 mg PG (PG/SND 0.1% wt.) | 45 | 47.50 | 80.86 |
| Contaminant | Test | Diameter of Column, mm | Material Dosage | Packing Height, mm | HRT through Reactive Layer, min | Overall Removal Efficiency % |
|---|---|---|---|---|---|---|
| IBP | Different cross sectional area | 18 | 500 mg PG | 25 | 11.45 | 73.58 |
| 40 | 500 mg PG | 5 | 11.31 | 89.73 | ||
| Different PG doses | 18 | 500 mg PG | 25 | 11.45 | 73.56 | |
| 18 | 50 mg PG | 10 | 4.58 | 70.08 | ||
| 40 | 500 mg PG (PG/SND 0.5% wt.) | 45 | 47.50 | 92.02 | ||
| 40 | 100 mg PG (PG/SND 0.5% wt.) | 18 | 19.00 | 70.13 | ||
| 40 | 250 mg PG (PG/SND 0.5% wt.) | 27.5 | 29.03 | 77.72 | ||
| 40 | 350 mg PG (PG/SND 0.5% wt.) | 30 | 31.67 | 82.30 | ||
| Different packing heights at constant dosage | 18 | 50 mg PG (PG/SND 0.25% wt.) | 30 | 6.41 | 70.56 | |
| 18 | 50 mg PG | 10 | 4.58 | 70.08 | ||
| 40 | 100 mg PG (PG/SND 0.5% wt.) | 18 | 19.00 | 70.13 | ||
| 40 | 100 mg PG (PG/SND 0.25% wt.) | 27.5 | 29.03 | 72.94 | ||
| 40 | 100 mg PG (PG/SND 0.1% wt.) | 45 | 47.50 | 88.05 |
| Contaminant | Test | Diameter of Column, mm | Material Dosage | Packing Height, mm | HRT through Reactive Layer, min | Overall Removal Efficiency % |
|---|---|---|---|---|---|---|
| DCF | Different cross sectional area | 18 | 500 mg PG | 25 | 11.45 | 74.14 |
| 40 | 500 mg PG | 5 | 11.31 | 87.04 | ||
| Different PG doses | 18 | 500 mg PG | 25 | 11.45 | 74.14 | |
| 18 | 50 mg PG | 50 | 4.58 | 64.33 | ||
| 40 | 500 mg PG (PG/SND 0.5% wt.) | 45 | 47.50 | 73.57 | ||
| 40 | 100 mg PG (PG/SND 0.5% wt.) | 18 | 19.00 | 70.96 | ||
| 40 | 250 mg PG (PG/SND 0.5% wt.) | 27.5 | 29.03 | 72.38 | ||
| 40 | 350 mg PG (PG/SND 0.5% wt.) | 30 | 31.67 | 72.46 | ||
| Different packing heights at constant dosage | 18 | 50 mg PG (PG/SND 0.25% wt.) | 30 | 6.41 | 66.40 | |
| 18 | 50 mg PG | 50 | 4.58 | 64.33 | ||
| 40 | 100 mg PG (PG/SND 0.5% wt.) | 18 | 19.00 | 70.96 | ||
| 40 | 100 mg PG (PG/SND 0.25% wt.) | 27.5 | 29.03 | 71.64 | ||
| 40 | 100 mg PG (PG/SND 0.1% wt.) | 45 | 47.50 | 68.01 |
| Contaminant | Test | Diameter of Column, mm | Material Dosage | Packing Height, mm | HRT through Reactive Layer, min | Overall Removal Efficiency % |
|---|---|---|---|---|---|---|
| GEM | Different cross sectional area | 18 | 500 mg PG | 25 | 11.45 | 73.75 |
| 40 | 500 mg PG | 5 | 11.31 | 91.14 | ||
| Different PG doses | 18 | 500 mg PG | 25 | 11.45 | 73.75 | |
| 18 | 50 mg PG | 10 | 4.58 | 67.44 | ||
| 40 | 500 mg PG (PG/SND 0.5% wt.) | 45 | 47.50 | 86.38 | ||
| 40 | 100 mg PG (PG/SND 0.5% wt.) | 18 | 19.00 | 70.75 | ||
| 40 | 250 mg PG (PG/SND 0.5% wt.) | 27.5 | 29.03 | 70.74 | ||
| 40 | 350 mg PG (PG/SND 0.5% wt.) | 30 | 31.67 | 74.62 | ||
| Different packing heights at constant dosage | 18 | 50 mg PG (PG/SND 0.25% wt.) | 30 | 6.41 | 69.11 | |
| 18 | 50 mg PG | 10 | 4.58 | 67.44 | ||
| 40 | 100 mg PG (PG/SND 0.5% wt.) | 18 | 19.00 | 70.75 | ||
| 40 | 100 mg PG (PG/SND 0.25% wt.) | 27.5 | 29.03 | 70.88 | ||
| 40 | 100 mg PG (PG/SND 0.1% wt.) | 45 | 47.50 | 81.94 |
Publisher’s Note: MDPI stays neutral with regard to jurisdictional claims in published maps and institutional affiliations. |
© 2021 by the authors. Licensee MDPI, Basel, Switzerland. This article is an open access article distributed under the terms and conditions of the Creative Commons Attribution (CC BY) license (http://creativecommons.org/licenses/by/4.0/).
Share and Cite
Khalil, A.M.E.; Memon, F.A.; Tabish, T.A.; Fenton, B.; Salmon, D.; Zhang, S.; Butler, D. Performance Evaluation of Porous Graphene as Filter Media for the Removal of Pharmaceutical/Emerging Contaminants from Water and Wastewater. Nanomaterials 2021, 11, 79. https://doi.org/10.3390/nano11010079
Khalil AME, Memon FA, Tabish TA, Fenton B, Salmon D, Zhang S, Butler D. Performance Evaluation of Porous Graphene as Filter Media for the Removal of Pharmaceutical/Emerging Contaminants from Water and Wastewater. Nanomaterials. 2021; 11(1):79. https://doi.org/10.3390/nano11010079
Chicago/Turabian StyleKhalil, Ahmed M. E., Fayyaz A. Memon, Tanveer A. Tabish, Ben Fenton, Deborah Salmon, Shaowei Zhang, and David Butler. 2021. "Performance Evaluation of Porous Graphene as Filter Media for the Removal of Pharmaceutical/Emerging Contaminants from Water and Wastewater" Nanomaterials 11, no. 1: 79. https://doi.org/10.3390/nano11010079
APA StyleKhalil, A. M. E., Memon, F. A., Tabish, T. A., Fenton, B., Salmon, D., Zhang, S., & Butler, D. (2021). Performance Evaluation of Porous Graphene as Filter Media for the Removal of Pharmaceutical/Emerging Contaminants from Water and Wastewater. Nanomaterials, 11(1), 79. https://doi.org/10.3390/nano11010079