Enhancement of Electromagnetic Wave Shielding Effectiveness of Carbon Fibers via Chemical Composition Transformation Using H2 Plasma Treatment


Abstract
1. Introduction
2. Materials and Methods
3. Results
4. Conclusions
Author Contributions
Funding
Acknowledgments
Conflicts of Interest
References
- Wu, J.; Chung, D.L. Increasing the electromagnetic interference shielding effectiveness of carbon fiber polymer-matrix composite by using activated carbon fibers. Carbon 2002, 40, 445–447. [Google Scholar] [CrossRef]
- Chung, D.L. Electromagnetic interference shielding effectiveness of carbon materials. Carbon 2001, 39, 279–285. [Google Scholar] [CrossRef]
- Yang, S.; Lozano, K.; Lomeli, A.; Foltz, H.D.; Jones, R. Electromagnetic interference shielding effectiveness of carbon nanofiber/LCP composites. Compos. Part A Appl. Sci. Manuf. 2005, 36, 691–697. [Google Scholar] [CrossRef]
- Sau, K.P.; Chaki, T.K.; Chakraborty, A.; Khastgir, D. Electromagnetic interference shielding by carbon black and carbon fiber filled rubber composites. Plast. Rubber Compos. Process. Appl. 1997, 26, 291–297. [Google Scholar]
- Schulz, R.B.; Plantz, V.C.; Brush, D.R. Shielding theory and practice. Inst. Electr. Electron. Eng. 1988, 30, 187–201. [Google Scholar] [CrossRef]
- Chung, D.L. Materials for electromagnetic interference shielding. J. Mater. Eng. Perform. 2000, 9, 350–354. [Google Scholar] [CrossRef]
- Al-Saleh, M.H.; Sundararaj, U. Electromagnetic interference shielding mechanisms of CNT/polymer composites. Carbon 2009, 47, 1738–1746. [Google Scholar] [CrossRef]
- Simon, R.M. Emi shielding through conductive plastics. Polymer Plast. Technol. Eng. 1981, 17, 1–10. [Google Scholar] [CrossRef]
- Shaikjee, A.; Coville, N.J. The synthesis, properties and uses of carbon materials with helical morphology. J. Adv. Res. 2012, 3, 195–223. [Google Scholar] [CrossRef]
- Park, S.; Jeon, Y.-C.; Kim, S.-H. Effect of injection stage of SF6 flow on carbon micro coils formation. ECS J. Solid State Sci. Technol. 2013, 2, M56–M59. [Google Scholar] [CrossRef]
- Motojima, S.; Hoshiya, S.; Hishikawa, Y. Electromagnetic wave absorption properties of carbon microcoils/PMMA composite beads in W bands. Carbon 2003, 41, 2658–2660. [Google Scholar] [CrossRef]
- Zhao, D.L.; Shen, Z.M. Preparation and microwave absorption properties of carbon nanocoils. Mater. Lett. 2008, 62, 3704–3706. [Google Scholar] [CrossRef]
- Motojima, S.; Noda, Y.; Hoshiya, S.; Hishikawa, Y. Electromagnetic wave absorption property of carbon microcoils in 12–110 GHz region. J. Appl. Phys. 2003, 94, 2325. [Google Scholar] [CrossRef]
- Kim, H.J.; Kim, S.-H.; Park, S. Effects of the carbon fiber-carbon microcoil hybrid formation on the effectiveness of electromagnetic wave shielding on carbon fibers-based fabrics. Materials 2018, 11, 2344. [Google Scholar] [CrossRef]
- Yu, J.D. Apparatus for manufacturing carbon fiber film for manufacturing non-woven fabric and carbon fiber film manufactured using the same. Korea Patent 10-1588433, 19 January 2016. [Google Scholar]
- Nursel, D. Plasma surface modification of carbon fibers: A review. J. Adhes. Sci. Technol. 2000, 14, 975–987. [Google Scholar]
- Tiwari, S.; Bijwe, J. Surface treatment of carbon fibers—A review. Proc. Technol. 2014, 14, 505–512. [Google Scholar] [CrossRef]
- Smits, F. Measurement of sheet resistivities with the four-point probe. Bell Syst. Tech. J. 1958, 37, 711–718. [Google Scholar] [CrossRef]
- Pütz, J.; Heusing, S.; Aegerter, M.A. Characterization of electrical properties. In Handbook of Sol-Gel Science and Technology; Klein, L., Aparicio, M., Jitianu, A., Eds.; Springer: Cham, Switzerland, 2016; pp. 1–30. [Google Scholar]
- Song, W.L.; Cao, M.S.; Lu, M.M.; Bi, S.; Wang, C.Y.; Liu, J.; Yuan, J.; Fan, L.Z. Flexible graphene/polymer composite films in sandwich structures for effective electromagnetic interference shielding. Carbon 2014, 66, 67–76. [Google Scholar] [CrossRef]
- Song, W.L.; Wang, J.; Fan, L.Z.; Li, Y.; Wang, C.Y.; Cao, M.S. Interfacial engineering of carbon nanofiber-graphene-carbon nanofiber heterojunctions in flexible lightweight electromagnetic shielding networks. ACS Appl. Mater. Interface 2014, 6, 10516–10523. [Google Scholar] [CrossRef]
- Cao, M.S.; Song, W.L.; Hou, Z.L.; Wen, B.; Yuan, J. The effects of temperature and frequency on the dielectric properties, electromagnetic interference shielding and microwave-absorption of short carbon fiber/silica composites. Carbon 2010, 48, 788–796. [Google Scholar] [CrossRef]
- Huang, H.D.; Liu, C.Y.; Zhou, D.; Jiang, X.; Zhong, G.J. Cellulose composite aerogel for highly efficient electromagnetic interference shielding. J. Mater. Chem. A 2015, 3, 4983–4991. [Google Scholar] [CrossRef]
- Fredrik, H. ESCA studies of carbon and oxygen in carbon fibres. Fibre Sci. Technol. 1979, 12, 283–294. [Google Scholar]
- Foster, K.L.; Fuerman, R.G.; Economy, J.; Larson, S.M.; Rood, M.J. Adsorption characteristics of trace volatile organic compounds in gas streams onto activated carbon fibers. Chem. Mater. 1992, 4, 1068–1073. [Google Scholar] [CrossRef]
- Kerber, S.J.; Bruckner, J.J.; Wozniak, K.; Seal, S.; Hardcastle, S.; Barr, T.L. The nature of hydrogen in X-ray photoelectron spectroscopy: General patterns from hydroxides to hydrogen bonding. J. Vac. Sci. Technol. A 1996, 14, 1314. [Google Scholar] [CrossRef]
- Beamson, G.; Briggs, D. High Resolution XPS of Organic Polymers: The Scienta ESCA300 Database; John Wiley & Sons: Chichester, UK, 1992; p. 280. [Google Scholar]
- Hetong, Z.; Yue, G.; Xiang, Z.; Xinqian, W.; Hang, W.; Chunsheng, S.; Fang, H. Enhanced shielding performance of layered carbon fiber composites filled with carbonyl iron and carbon nanotubes in the koch curve fractal method. Molecules 2020, 25, 969. [Google Scholar]
- Hoang, A.S.; Nguyen, H.N.; Bui, H.T.; Tran, A.T.; Duong, V.A.; Nguyen, V.B. Carbon nanotubes materials and their application to guarantee safety from exposure to electromagnetic fields. Adv. Nat. Sci. Nanosci. Nanotechnol. 2013, 4, 1–5. [Google Scholar] [CrossRef]
- Tianchun, Z.; Naiqin, Z.; Chunsheng, S.; Jiajun, L. Microwave absorbing properties of activated carbon fibre polymer composites. Bull. Mater. Sci. 2011, 34, 75–79. [Google Scholar]
- Viraj, B.; Maya, S.; Satyam, S.; Giridhar, M.; Suryasarathi, B. Polyvinylidene fluoride based lightweight and corrosion resistant electromagnetic shielding materials. RSC Adv. 2015, 5, 35909–35916. [Google Scholar]
- Huang, Y.L.; Yuen, S.M.; Ma, C.C.M.; Chuang, C.Y.; Yu, K.C.; Teng, C.C.; Tien, H.W.; Chiu, Y.C.; Wu, S.Y.; Liao, S.H.; et al. Morphological, electrical, electromagnetic interference (EMI) shielding, and tribological properties of functionalized multi-walled carbon nanotube/poly methyl methacrylate (PMMA) composites. Compos. Sci. Technol. 2009, 69, 1991–1996. [Google Scholar] [CrossRef]
- Bingqing, Y.; Liming, Y.; Leimei, S.; Kang, A.; Xinluo, Z. Comparison of electromagnetic interference shielding properties between single-wall carbon nanotube and graphene sheet/polyaniline composites. J. Phys. D Appl. Phys. 2012, 45, 1–6. [Google Scholar]
- Wei, X.; Xukun, Z.; Shihe, Y.; Jiacai, K.; Haifeng, C.; Wei, T.; Yingjun, D. Electromagnetic absorption properties of natural microcrystalline graphite. Mater. Des. 2016, 90, 38–46. [Google Scholar]
- Thomassin, J.-M.; Pagnoulle, C.; Bednarz, L.; Huynen, I.; Jerome, R.; Detrembleur, C. Foams of polycaprolactone/MWNT nanocomposites for efficient EMI reduction. J. Mater. Chem. 2008, 18, 792–796. [Google Scholar] [CrossRef]


| Substrate Temperature (°C) | H2 Gas Pressure (Torr) | H2 Gas Flow Rate (sccm) | H2 Plasma Reaction Time (min) | Microwave Power (W) |
|---|---|---|---|---|
| 750 | 40 | 100 | 5 | 900 |
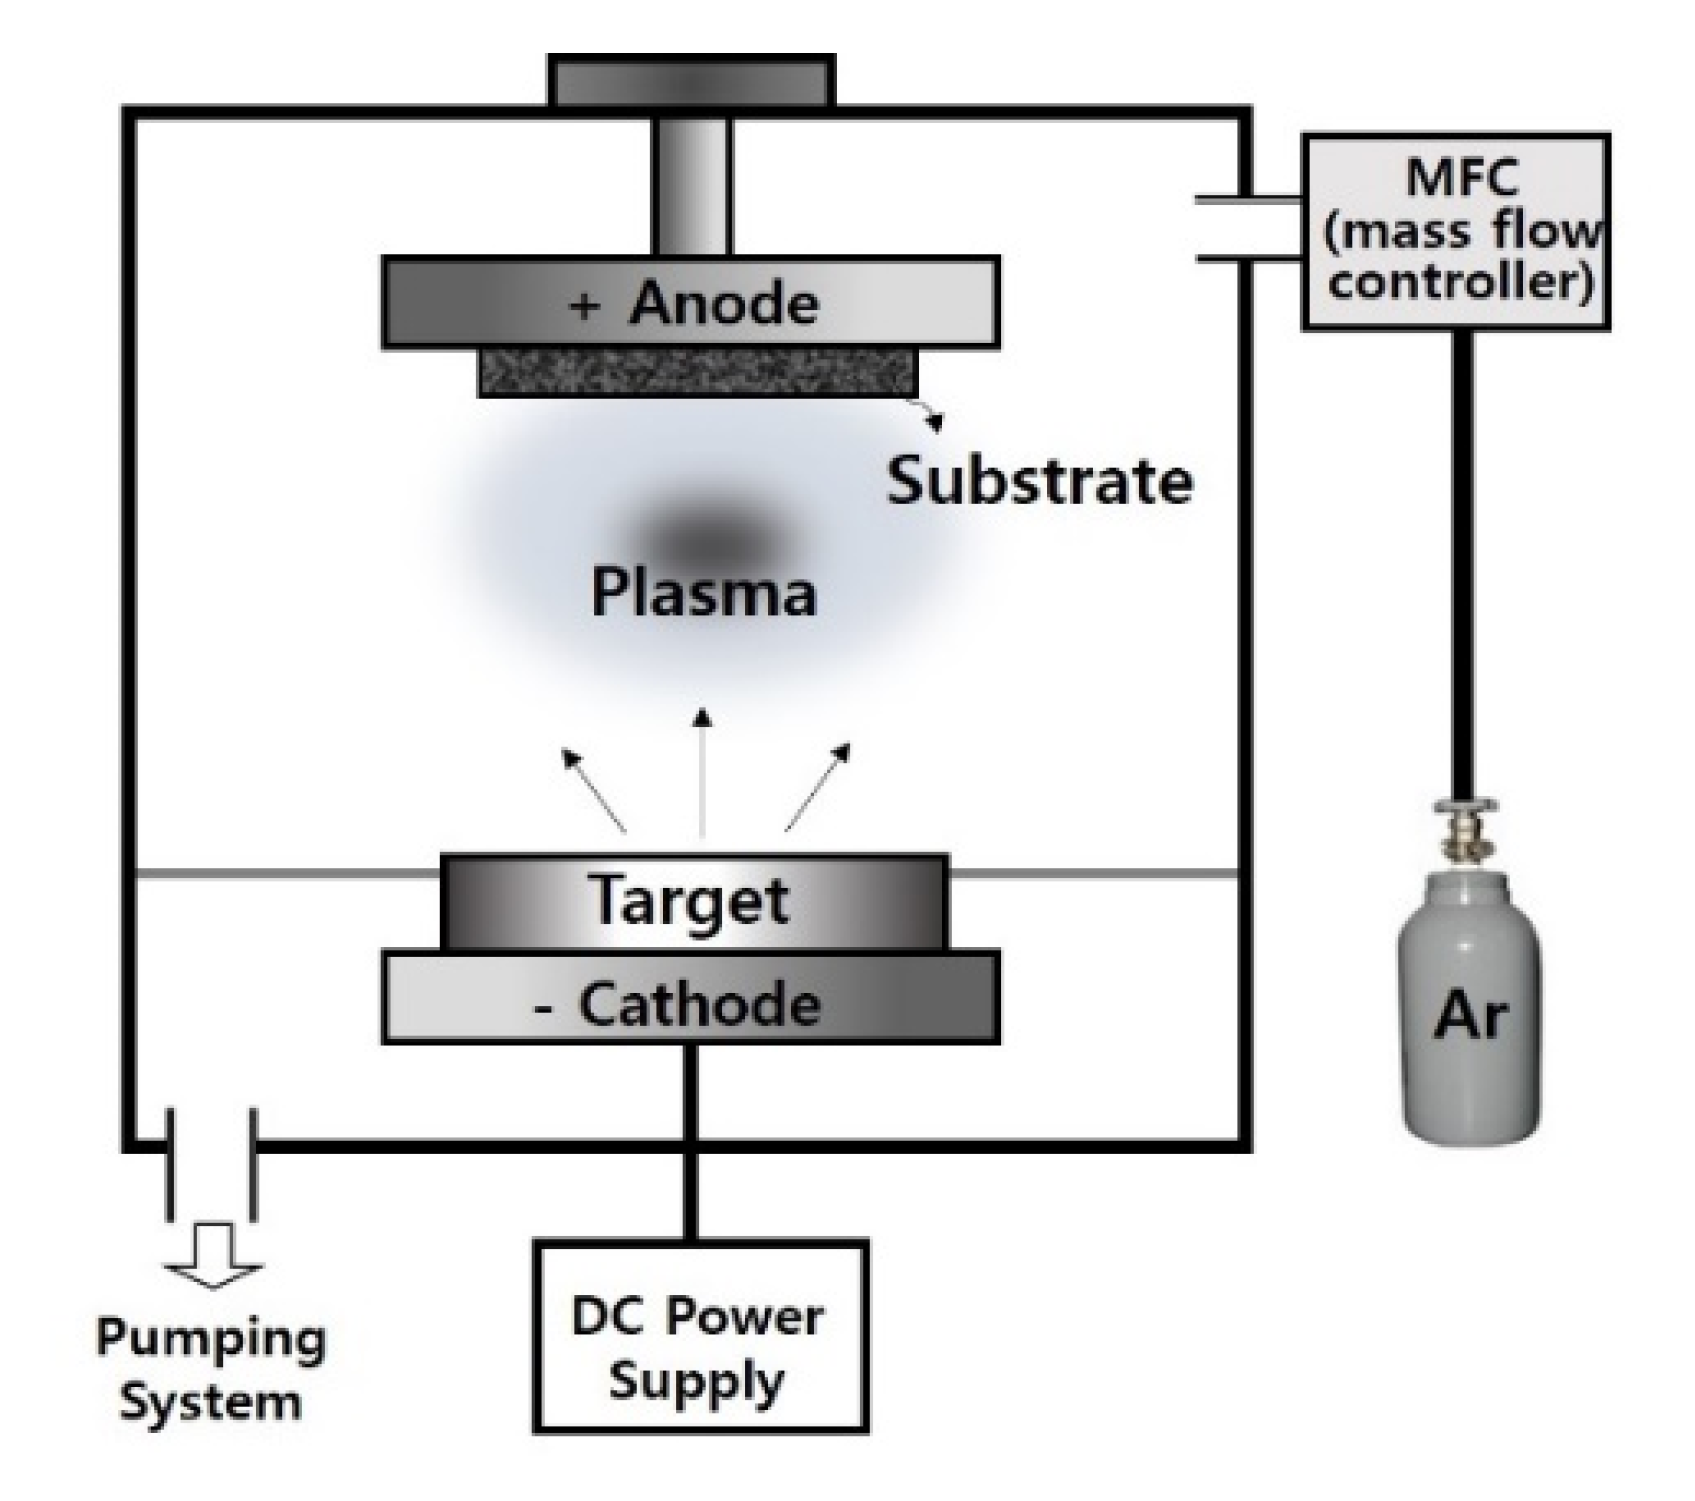
| Ar Gas Pressure (Torr) | Ar Gas Flow Rate (sccm) | Total Reaction Time (min) | DC Power (kW) | Sputter Target |
|---|---|---|---|---|
| 40 | 70 | 6.0 | 1.0 | Ag |
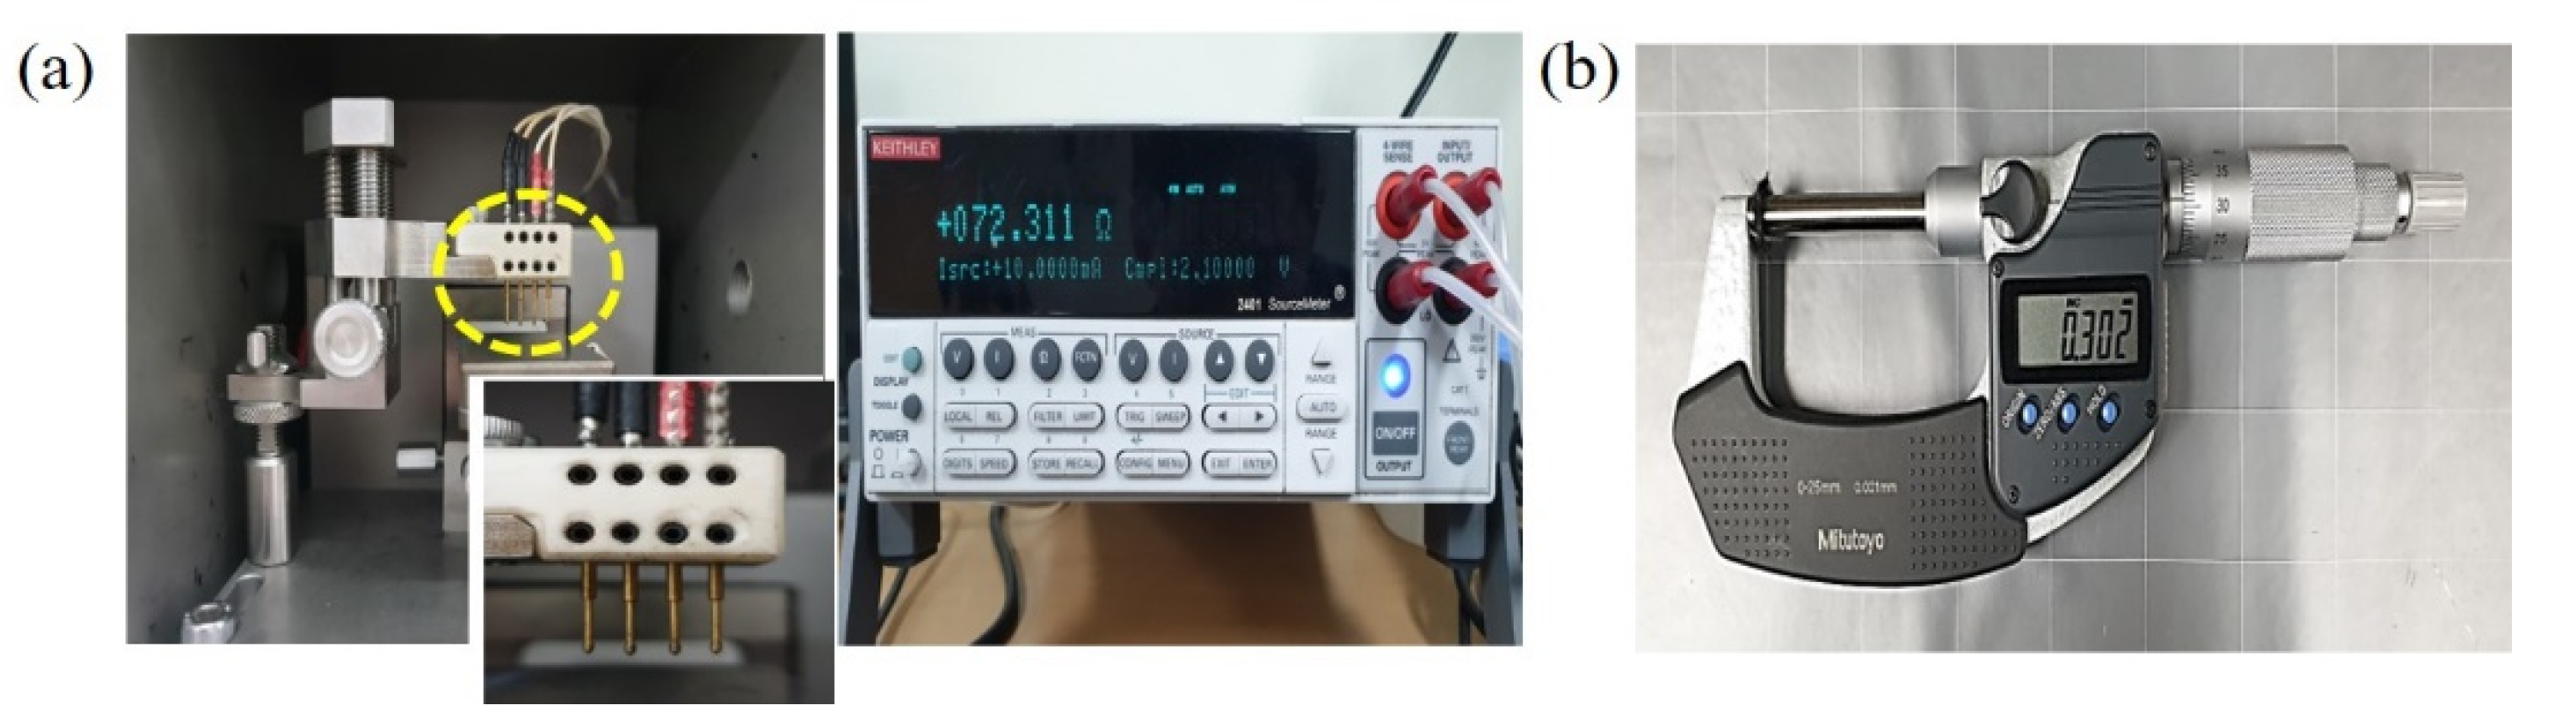
| Samples | Thickness (mm) | Resistivity ρ (Ω∙m) | Conductivity σ (S/m) | * Correction Factor F (w/s) |
|---|---|---|---|---|
| Native c-NFs | 1.5 | 4.60 × 10⁻⁴ | 2.17 × 10³ | 0.99 |
| c-NFs treated with H2 plasma for 5 min | 3.20 × 10⁻⁴ | 3.13 × 10³ | ||
| Ag-coated c-NFs | 2.77 × 10⁻⁴ | 3.61 × 10³ | ||
| Ag-coated c-NFs treated with H2 plasma for 5 min | 2.42 × 10⁻⁴ | 4.13 × 10³ |
| Samples | Binding Energy (eV) | * Binding Energy of Reference Compounds (eV) |
|---|---|---|
| O (1s) | O (1s) | |
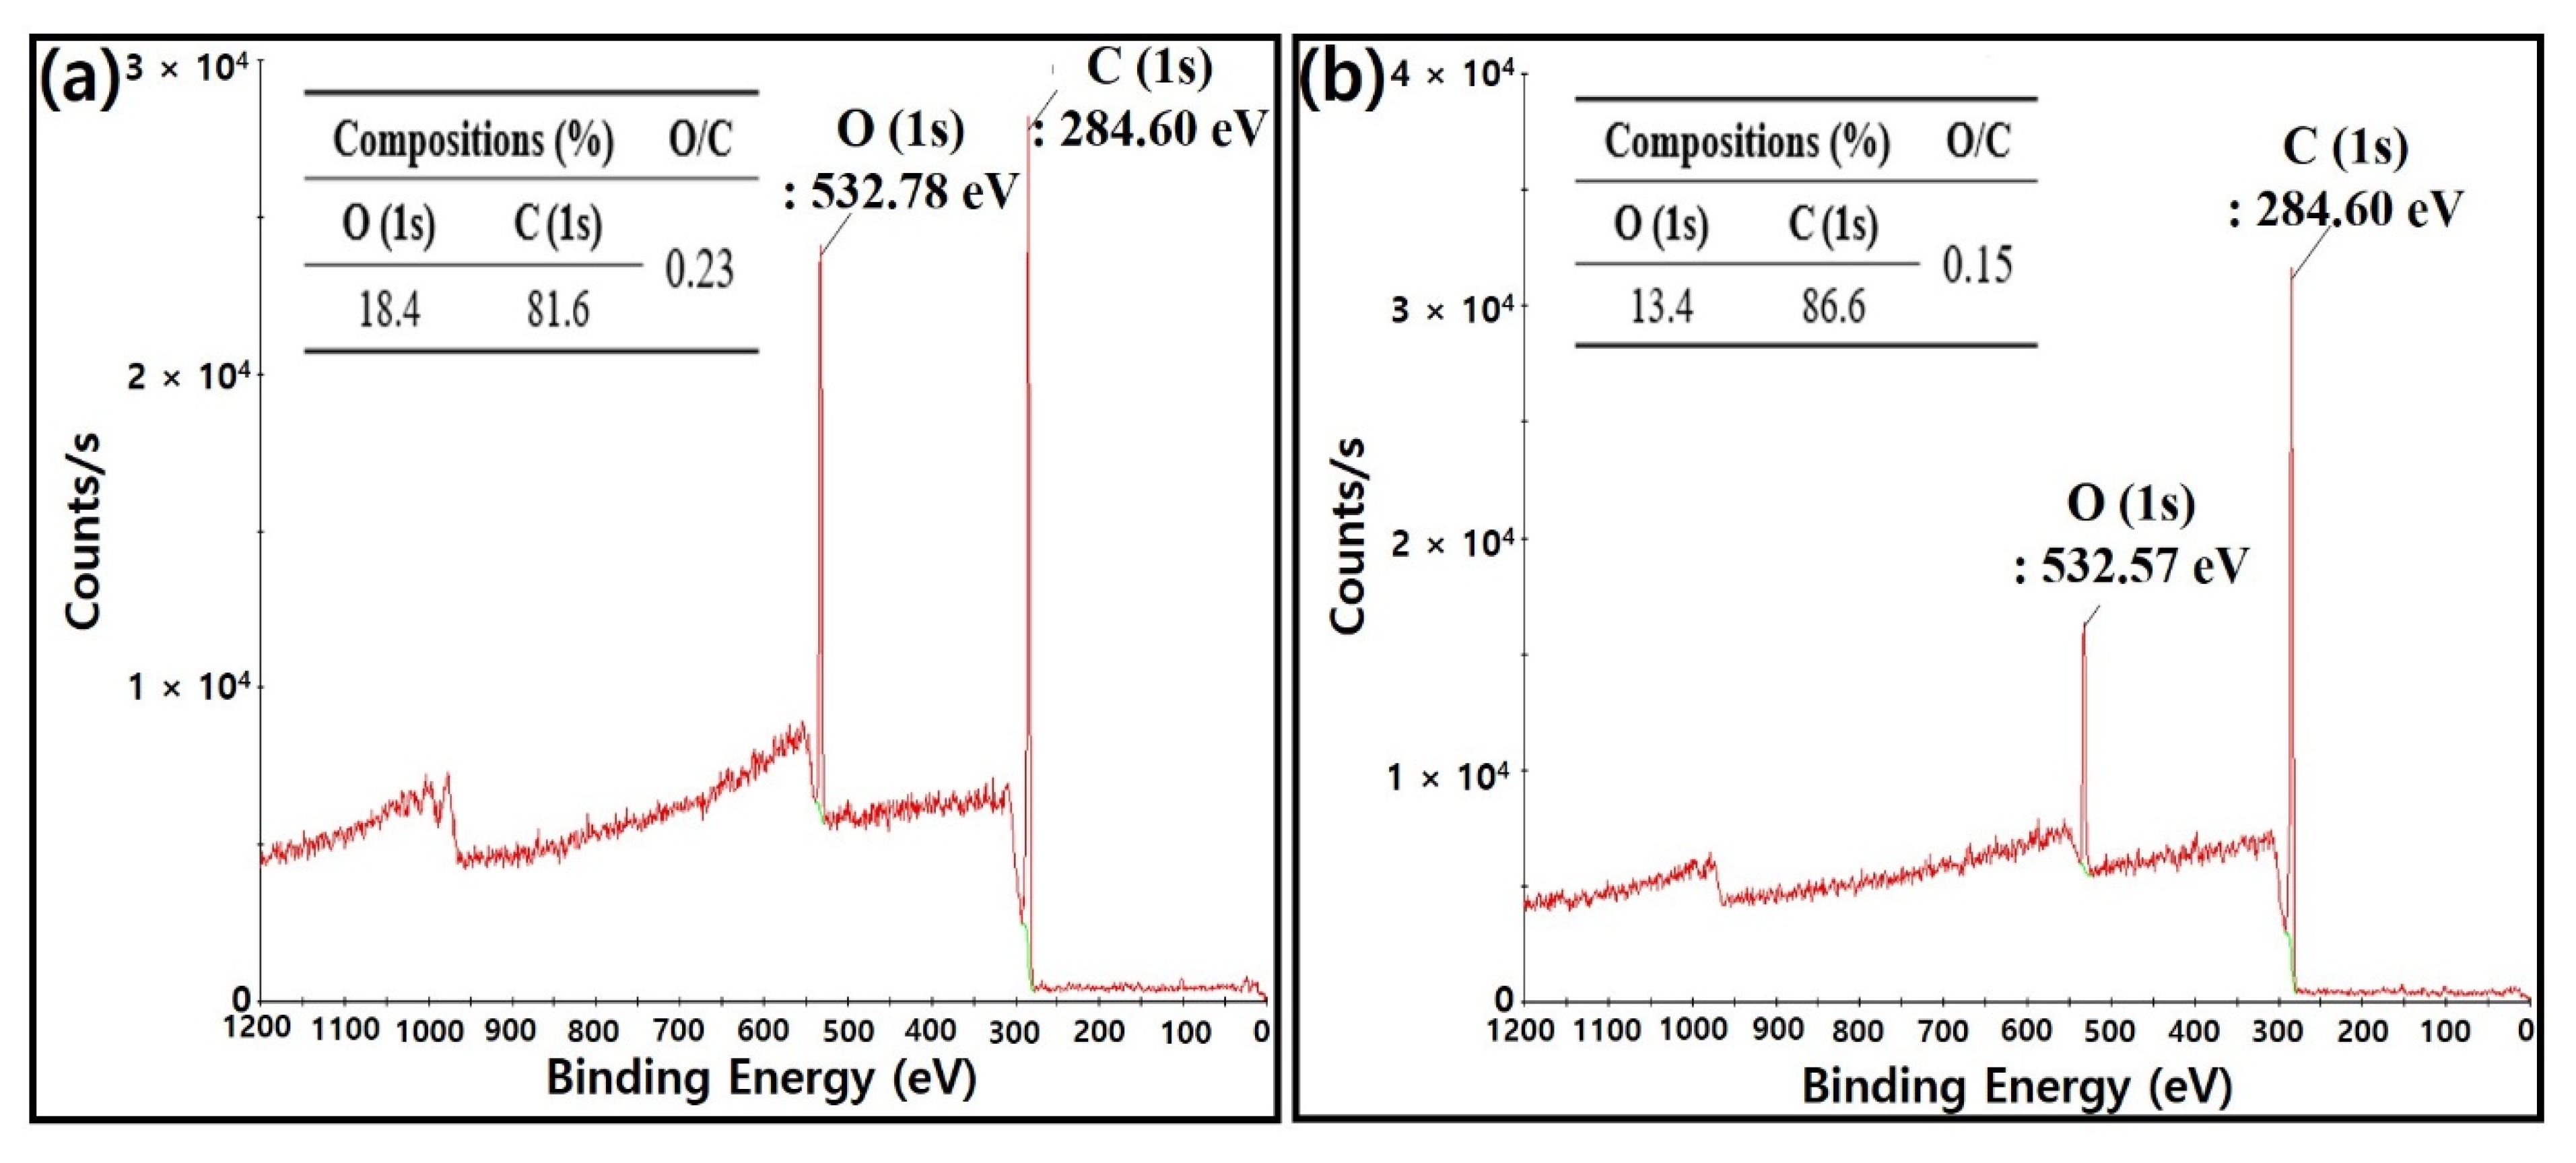
| Native c-NFs | 532.78 | 532.8 (C–O–H) |
| c-NFs treated with H2 plasma for 5 min | 532.57 | 532.5 (C–O–C) |
| Carbon-Based Materials | Thickness (mm) | Conductivity or Sheet Resistance | Operating Frequency (GHz) | SE (dB) | Refs. |
|---|---|---|---|---|---|
| *CFC/*CNTs/*CIPs | 6.0 | - | 1–18 | 52–73 | [28] |
| 25 wt% *MWCNTs/*PMMA | 0.1 | >10 S/cm | 0.1–14 | 17–22 | [29] |
| Activated carbon fiber/*PA | 4.0 | - | 2–18 | 10–27 | [30] |
| *CNTs-Ni40Co60/*PVDF | 4.5 | 1.7 × 10⁻⁴ S/cm | 11–41 | [31] | |
| Functionalized (maleic anhydride modified) *MWCNTs/*PMMA | 1.0 | 1.33 × 10⁶ Ω/sq | 13–18 | [32] | |
| 33 wt% *GS/*PANI | 2.4 | 20 S/cm | 20–34 | [33] | |
| 25 wt% *SWCNT/*PANI | 2.4 | 34 S/cm | 17–32 | ||
| *MG/*LDPE | 2.0–2.1 | - | 5–21 | [34] | |
| *MWCNTs/*PCL | 20.0 | >4.0 S/m | 0.04–40 | 60–80 | [35] |
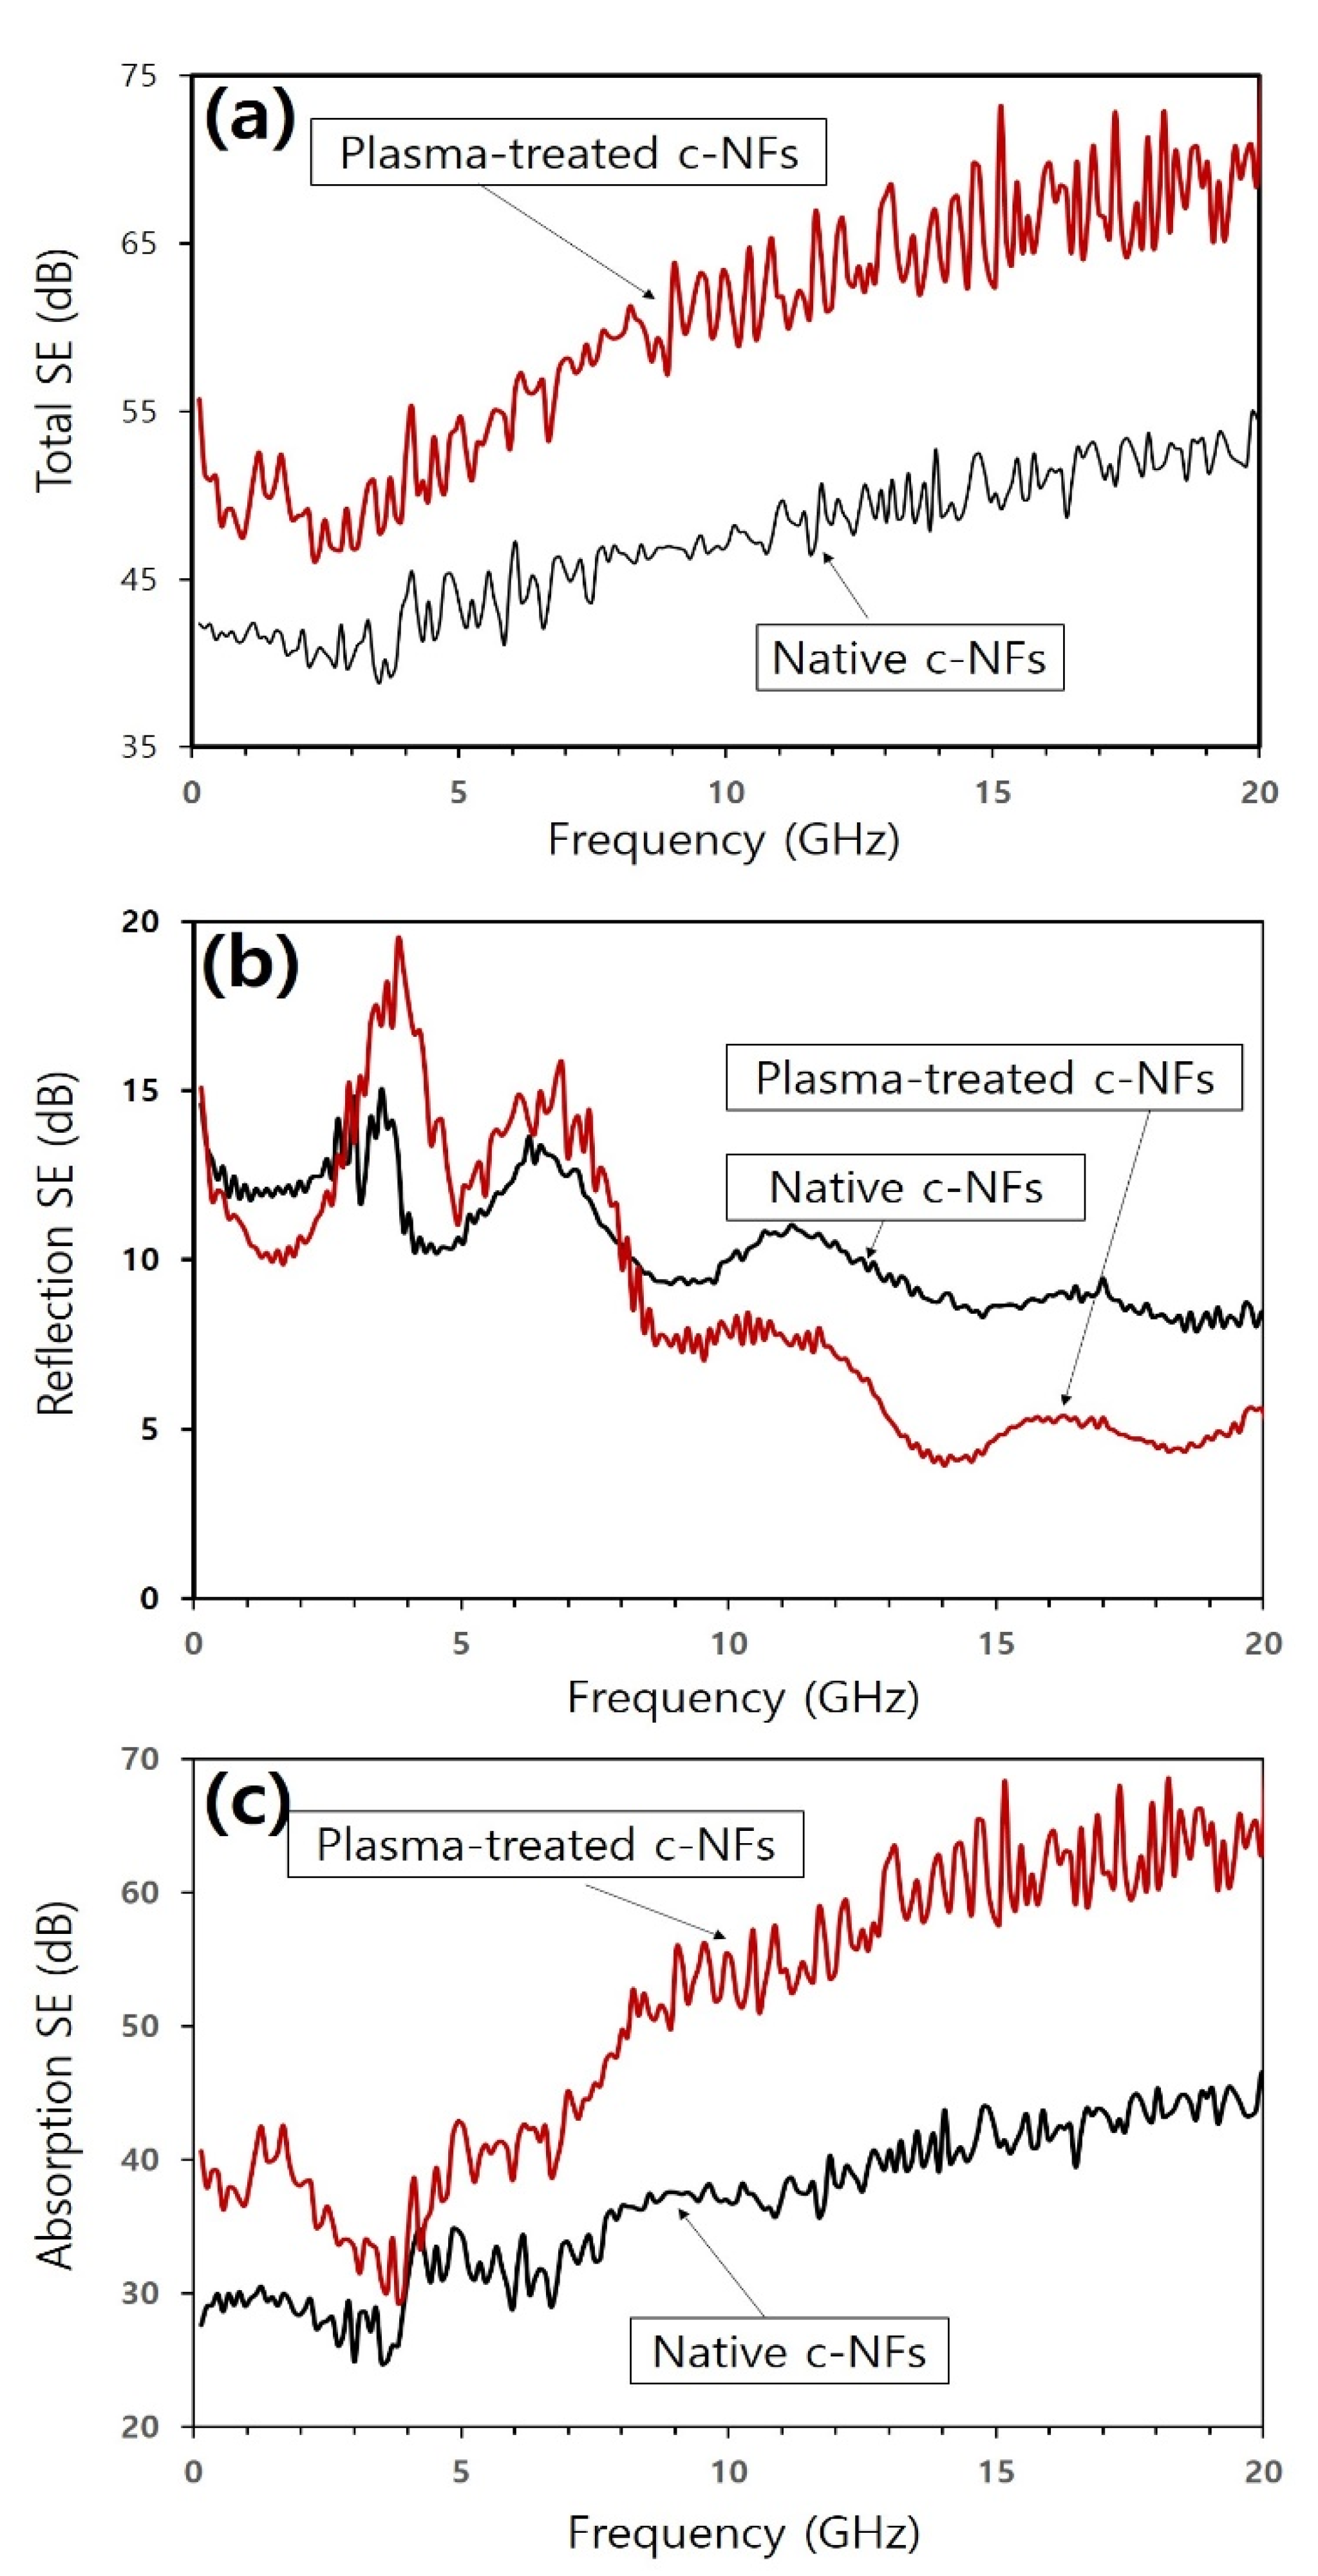
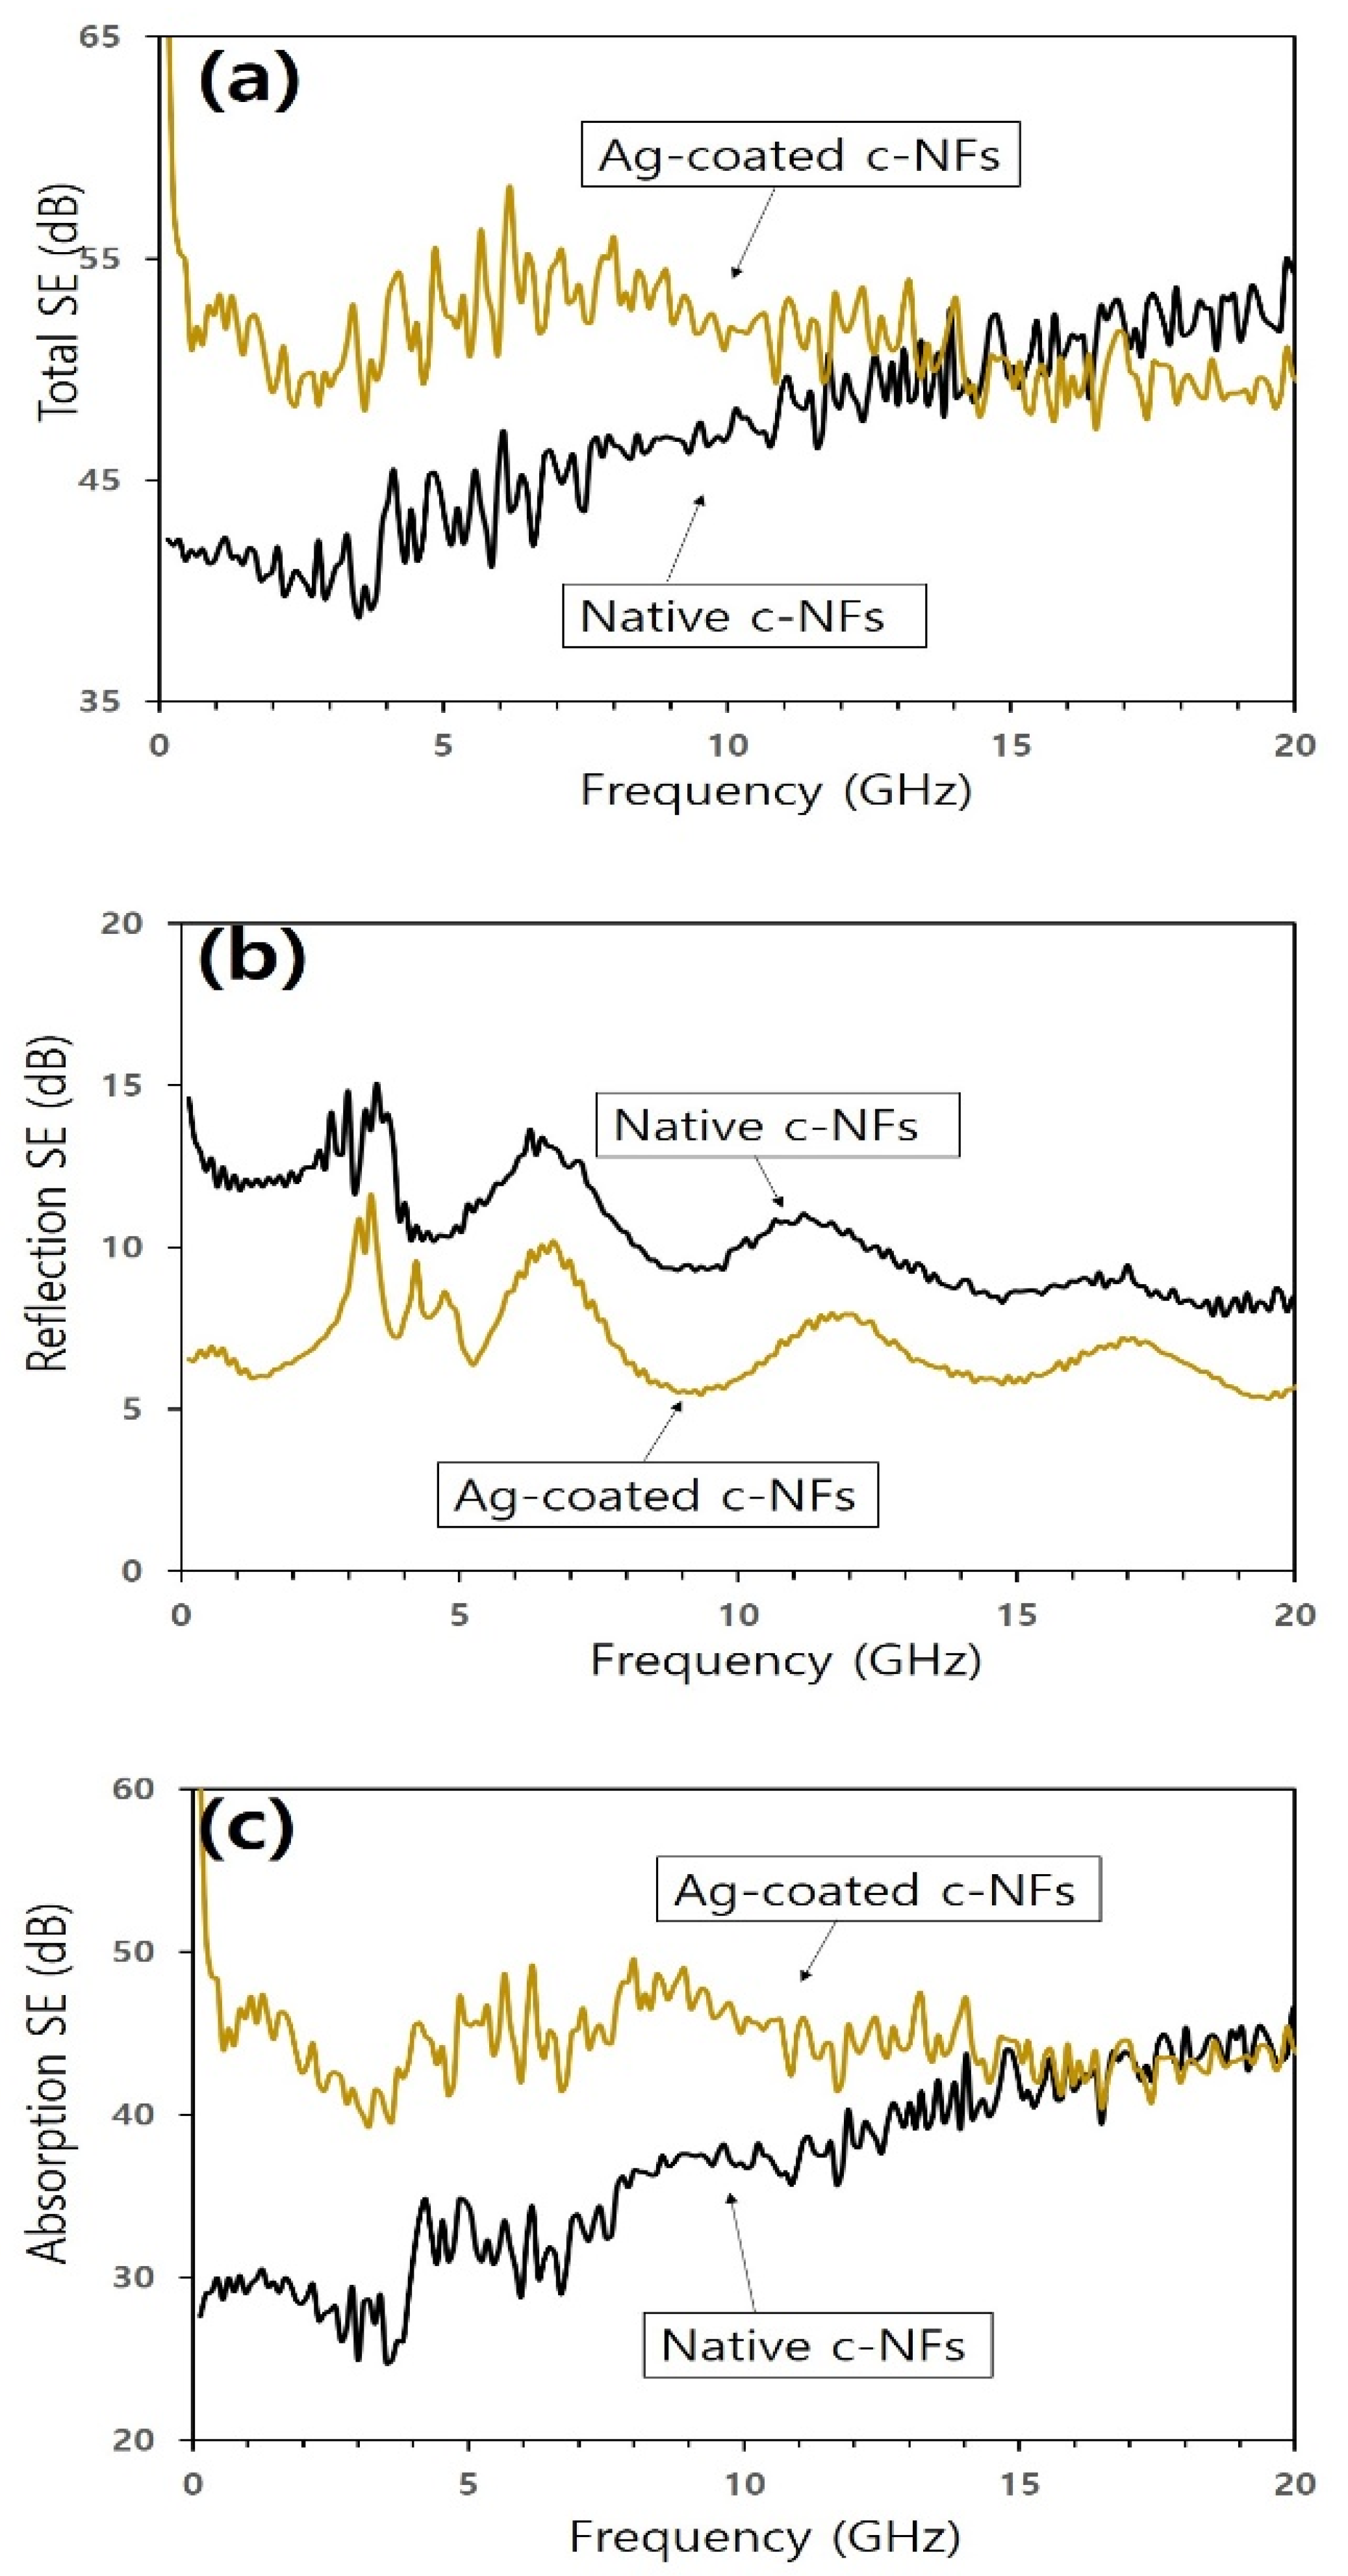
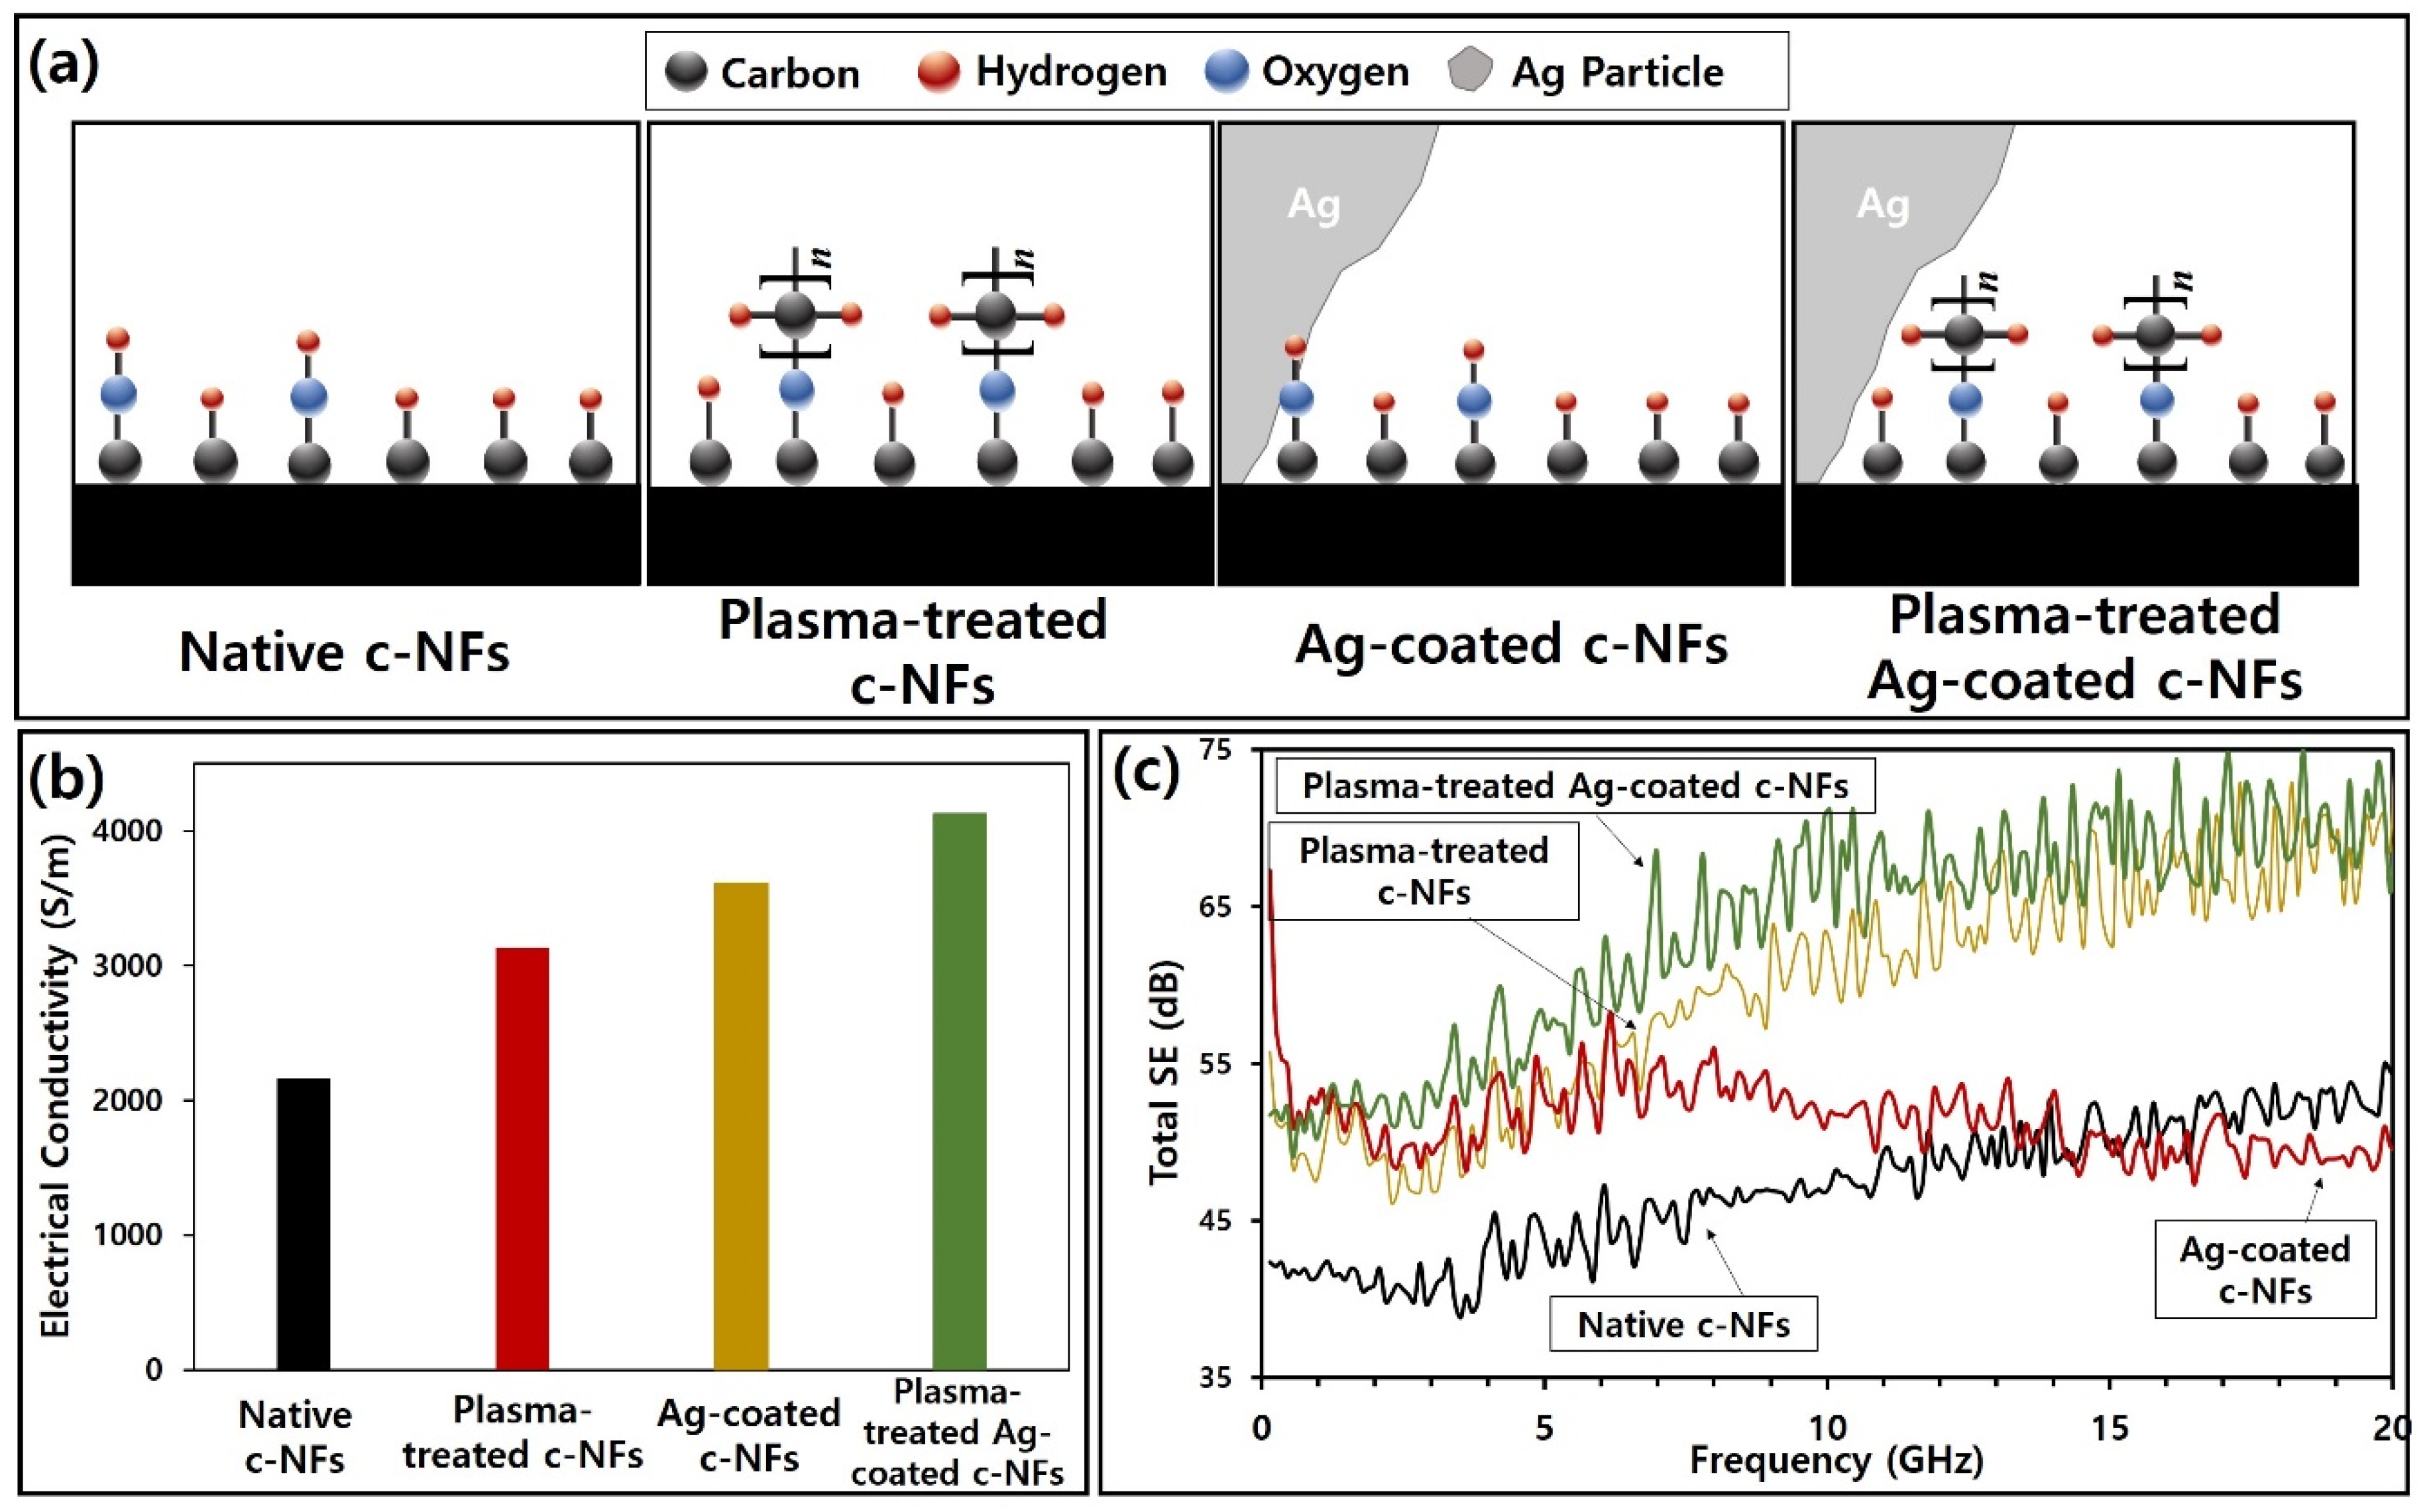
| Native c-NFs | 1.5 | 2.17 × 10³ S/m | 0.04–20 | 39–55 | This Work |
| c-NFs treated with H2 plasma for 5 min | 1.5 | 3.13 × 10³ S/m | 46–75 | ||
| Ag coated c-NFs | 1.5 | 3.61 × 10³ S/m | 47–67 | ||
| Ag coated c-NFs plasma-treated with H2 plasma for 5 min | 1.5 | 4.13 × 10³ S/m | 49–75 |
© 2020 by the authors. Licensee MDPI, Basel, Switzerland. This article is an open access article distributed under the terms and conditions of the Creative Commons Attribution (CC BY) license (http://creativecommons.org/licenses/by/4.0/).
Share and Cite
Kim, H.-J.; Kang, G.-H.; Kim, S.-H.; Park, S. Enhancement of Electromagnetic Wave Shielding Effectiveness of Carbon Fibers via Chemical Composition Transformation Using H2 Plasma Treatment. Nanomaterials 2020, 10, 1611. https://doi.org/10.3390/nano10081611
Kim H-J, Kang G-H, Kim S-H, Park S. Enhancement of Electromagnetic Wave Shielding Effectiveness of Carbon Fibers via Chemical Composition Transformation Using H2 Plasma Treatment. Nanomaterials. 2020; 10(8):1611. https://doi.org/10.3390/nano10081611
Chicago/Turabian StyleKim, Hyun-Ji, Gi-Hwan Kang, Sung-Hoon Kim, and Sangmoon Park. 2020. "Enhancement of Electromagnetic Wave Shielding Effectiveness of Carbon Fibers via Chemical Composition Transformation Using H2 Plasma Treatment" Nanomaterials 10, no. 8: 1611. https://doi.org/10.3390/nano10081611
APA StyleKim, H.-J., Kang, G.-H., Kim, S.-H., & Park, S. (2020). Enhancement of Electromagnetic Wave Shielding Effectiveness of Carbon Fibers via Chemical Composition Transformation Using H2 Plasma Treatment. Nanomaterials, 10(8), 1611. https://doi.org/10.3390/nano10081611