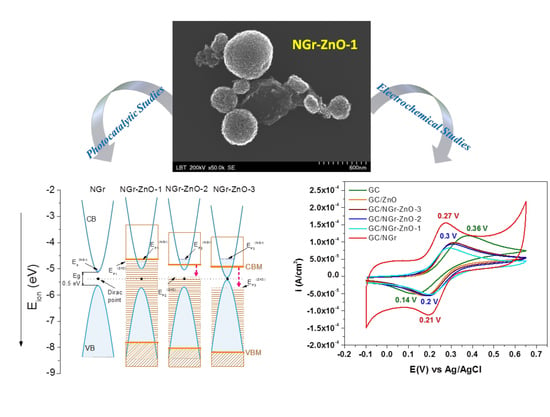
Photocatalytic and Electrocatalytic Properties of NGr-ZnO Hybrid Materials

 ,
, 
Abstract
1. Introduction
2. Materials and Methods
2.1. Materials
2.2. Synthesis of N-Doped Graphene (NGr)
2.3. Synthesis of N-Doped Graphene-ZnO Hybrid Materials (NGr-ZnO)
2.4. Preparation of Glassy-Carbon Modified Electrodes
2.5. Instruments
3. Results and Discussions
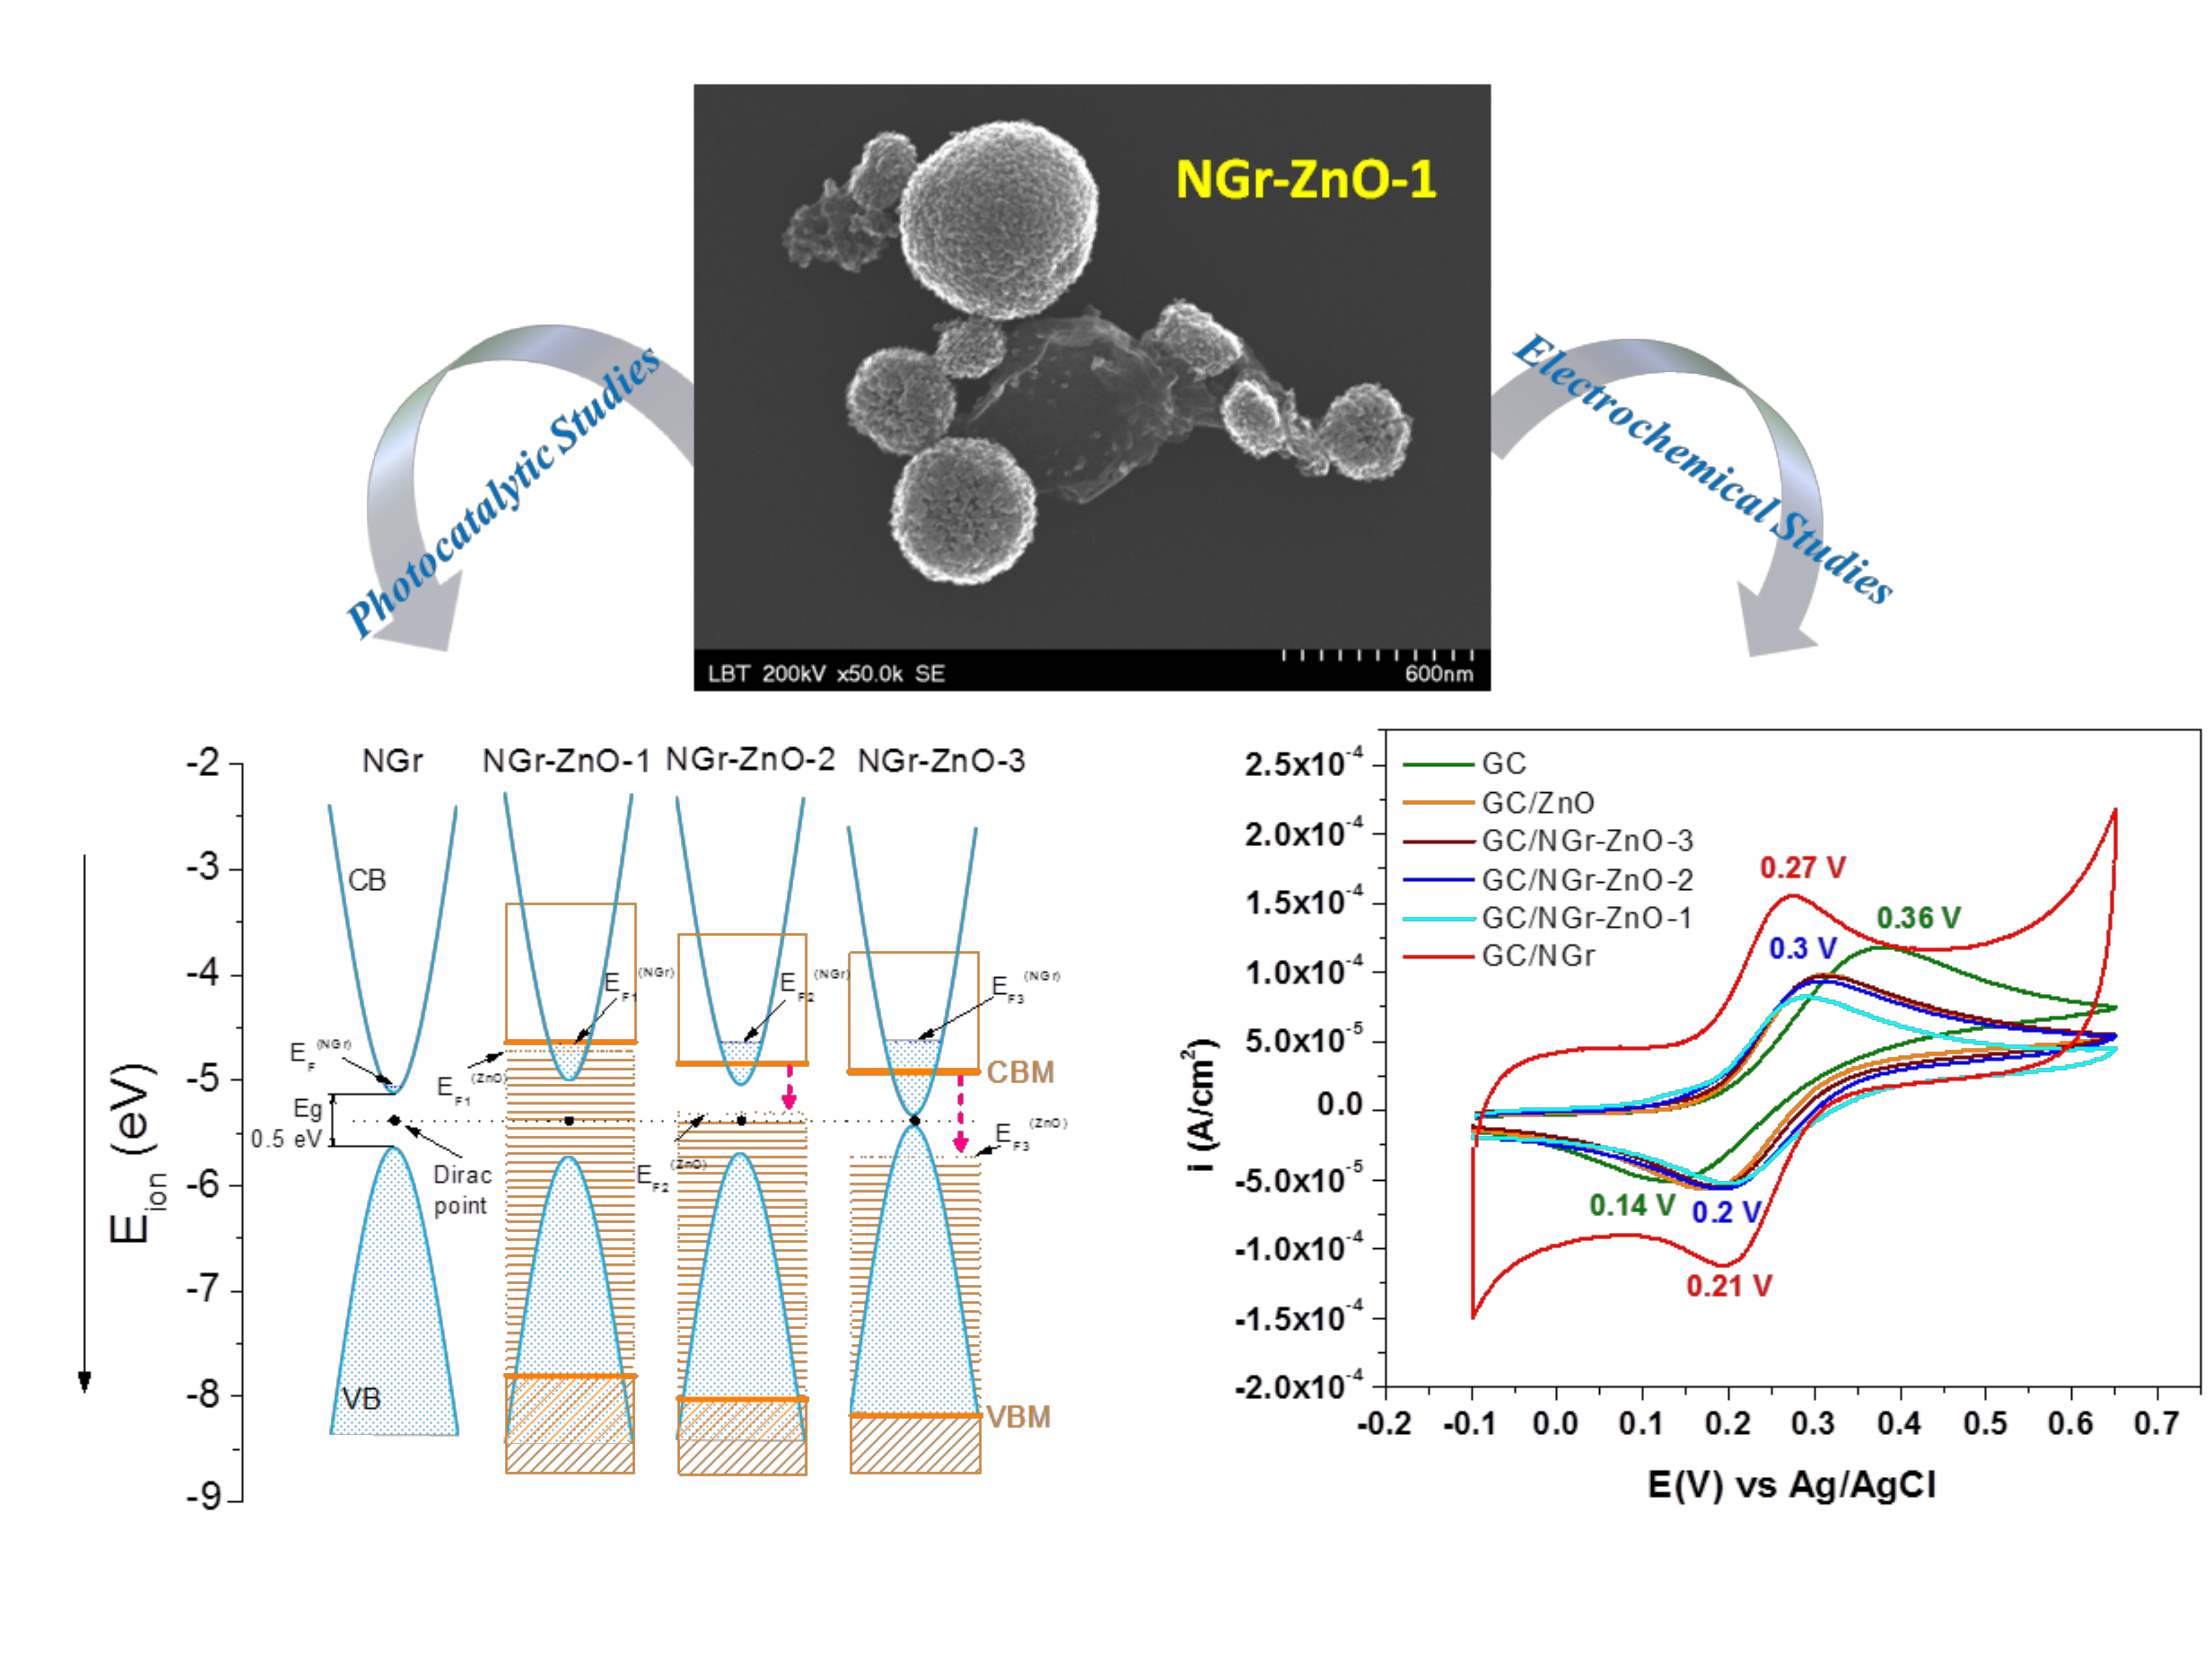
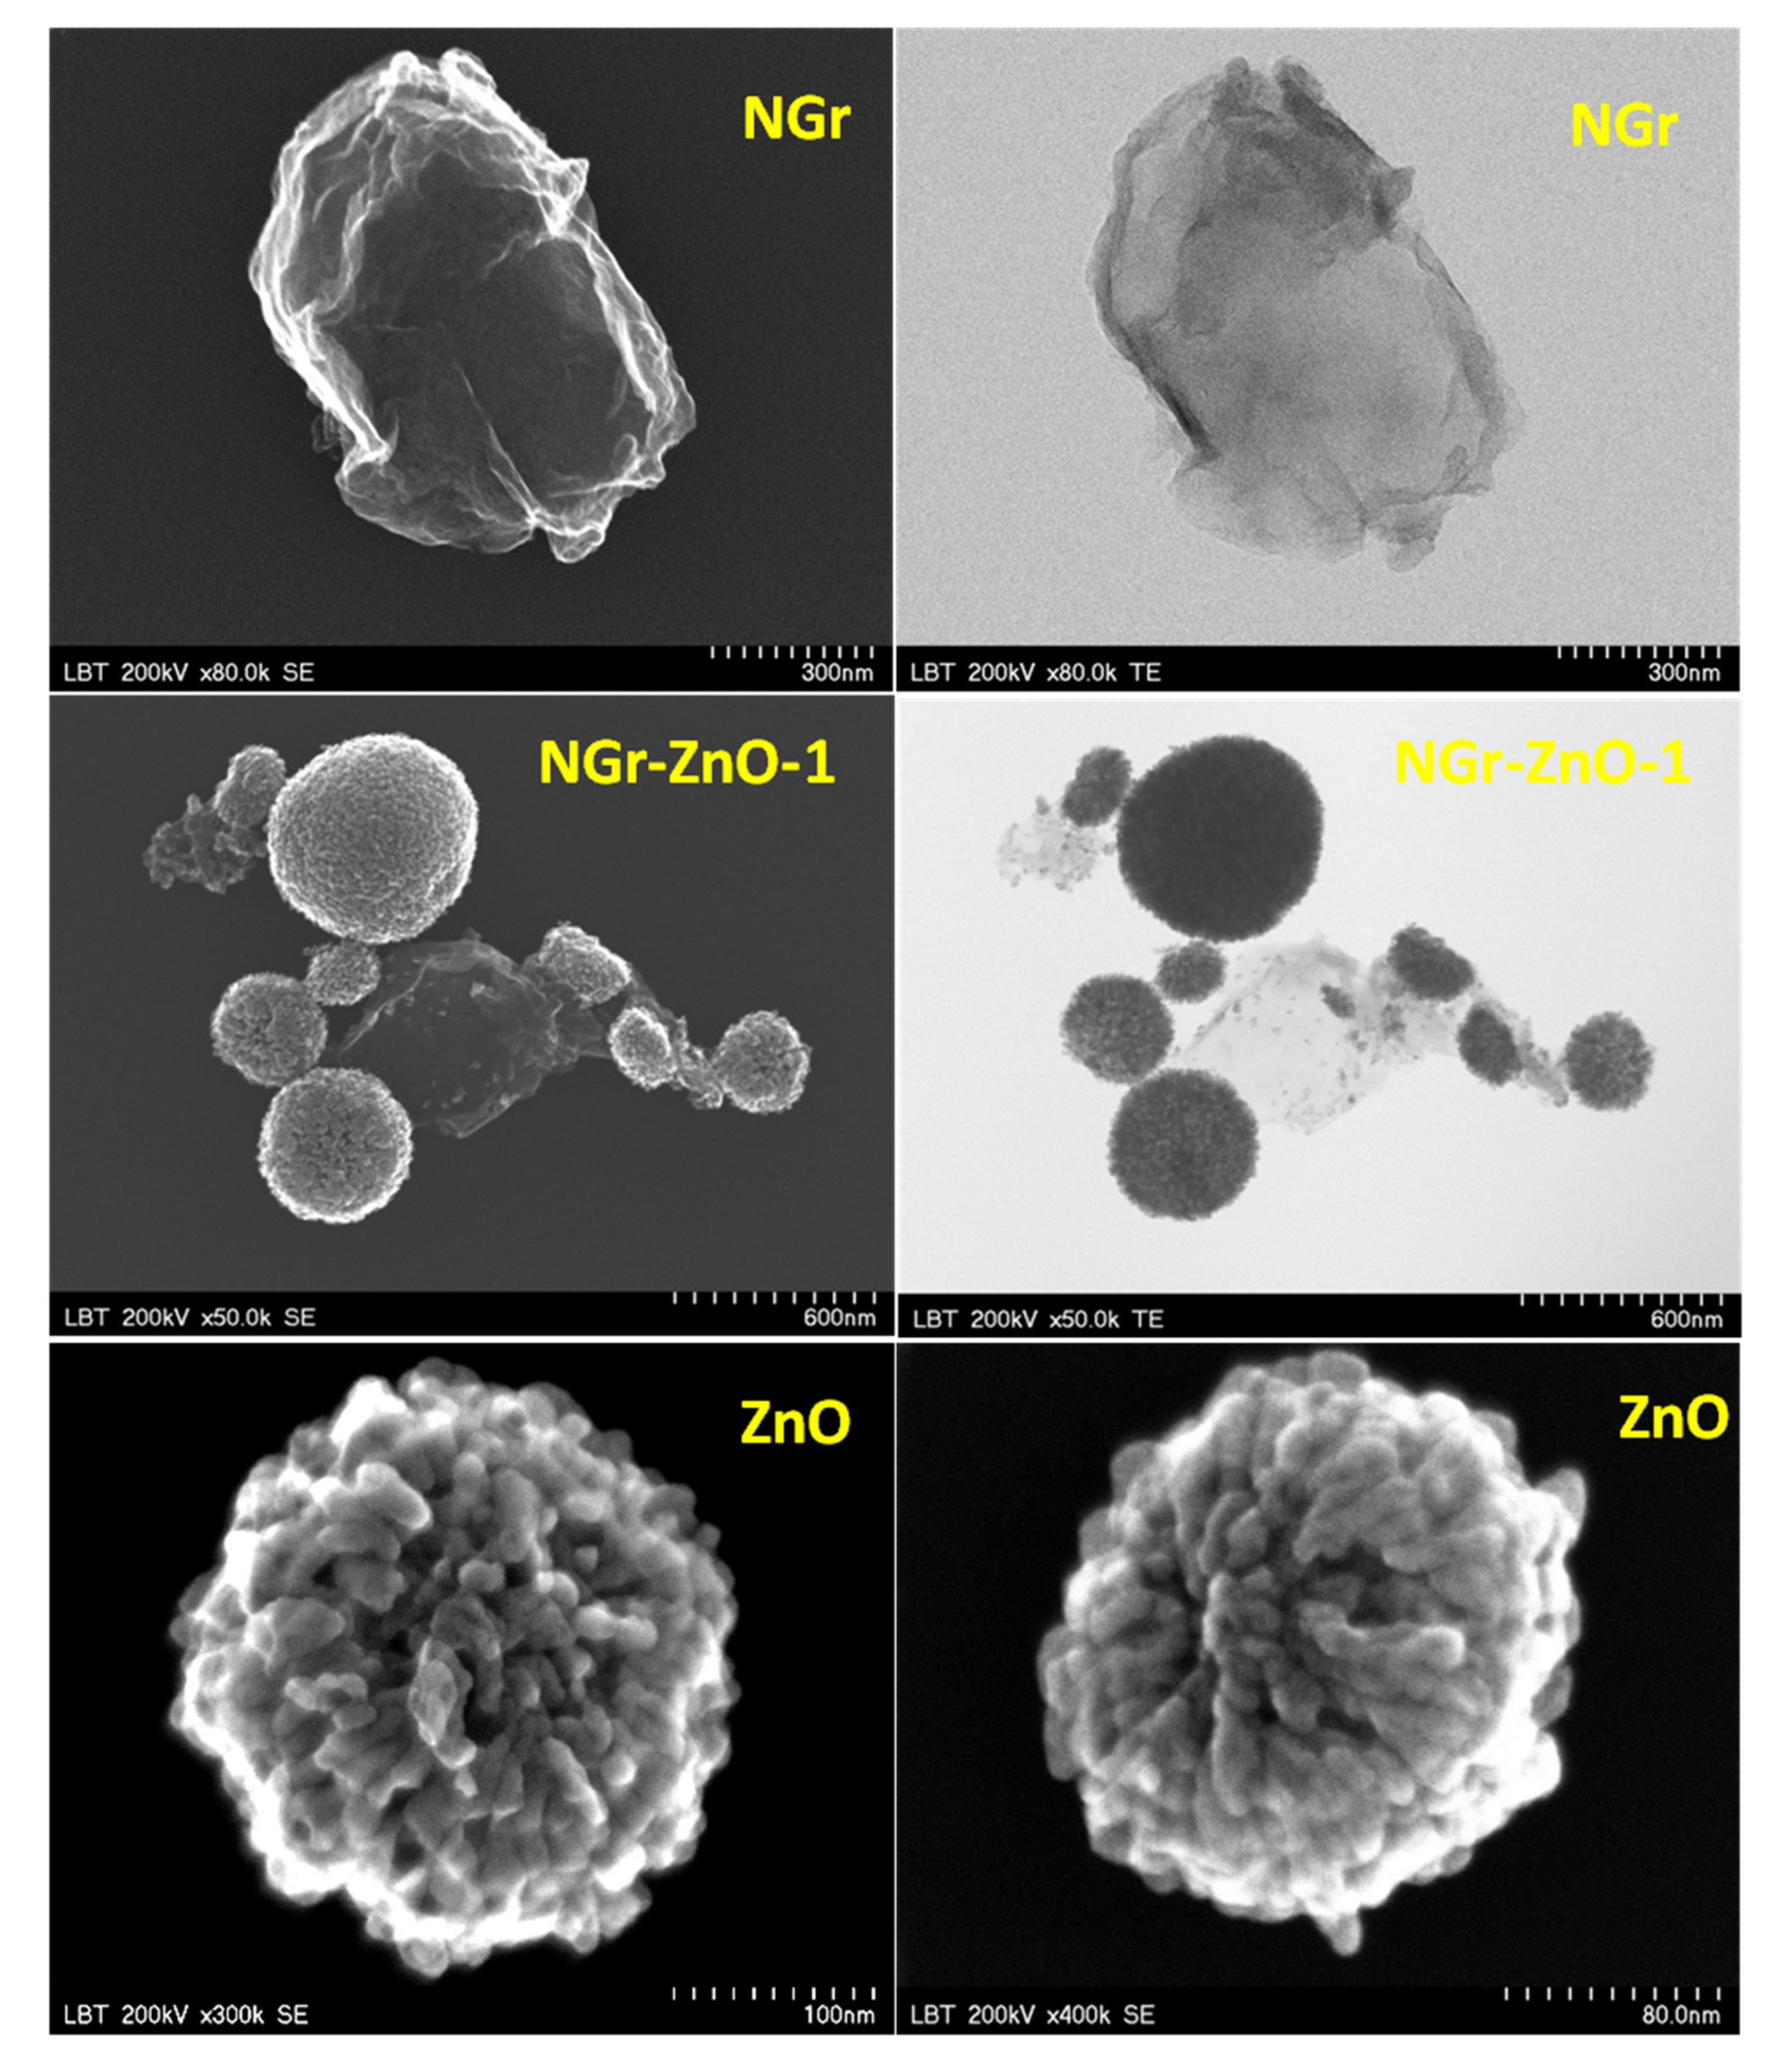
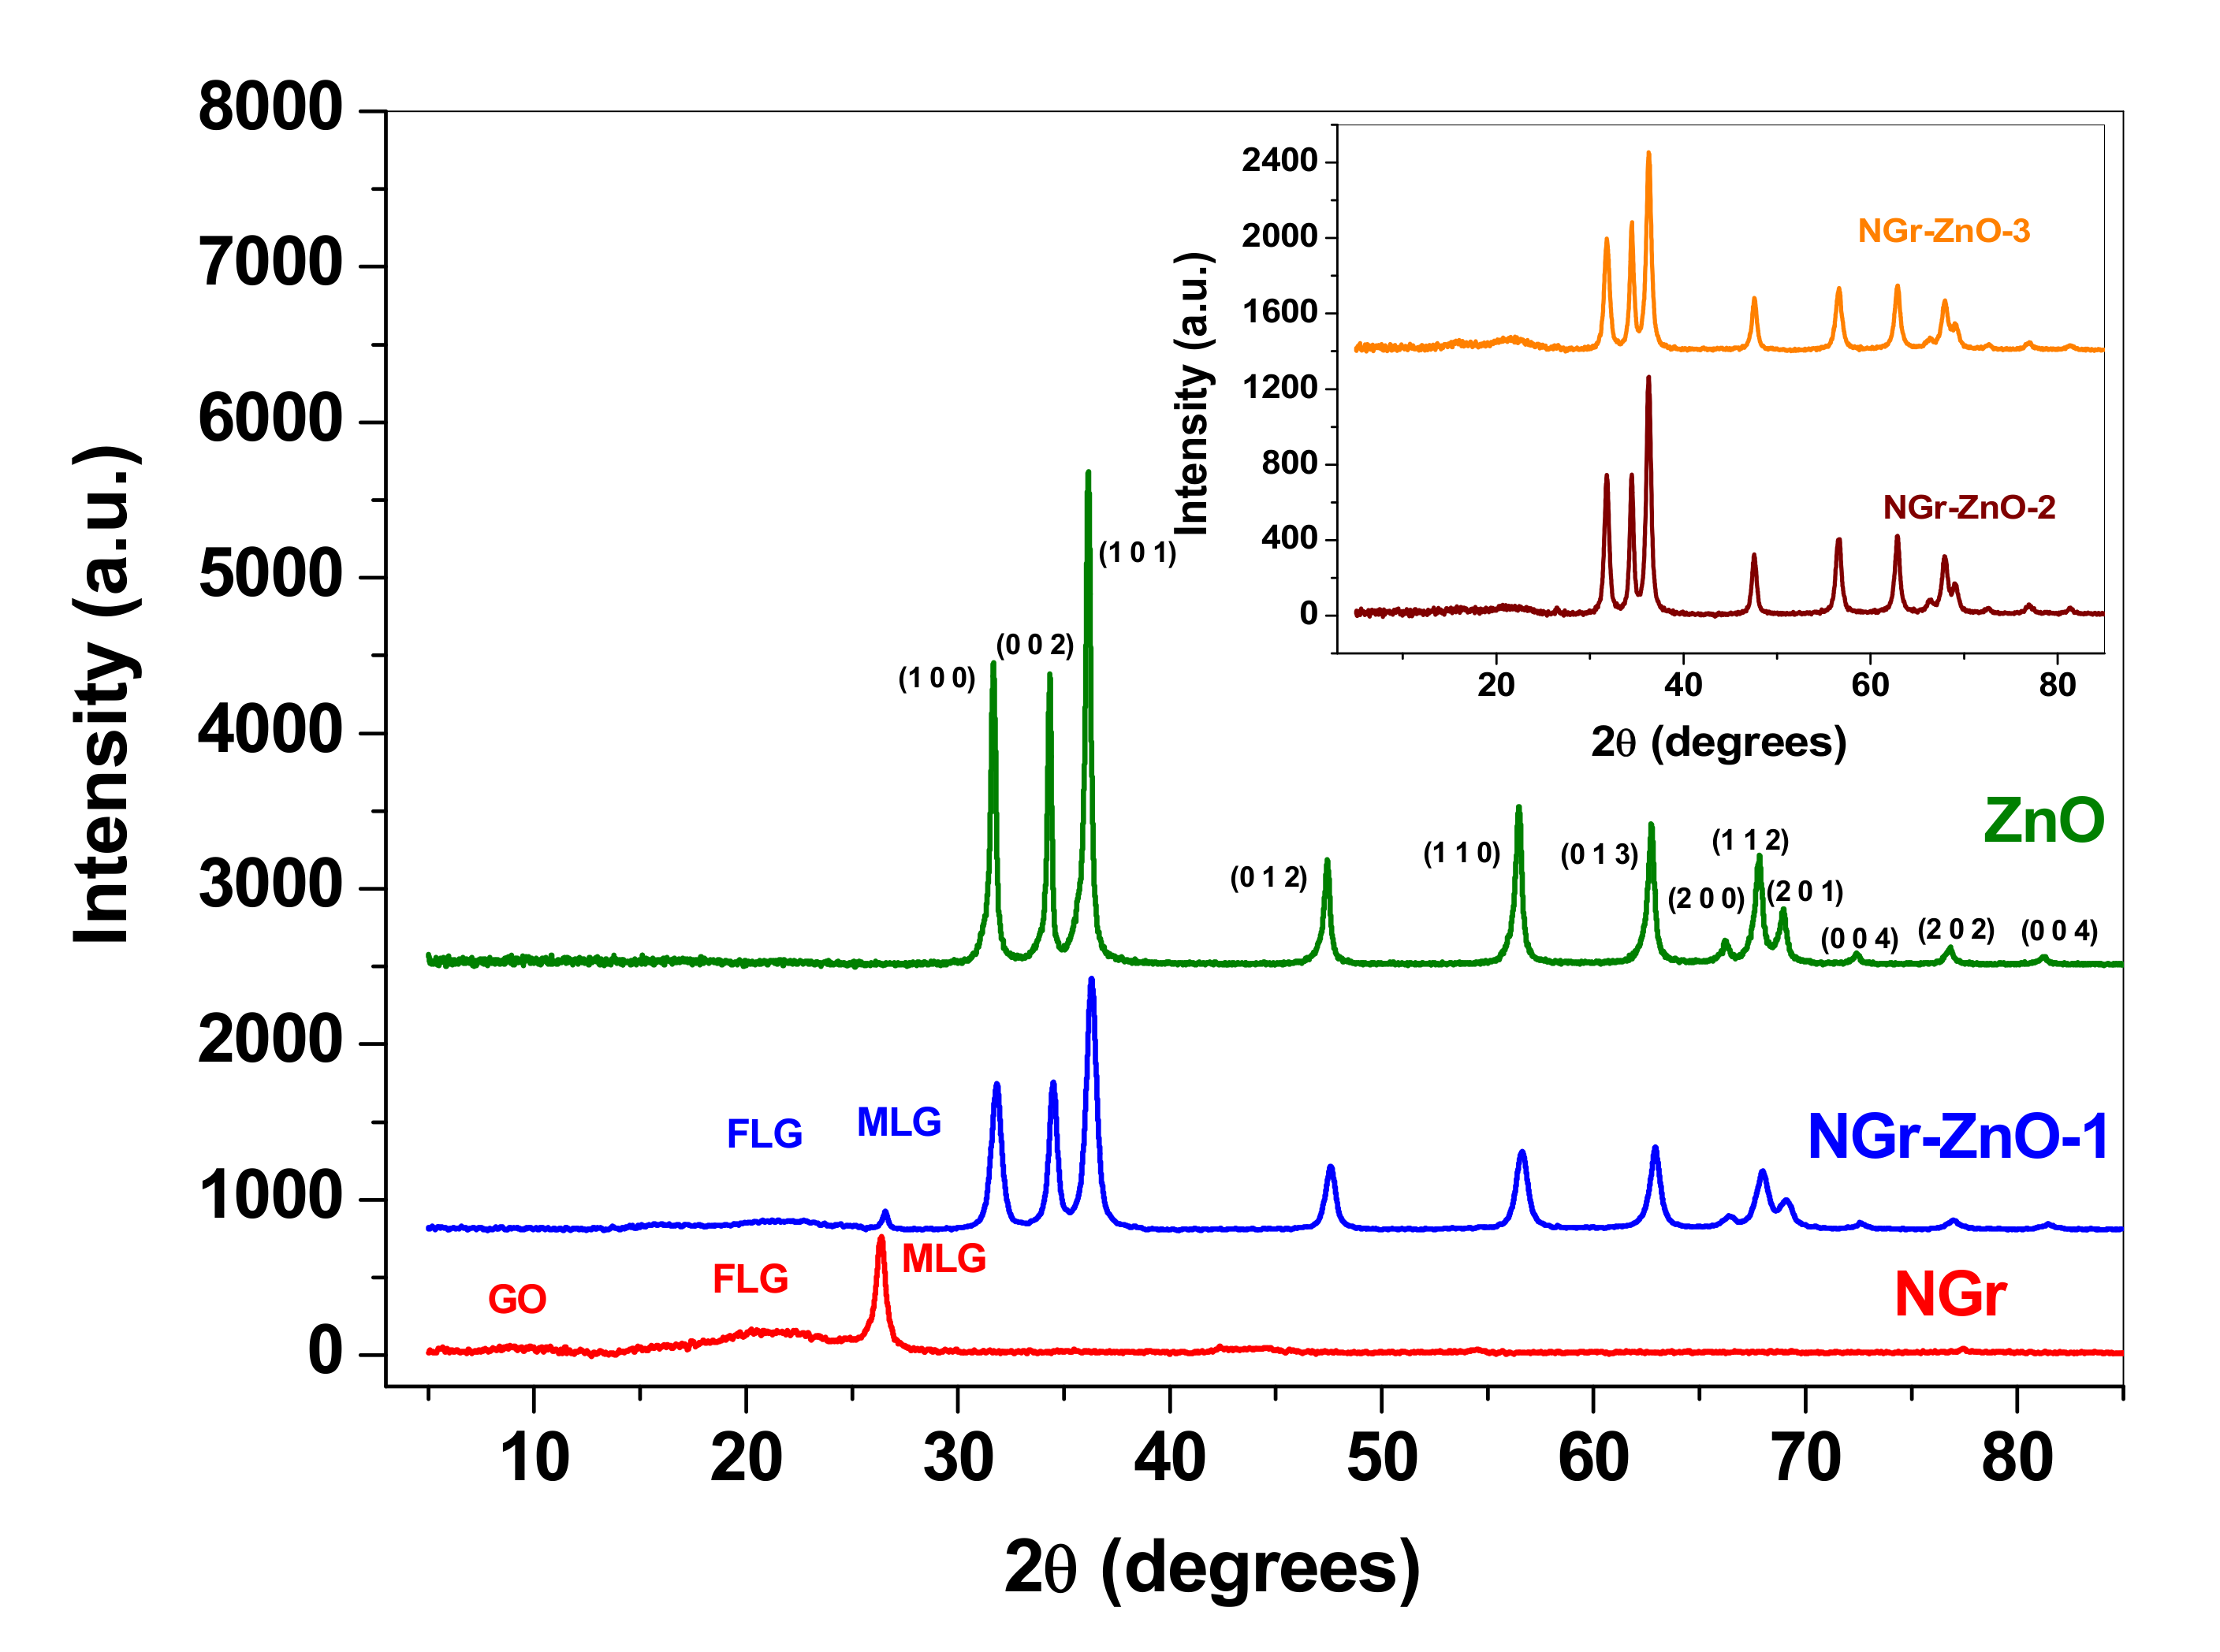
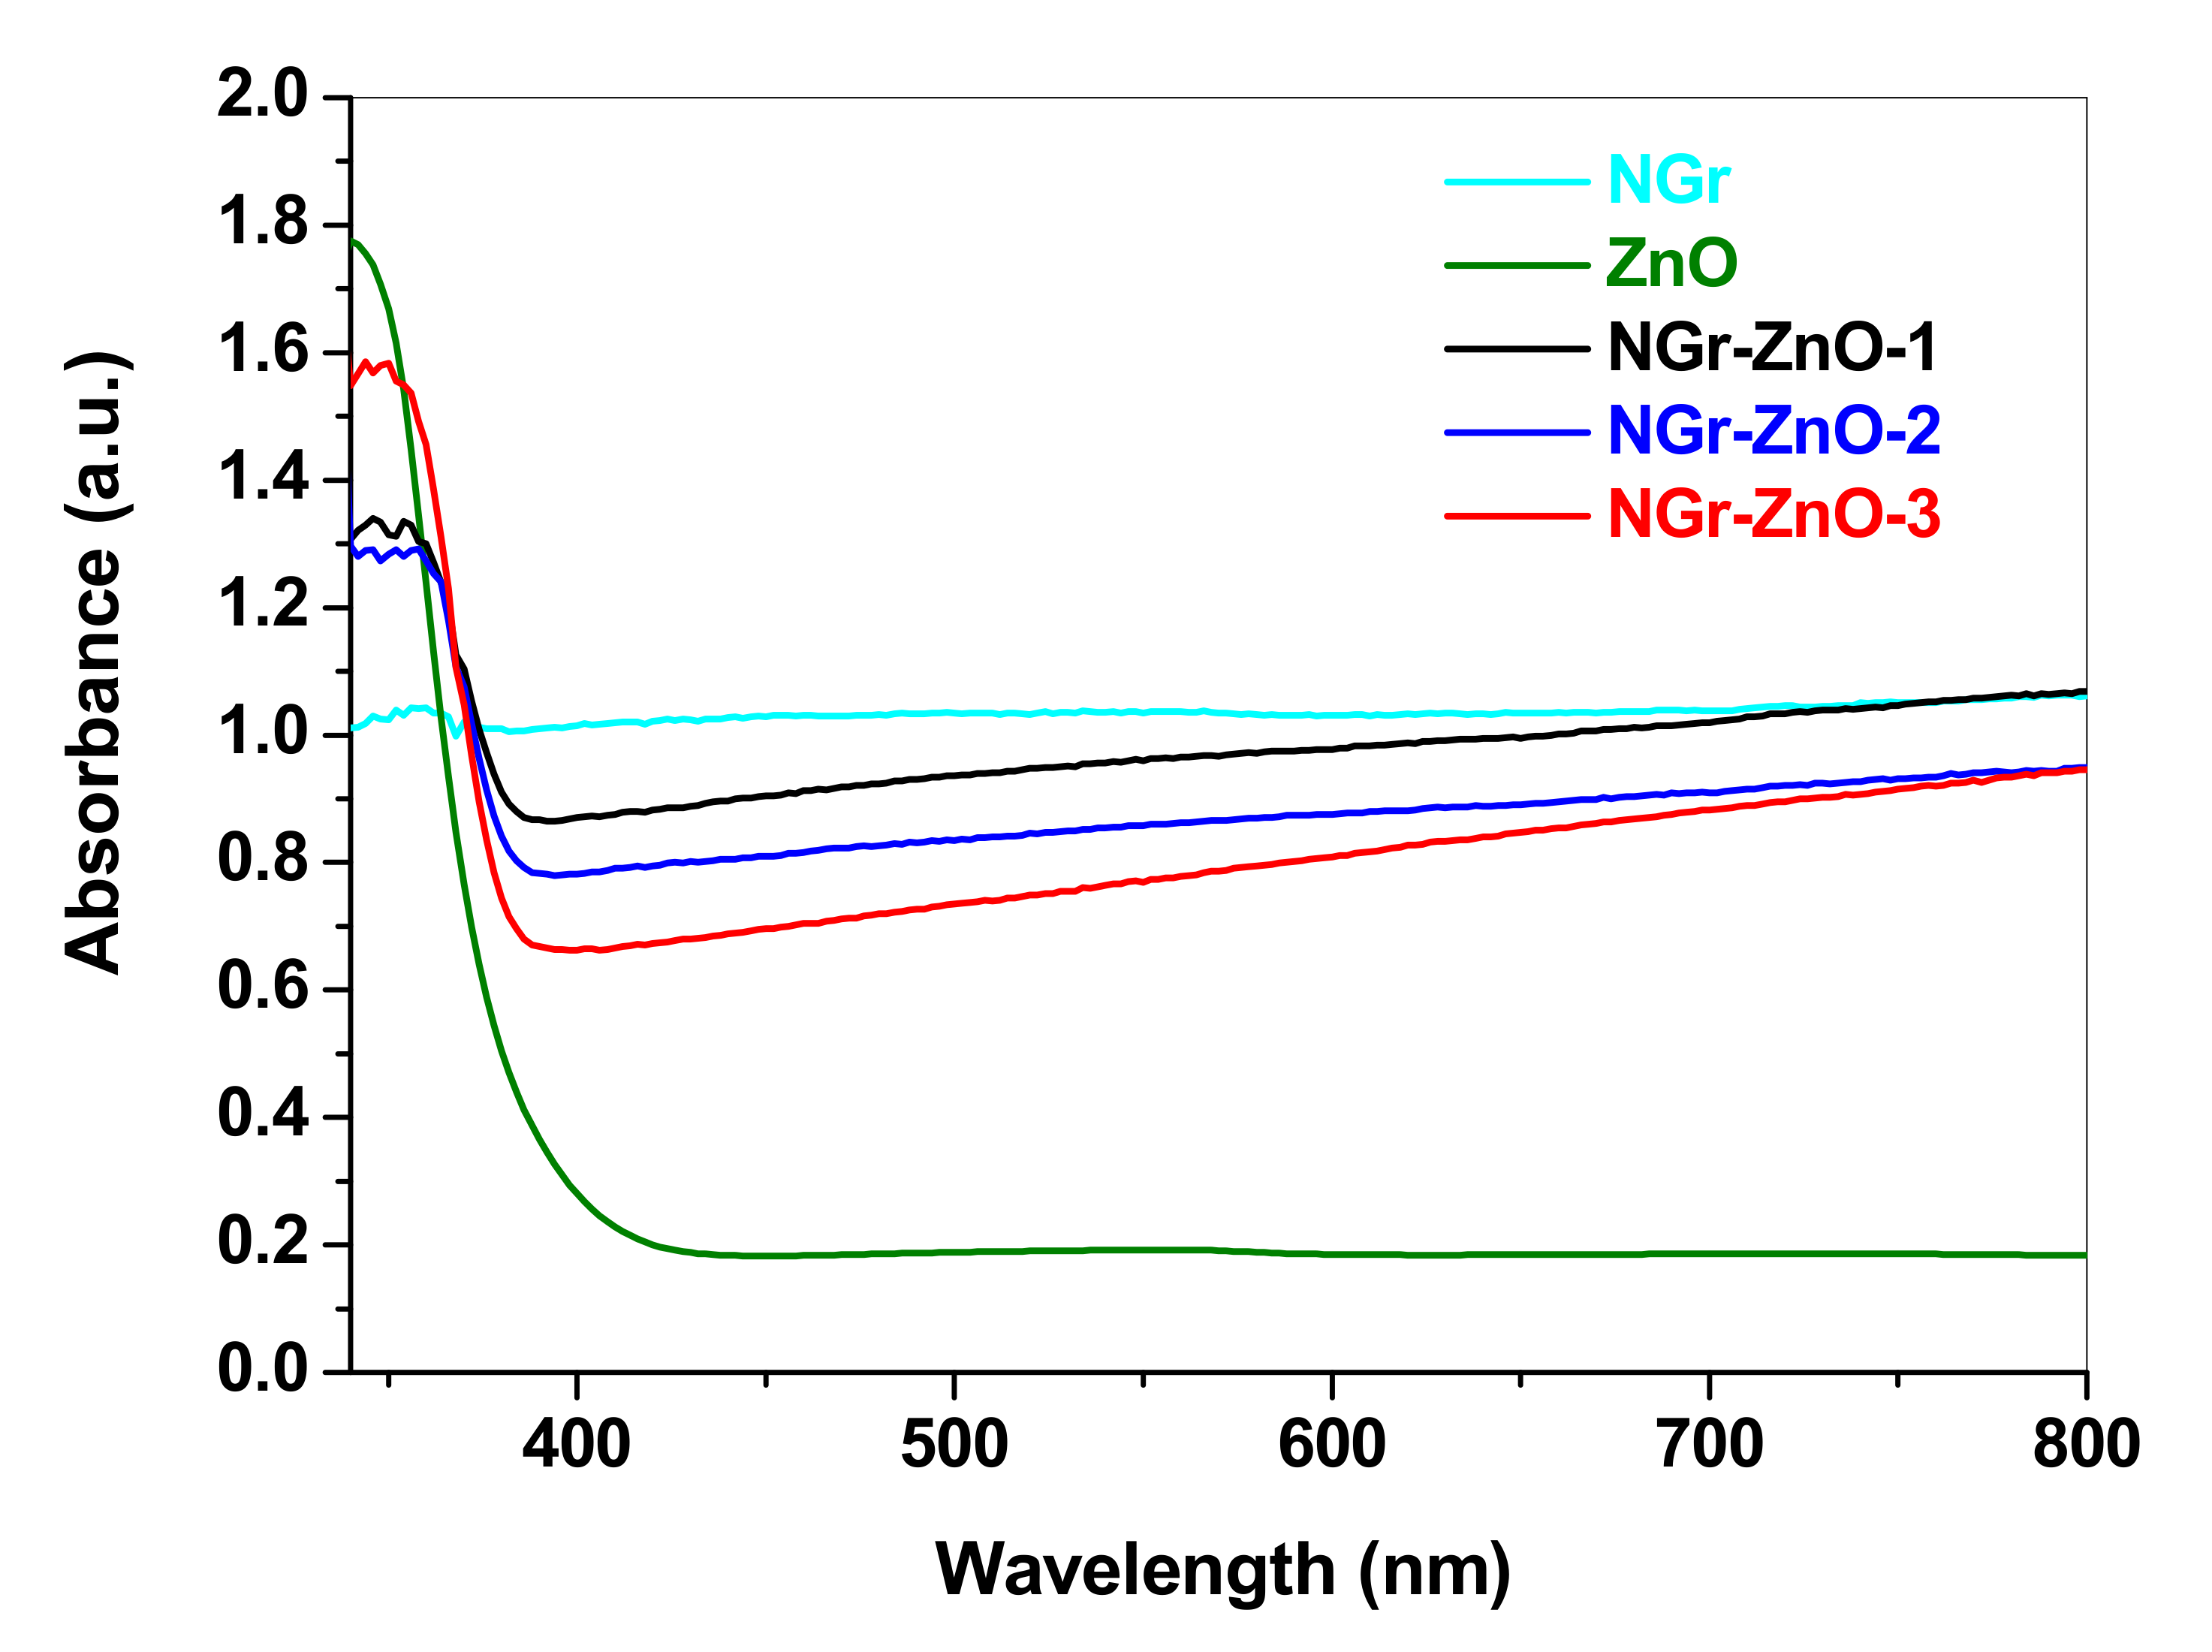
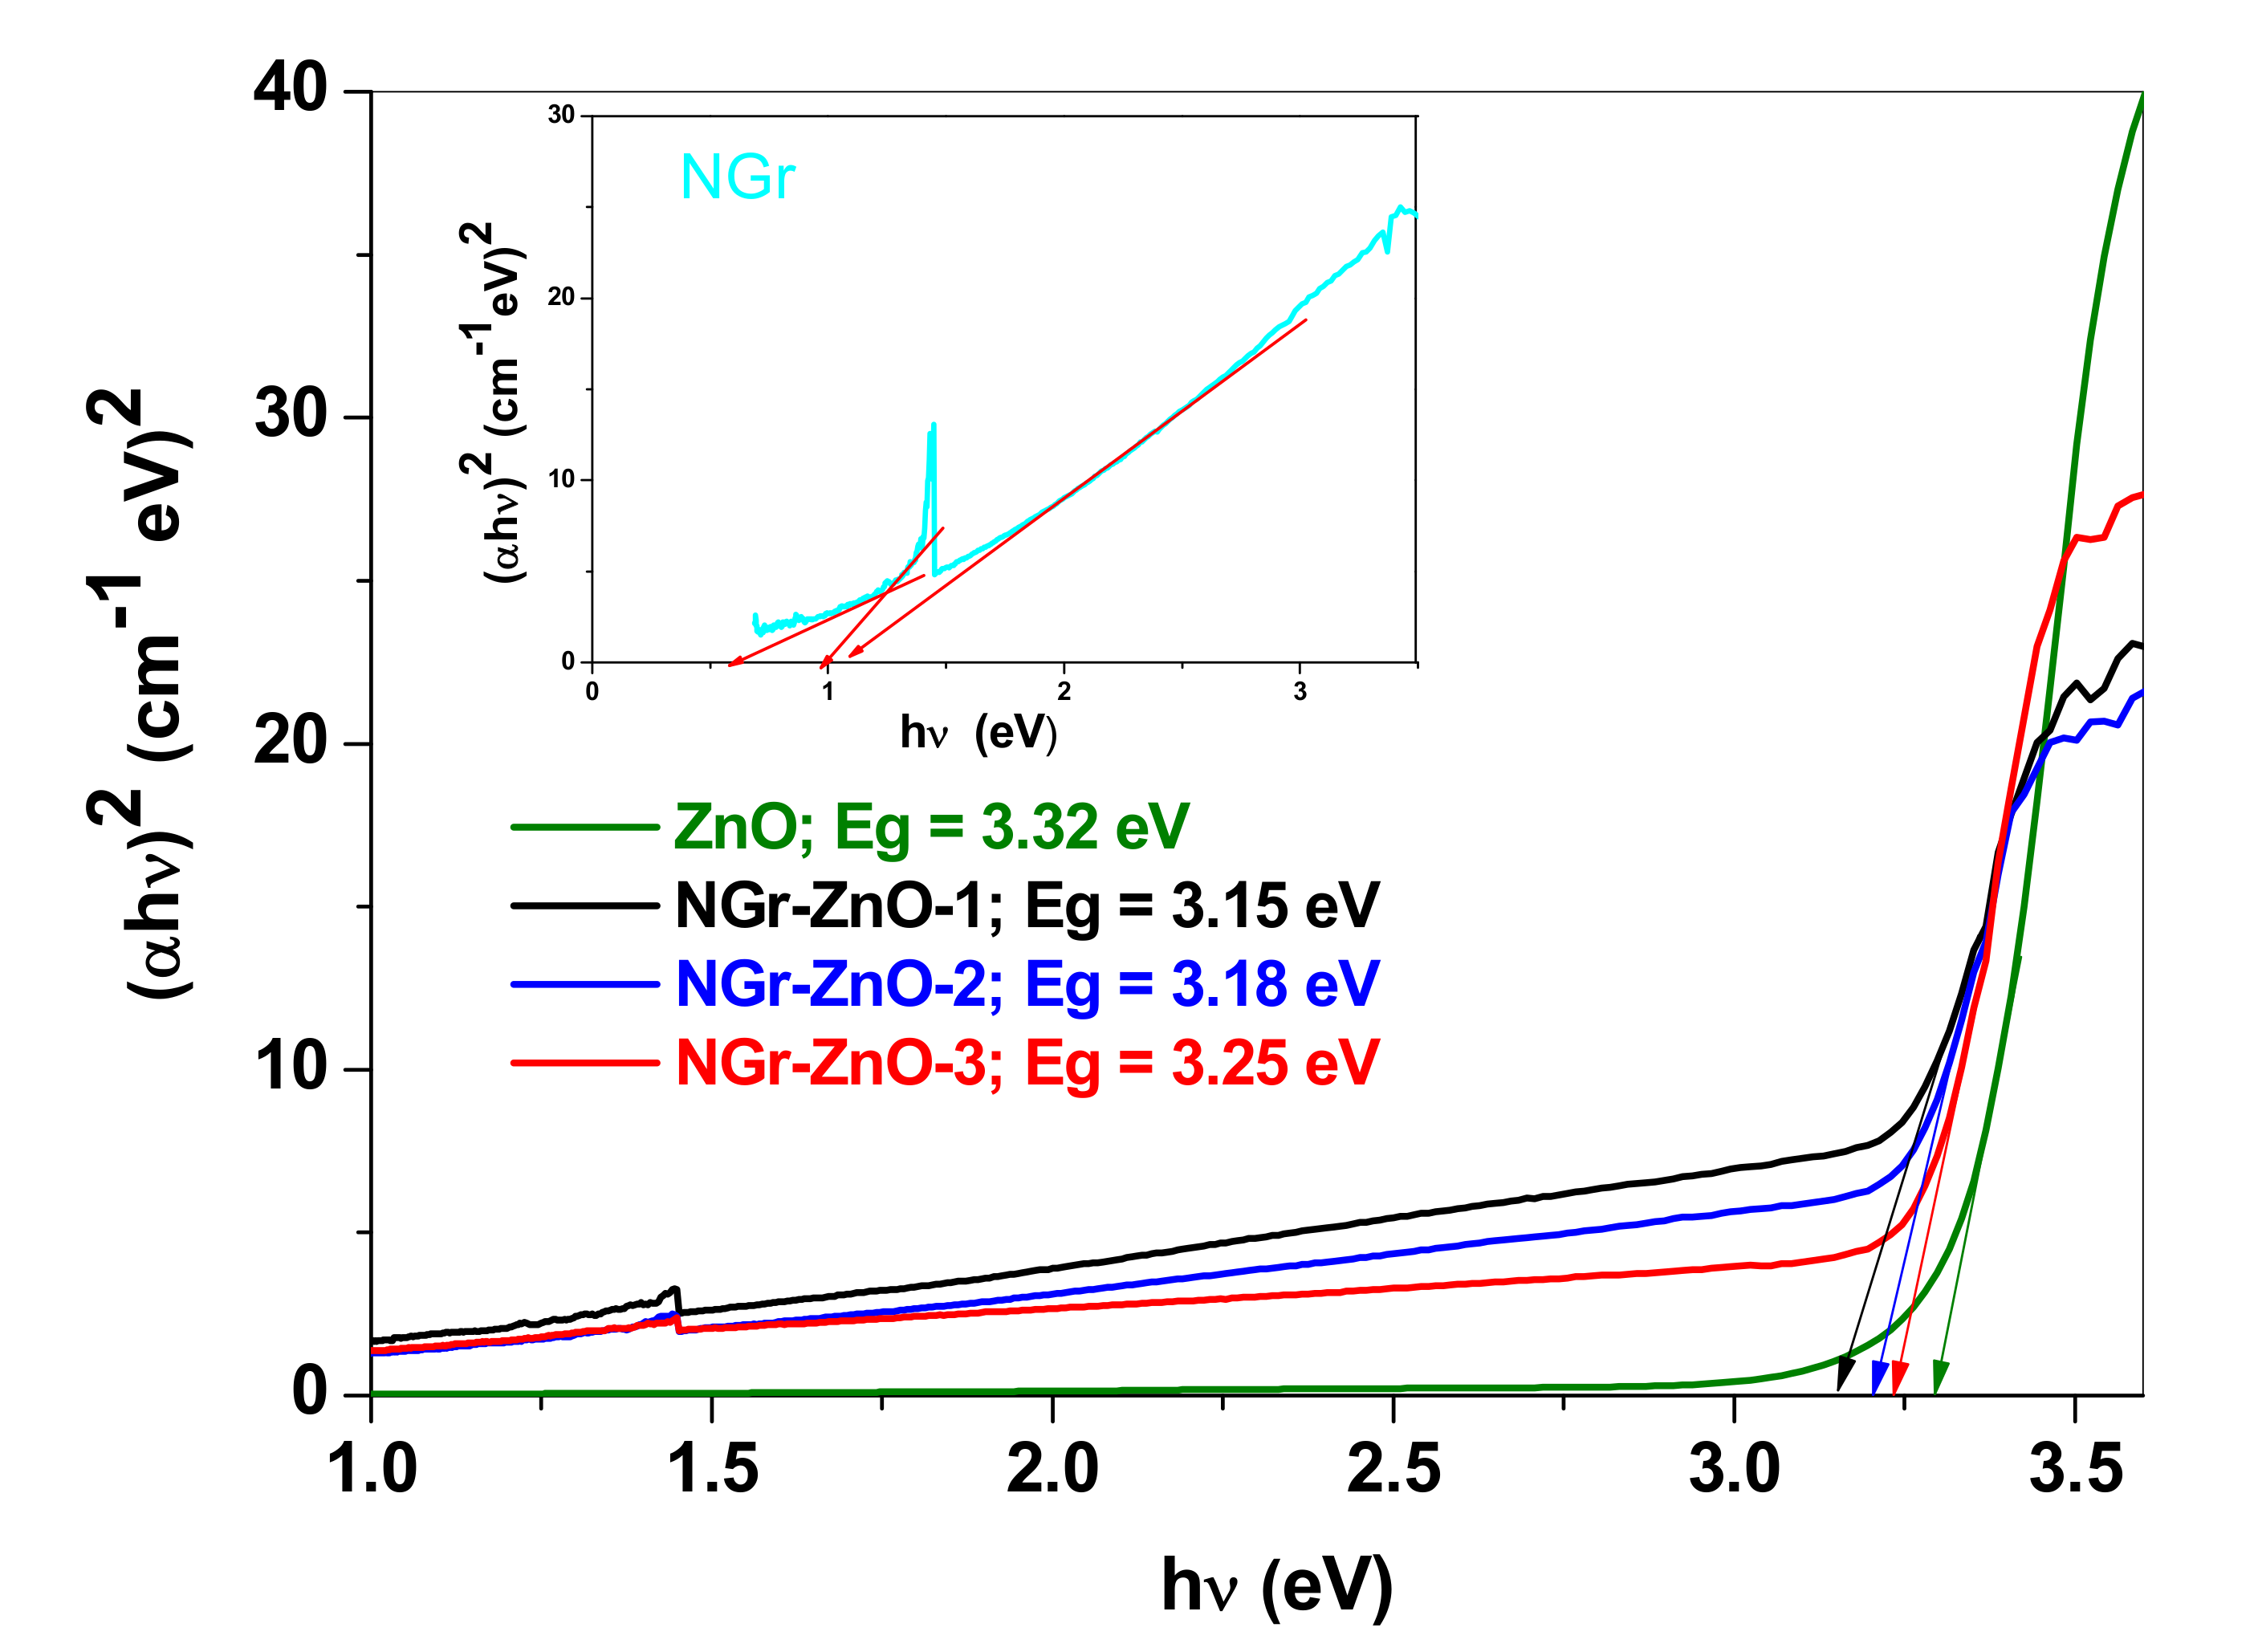
3.1. Morphological and Structural Characterization of the Materials
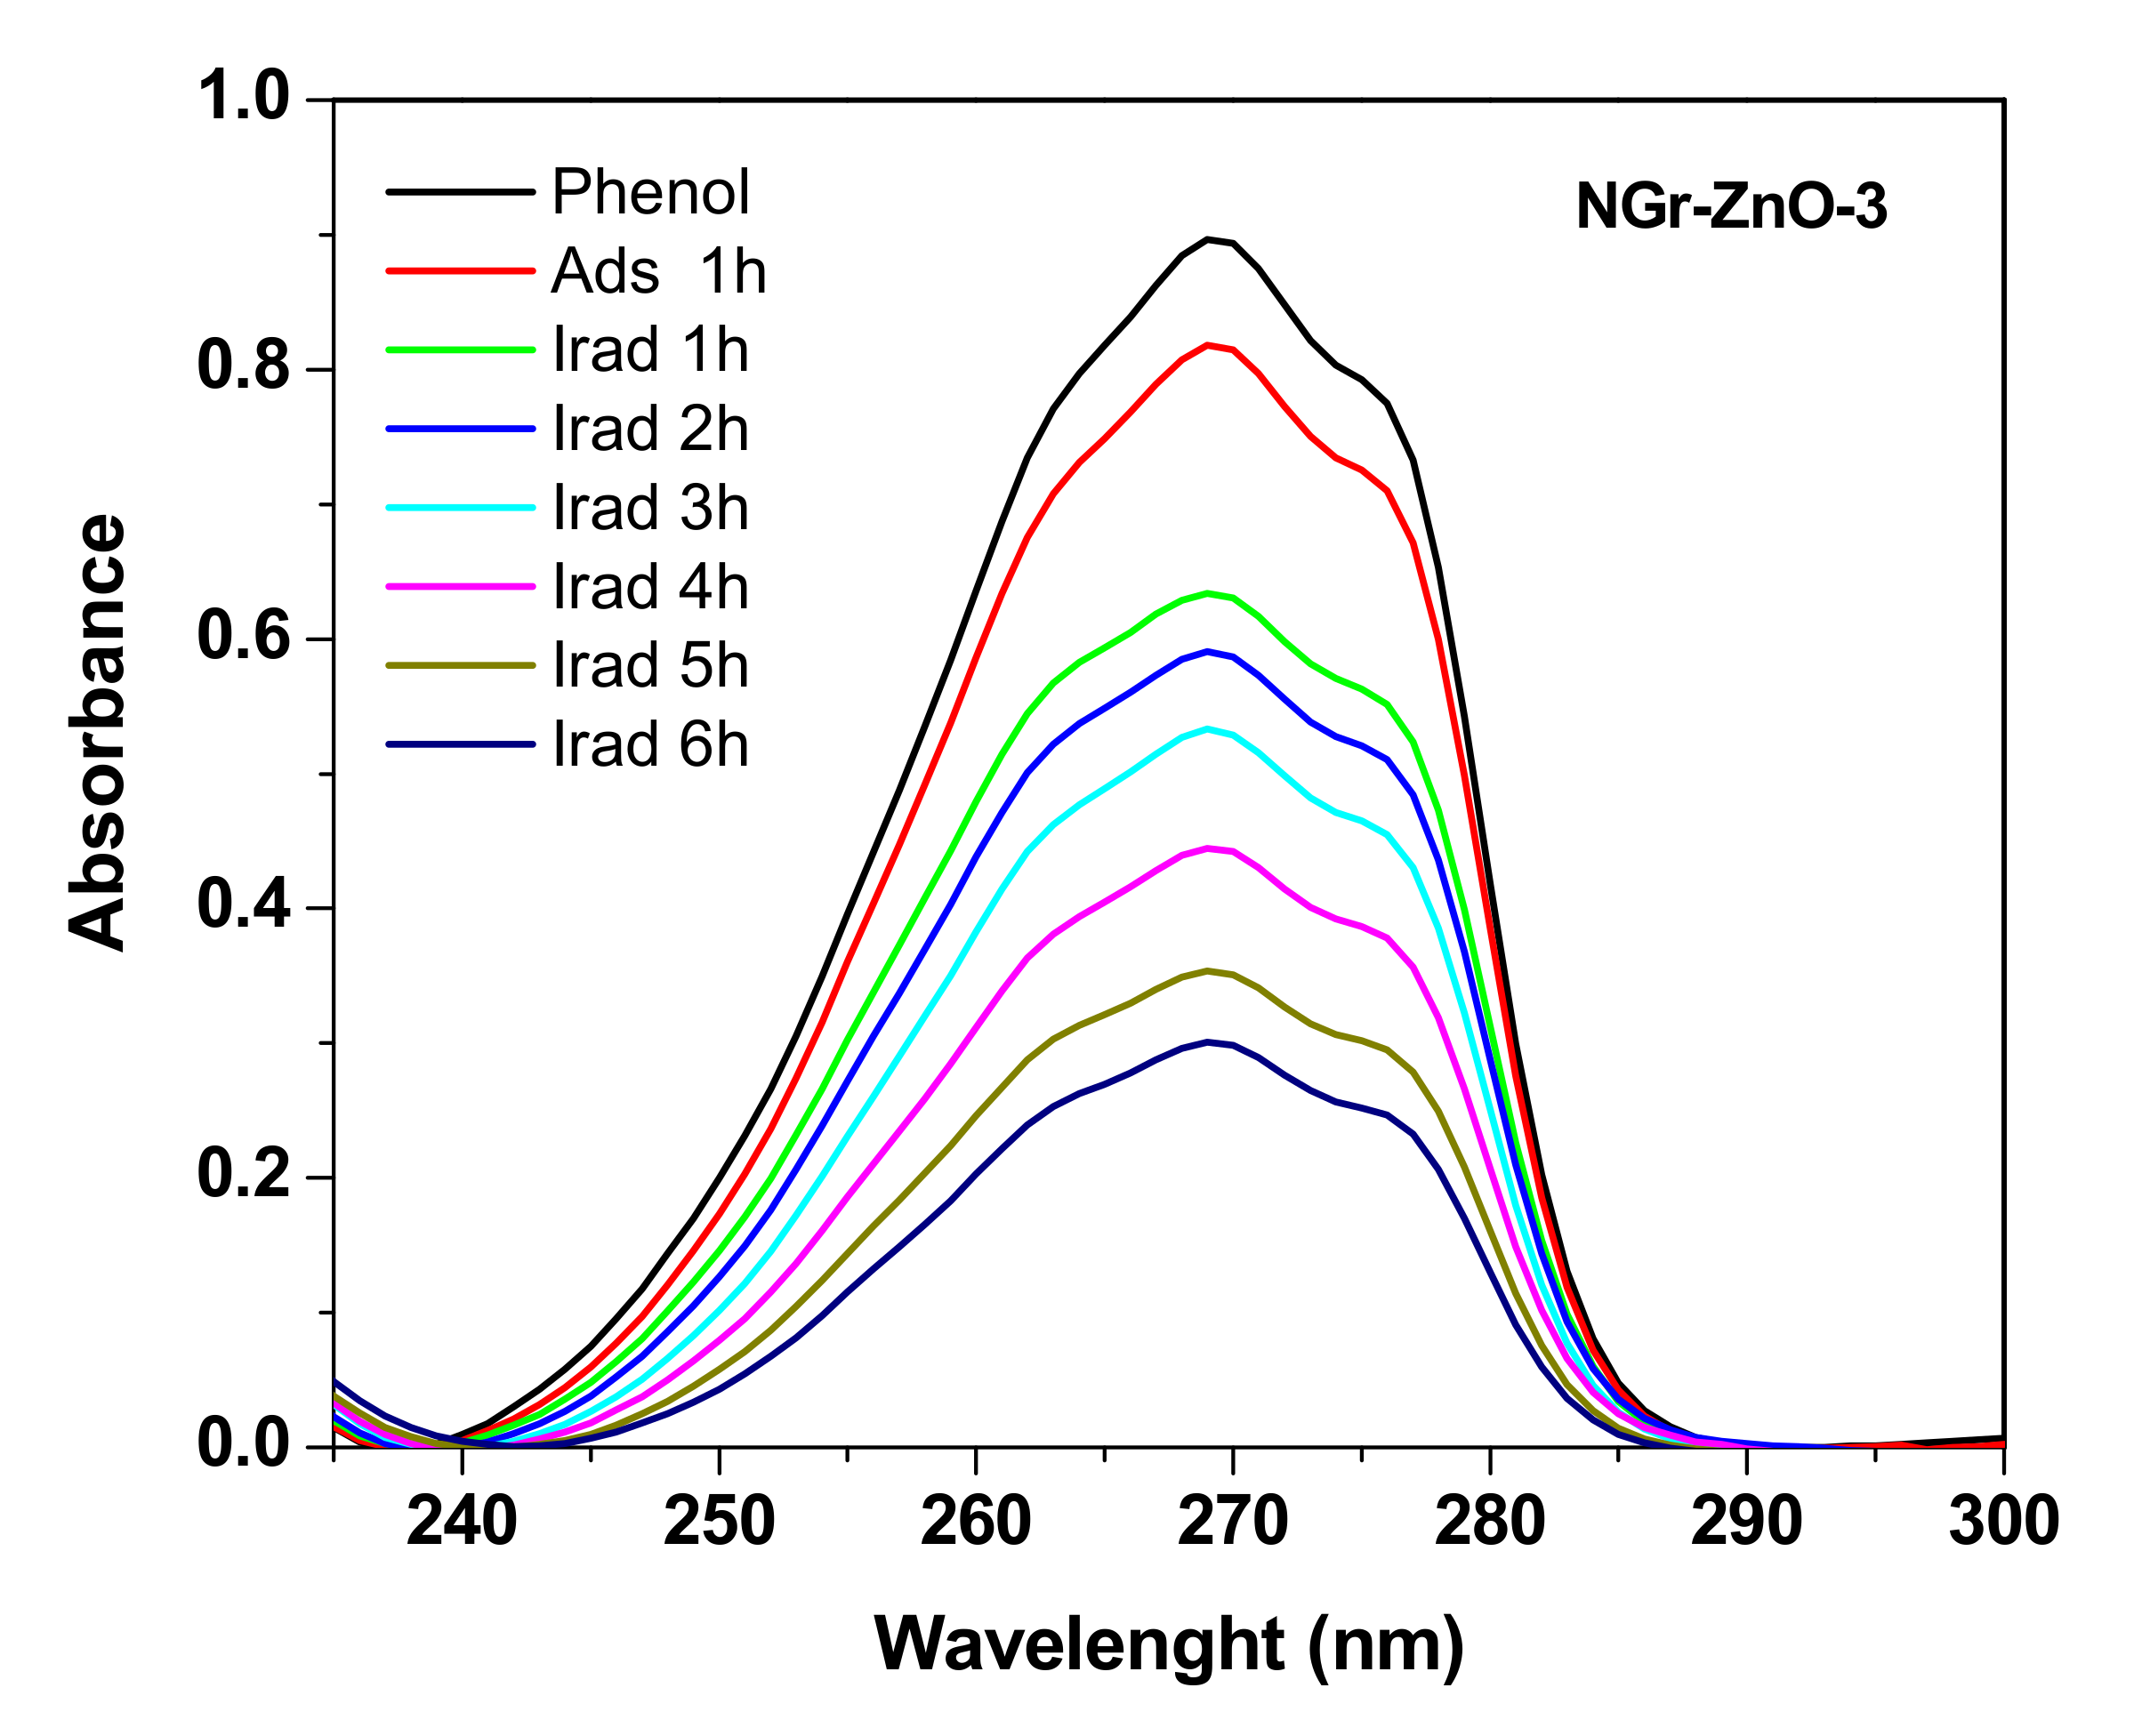
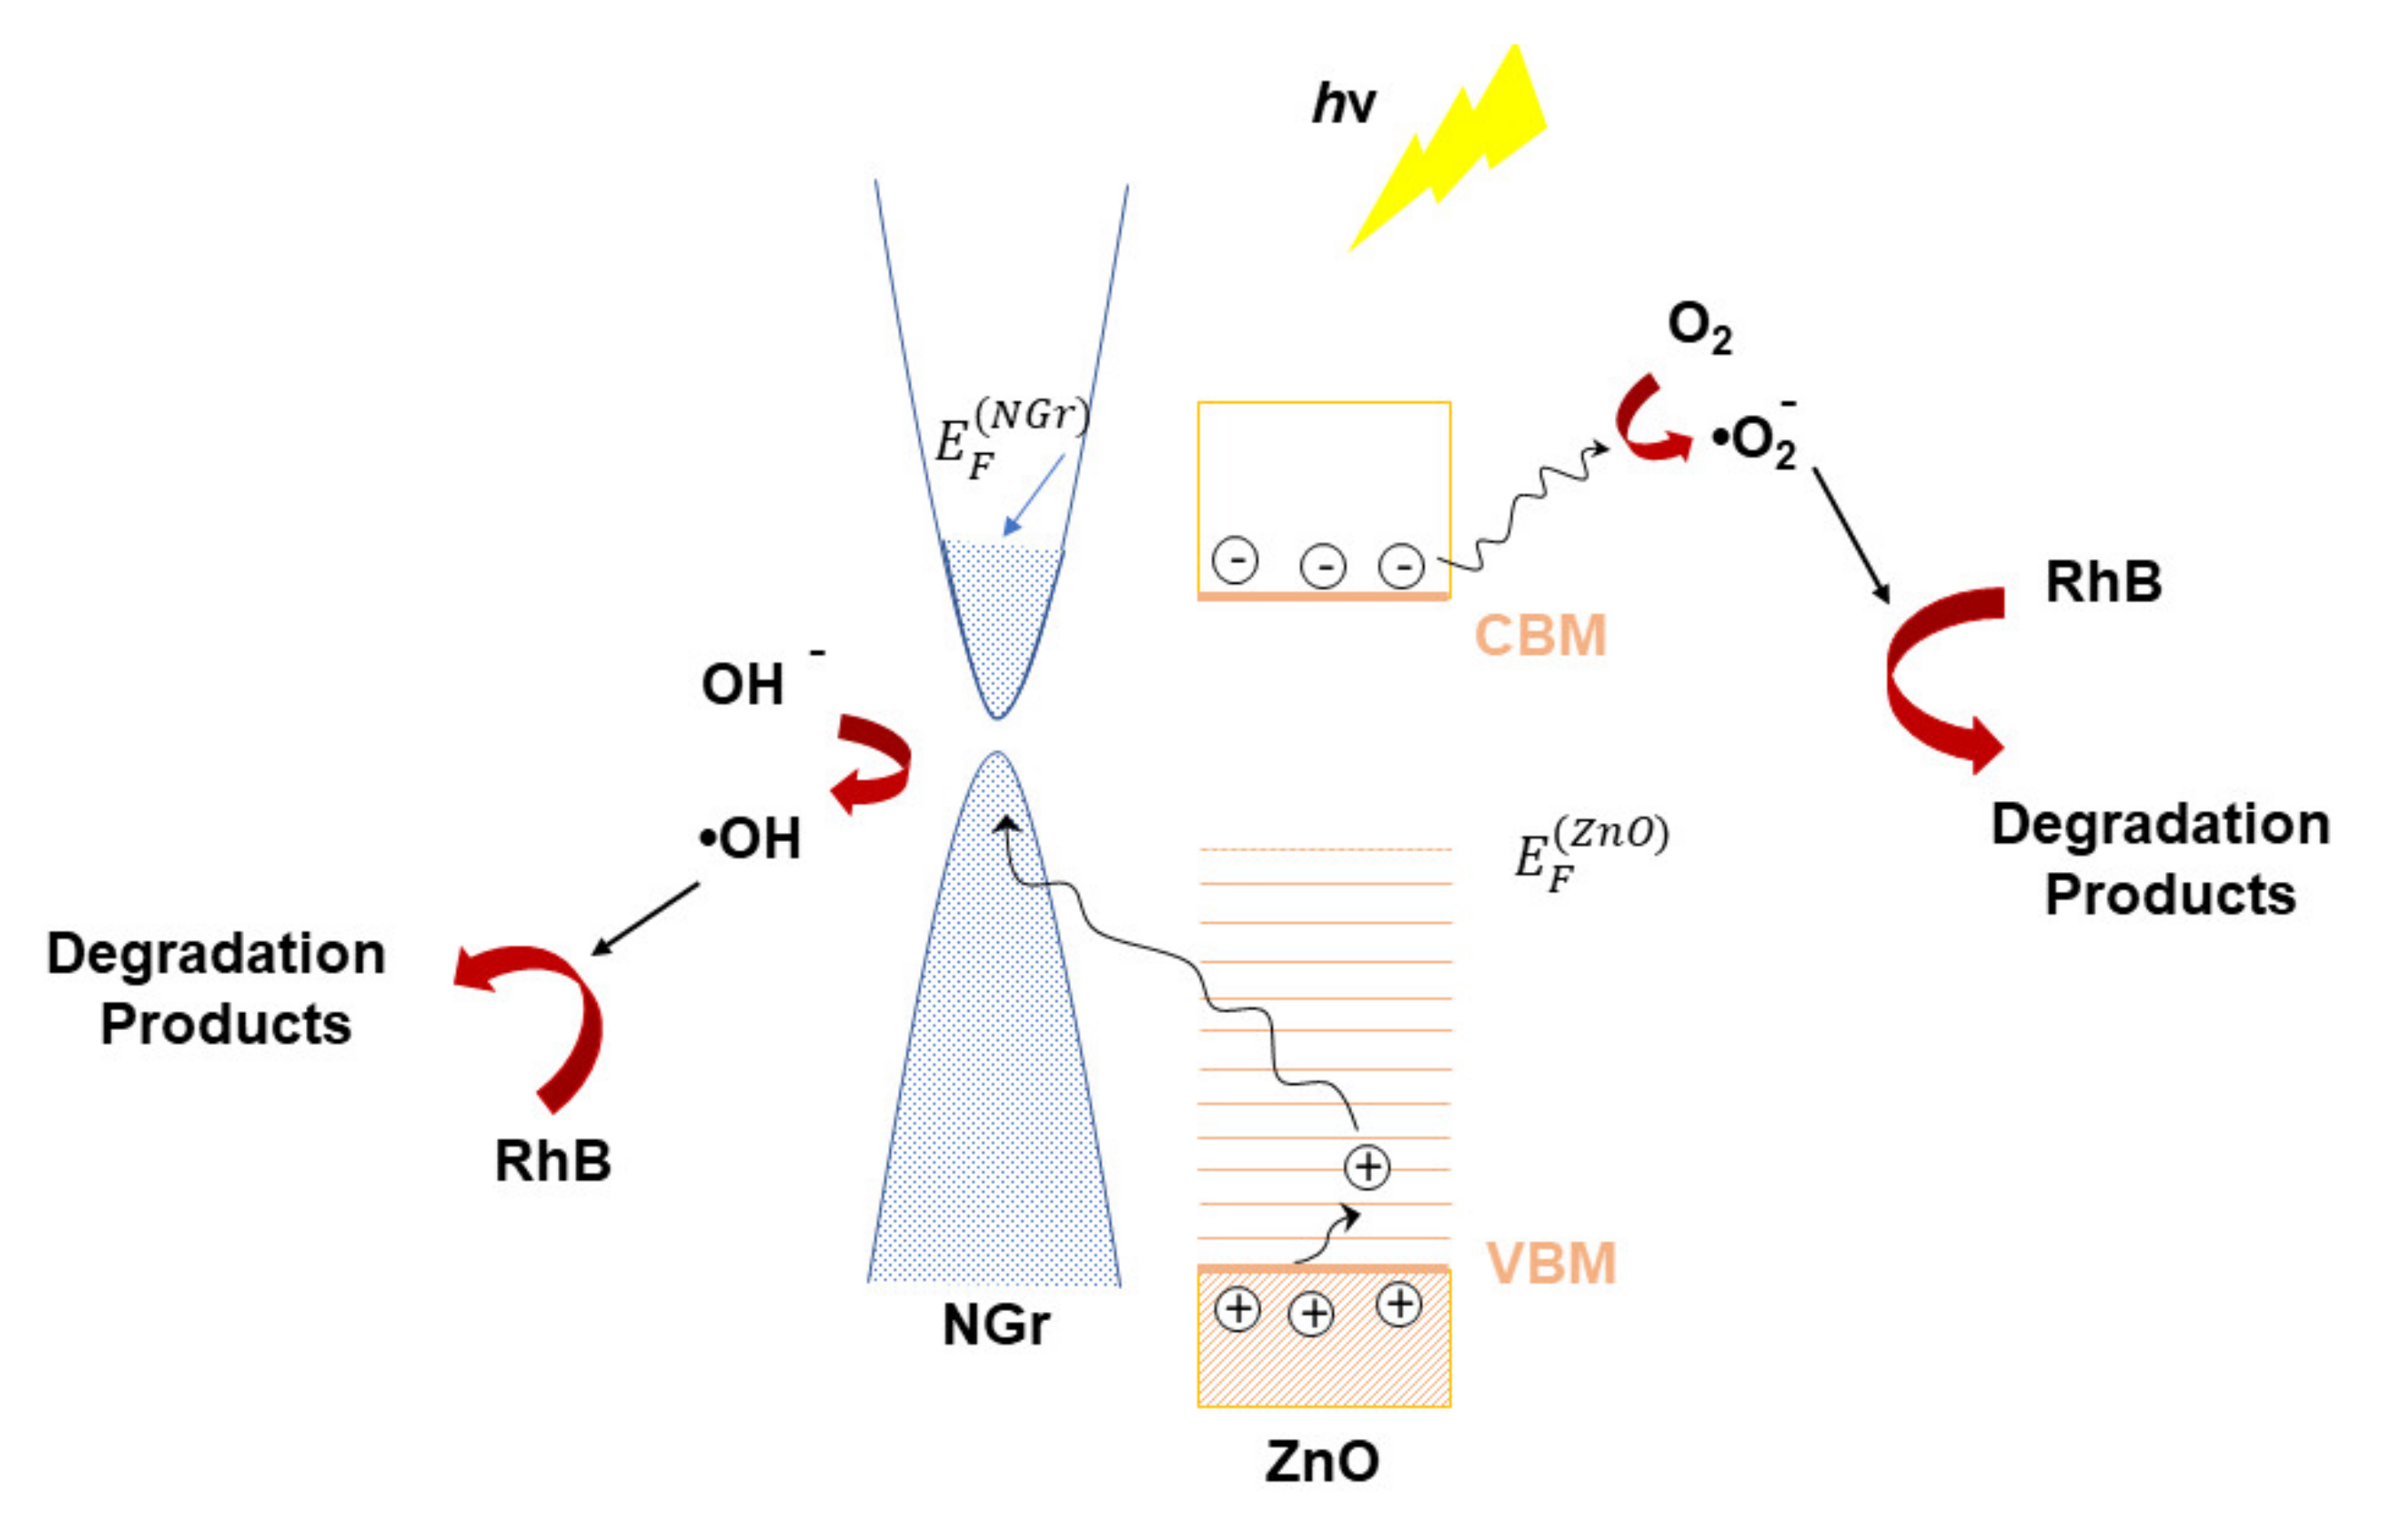
3.2. Photocatalytic Studies
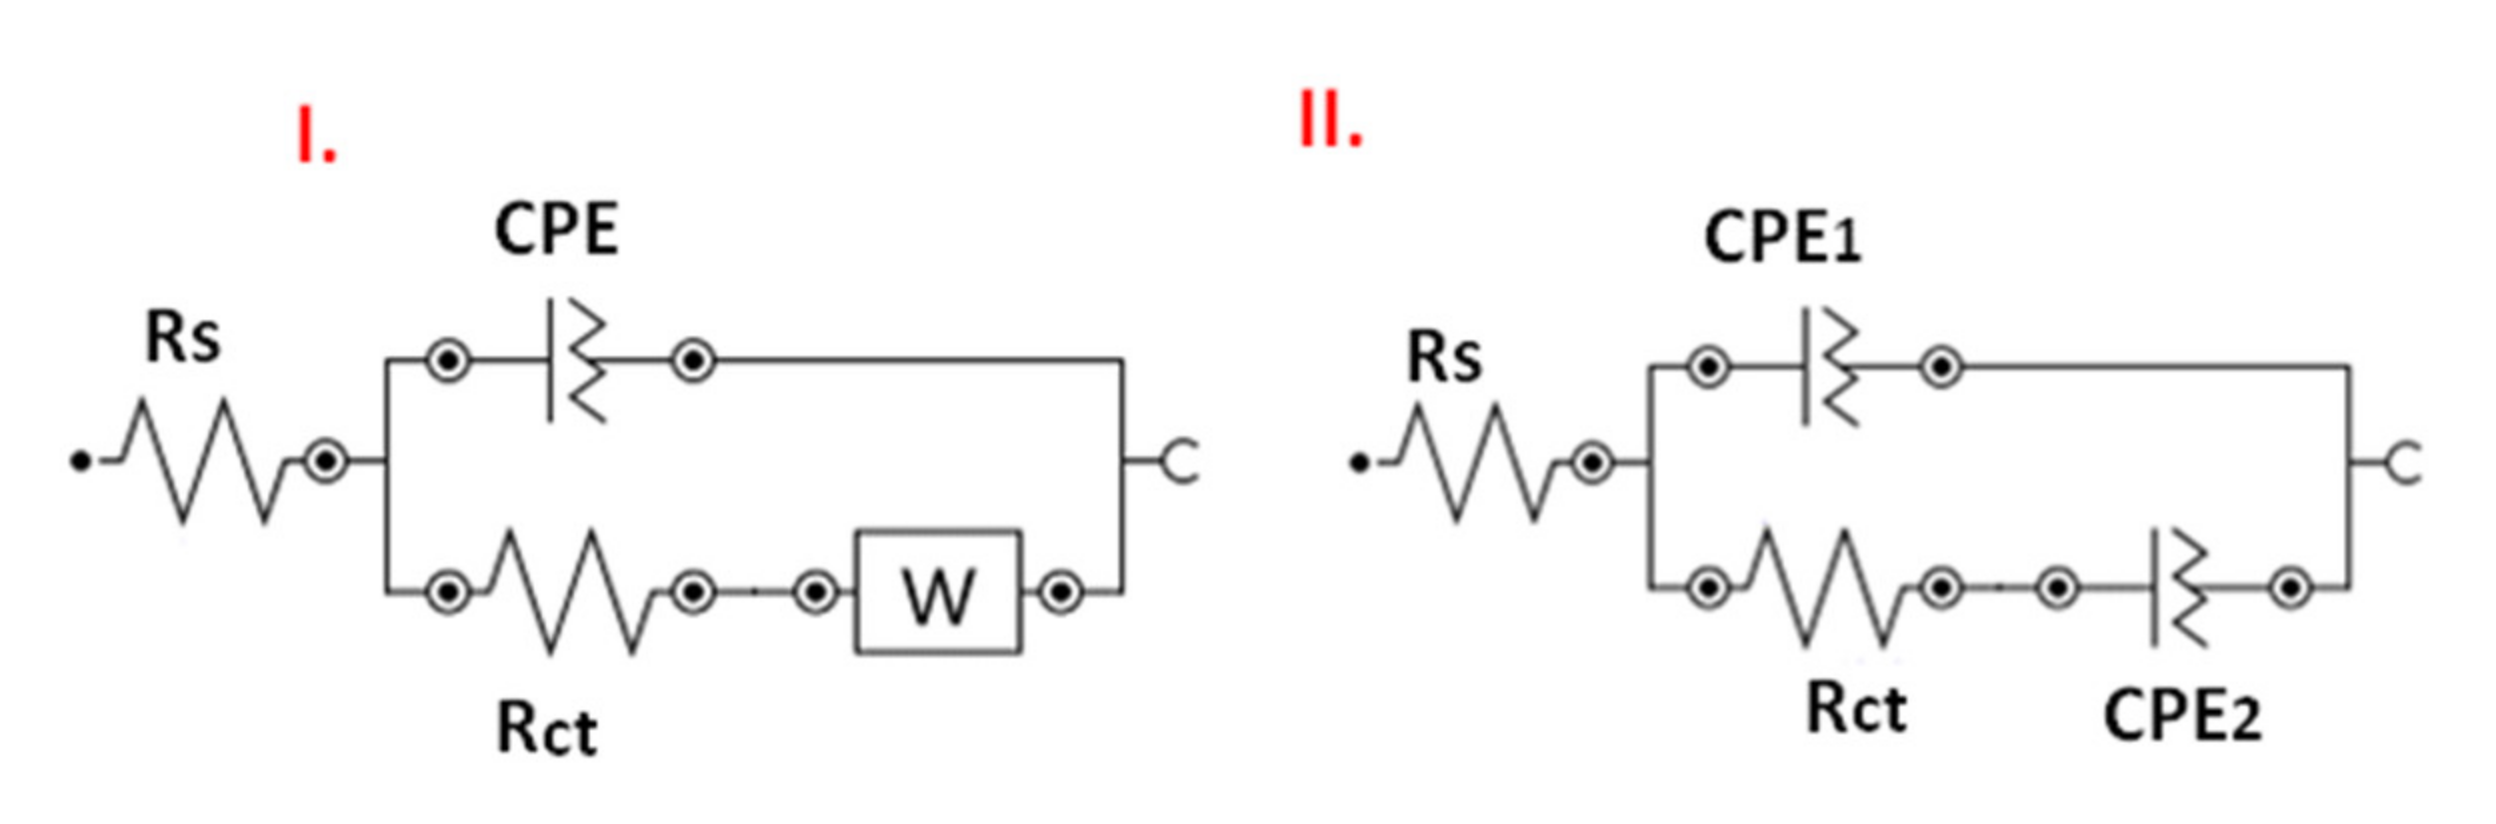
3.3. Electrochemical Studies
4. Conclusions
Author Contributions
Funding
Acknowledgments
Conflicts of Interest
References
- Smazna, D.; Shree, S.; Polonsky, O.; Lamaka, S.; Baum, M.; Zheludkevich, M.; Faupel, F.; Adelung, R.; Mishra, Y.K. Mutual interplay of ZnO micro- and nanowires and methylene blue during cyclic photocatalysis. J. Environ. Chem. Eng. 2019, 7, 103016. [Google Scholar] [CrossRef]
- Toloman, D.; Mesaros, A.; Popa, A.; Silipas, T.D.; Neamtu, S.; Katona, G. V-doped ZnO particles: Synthesis, structural, optical and photocatalytic properties. J. Mater. Sci. Mater. Electron. 2016, 27, 5691–5698. [Google Scholar] [CrossRef]
- Qi, K.; Cheng, B.; Yu, J.; Ho, W. Review on the improvement of the photocatalytic and antibacterial activities of ZnO. J. Alloys Compd. 2017, 727, 792–820. [Google Scholar] [CrossRef]
- Sa-nguanprang, S.; Phuruangrat, A.; Thongtem, T.; Thongtem, S. Characterization and photocatalysis of visible-light-driven Dy-doped ZnO nanoparticles synthesized by tartaric acid-assisted combustion method. Inorg. Chem. Commun. 2020, 117, 107944. [Google Scholar] [CrossRef]
- Velázquez-Nevárez, G.A.; Vargas-García, J.R.; Aguilar-Hernández, J.; Vega-Becerra, O.E.; Chen, F.; Shen, Q.; Zhang, L. Optical and electrical properties of (002)-oriented ZnO films prepared on amorphous substrates by sol-gel spin-coating. Mat. Res. 2016, 19, 113–117. [Google Scholar] [CrossRef]
- Moqbel, R.A.; Gondal, M.A.; Qahtan, T.F.; Dastageer, M.A. Pulsed laser synthesis in liquid of efficient visible-light-active ZnO/rGO nanocomposites for improved photo-catalytic activity. Mater. Res. Express. 2018, 5, 035050. [Google Scholar] [CrossRef]
- Jayachandiran, J.; Yesuraj, J.; Arivanandhan, M.; Raja, A.; Suthanthiraraj, S.A.; Jayavel, R.; Nedumaran, D. Synthesis and electrochemical studies of rGO/ZnO nanocomposite for supercapacitor application. J. Inorg. Organomet. Polym. Mater. 2018, 28, 2046–2055. [Google Scholar] [CrossRef]
- Brisebois, P.P.; Siaj, M. Harvesting graphene oxide-years 1859 to 2019: A review of its structure, synthesis, properties and exfoliation. J. Mater. Chem. C. 2020, 8, 1517–1547. [Google Scholar] [CrossRef]
- Tarcan, R.; Todor-Boer, O.; Petrovai, I.; Leordean, C.; Astilean, S.; Botiz, I. Reduced graphene oxide today. J. Mater. Chem. C. 2020, 8, 1198–1224. [Google Scholar] [CrossRef]
- Li, B.; Liu, T.; Wang, Y.; Wang, Z. ZnO/graphene-oxide nanocomposite with remarkably enhanced visible-light-driven photocatalytic performance. J. Colloid Interface Sci. 2012, 377, 114–121. [Google Scholar] [CrossRef]
- Jabeen, M.; Ishaq, M.; Song, W.; Xu, L.; Maqsood, I.; Deng, Q. UV-Assisted Photocatalytic Synthesis of ZnO-reduced graphene oxide nanocomposites with enhanced photocatalytic performance in degradation of Methylene Blue. ECS J. Solid State Sci. Technol. 2017, 6, M36–M43. [Google Scholar] [CrossRef]
- Alam, N.S.; Sharma, N.; Kumar, L. Synthesis of graphene oxide (GO) by modified hummers method and its thermal reduction to obtain reduced graphene oxide (rGO)*. Graphene 2017, 6, 1–18. [Google Scholar] [CrossRef]
- Parul, K.K.; Badru, R.; Singh, P.P.; Kaushal, S. Photodegradation of organic pollutants using heterojunctions: A review. J. Environ. Chem. Eng. 2020, 8, 103666. [Google Scholar] [CrossRef]
- Liu, F.; Wang, C.; Sui, X.; Riaz, M.A.; Xu, M.; Wei, L.; Chen, Y. Synthesis of graphene materials by electrochemical exfoliation: Recent progress and future potential. Carbon Energy 2019, 1, 173–199. [Google Scholar] [CrossRef]
- Pogacean, F.; Coros, M.; Magerusan, L.; Mirel, V.; Turza, A.; Katona, G.; Stefan-van Staden, R.I.; Pruneanu, S. Exfoliation of graphite rods via pulses of current for graphene synthesis: Sensitive detection of 8-hydroxy-2′-deoxyguanosine. Talanta 2019, 196, 182–190. [Google Scholar] [CrossRef] [PubMed]
- Kindalkar, V.S.; Sandeep, K.M.; Kumara, K.; Dharmaprakash, S.M. Sol-gel synthesized spin coated GO: ZnO composite thin films: Optical, structural and electrical studies. Mater. Res. Express 2019, 6, 096435. [Google Scholar] [CrossRef]
- Chu, H.O.; Wang, Q.; Shi, Y.J.; Song, S.G.; Liu, W.G.; Zhou, S.; Gibson, D.; Alajlani, Y.; Li, C. Structural, optical properties and optical modelling of hydrothermal chemical growth derived ZnO nanowires. Trans. Nonferrous Met. Soc. China (Engl. Ed.) 2020, 30, 191–199. [Google Scholar] [CrossRef]
- Liu, X.; Pan, L.; Lv, T.; Lu, T.; Zhu, G.; Sun, Z.; Sun, C. Microwave-assisted synthesis of ZnO-graphene composite for photocatalytic reduction of Cr(VI). Catal. Sci. Technol. 2011, 1, 1189–1193. [Google Scholar] [CrossRef]
- Jana, A.; Gregory, D.H. Microwave-assisted synthesis of ZnO-rGO core-shell nanorod hybrids with photo- and electro-catalytic activity. Chem. Eur. J. 2020, 26. [Google Scholar] [CrossRef]
- Zhang, W.; Yang, Y.; Ziemann, E.; Be’Er, A.; Bashouti, M.Y.; Elimelech, M.; Bernstein, R. One-step sonochemical synthesis of a reduced graphene oxide-ZnO nanocomposite with antibacterial and antibiofouling properties. Environ. Sci. Nano 2019, 6, 3080–3090. [Google Scholar] [CrossRef]
- Louis, J.; Kavitha, M.K.; Anjana, V.; Jayaraj, M.; John, H. A facile surfactant assisted hydrothermal synthesis of ZnO and graphene loaded ZnO for efficient photocatalytic self-cleaning. Mater. Res. Express 2020, 6, 12501250i4. [Google Scholar] [CrossRef]
- Lonkar, S.P.; Pillai, V.; Abdala, A. Solvent-free synthesis of ZnO-graphene nanocomposite with superior photocatalytic activity. Appl. Surf. Sci. 2019, 465, 1107–1113. [Google Scholar] [CrossRef]
- Wang, L.; Li, Z.; Chen, J.; Huang, Y.; Zhang, H.; Qiu, H. Enhanced photocatalytic degradation of methyl orange by porous graphene/ZnO nanocomposite. Environ. Pollut. 2019, 249, 801–811. [Google Scholar] [CrossRef] [PubMed]
- Ramanathan, S.; Selvin, S.P.; Obadiah, A.; Durairaj, A.; Santhoshkumar, P.; Lydia, S.; Ramasundaram, S.; Vasanthkumar, S. Synthesis of reduced graphene oxide/ZnO nanocomposites using grape fruit extract and Eichhornia crassipes leaf extract and a comparative study of their photocatalytic property in degrading Rhodamine B dye. J. Environ. Heal. Sci. Eng. 2019, 17, 195–207. [Google Scholar] [CrossRef] [PubMed]
- Anandkumar, J.; Mandal, B. Adsorption of chromium(VI) and Rhodamine B by surface modified tannery waste: Kinetic, mechanistic and thermodynamic studies. J. Hazard. Mater. 2011, 186, 1088–1096. [Google Scholar] [CrossRef]
- Umar, M.; Aziz, H.A. Photocatalytic degradation of organic pollutants in water. In Organic Pollutants—Monitoring, Risk and Treatment; Rashed, N.M., Ed.; InTech: Rijeka, Croatia, 2013; Volume 8, pp. 196–197. [Google Scholar] [CrossRef]
- Zhang, Y.-N.; Niu, Q.; Gu, X.; Yang, N.; Zhao, G. Recent progress on carbon nanomaterials for the electrochemical detection and removal of environmental pollutants. Nanoscale 2019, 11, 11992–12014. [Google Scholar] [CrossRef]
- Król, A.; Pomastowski, P.; Rafińska, K.; Railean-Plugaru, V.; Buszewski, B. Zinc oxide nanoparticles: Synthesis, antiseptic activity and toxicity mechanism. Adv. Colloid. Interface Sci. 2017, 249, 37–52. [Google Scholar] [CrossRef]
- Zhong, L.; Liu, H.; Samal, M.; Yun, K. Synthesis of ZnO nanoparticles-decorated spindle-shaped graphene oxide for application in synergistic antibacterial activity. J. Photochem. Photobiol. B Boil. 2018, 183, 293–301. [Google Scholar] [CrossRef]
- Cumpson, P.J.; Seah, M.P. Elastic scattering corrections in AES and XPS II. Estimating attenuation lengths and conditions required for their valid use in overlayer/substrate experiments. Surf. Interface Anal. 1997, 25, 430–446. [Google Scholar] [CrossRef]
- Garcia-Martinez, O.; Rojas, R.; Vila, E.; Devidales, J. Microstructural characterization of nanocrystals of ZnO and CuO obtained from basic salts. Solid State Ionics 1993, 63, 442–449. [Google Scholar] [CrossRef]
- Kraus, W.; Nolzeb, G. POWDER CELL—A program for the representation and manipulation of crystal structures and calculation of the resulting X-ray powder patterns. J. Appl. Crystallogr. 1996, 29, 301–303. [Google Scholar] [CrossRef]
- Hao, C.; Yang, Y.; Shen, Y.; Feng, F.; Wang, X.; Zhao, Y.; Ge, C. Liquid phase-based ultrasonic-assisted synthesis of G–ZnO nanocomposites and its sunlight photocatalytic activity. Mater. Des. 2016, 89, 864–871. [Google Scholar] [CrossRef]
- Nguyen, V.Q.; Baynosa, M.L.; Nguyen, V.H.; Tuma, D.; Lee, Y.R.; Shima, J.-J. Solvent-driven morphology-controlled synthesis of highly efficient long-life ZnO/graphene nanocomposite photocatalysts for the practical degradation of organic wastewater under solar light. Appl. Surf. Sci. 2019, 486, 37–51. [Google Scholar] [CrossRef]
- Tang, L.; Ji, R.; Li, X.; Teng, K.S.; Lau, S.P. Energy-level structure of nitrogen-doped graphene quantum dots. J. Mater. Chem. C 2013, 1, 4908–4915. [Google Scholar] [CrossRef]
- Deng, H.; Yao, L.; Huang, Q.-A.; Su, Q.; Zhang, J.; Zhang, F.; Du, G. Facile assembly of a S@carbon nanotubes/polyaniline/graphene composite for lithium–sulfur batteries. RSC Adv. 2017, 7, 9819–9825. [Google Scholar] [CrossRef]
- Usachov, D.; Vilkov, O.; Grüneis, A.; Häberer, D.; Fedorov, A.; Adamchuk, V.K.; Preobrajenski, A.B.; Dudin, P.; Barinov, A.; Oehzelt, M.; et al. Nitrogen-Doped Graphene: Efficient Growth, Structure, and Electronic Properties. Nano Lett. 2011, 11, 5401–5407. [Google Scholar] [CrossRef] [PubMed]
- Neena, D.; Kondamareddy, K.K.; Humayun, M.; Mohan, V.B.; Lu, D.; Fu, D.; Gao, W. Fabrication of ZnO/N-rGO composite as highly efficient visible-light photocatalyst for 2,4-DCP degradation and H2 evolution. Appl. Surf. Sci. 2019, 488, 611–619. [Google Scholar] [CrossRef]
- Wang, C.-C.; Shieu, F.-S.; Shih, H.C. Enhanced photodegradation by RGO/ZnO core-shell nanostructures. J. Environ. Chem. Eng. 2020, 8, 103589. [Google Scholar] [CrossRef]
- Sharma, P.; Kumar, N.; Chauhan, R.; Singh, V.; Srivastava, V.C.; Bhatnagar, R. Growth of hierarchical ZnO nano flower on large functionalized rGO sheet for superior photocatalytic mineralization of antibiotic. Chem. Eng. J. 2020, 392, 123746. [Google Scholar] [CrossRef]
- Jiang, H.; Zhang, X.; Gu, W.; Feng, X.; Zhang, L.; Weng, Y. Synthesis of ZnO particles with multi-layer and biomorphic porous microstructures and ZnO/rGO composites and their applications for photocatalysis. Chem. Phys. Lett. 2018, 711, 100–106. [Google Scholar] [CrossRef]
- Lv, T.; Pan, L.; Liu, X.; Sun, Z. Enhanced photocatalytic degradation of methylene blue by ZnO–reduced graphene oxide–carbon nanotube composites synthesized via microwave-assisted reaction. Catal. Sci. Technol. 2012, 2, 2297. [Google Scholar] [CrossRef]
- Li, X.; Wang, Q.; Zhao, Y.; Wu, W.; Chen, J.; Meng, H. Green synthesis and photo-catalytic performances for ZnO-reduced graphene oxide nanocomposites. J. Colloid Interface Sci. 2013, 411, 69–75. [Google Scholar] [CrossRef] [PubMed]
- Pastrana-Martínez, L.M.; Morales-Torres, S.; Likodimos, V.; Figueiredo, J.L.; Faria, J.L.; Falaras, P.; Silva, A.M. Advanced nanostructured photocatalysts based on reduced graphene oxide–TiO2 composites for degradation of diphenhydramine pharmaceutical and methyl orange dye. Appl. Catal. B Environ. 2012, 123, 241–256. [Google Scholar] [CrossRef]
- Williams, G.; Seger, B.; Kamat, P.V. TiO2-Graphene Nanocomposites. UV-Assisted Photocatalytic Reduction of Graphene Oxide. ACS Nano 2008, 2, 1487–1491. [Google Scholar] [CrossRef] [PubMed]
- Klein, S.M.; Cohen, G.; Cederbaum, A.I. Production of formaldehyde during metabolism of dimethyl sulfoxide by hydroxyl radical-generating systems. Biochemistry 1981, 20, 6006–6012. [Google Scholar] [CrossRef]
- Sushkov, D.; Gritsan, N.; Weiner, L. Generation of OH radical during enzymatic reduction of 9,10-anthraquinone-2-sulphonate Can semiquinone decompose hydrogen peroxide? FEBS Lett. 1987, 225, 139–144. [Google Scholar] [CrossRef]
- Ferrari, A.G.-M.; Foster, C.W.; Kelly, P.J.; Brownson, D.A.C.; Banks, C.E. Determination of the Electrochemical Area of Screen-Printed Electrochemical Sensing Platforms. Biosensensors 2018, 8, 53. [Google Scholar] [CrossRef]
- Degen, A.; Kosec, M. Effect of pH and impurities on the surface charge of zinc oxide in aqueous solution. J. Eur. Ceram. Soc. 2000, 20, 667–673. [Google Scholar] [CrossRef]
- Qu, F.; Morais, P.C. Energy levels in metal oxide semiconductor quantum dots in water-based colloids. J. Chem. Phys. 1999, 111, 8588–8594. [Google Scholar] [CrossRef]
- Nkosi, D.; Pillay, J.; Ozoemena, K.I.; Nouneh, K.; Oyama, M. Heterogeneous electron transfer kinetics and electrocatalytic behaviour of mixed self-assembled ferrocenes and SWCNT layers. Phys. Chem. Chem. Phys. 2010, 12, 604–613. [Google Scholar] [CrossRef]


| Sample | ZnO | NGr-ZnO-1 | NGr-ZnO-2 | NGr-ZnO-3 |
|---|---|---|---|---|
| <D> (Å) | 348 | 170 | 154 | 146 |
| ε (%) | 0.0011 | 0.0021 | 0.0023 | 0.0025 |
| Sample | Adsorption Rate (%) | Photocatalytic Activity (%) | ki (min−1) | R2 |
|---|---|---|---|---|
| ZnO | 9 | 64 | 0.0052 | 0.99974 |
| NGr-ZnO-1 | 36 | 96 | 0.0154 | 0.98828 |
| NGr-ZnO-2 | 23 | 97 | 0.0184 | 0.92686 |
| NGr-ZnO-3 | 26 | 100 | 0.0337 | 0.95355 |
| Type of Irradiation | Photocatalyst Concentration | Degradation Rate/Time Irradiation | Pollutant | References |
|---|---|---|---|---|
| Visible | 1.25 g/L | 60%/60 min | rhodamine B (RhB) | [38] |
| Visible | 1 g/L | 95%/100 min | methylene blue | [39] |
| UV | 1 g/L | 100%/300 min | ofloxacin | [40] |
| UV | 1 g/L | 93%/60 min | methylene blue | [41] |
| UV | 1.5 g /L | 88%/260 min | methylene blue | [42] |
| Visible | 1 g/L | 92.9%/150 min | rhodamine B (RhB) | [43] |
| UV | 0.5 g/L | 100%/180 min | rhodamine B (RhB) | this work |
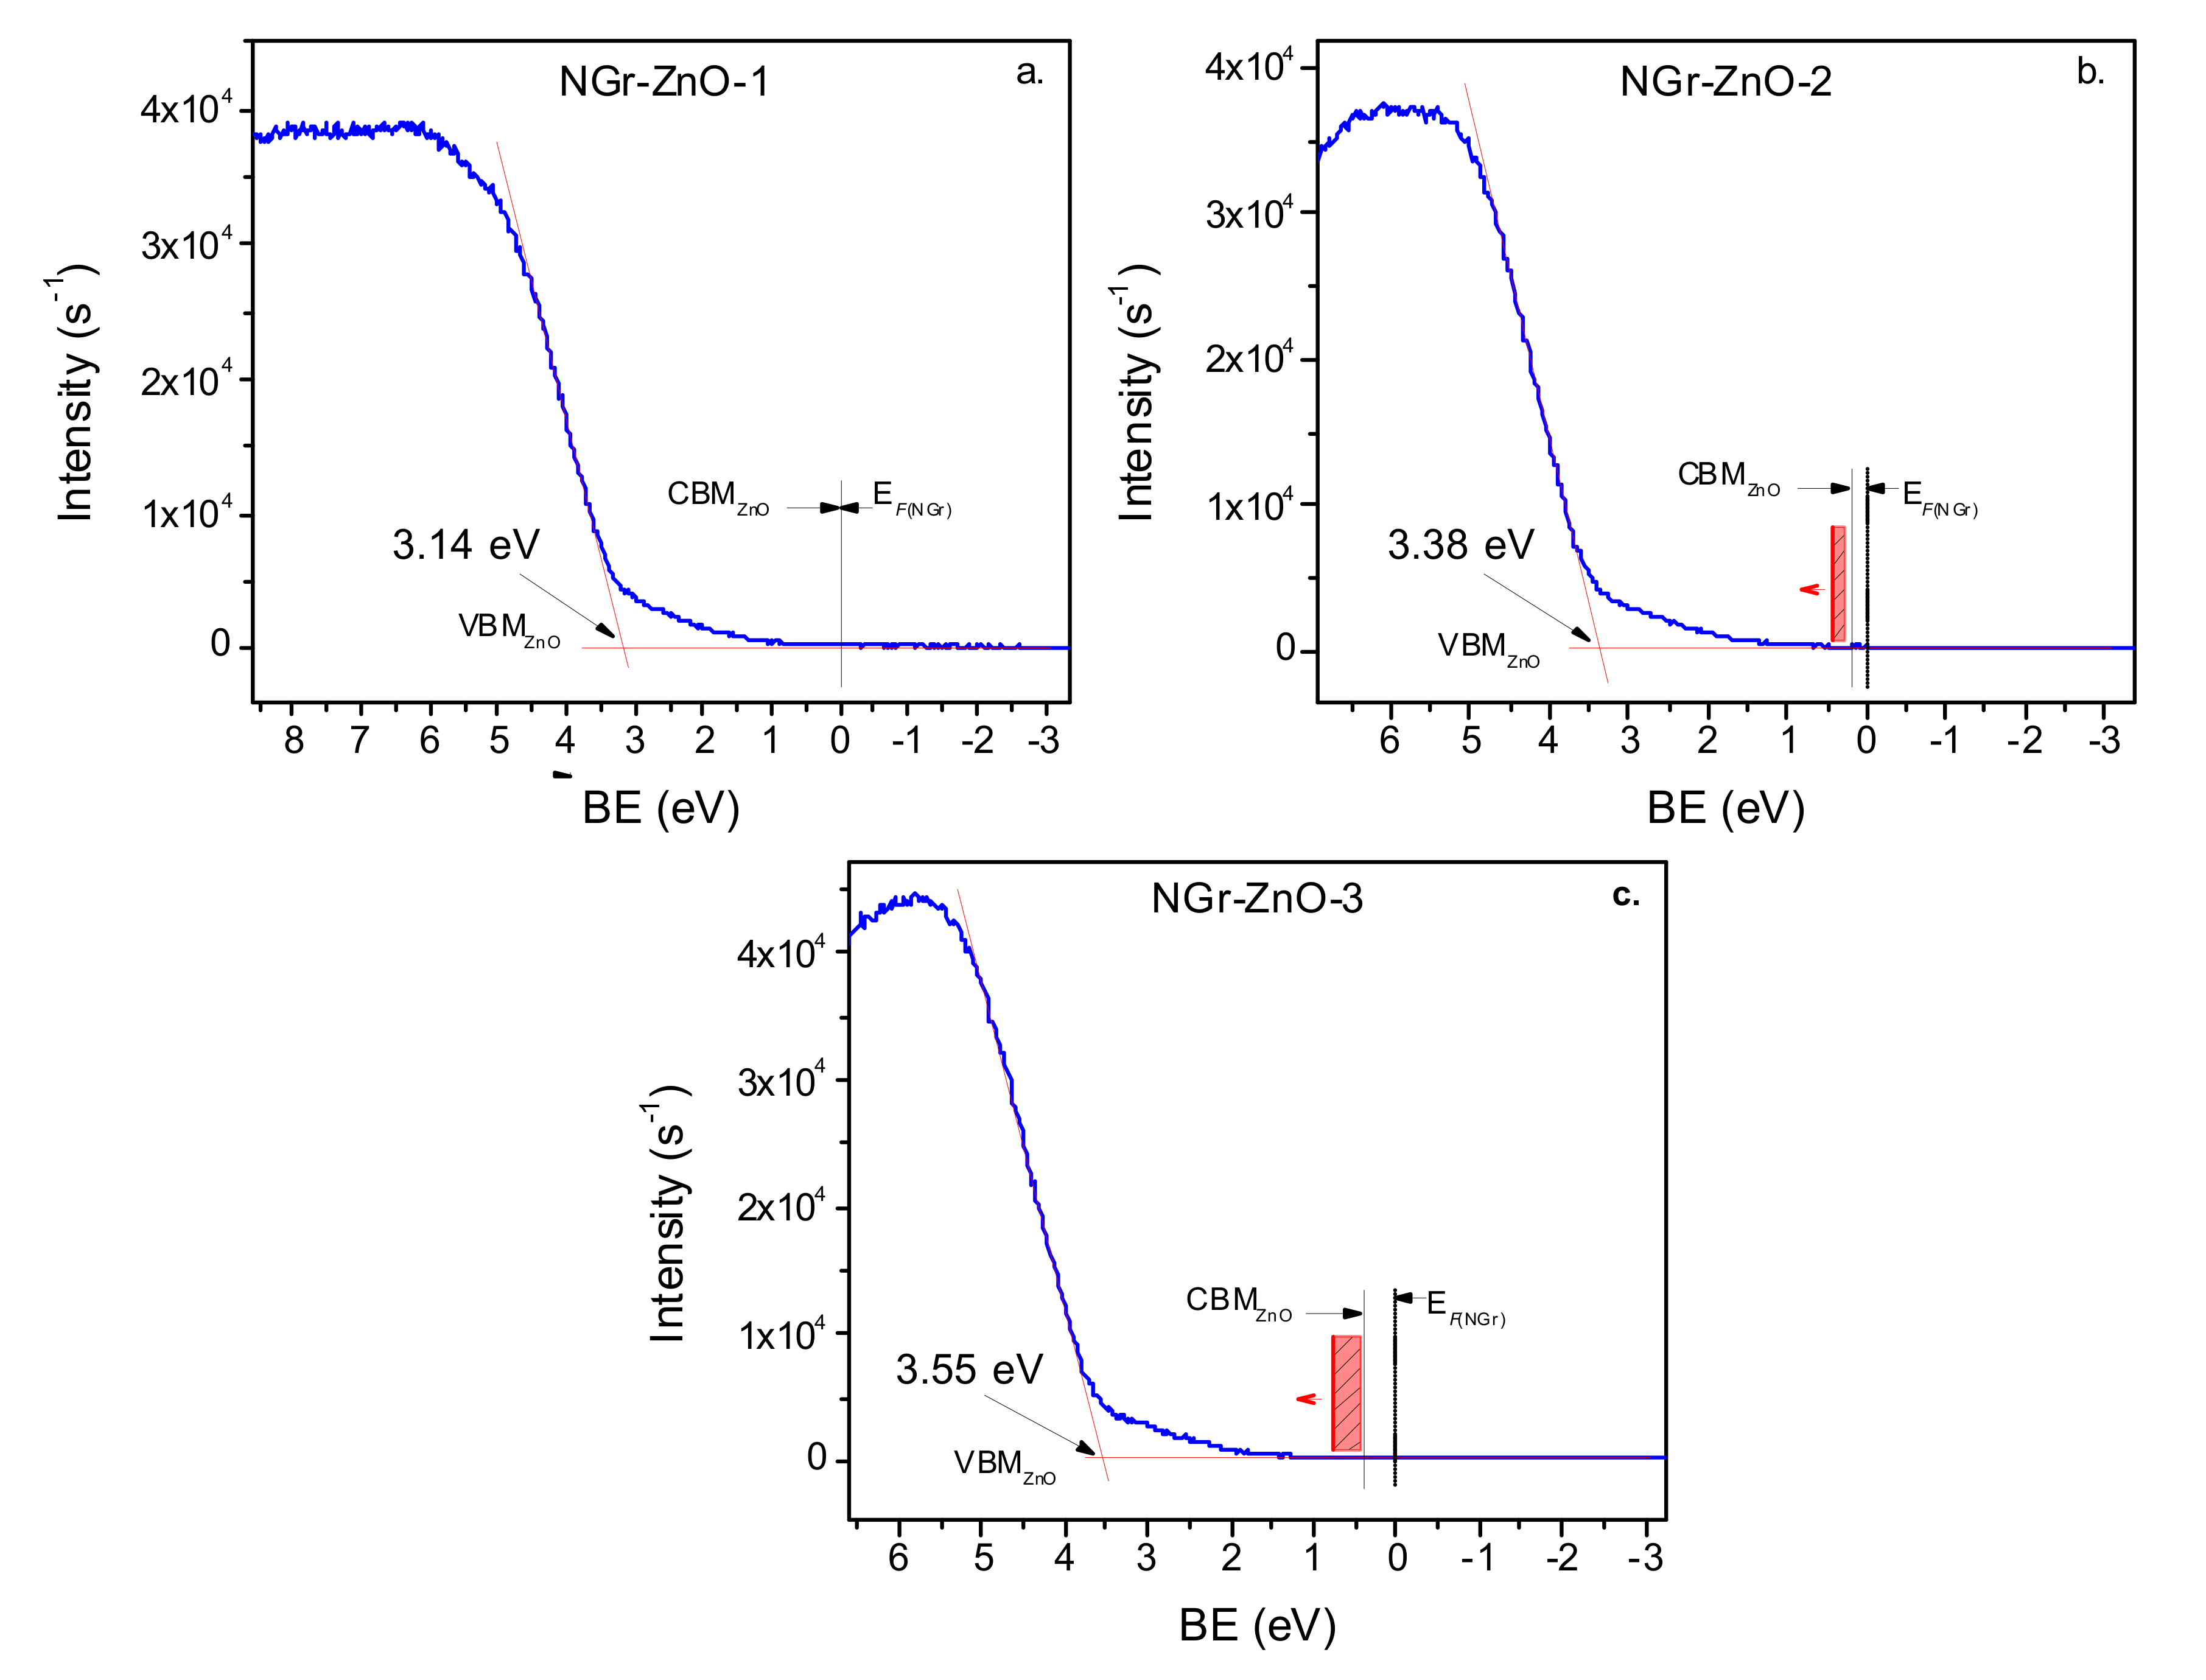
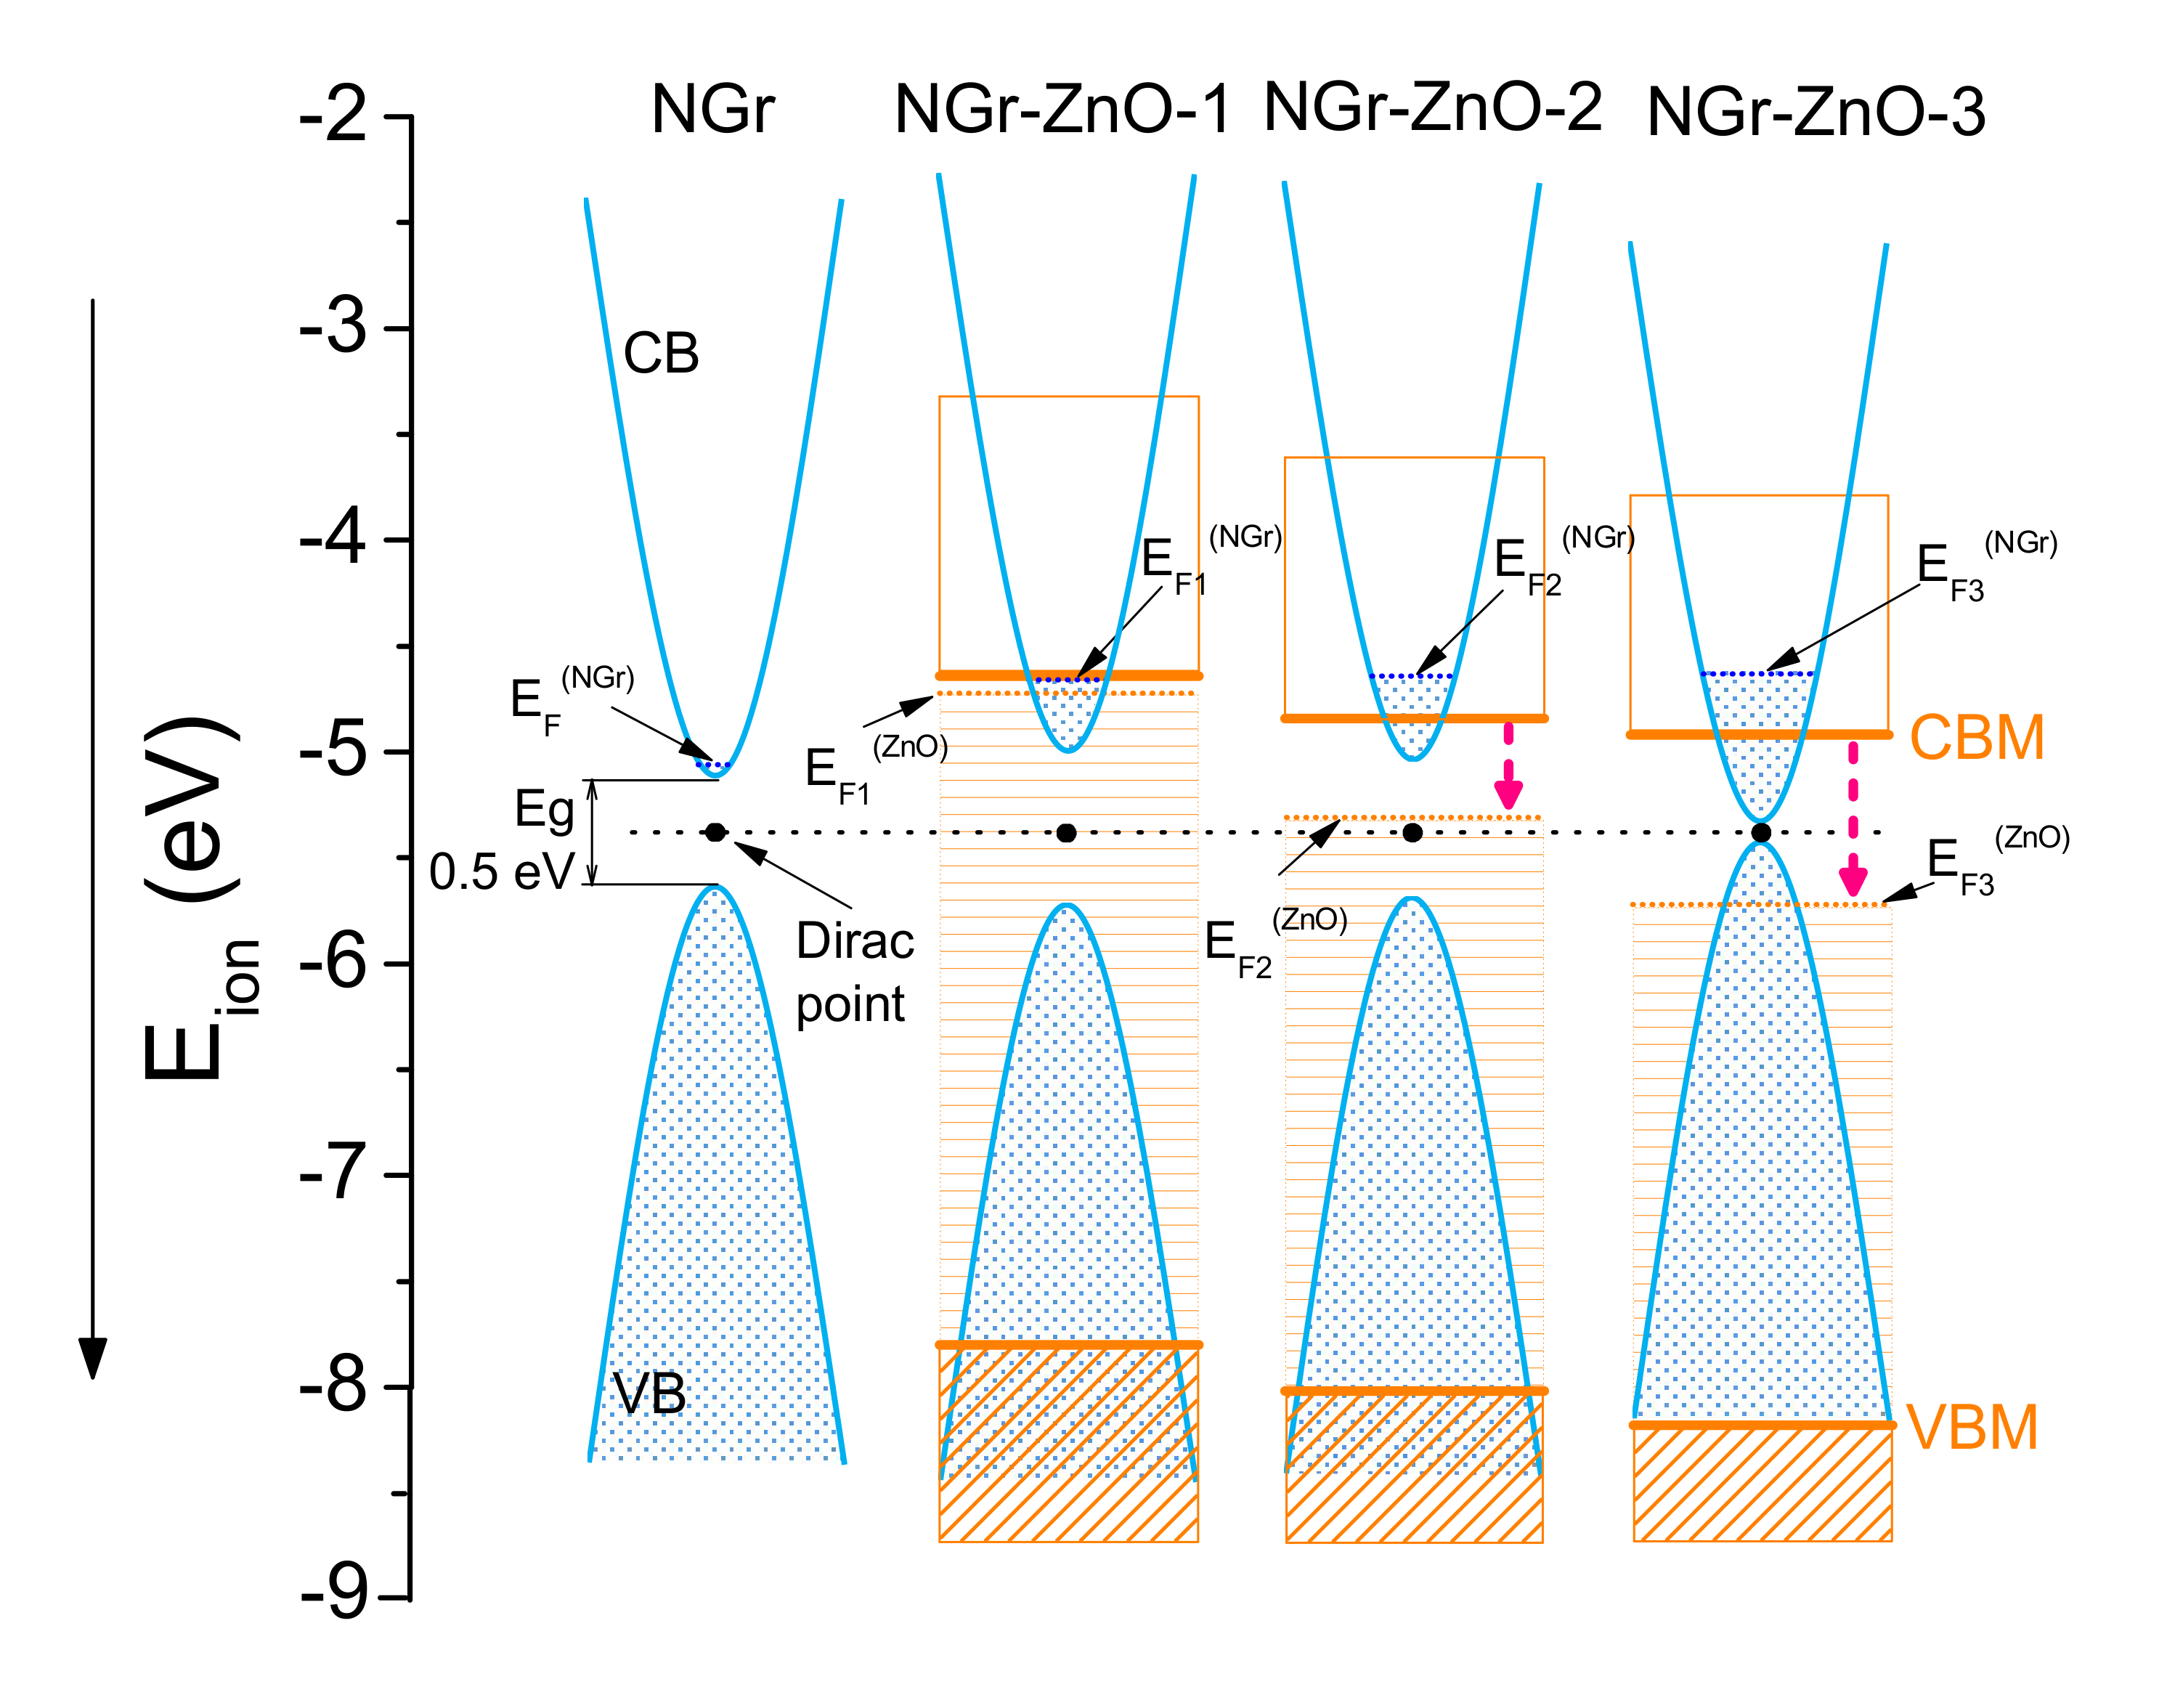
| Sample | N (at.%) XPS | Ei (eV) UPS | VBM (eV) UPS | EgNGr (eV) | EgZnO (eV) UV–Vis |
|---|---|---|---|---|---|
| NGr-ZnO-1 | 7.7 | −4.66 | −3.14 | 0.7 | 3.15 |
| NGr-ZnO-2 | 7.5 | −4.64 | −3.38 | 0.6 | 3.18 |
| NGr-ZnO-3 | 18.6 | −4.63 | −3.55 | <0.1 | 3.26 |
| ZnO | −4.78 | −2.49 | 3.32 | ||
| NGr | 3.8 | −5.06 | −0.57 | ~0.5 |
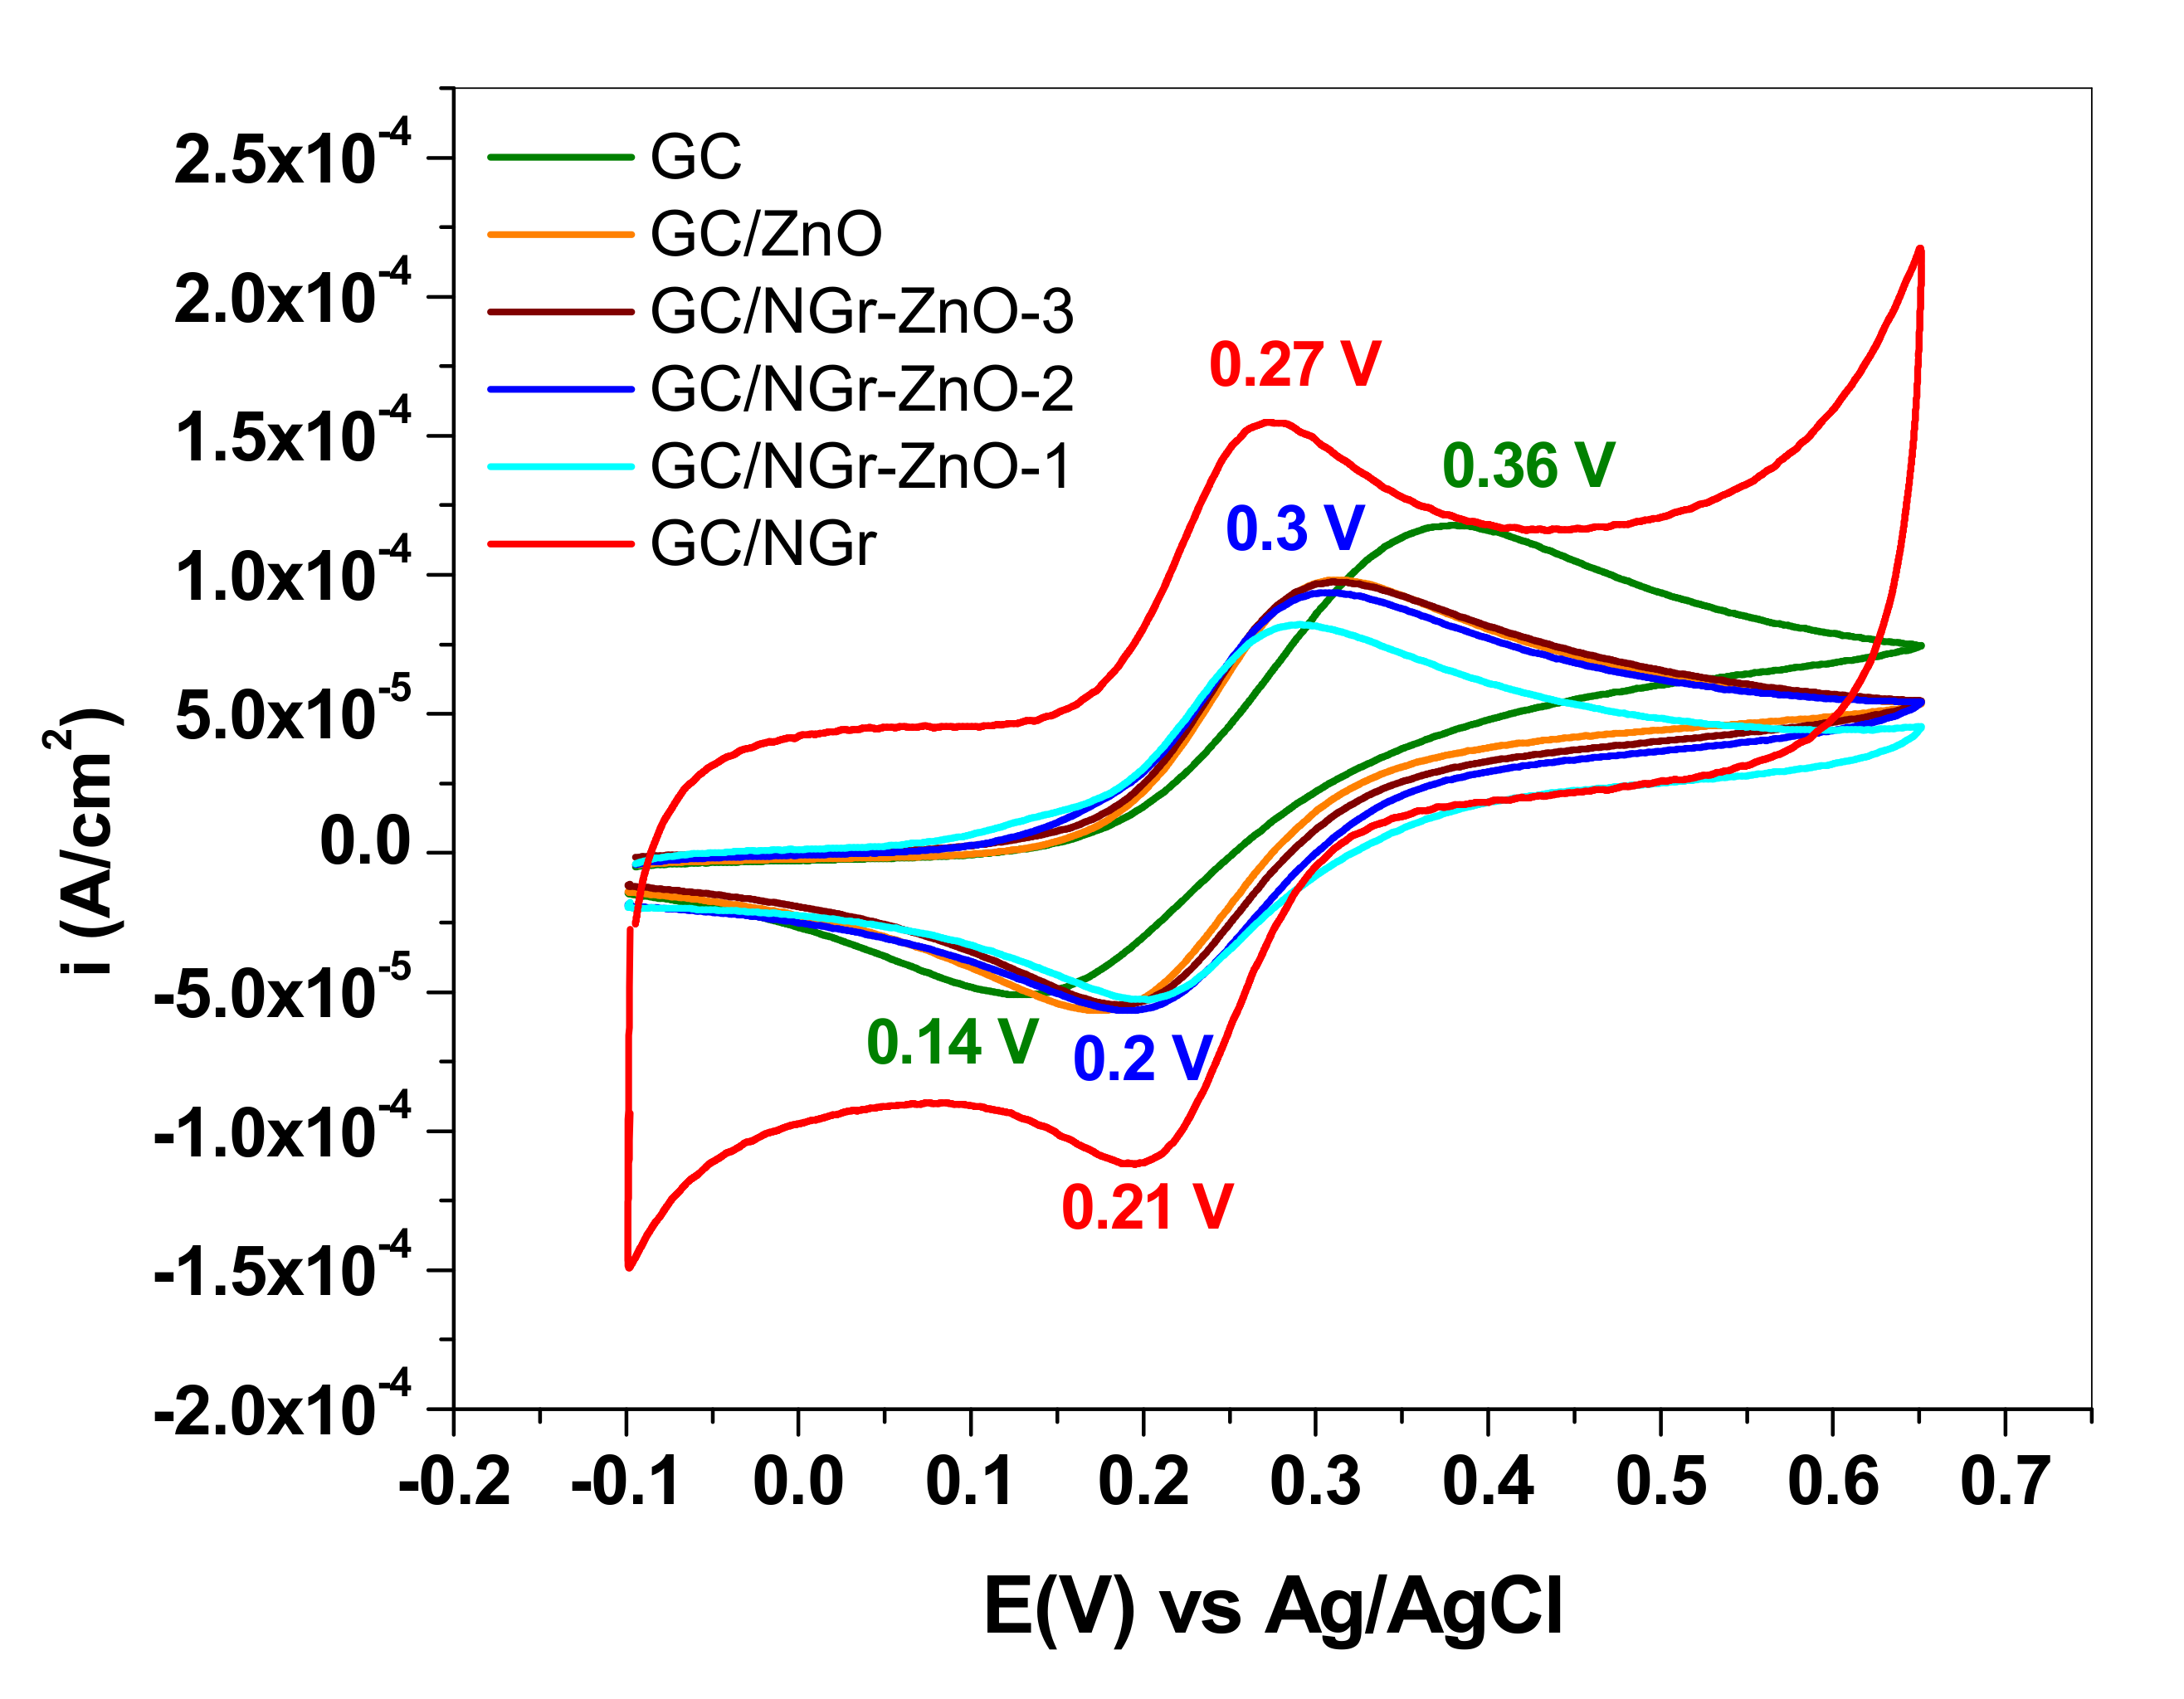
| Electrode | ΔEp mV/n | Ipa µA | Ipc µA | Ipa/Ipc | Qa µC | A cm2 |
|---|---|---|---|---|---|---|
| GC/NGr | 60 | 2.86 | −2.81 | 1.02 | 0.379 | 0.0365 |
| GC/NGr-ZnO-1 | 83 | 3.09 | 2.78 | 1.11 | 0.644 | 0.0497 |
| GC/NGr-ZnO-2 | 98 | 2.45 | −2.25 | 1.08 | 0.554 | 0.0343 |
| GC/NGr-ZnO-3 | 115 | 2.67 | −2.43 | 1.099 | 0.608 | 0.0354 |
| GC/ZnO | 125 | 2.46 | −2.24 | 1.099 | 0.550 | 0.0313 |
| GC | 220 | 2.32 | −1.85 | 1.25 | 0.547 | 0.028 |
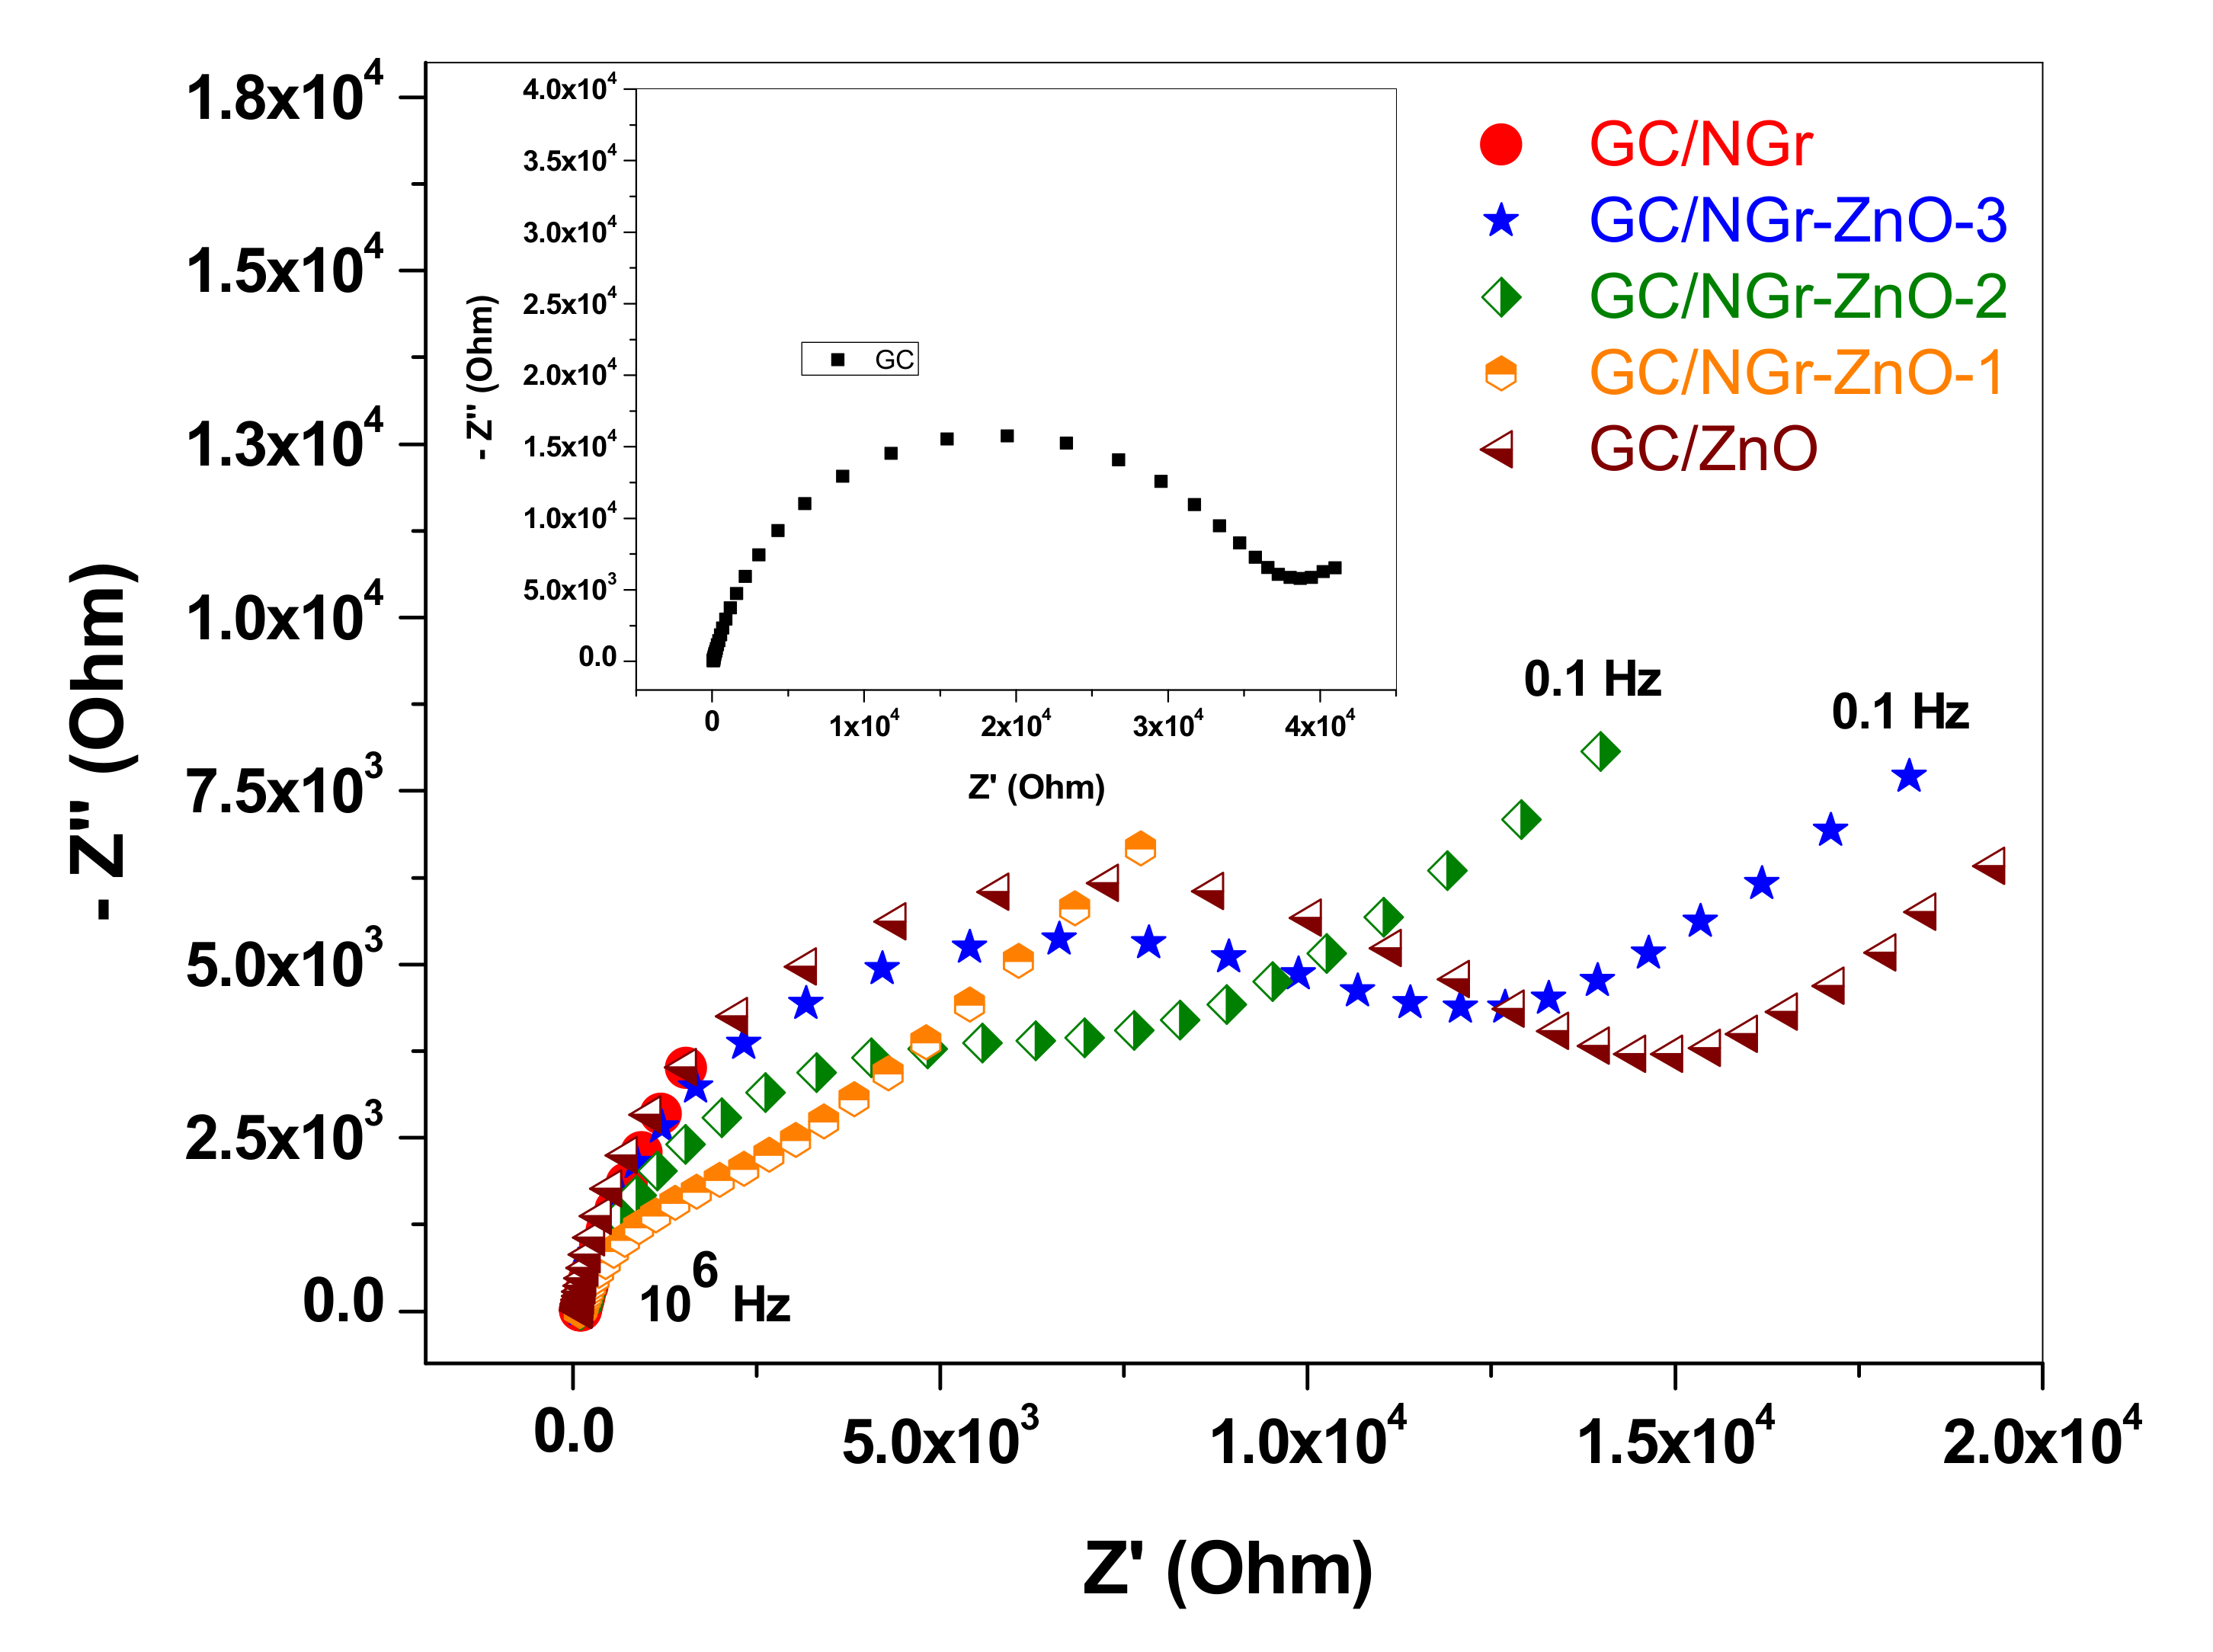
| Electrode | GC/ NGr | GC/ NGr-ZnO-1 | GC/ NGr-ZnO-2 | GC/ NGr-ZnO-3 | GC/ ZnO | GC |
|---|---|---|---|---|---|---|
| Rct (Ω) | 6.01 | 6.56 | 7910 | 11,600 | 13,100 | 36,800 |
| Kapp (cm/s) | 1.01 | 8.9 × 10⁻¹ | 9.75 × 10⁻⁴ | 6.44 × 10⁻⁴ | 6.45 × 10⁻⁴ | 2.56 × 10⁻⁴ |
© 2020 by the authors. Licensee MDPI, Basel, Switzerland. This article is an open access article distributed under the terms and conditions of the Creative Commons Attribution (CC BY) license (http://creativecommons.org/licenses/by/4.0/).
Share and Cite
Pogacean, F.; Ştefan, M.; Toloman, D.; Popa, A.; Leostean, C.; Turza, A.; Coros, M.; Pana, O.; Pruneanu, S. Photocatalytic and Electrocatalytic Properties of NGr-ZnO Hybrid Materials. Nanomaterials 2020, 10, 1473. https://doi.org/10.3390/nano10081473
Pogacean F, Ştefan M, Toloman D, Popa A, Leostean C, Turza A, Coros M, Pana O, Pruneanu S. Photocatalytic and Electrocatalytic Properties of NGr-ZnO Hybrid Materials. Nanomaterials. 2020; 10(8):1473. https://doi.org/10.3390/nano10081473
Chicago/Turabian StylePogacean, Florina, Maria Ştefan, Dana Toloman, Adriana Popa, Cristian Leostean, Alexandru Turza, Maria Coros, Ovidiu Pana, and Stela Pruneanu. 2020. "Photocatalytic and Electrocatalytic Properties of NGr-ZnO Hybrid Materials" Nanomaterials 10, no. 8: 1473. https://doi.org/10.3390/nano10081473
APA StylePogacean, F., Ştefan, M., Toloman, D., Popa, A., Leostean, C., Turza, A., Coros, M., Pana, O., & Pruneanu, S. (2020). Photocatalytic and Electrocatalytic Properties of NGr-ZnO Hybrid Materials. Nanomaterials, 10(8), 1473. https://doi.org/10.3390/nano10081473