Microstructure of Ni0.5Zn0.5Fe2O4 Nanofiber with Metal Nitrates in Electrospinning Precursor


Abstract
1. Introduction
2. Materials and Methods
3. Results and Discussion
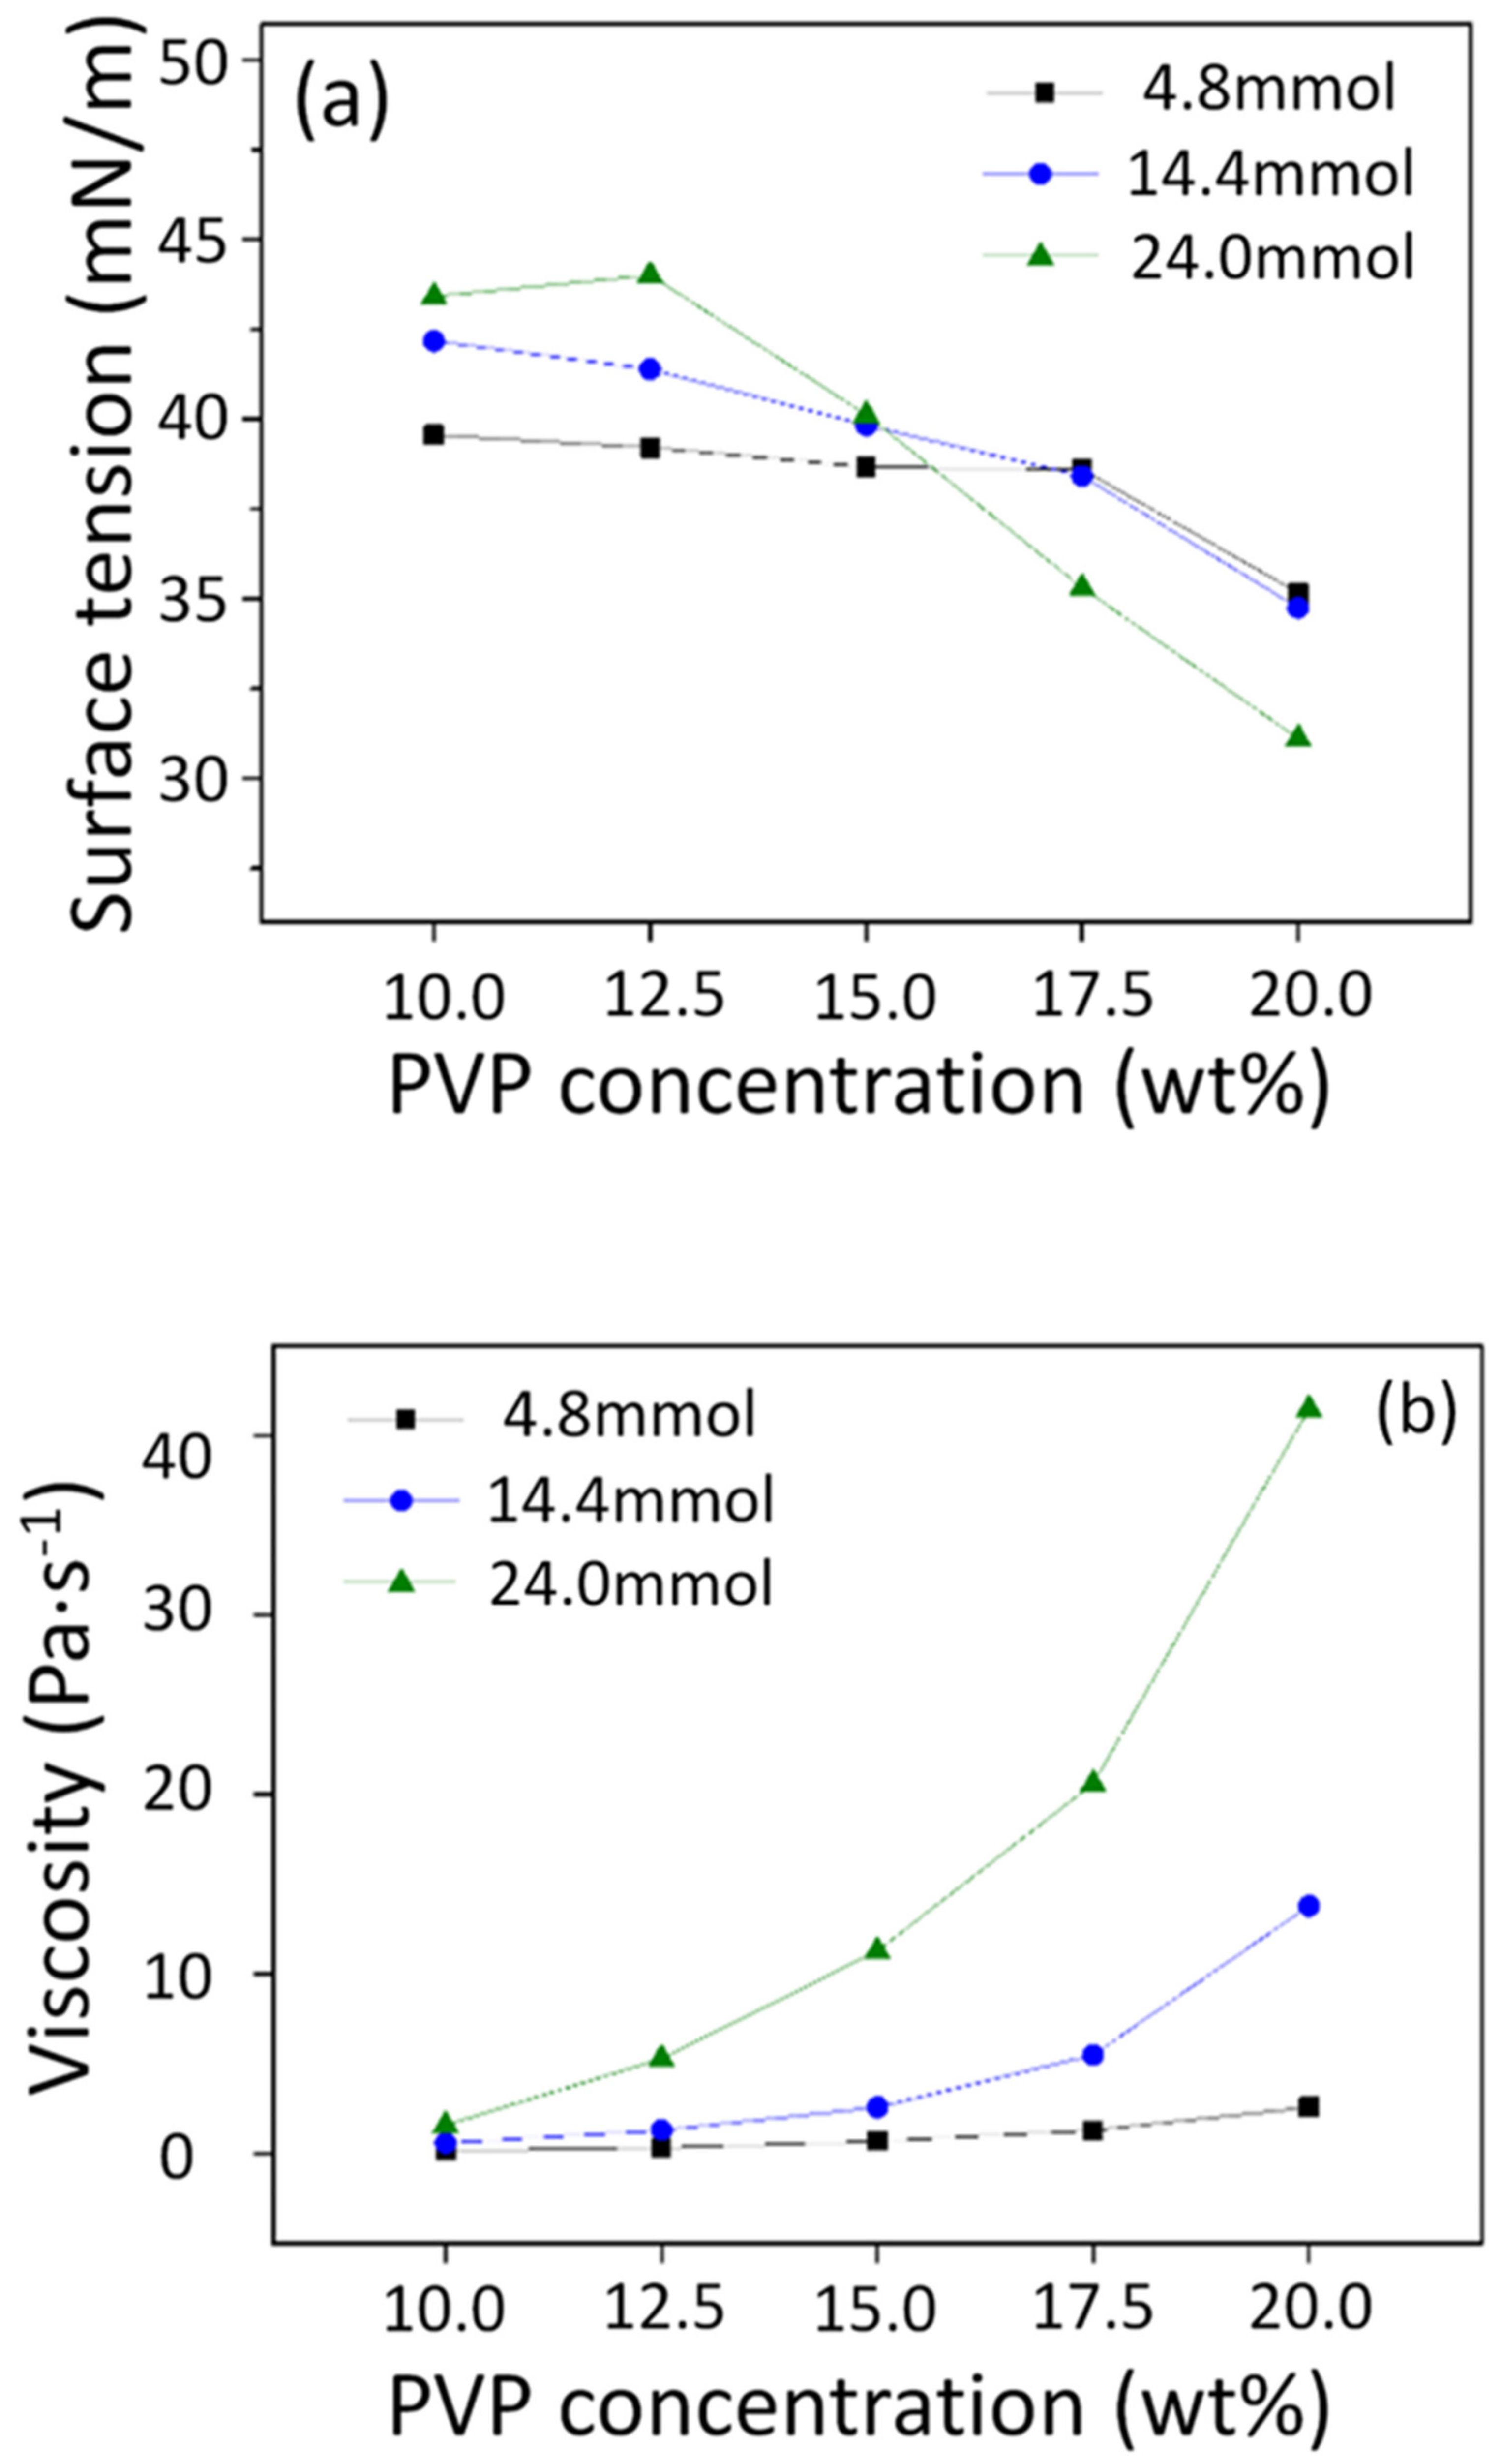
3.1. Surface Tension and Viscosity of the Precursor Solutions
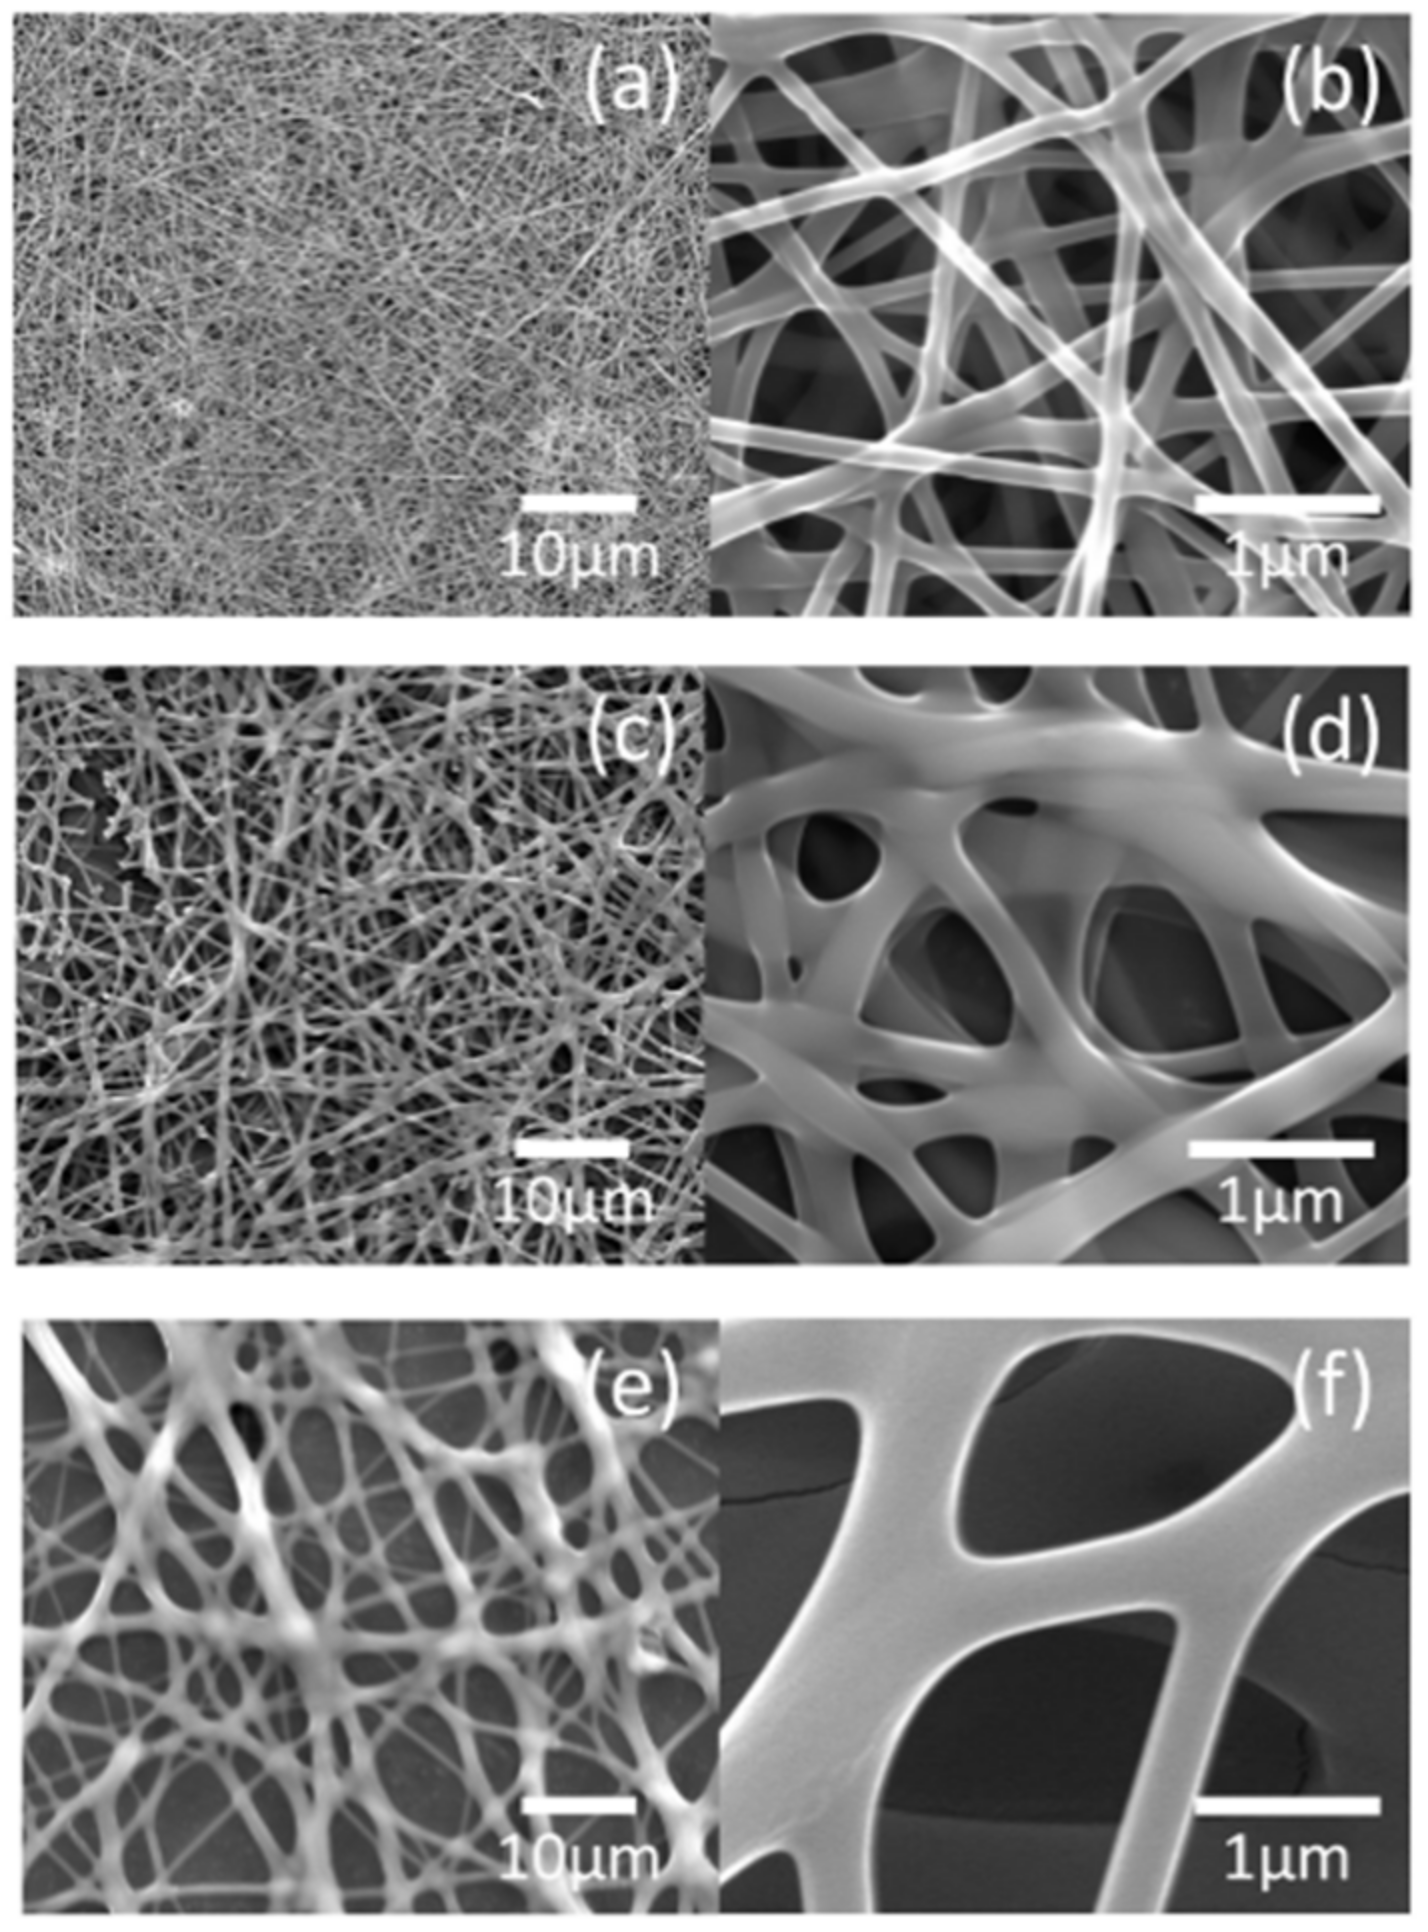
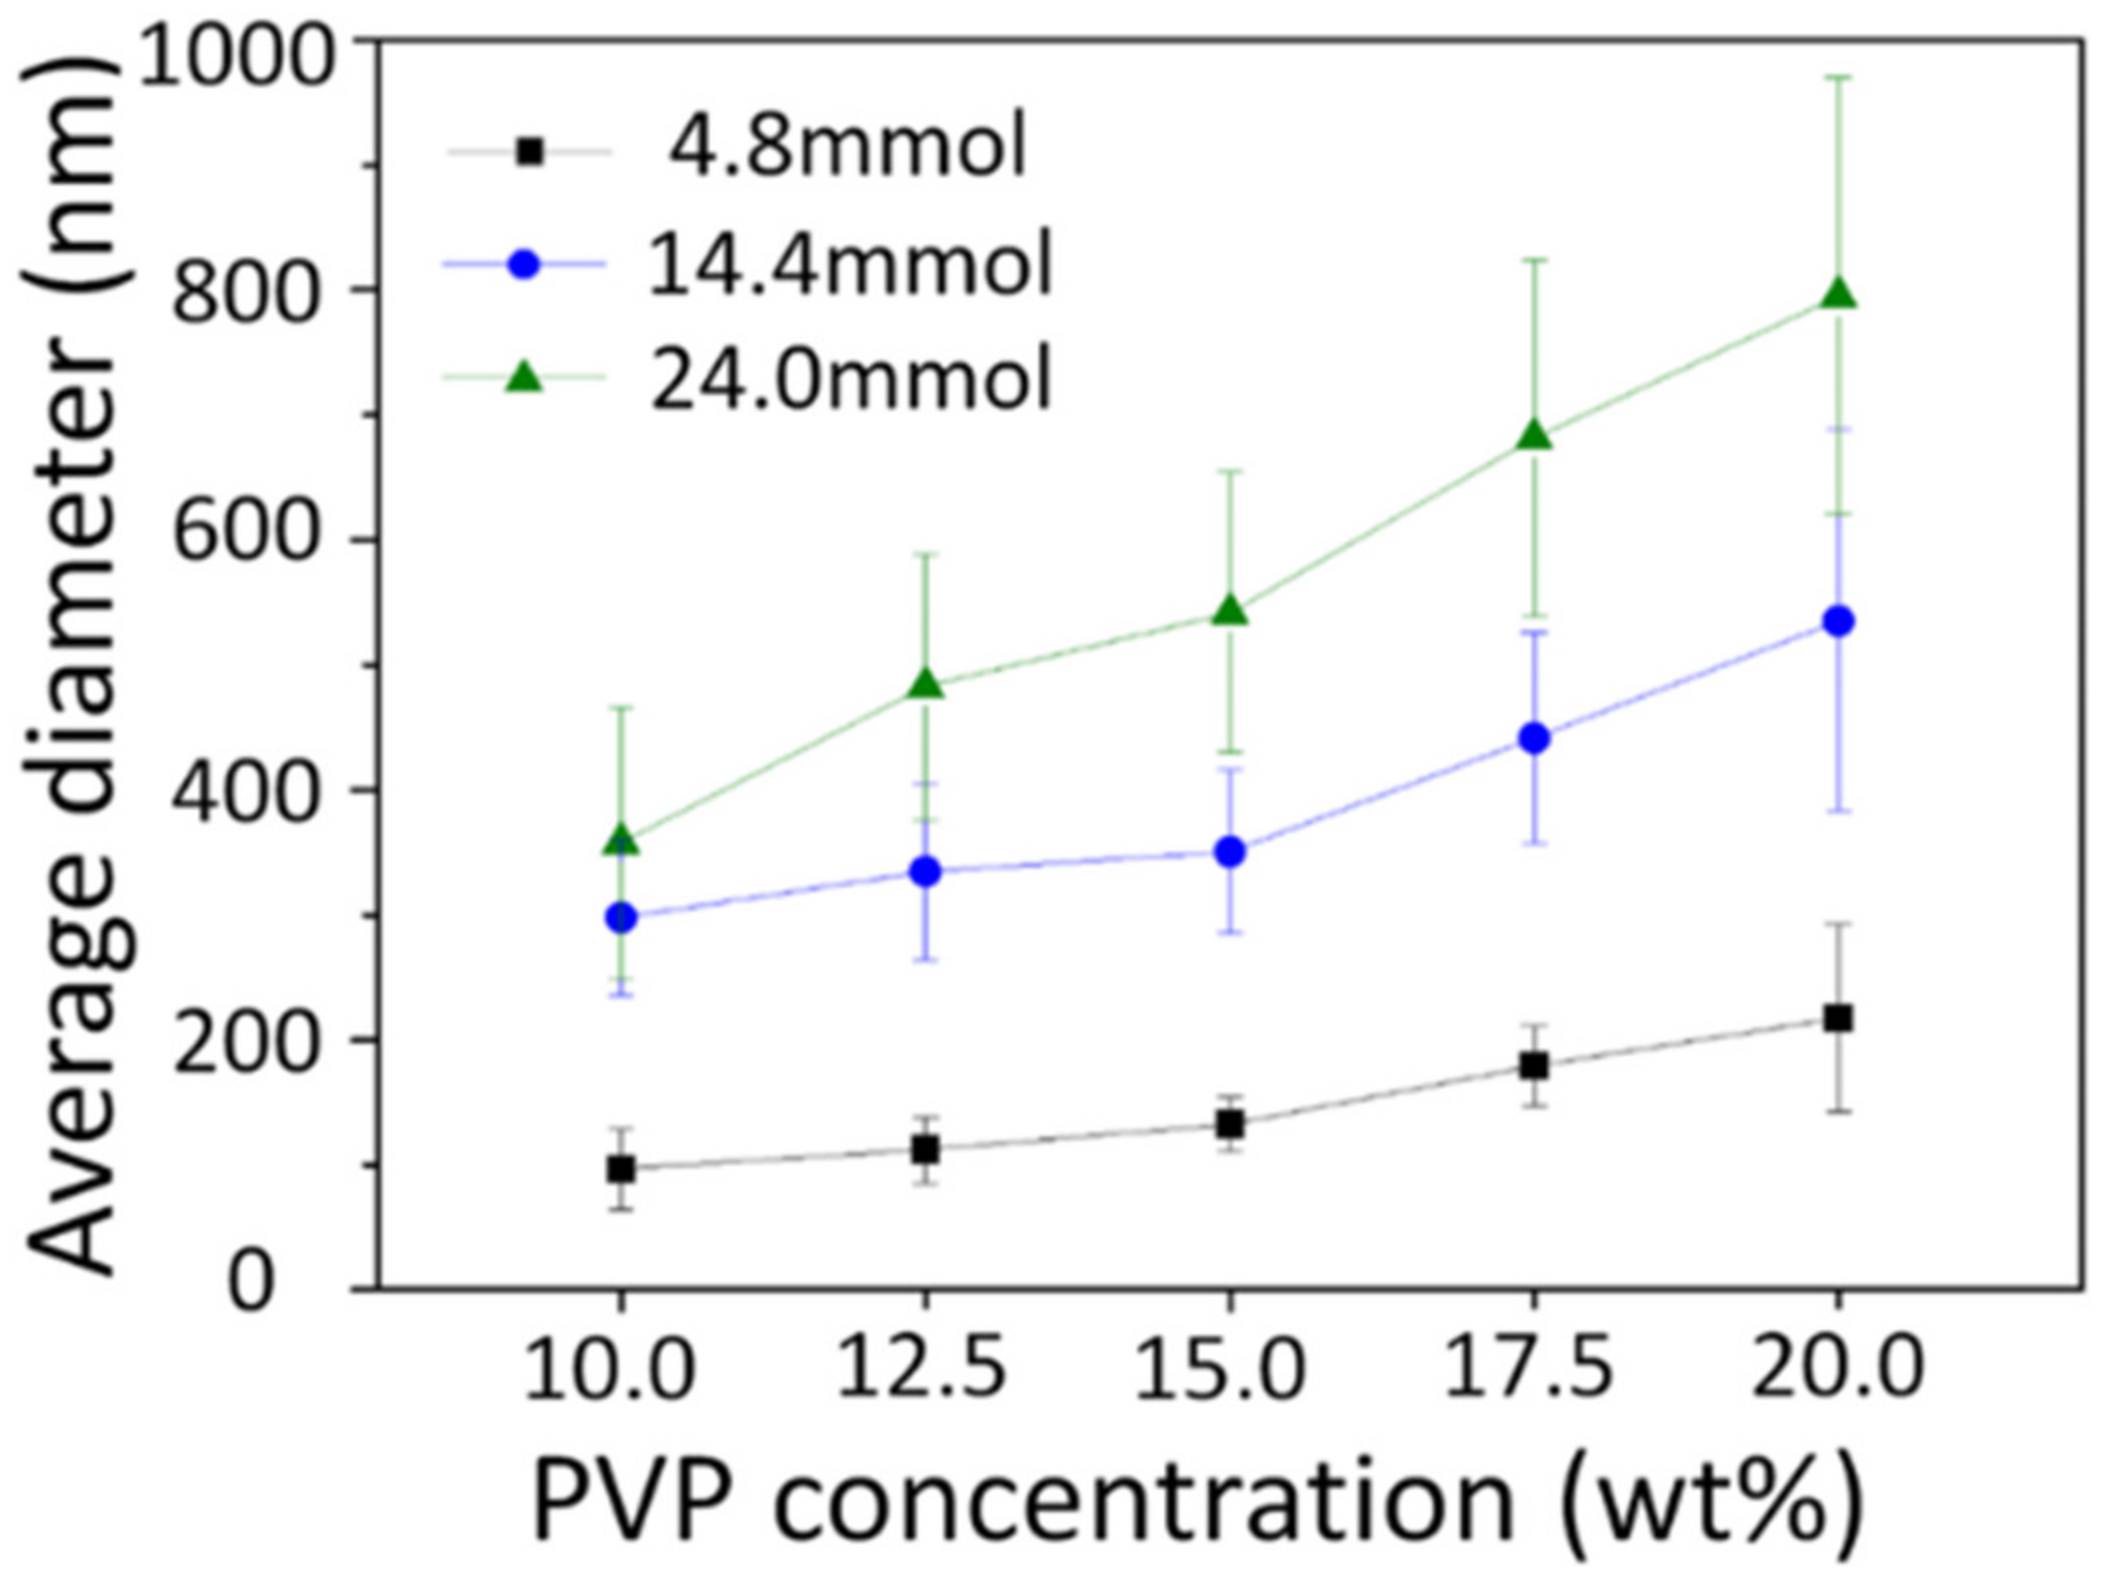
3.2. As-Spun Nanofibers
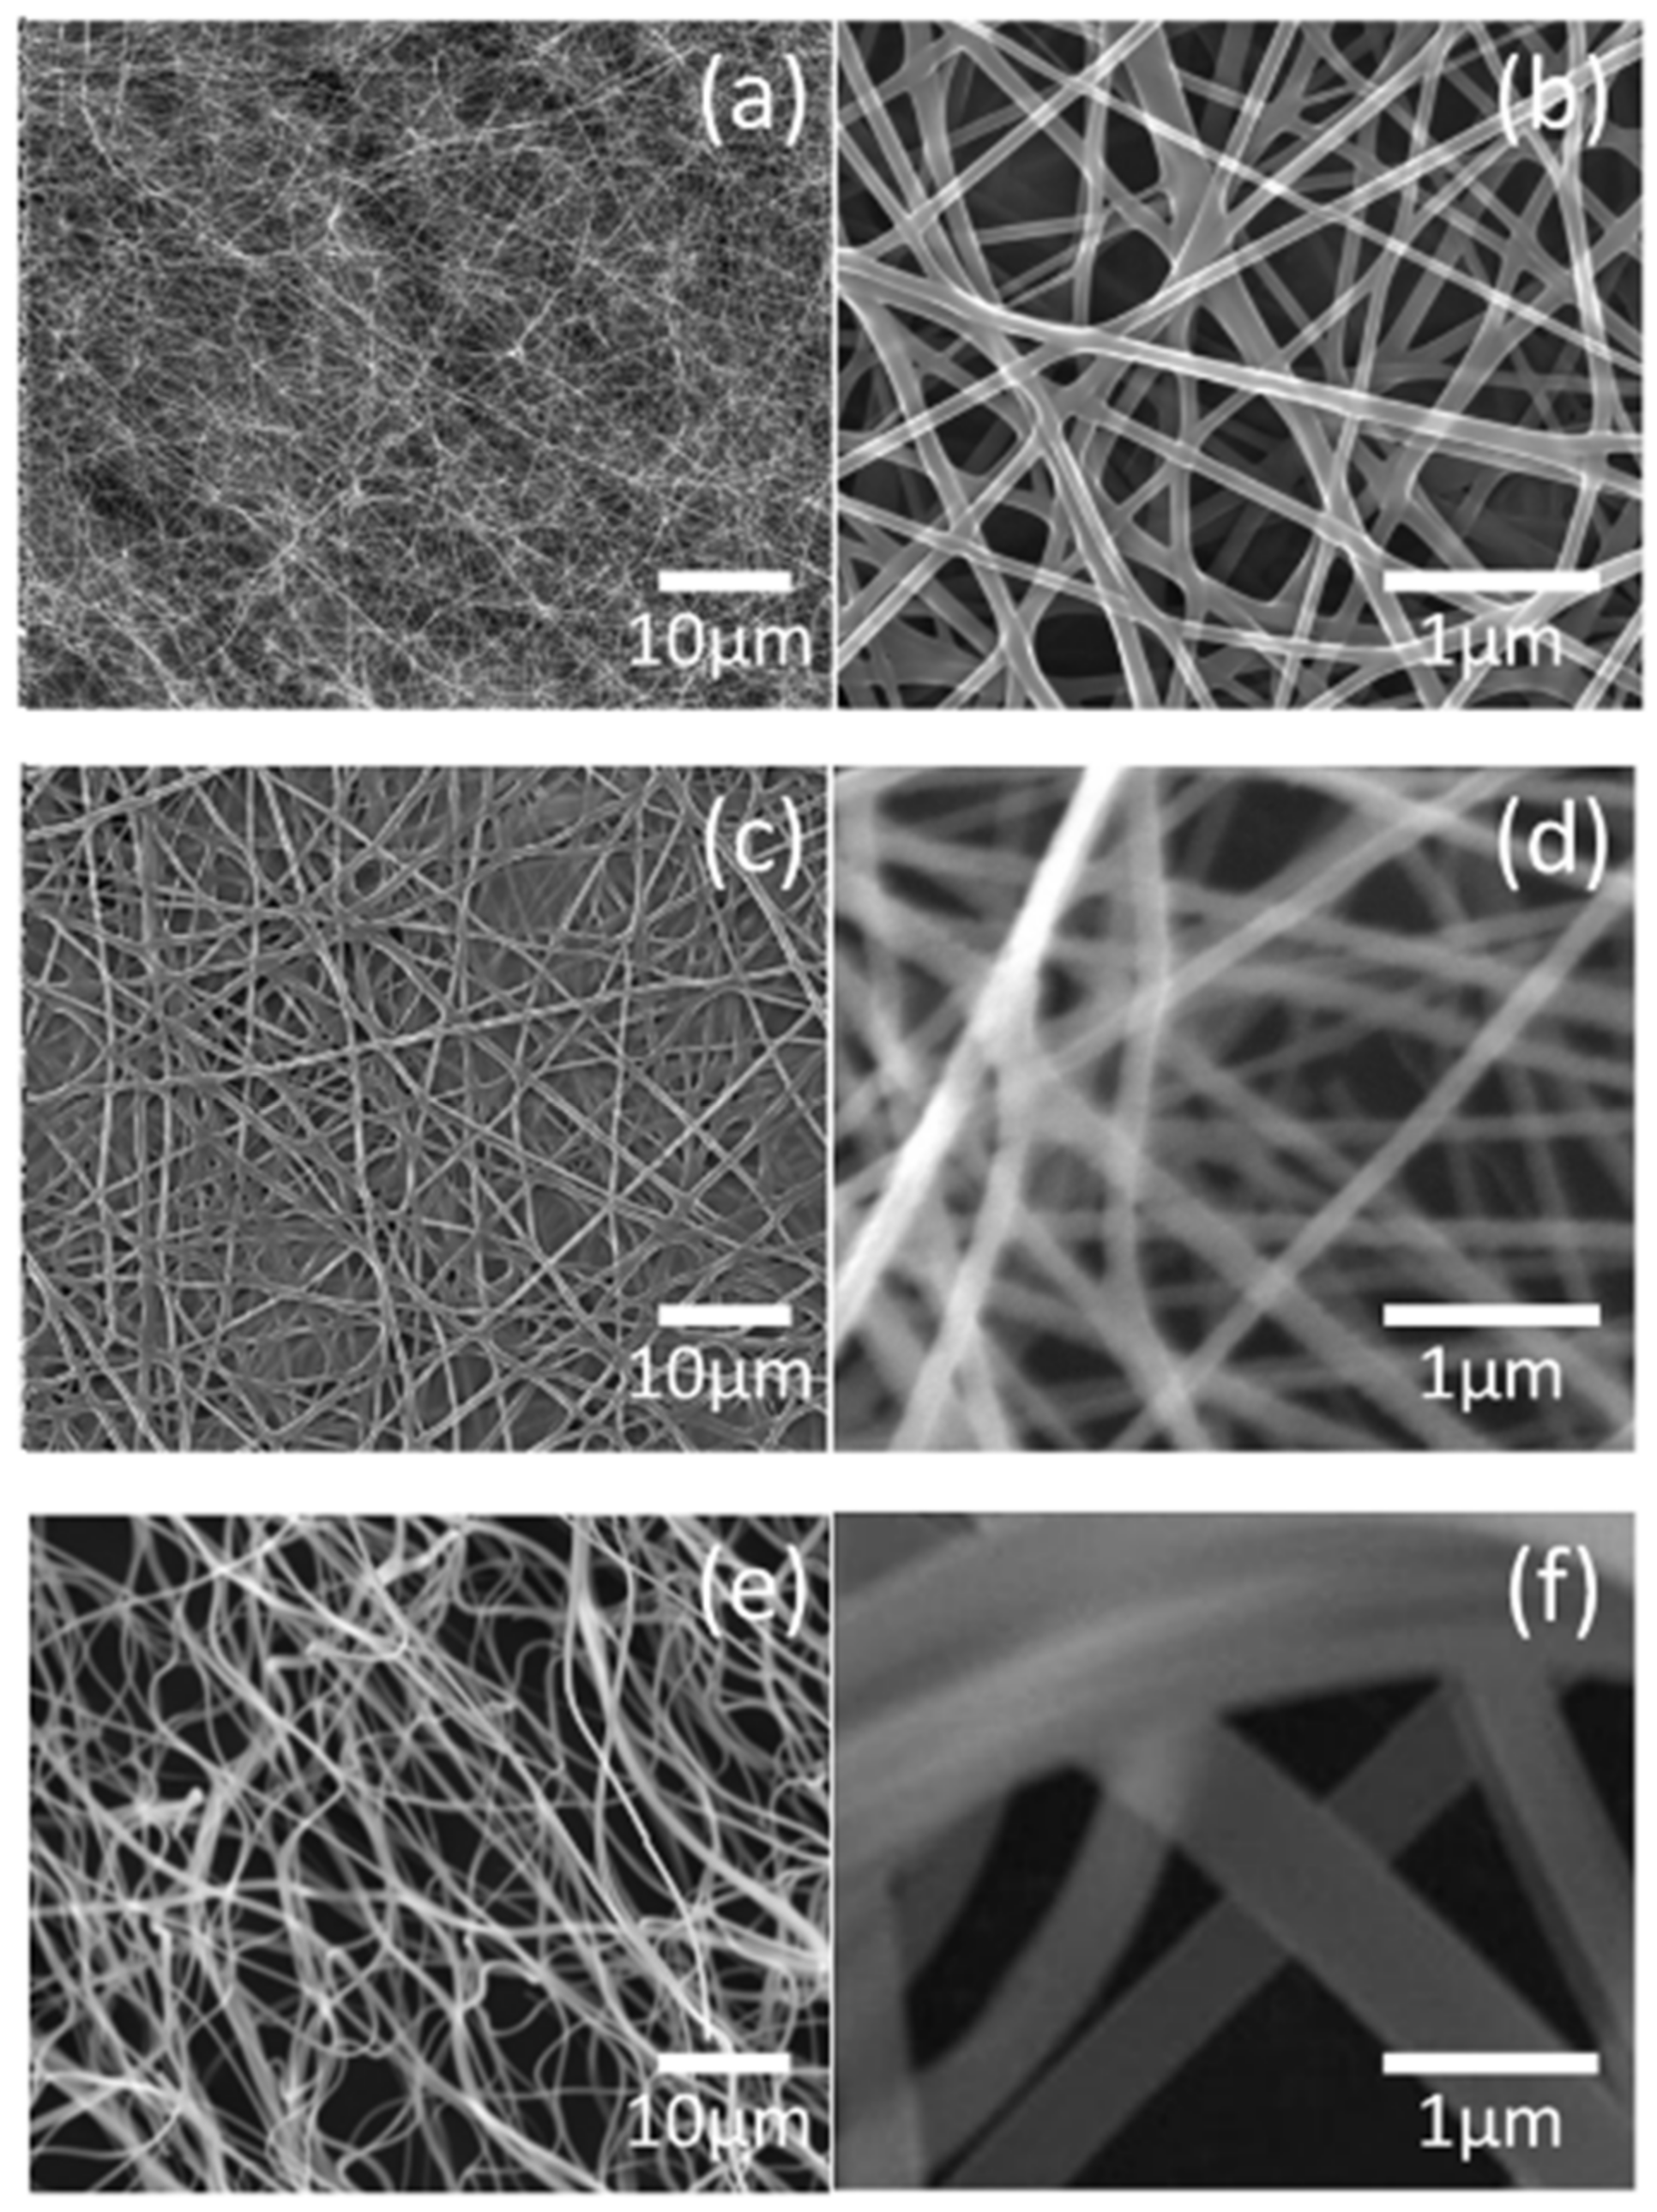
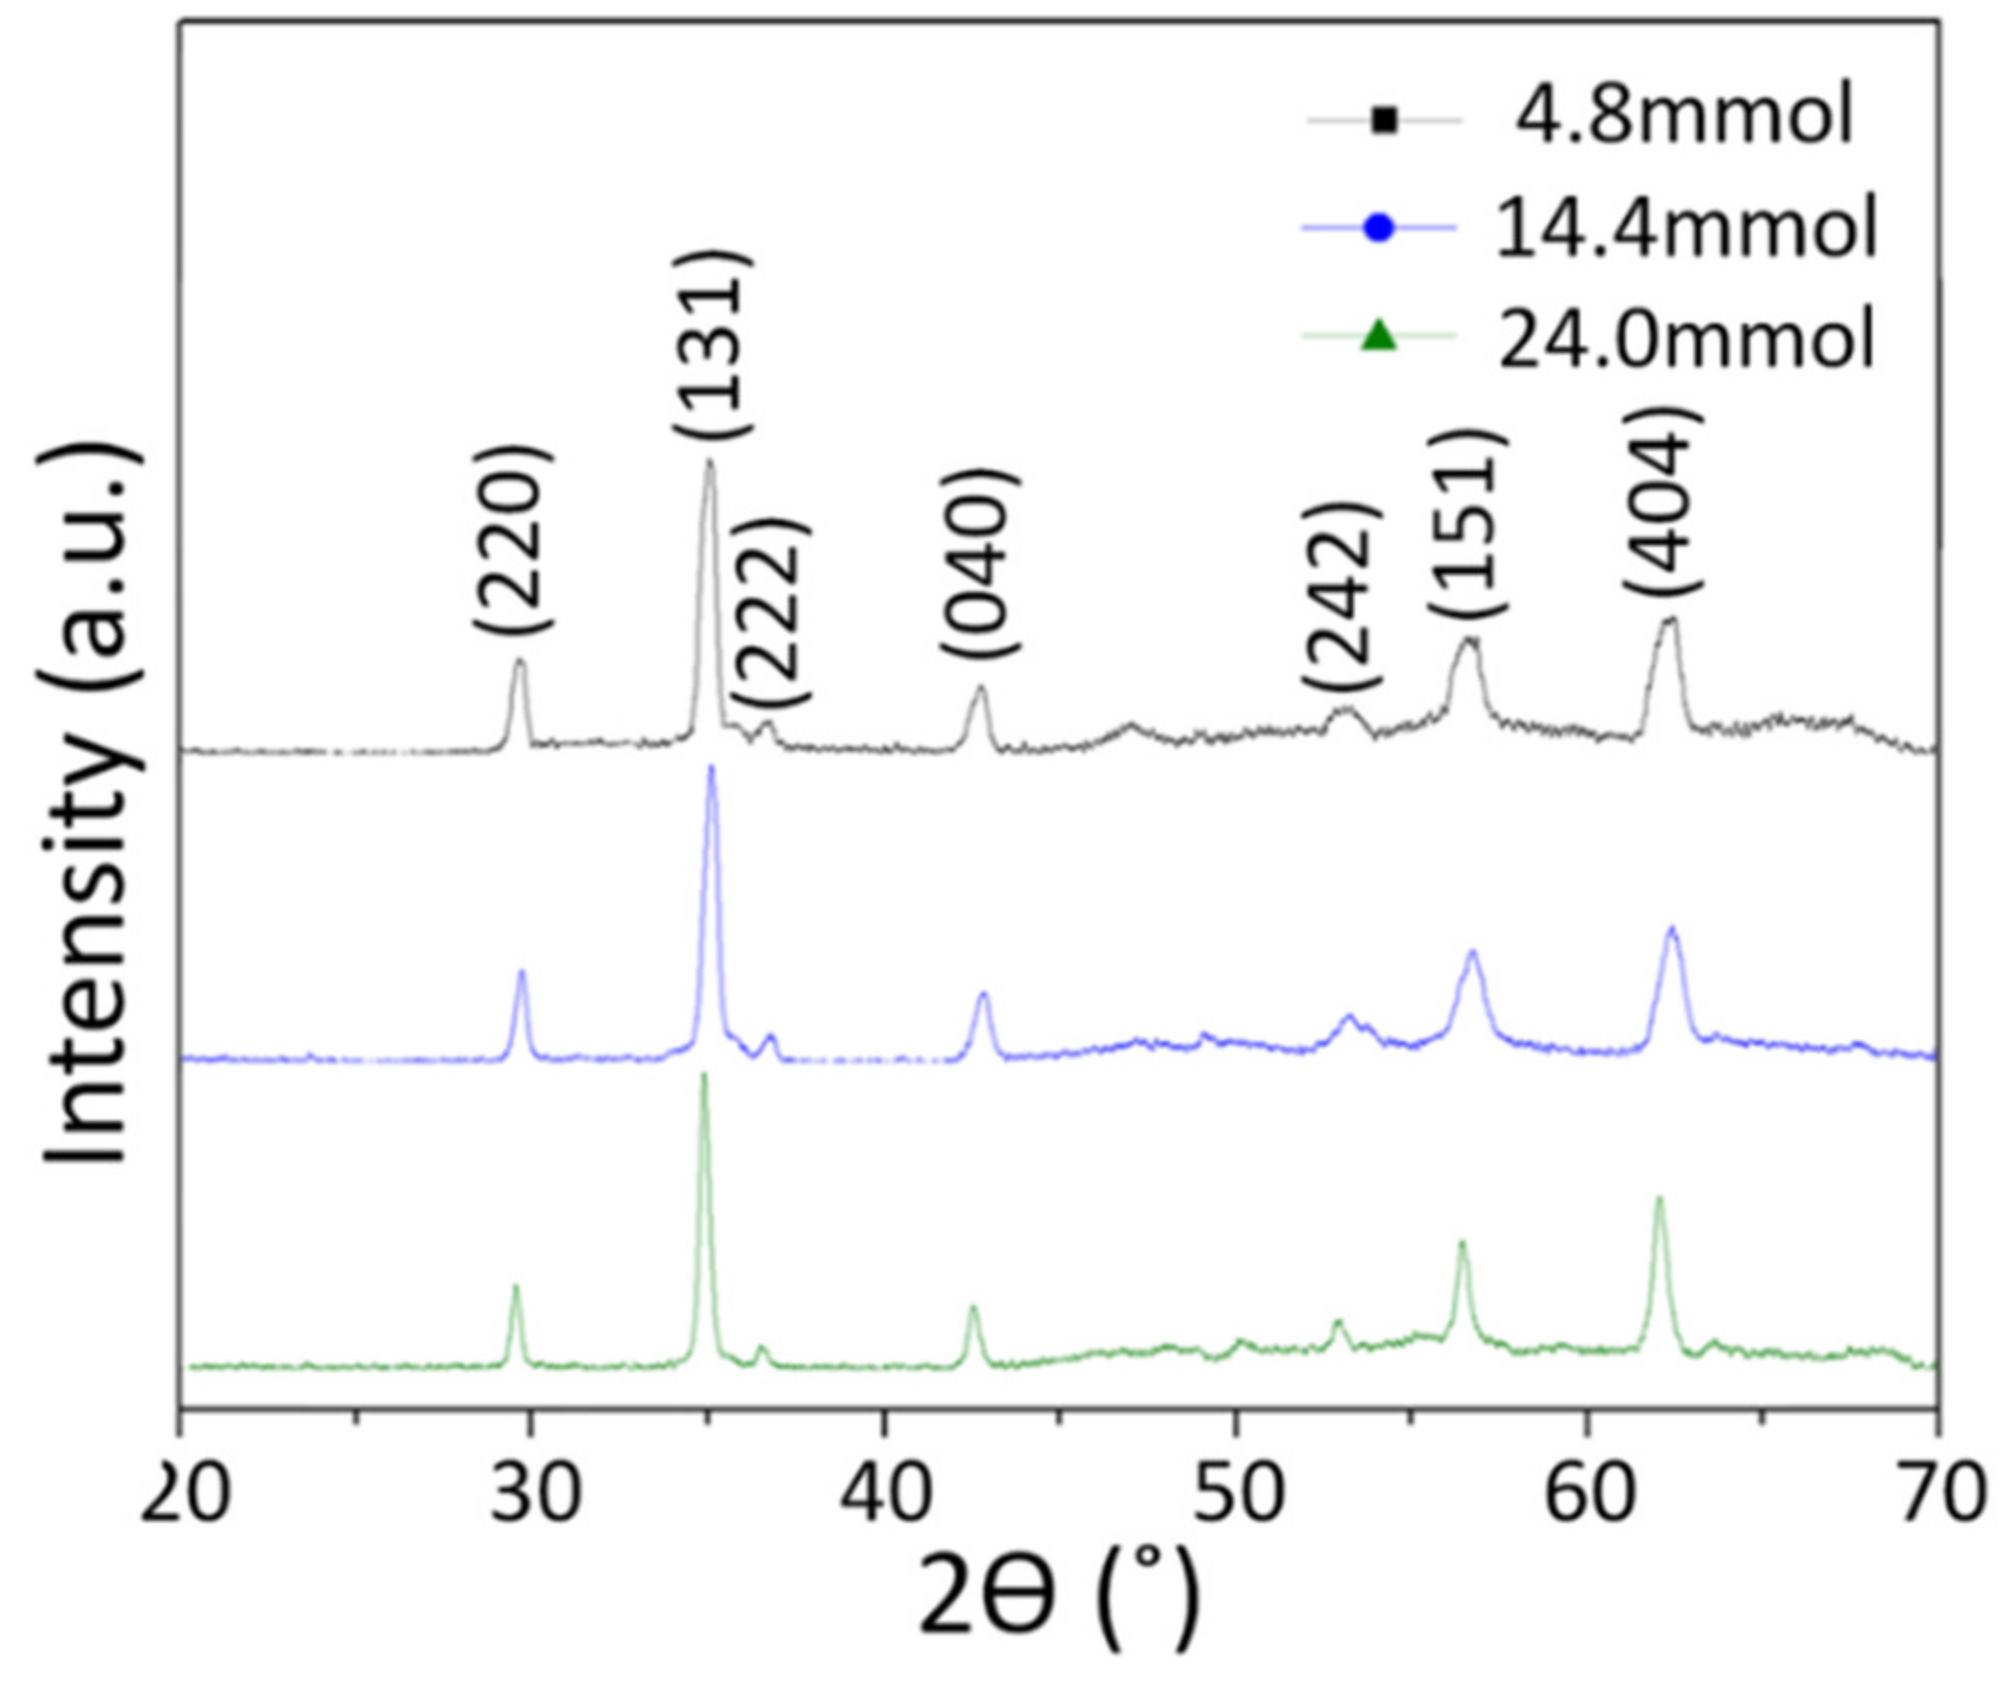
3.3. Calcined Nanofibers
4. Conclusions
Author Contributions
Funding
Acknowledgments
Conflicts of Interest
References
- Zhang, J.Z. Applications of Optical Properties of Nanomaterials. In Optical Properties and Spectroscopy of Nanomaterials; World Scientific: Hackensack, NJ, USA, 2009; pp. 305–357. [Google Scholar]
- Qin, G.; Pei, W.; Ma, X.; Xu, X.; Ren, Y.; Sun, W.; Zuo, L. Enhanced Catalytic Activity of Pt Nanomaterials: From Monodisperse Nanoparticles to Self-Organized Nanoparticle-Linked Nanowires. J. Phys. Chem. C 2010, 114, 6909–6913. [Google Scholar] [CrossRef]
- Avinash, B.S.; Chaturmukha, V.S.; Jayanna, H.S.; Naveen, C.S.; Rajeeva, M.P.; Harish, B.M.; Suresh, S.; Lamani, A.R. Effect of particle size on band gap and DC electrical conductivity of TiO2 nanomaterial. In Proceedings of the International Conference on Condensed Matter and Applied Physics (ICC 2015), Bikaner, India, 30–31 October 2015; p. 20426. [Google Scholar]
- Fan, L.; Su, B.; Qu, J.; Wong, C. Effects of nano-sized particles on electrical and thermal conductivities of polymer composites. In Proceedings of the 2004 1st IEEE Consumer Communications and Networking Conference (IEEE Cat. No.04EX745), Las Vegas, NV, USA, 5–8 January 2004; pp. 193–199. [Google Scholar]
- Bean, C.P.; Livingston, J.D. Superparamagnetism. J. Appl. Phys. 1959, 30, S120–S129. [Google Scholar] [CrossRef]
- Qiao, Y.; Li, C.M. Nanostructured catalysts in fuel cells. J. Mater. Chem. 2011, 21, 4027–4036. [Google Scholar] [CrossRef]
- Su, L.; Jing, Y.; Zhou, Z. Li ion battery materials with core–shell nanostructures. Nanoscale 2011, 3, 3967–3983. [Google Scholar] [CrossRef] [PubMed]
- Raj, D.M.A.; Raj, A.D.; Irudayaraj, A.A. Facile synthesis of rice shaped CuO nanostructures for battery application. J. Mater. Sci. Mater. Electron. 2014, 25, 1441–1445. [Google Scholar] [CrossRef]
- Chen, X.; Zhang, W. Diamond nanostructures for drug delivery, bioimaging, and biosensing. Chem. Soc. Rev. 2017, 46, 734–760. [Google Scholar] [CrossRef]
- Zhu, J.; Zäch, M. Nanostructured materials for photocatalytic hydrogen production. Curr. Opin. Colloid Interface Sci. 2009, 14, 260–269. [Google Scholar] [CrossRef]
- Xia, Y.; Yang, P.; Sun, Y.; Wu, Y.; Mayers, B.; Gates, B.; Yin, Y.; Kim, F.; Yan, H. One-dimensional nanostructures: Synthesis, characterization, and applications. Adv. Mater. 2003, 15, 353–389. [Google Scholar] [CrossRef]
- Weng, B.; Liu, S.; Tang, Z.-R.; Xu, Y.-J. One-dimensional nanostructure based materials for versatile photocatalytic applications. RSC Adv. 2014, 4, 12685–12700. [Google Scholar] [CrossRef]
- Huang, J.; Wan, Q. Gas Sensors Based on Semiconducting Metal Oxide One-Dimensional Nanostructures. Sensors 2009, 9, 9903–9924. [Google Scholar] [CrossRef]
- Agyemang, F.O.; Kim, H. Electrospun ZnFe2O4-based nanofiber composites with enhanced supercapacitive properties. Mater. Sci. Eng. B 2016, 211, 141–148. [Google Scholar] [CrossRef]
- Ansari, S.H.; Arvand, M. A magnetic nanocomposite prepared from electrospun CoFe2O4 nanofibers and graphene oxide as a material for highly sensitive determination of rutin. Microchim. Acta 2020, 187, 103–109. [Google Scholar] [CrossRef]
- Selvaraj, S.; Moon, H.; Kim, D.-H. Synthesis and photo-electrochemical properties of spinel-ferrite-coated hematite for solar water splitting. Appl. Surf. Sci. 2018, 429, 42–47. [Google Scholar] [CrossRef]
- Zhang, X.; Xiang, J.; Wu, Z.; Gong, L.; Chen, X.; Guan, G.; Wang, Y.; Zhang, K. Enhanced absorbing properties and structural design of microwave absorbers based on Ni0.8Co0.2Fe2O4 nanofibers and Ni-C hybrid nanofibers. J. Alloy. Compd. 2018, 764, 691–700. [Google Scholar] [CrossRef]
- He, X.; Zhong, W.; Au, C.T.; Du, Y. Size dependence of the magnetic properties of Ni nanoparticles prepared by thermal decomposition method. Nanoscale Res. Lett. 2013, 8, 446. [Google Scholar] [CrossRef]
- Dutta, P.; Pal, S.; Seehra, M.S.; Shah, N.; Huffman, G.P. Size dependence of magnetic parameters and surface disorder in magnetite nanoparticles. J. Appl. Phys. 2009, 105, 07B501. [Google Scholar] [CrossRef]
- Kim, W.-T.; Choi, W.-Y. Fabrication of TiO2 photonic crystal by anodic oxidation and their optical sensing properties. Sens. Actuators A: Phys. 2017, 260, 178–184. [Google Scholar] [CrossRef]
- Wen, J.; Lao, J.; Wang, D.; Kyaw, T.; Foo, Y.; Ren, Z. Self-assembly of semiconducting oxide nanowires, nanorods, and nanoribbons. Chem. Phys. Lett. 2003, 372, 717–722. [Google Scholar] [CrossRef]
- Paramonov, S.E.; Jun, H.-W.; Hartgerink, J.D. Self-Assembly of Peptide−Amphiphile Nanofibers: The Roles of Hydrogen Bonding and Amphiphilic Packing. J. Am. Chem. Soc. 2006, 128, 7291–7298. [Google Scholar] [CrossRef]
- Zhang, Y.; Li, G.; Jin, Y.; Zhang, J.; Zhang, L.; Zhang, Y. Hydrothermal synthesis and photoluminescence of TiO2 nanowires. Chem. Phys. Lett. 2002, 365, 300–304. [Google Scholar] [CrossRef]
- Lee, C.G.; Na, K.H.; Kim, W.T.; Park, D.C.; Yang, W.H.; Choi, W.Y. TiO2/ZnO Nanofibers Prepared by Electrospinning and Their Photocatalytic Degradation of Methylene Blue Compared with TiO2 Nanofibers. Appl. Sci. 2019, 9, 3404. [Google Scholar] [CrossRef]
- Reneker, D.H.; Yarin, A.L. Electrospinning jets and polymer nanofibers. Polymer 2008, 49, 2387–2425. [Google Scholar] [CrossRef]
- Na, K.-H.; Kim, W.-T.; Song, T.-H.; Choi, W.-Y. Magnetic Properties of NiZn Ferrite Nanofibers Prepared by Electrospinning. Appl. Sci. 2019, 9, 4297. [Google Scholar] [CrossRef]
- Sipos, E.; Kósa, N.; Kazsoki, A.; Szabó, Z.-I.; Zelkó, R. Formulation and Characterization of Aceclofenac-Loaded Nanofiber Based Orally Dissolving Webs. Pharmaceutics 2019, 11, 417. [Google Scholar] [CrossRef] [PubMed]
- Ali, N.N.; Atassi, Y.; Salloum, A.; Charba, A.; Malki, A.; Jafarian, M.; Charba, A. Comparative study of microwave absorption characteristics of (Polyaniline/NiZn ferrite) nanocomposites with different ferrite percentages. Mater. Chem. Phys. 2018, 211, 79–87. [Google Scholar] [CrossRef]
- Song, X.; Liu, W.; Wang, J.; Xu, S.; Liu, B.; Liu, J.; Ma, Y. Microstructural differences between electrospun alumina borate nanofibers prepared by solutions with different PVP contents. Ceram. Int. 2017, 43, 9831–9837. [Google Scholar] [CrossRef]


| Name | Ni(NO3)2·6H2O (g) | Zn(NO3)2·6H2O (g) | Fe(NO3)2·9H2O (g) | PVP (g) | DMF (g) |
|---|---|---|---|---|---|
| 10-A | 0.23 | 0.24 | 1.29 | 10.0 | 90.0 |
| 10-B | 0.70 | 0.71 | 3.88 | ||
| 10-C | 1.16 | 1.19 | 6.46 | ||
| 12.5-A | 0.23 | 0.24 | 1.29 | 12.5 | 87.5 |
| 12.5-B | 0.70 | 0.71 | 3.88 | ||
| 12.5-C | 1.16 | 1.19 | 6.46 | ||
| 15-A | 0.23 | 0.24 | 1.29 | 15.0 | 85.0 |
| 15-B | 0.70 | 0.71 | 3.88 | ||
| 15-C | 1.16 | 1.19 | 6.46 | ||
| 17.5-A | 0.23 | 0.24 | 1.29 | 17.5 | 82.5 |
| 17.5-B | 0.70 | 0.71 | 3.88 | ||
| 17.5-C | 1.16 | 1.19 | 6.46 | ||
| 20-A | 0.23 | 0.24 | 1.29 | 20.0 | 80.0 |
| 20-B | 0.70 | 0.71 | 3.88 | ||
| 20-C | 1.16 | 1.19 | 6.46 |
| Precursor Solution | Temperature Range (°C) | Weight Loss (%) | Total Mass Reduction (%) | Thermal Reaction |
|---|---|---|---|---|
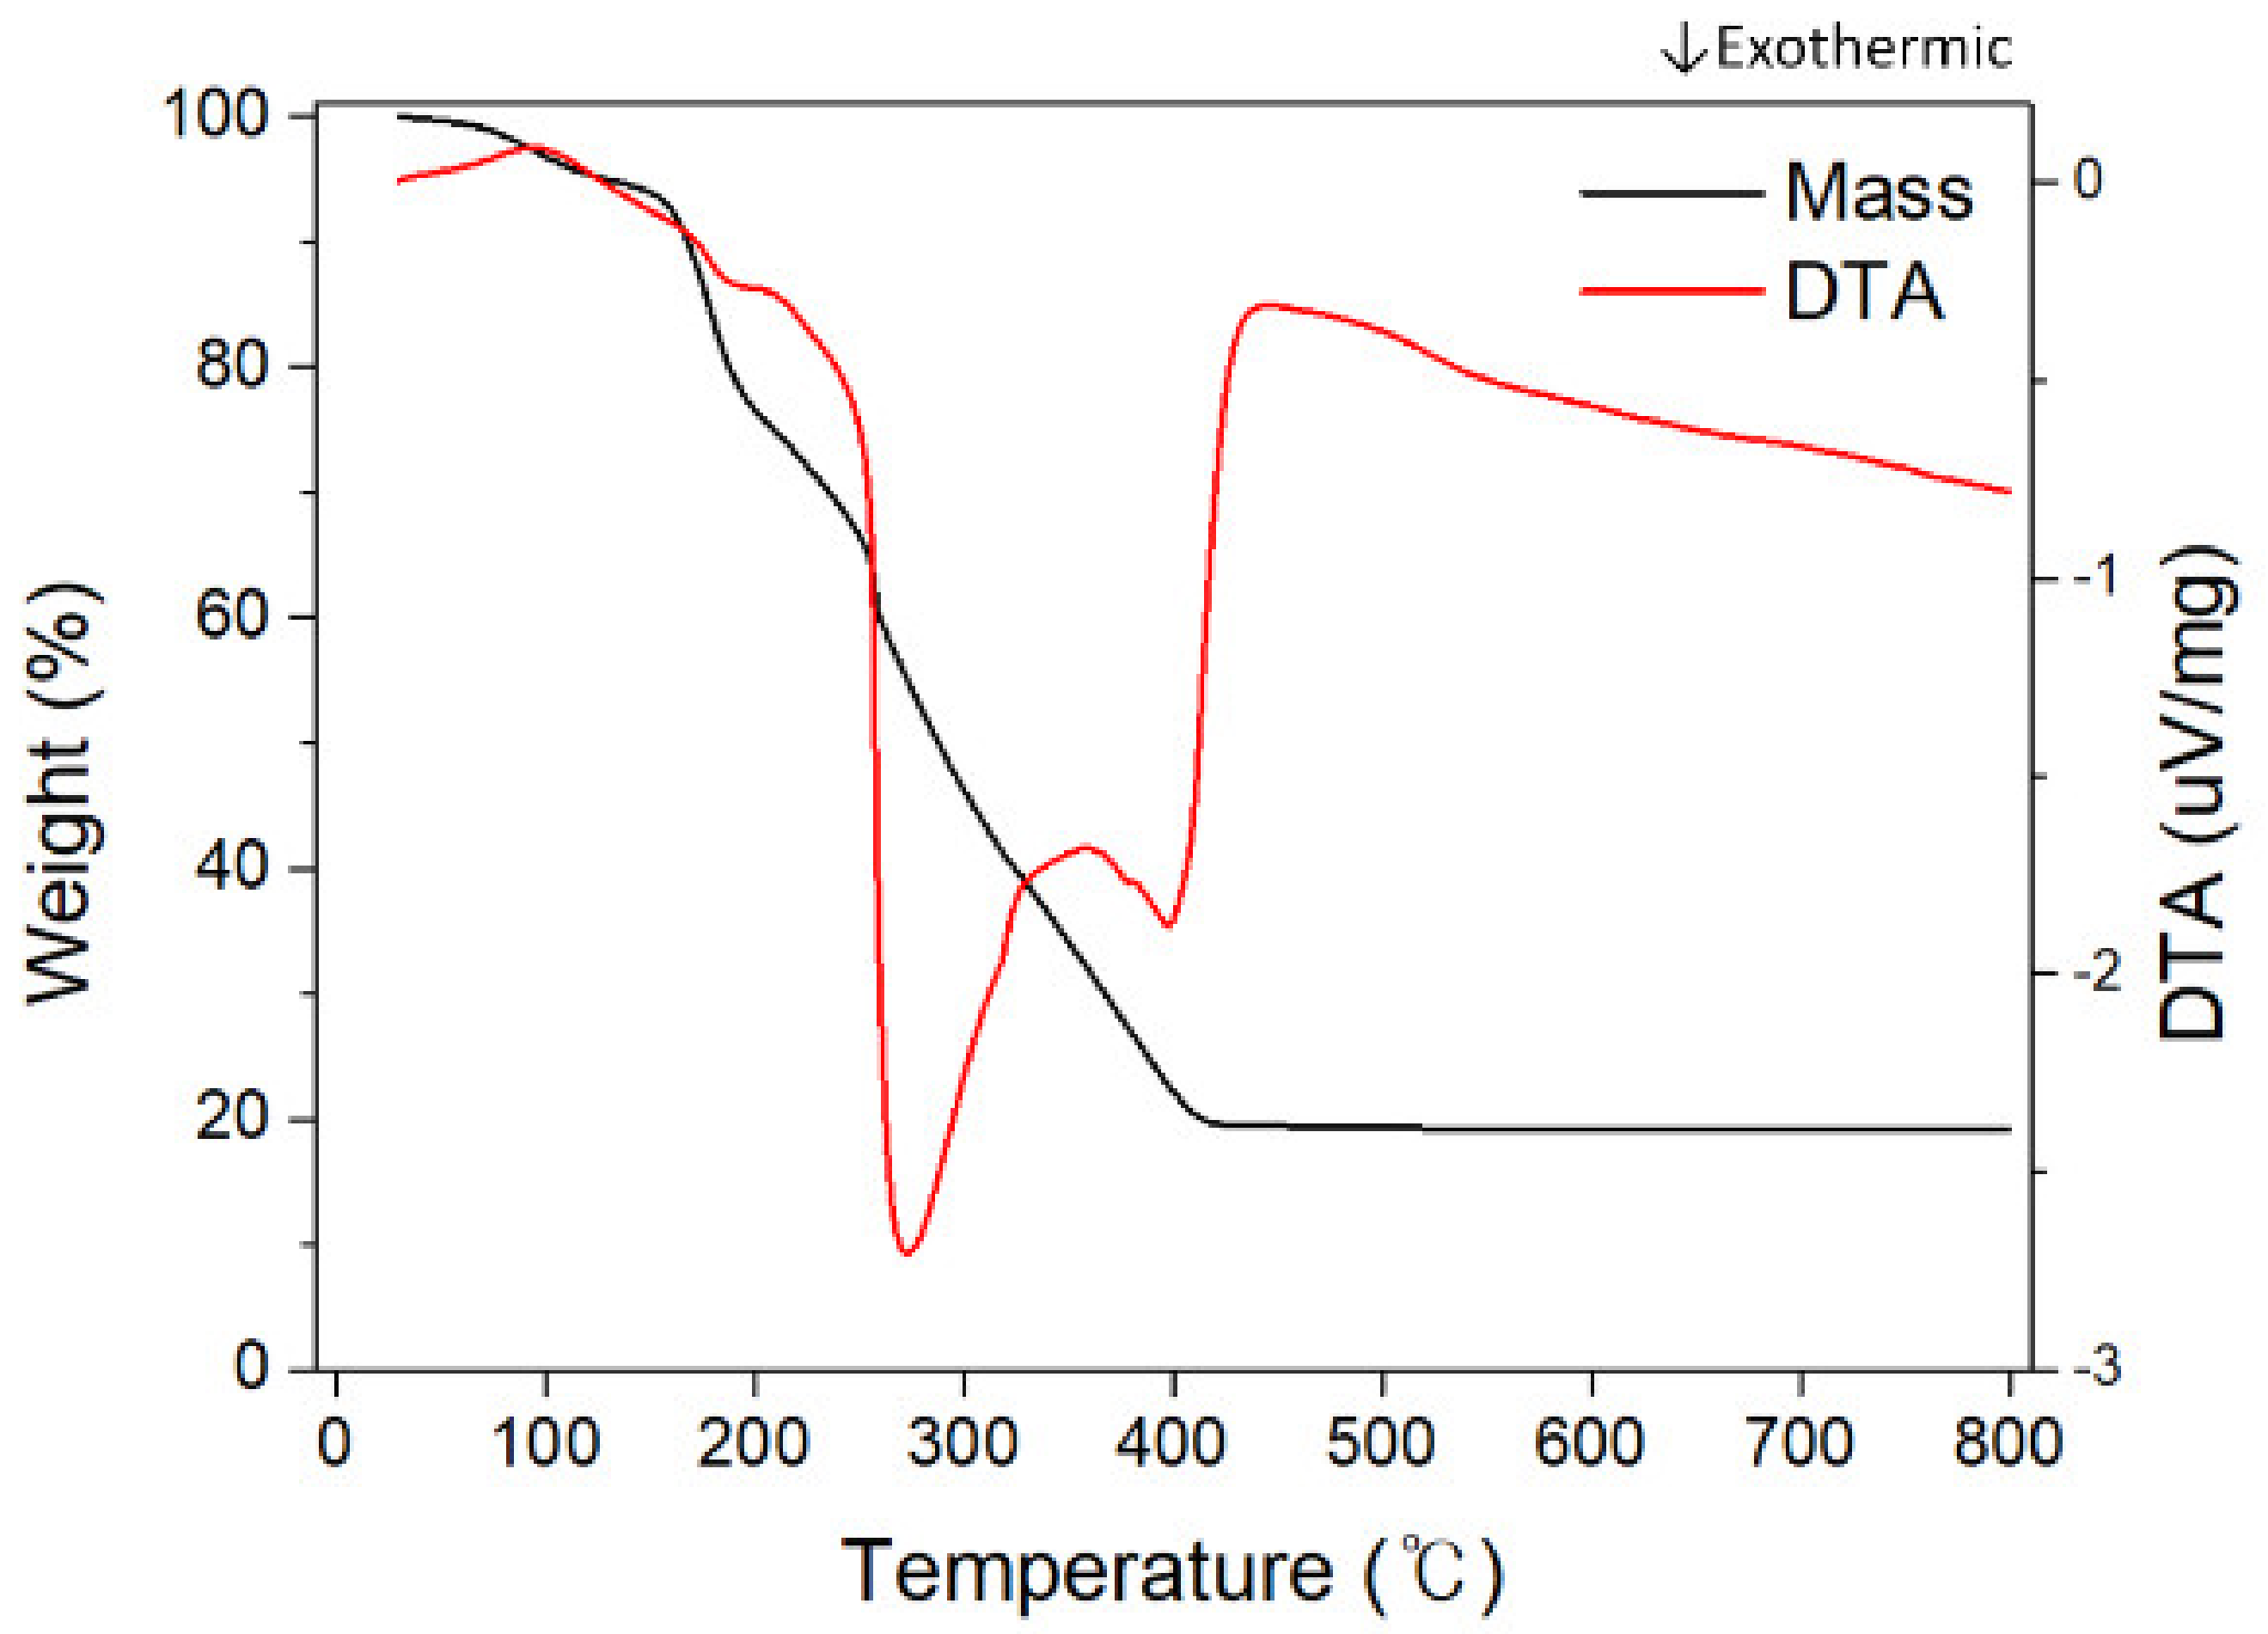
| 15-A | 0–150 | 6.19 | 84.02 | Endothermic |
| 150–240 | 19.58 | Exo/endothermic | ||
| 240–270 | 19.74 | Exothermic | ||
| 270–420 | 38.51 | Exothermic | ||
| 15-B | 0–150 | 6.12 | 80.85 | Endothermic |
| 150–240 | 24.99 | Exo/endothermic | ||
| 240–270 | 13.56 | Exothermic | ||
| 270–420 | 36.18 | Exothermic | ||
| 15-C | 0–150 | 5.47 | 77.57 | Endothermic |
| 150–240 | 24.08 | Exo/endothermic | ||
| 240–270 | 15.19 | Exothermic | ||
| 270–420 | 32.83 | Exothermic |
| Precursor Solution | Plane | 2θ (°) | FWHM (°) | Average Crystallite Size (Diameter, nm) |
|---|---|---|---|---|
| 15-A | (202) | 29.69 | 0.37 | 17.42 |
| (131) | 35.11 | 0.42 | ||
| (404) | 62.46 | 0.81 | ||
| 15-B | (202) | 29.97 | 0.36 | 19.19 |
| (131) | 35.36 | 0.41 | ||
| (404) | 62.58 | 0.78 | ||
| 15-C | (202) | 29.64 | 0.25 | 25.56 |
| (131) | 34.84 | 0.32 | ||
| (404) | 62.16 | 0.64 |
© 2020 by the authors. Licensee MDPI, Basel, Switzerland. This article is an open access article distributed under the terms and conditions of the Creative Commons Attribution (CC BY) license (http://creativecommons.org/licenses/by/4.0/).
Share and Cite
Na, K.-H.; Kim, W.-T.; Song, T.-H.; Kim, S.-W.; Choi, W.-Y. Microstructure of Ni0.5Zn0.5Fe2O4 Nanofiber with Metal Nitrates in Electrospinning Precursor. Nanomaterials 2020, 10, 1344. https://doi.org/10.3390/nano10071344
Na K-H, Kim W-T, Song T-H, Kim S-W, Choi W-Y. Microstructure of Ni0.5Zn0.5Fe2O4 Nanofiber with Metal Nitrates in Electrospinning Precursor. Nanomaterials. 2020; 10(7):1344. https://doi.org/10.3390/nano10071344
Chicago/Turabian StyleNa, Kyeong-Han, Wan-Tae Kim, Tae-Hyeob Song, Sung-Wook Kim, and Won-Youl Choi. 2020. "Microstructure of Ni0.5Zn0.5Fe2O4 Nanofiber with Metal Nitrates in Electrospinning Precursor" Nanomaterials 10, no. 7: 1344. https://doi.org/10.3390/nano10071344
APA StyleNa, K.-H., Kim, W.-T., Song, T.-H., Kim, S.-W., & Choi, W.-Y. (2020). Microstructure of Ni0.5Zn0.5Fe2O4 Nanofiber with Metal Nitrates in Electrospinning Precursor. Nanomaterials, 10(7), 1344. https://doi.org/10.3390/nano10071344