Article

Structural and Enhanced Optical Properties of Stabilized γ‒Bi2O3 Nanoparticles: Effect of Oxygen Ion Vacancies

by
Ashish Chhaganlal Gandhi
,
Chia-Liang Cheng
and
Sheng Yun Wu
*
Department of Physics, National Dong Hwa University, Hualien 97401, Taiwan
*
Author to whom correspondence should be addressed.
Nanomaterials 2020, 10(6), 1023; https://doi.org/10.3390/nano10061023
Submission received: 8 May 2020 / Revised: 20 May 2020 / Accepted: 22 May 2020 / Published: 27 May 2020
(This article belongs to the Special Issue Nanocrystals: Synthesis, Properties and Applications)

Abstract

:
We report the synthesis of room temperature (RT) stabilized γ–Bi2O3 nanoparticles (NPs) at the expense of metallic Bi NPs through annealing in an ambient atmosphere. RT stability of the metastable γ–Bi2O3 NPs is confirmed using synchrotron radiation powder X-ray diffraction and Raman spectroscopy. γ–Bi2O3 NPs exhibited a strong red-band emission peaking at ~701 nm, covering 81% integrated intensity of photoluminescence spectra. Our findings suggest that the RT stabilization and enhanced red-band emission of γ‒Bi2O3 is mediated by excess oxygen ion vacancies generated at the octahedral O(2) sites during the annealing process.

Graphical Abstract

1. Introduction

In recent years, body-centered-cubic (BCC) γ–Bi2O3 nanostructures have received enormous attention because of their enhanced photocatalytic performance for water purification and water splitting [1,2,3,4,5,6,7,8,9,10]. The high-temperature metastable γ–Bi2O3 is one out of nine polymorphs of Bi2O3 (α–, β–, γ–, δ–, ω–, ε–, η–, ζ– and R–phases) [11]. Schumb et al. [12] was the first to report on the preparation of γ–Bi2O3 by heating β–Bi2O3 at 750–800 °C followed by cooling in the air at 639 °C [13]. On further cooling, phase transformation occurs from γ–Bi2O3 to α–Bi2O3 in the temperature range of 368–639 °C [14]. According to Radaev et al. [15], the tetrahedral sites in the BCC structure of γ–Bi2O3 are populated by Bi3+ ions with a probability of 80%, suggesting 20% intrinsic vacancies [16] (given as ⎕) of both Bi and O ions. Therefore, the expected chemical formula of γ–Bi2O3 is written as Bi 12 Bi 0.80 O 19.20 Bi 12 [ ( Bi Bi x O 3 E ) 0.8 ( Bi O 4 ) ] 0.2 O 16 according to Kröger–Vink notation [17]. E represents a 6s2 lone pair of electrons giving a ( Bi Bi x O 3 E ) tetrahedron occupying a 2a symmetric site. The tetrahedrally coordinated vacancy ( Bi O 4 ) is statically distributed over the Bi–O lattice [15]. γ–Bi2O3 belongs to the sillenite family and is isomorphous to Bi12GeO20 (space group I23), where Bi and Ge atoms occupy 24f and 2a symmetric sites [15]. Room temperature (RT) stabilized γ–Bi2O3 was obtained through doping a foreign element at the 2a symmetric site [16,18,19,20,21,22,23]. However, the dopant ions could hamper the intrinsic properties of γ–Bi2O3. Hereof, in recent decades, various physical and chemical methods have been introduced for the synthesis of RT stabilized γ–Bi2O3 nanostructures with various morphologies [1,9]. Versatile forms of nanostructures could be obtained either by heating the mixture at low temperature (40–90 °C) [2,3,24,25,26,27,28,29] or in some methods at high temperature (300–800 °C) [4,6,7,30,31,32].
The synthesis of RT stabilized γ–Bi2O3 through a chemical method is usually sensitive to the preparation conditions such as reaction temperature, time, and additive types [4,20,25]. Li et al. introduced various surfactants for RT stabilization of γ–Bi2O3 [2]. Egorysheva et al. utilized ethylene glycol (EG) and polyethylene glycol [3], and Wang et al. utilized EG for the nucleation of γ–Bi2O3, which otherwise leads to the formation of α–Bi2O3 [24]. Wang et al. reported the formation of surfactant stabilized γ–Bi2O3 due to oxygen vacancy (VO) defects [26]. Ahila et al. reported that the nucleation and grain growth process induced phase transformation from β– to γ–Bi2O3 by consuming surrounding β–Bi2O3 only by annealing anodic bismuth trioxide between 500 and 600 °C [32]. Liu et al. reported the synthesis of RT stabilized γ–Bi2O3 (using the solution crystallization method) over a wide temperature range (300 to 700 °C) [4]. Recently, Bandyopadhyay et al. reported the transformation from α–Bi2O3 to RT stabilized γ–Bi2O3 by the mechanical alloying method [33]. However, as discussed above, the critical factor responsible for RT stabilization of high-temperature metastable γ–Bi2O3 is still unknown. In this regard, a question remains unanswered: what could be the mechanism behind RT stabilization of γ–Bi2O3 at the nanoscale? Is it due to the finite size effect? Or is there any role of defects (such as oxygen vacancies, VO)?
To answer these questions, in this work, we have introduced a simple two-step physical method for the synthesis of RT stabilized γ–Bi2O3 NPs solely at the expense of Bi NPs. The proposed method uses a single parameter, annealing temperature, to prepare γ–Bi2O3 NPs from pure Bi NPs. The method is simple, cost-effective, and free of any additive such as surfactants and template agents, other metal oxides, and post-transition ions. In combination with several sensitive probes, such as synchrotron radiation powder X-ray diffractometer (PXRD), Raman and photoluminescence (PL) spectroscopy, we present a correlation for the VO and RT stabilization of γ–Bi2O3 NPs. Raman spectroscopy, which is a simple and non-destructive technique, can act as a fingerprint of the various polymorphs of Bi2O3 [34]. It is also utilized in analyzing point defects such as cation and anion vacancies [35]. Similarly, PL spectroscopies can be used as a powerful tool in identifying defects, particularly for VO in metal oxides [26,36]. Our experimental results indicate the formation of vacancies at B(1) and O(2) sites during annealing, of which the former could be intrinsic and later play a decisive role in the RT stabilization of γ–Bi2O3. The effect of vacancies leads to Raman peak broadening and red-shift, resulting in an inhomogeneous distorted Bi–O lattice. In particular, it is suggested that the intense red-band emission in γ–Bi2O3 is associated with VO formed at O(2) sites during the annealing process. The new finding in this study is valuable in terms of providing a fundamental understanding of the RT stabilization of γ–Bi2O3 and, from an industrial point of view, creating ease in its mass production for its future use as a photocatalyst.

2. Materials and Methods

Annealing of Bi NPs in the air leads to the formation of bismuth oxides, which can be described as Bi ( NPs ) + O 2 ( air ) Bi 2 O 3 ( NPs ) [37,38]. This route is very simple, cost-effective, and also free from any additional chemicals such as surfactants and template agents, which could introduce impurities as a byproduct [24,33]. Therefore, in this study, the synthesis of γ‒Bi2O3 NPs was carried out in two steps. In the first step, black colored Bi NPs were obtained using the physical vapor deposition (PVD) method, the detail of which has been given in our previous work [39]. In the second step, the as-obtained Bi NPs were annealed at 550 °C with a heating rate of 10 °C min−1 for a duration of 2 h in the air, and subsequently allowed to cool down to ambient temperature. The annealing process resulted in the formation of a whitish-yellow colored powder sample.

3. Results

3.1. Morphological and Elemental Analysis

The surface morphological analysis of each sample was performed using field-emission scanning electron microscopy (FE-SEM) (JEOL JSM-6500 microscope, JEOL Ltd., Tokyo, Japan). To estimate the average atomic percentage (at. %) of the constituent elements, energy dispersive spectroscopy (EDS) (Inca x-sight model 7557, Oxford Instruments, Abingdon, UK) was utilized. For SEM and EDS analyses, the powder sample was initially dispersed in ethanol and sonicated for 30 min. Then, a drop of dispersed powder was put on the silicon wafer, and ethanol was allowed to evaporate under an infra-red lamp. The silicon wafer, along with the sample, was then mounted on a Cu-grid using carbon tape. Figure 1a shows an SEM image of well-connected γ–Bi2O3 NPs. The melting temperature of the bulk metallic Bi is 271 °C, and due to the size effect, it could reduce further to a lower value [37]. Hence, the annealing effect at such a high temperature (i.e., 550 °C) may have led to aggregation because of the melting and coalescence with neighboring particles. A histogram plot of the mean diameter <d> (shortest side of the particles) obtained from the SEM images is shown in Figure 1b. The solid line represents fit using a log-normal distribution function with <d> = 90(1) nm and the standard distribution σ = 0.25(2) in the particle diameter. Figure 1c shows the EDS spectra of γ–Bi2O3 NPs assigned to Bi Mα1 and O Kα1 without any impurity. The small peak of C Kα1 originates from the sample exposed to air. The average Bi and O at. % obtained from nine EDS spectra (Figure S1 and Table S1) for γ–Bi2O3 NPs is 46.50% and 53.50%. The obtained higher Bi/O at. % ratio ~0.87 as compared to 2/3 suggested possible oxygen deficiency in γ–Bi2O3 NPs induced during the growth process.

3.2. Structural Properties

Bi2O3 with its nine polymorphs is a very complex system. Hence, there is a strong possibility that the annealing of Bi in the air could result in a mixed phase compound (i.e., a compound with two or more polymorphs of Bi2O3) [34]. Hence, synchrotron radiation PXRD was employed at the National Synchrotron Radiation Research Center in Hsinchu, Taiwan (beamline BL01C2, λ = 0.7749 Å) for the detailed structural characterization. Figure 2 shows the synchrotron radiation PXRD spectra (open dots), suggesting a good crystallinity of γ–Bi2O3 NPs. The most intense (301) diffraction peak at 2θ = 4.787° can be fitted with a Lorentzian distribution function, giving a full-width at half-maximum (FWHM) β = 0.04996(41)°. Using Scherrer’s formula d = k λ / β cos θ , the calculated grain size of γ–Bi2O3 is d ( 301 ) = 90   nm , which matches very well with the estimated mean diameter from the SEM images.
The structural parameters, including bismuth and oxygen site occupancies, were determined by performing Rietveld refinement of XRPD spectra using the general structure analysis system (GSAS)-II software package [40]. The sites Bi(1), Bi(2), O(1), O(2) and O(3) in the γ–Bi2O3 unit cell are demonstrated in the inset of Figure 2. The best Rietveld refined fit to the diffraction pattern (open dots) is represented by the red line in Figure 2, and the corresponding refinement parameters are given in Table 1. The fitted value of lattice constant a = 10.1115(1) Å (space group I23, No. 197) with a unit cell volume V = 1033.82(3) Å3 is in good agreement with the literature, showing 4% contraction in a unit cell volume with respect to the bulk [15]. Recently, a = 10.3106(3) Å was reported for ~24 nm γ–Bi2O3 NPs prepared using the mechanical alloying method, suggesting that the sample preparation method plays a significant role in defining the size and the structural properties [33]. The fitted value of occupancy at the Bi(1), O(1), and O(3) sites remains very close to 1, whereas the occupancies at the Bi(2) and O(2) sites are 0.943(8) and 0.861(29), respectively. The observed vacancy of Bi (VBi) at Bi(2), i.e., 2a sites, could be intrinsic [15,16]. The excess VO at O(2), i.e., 8c sites, may have been induced during the growth process of γ–Bi2O3. The structural results suggest that the proposed annealing treatment to obtain RT stabilized pure γ–Bi2O3 NPs without any impurity phase or polymorphs of Bi2O3 from metallic Bi NPs is very mild, which eases its mass preparation.

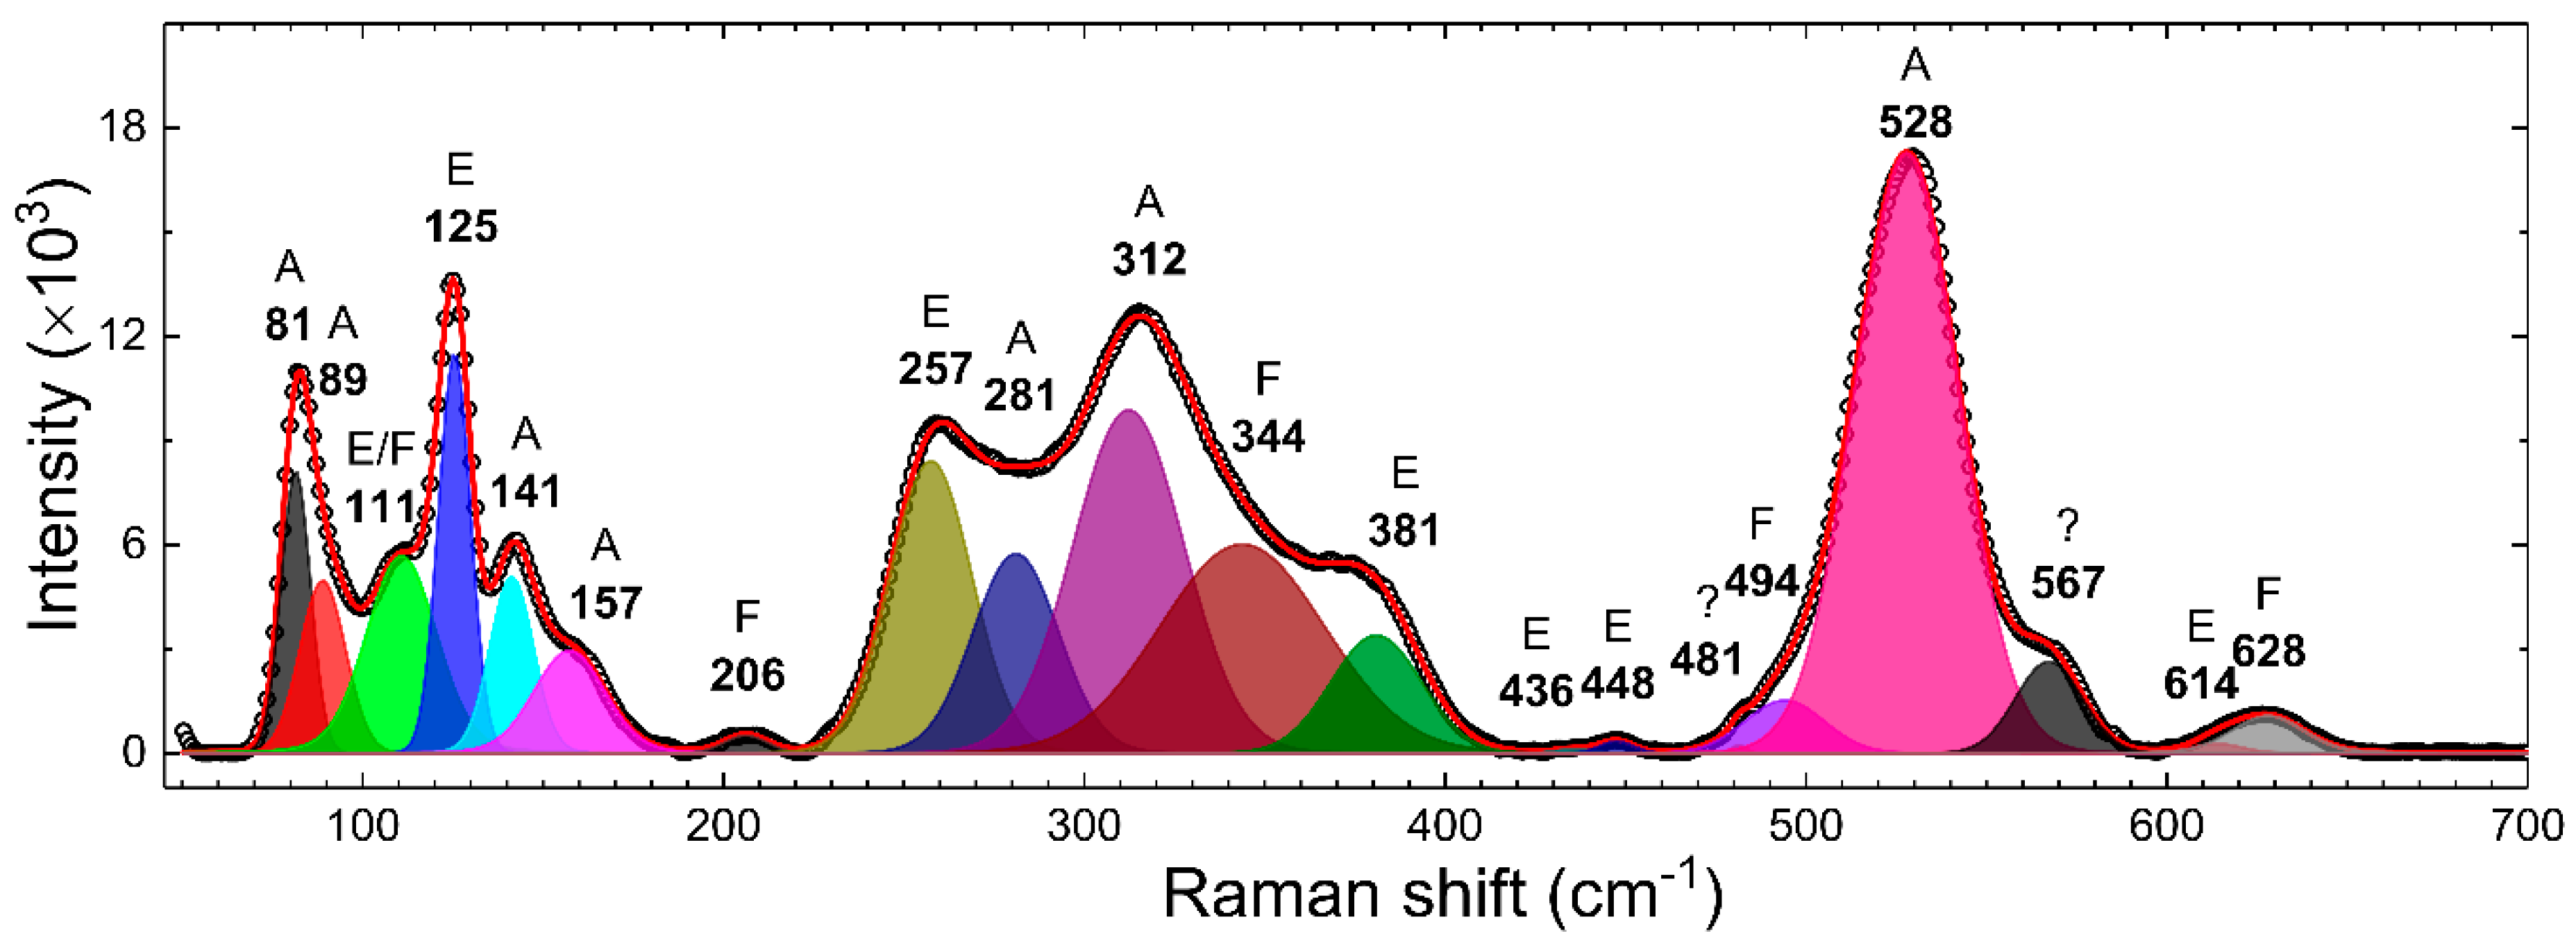
3.3. Raman Spectroscopy

The PXRD measurements above are mainly dominated by the heavier Bi atoms. Due to this, small displacement in the relatively lighter oxygen yields negligible deviation in the diffraction spectra. Furthermore, the Bi(1) and O(1) sites have lower symmetry, and the displacement does not result in a lower symmetry site. On the other hand, optical Raman spectroscopy is sensitive to the Bi–O bonding and the PL spectroscopy to various defects. Hence, red-shift in frequencies and an increase in the line-width of phonon modes can give evidence about the inhomogeneous distribution. To study the phonon vibration, a micro Raman spectrometer (Renishaw, UK with 1800 lines/mm grating) coupled with a microscope (Leica, Wetzlar, Germany) was utilized. A 532 nm wavelength laser with 1% power was used as the excitation. The exposer time was 60 s. A QE65000 charge-coupled device imaging spectrometer was used to detect the PL spectra of the sample. A Q-switched diode-pumped solid-state laser (266 nm) acted as the pumping light source.
RT Raman spectra of γ–Bi2O3 NPs were recorded from 50 to 1100 cm−1. Figure 3 shows the deconvoluted (red line) Raman spectra (open dots) of γ–Bi2O3 NPs over 50 to 700 cm−1. The fitted value of frequencies (FWHM) and integrated area (I.A.) are summarized in Table 2. The BCC γ–Bi2O3 belongs to the sillenite family, and on the basis of one formula unit per primitive cell, a group-theoretical analysis predicts 40 zone-center optical phonon modes: Γ = 8A (totally symmetric) + 8E (doubly degenerate) + 25F (triply degenerate) [41]. Except for one F mode, which is acoustic, all modes are Raman-active, and the F modes are infrared-active. The Raman spectra of γ–Bi2O3 NPs displayed 20 vibration modes, consistent with the literature, where so far, only 8 to 15 modes have been resolved in the same range [4,30,34,42]. The Raman bands in Figure 3 were assigned by comparing with the reported values for γ–Bi2O3 and the theoretical calculations in the literature [30,41,42,43,44,45]. A very weak mode at 481 cm−1 and a broad mode at 567 cm−1, which have been reported for γ–Bi2O3, are so far not assigned to any vibrational mode. The Raman modes below ~650 cm−1 are usually assigned to the internal bismuth–oxygen framework and are indicative of several breathing, stretching, rocking, and bending modes of Bi–O polyhedra in γ–Bi2O3 [30,41,42,43,44,45]. Raman modes in 70–190 cm−1 are quite sharp, whereas most of the modes from 190 to 660 cm−1 are quite broadened with FWHM varying between 14 and 54 cm−1. Salazar-Pérez et al. [30] reported the Raman spectra from oxygen-deficient (confirmed using EDS) γ–Bi2O3 NPs prepared by annealing 10 nm Bi NPs in the air at 700–750 °C for a duration of 30 min. Comparatively, (i) in this work γ–Bi2O3 is formed at a relatively low temperature, which could be possibly related to the use of different size Bi NPs; (ii) all the modes from 190 to 660 cm−1 show red-shift with a magnitude varying between 6 and 25 cm1; (iii) the intensity of modes at 89, 206, and 281 cm−1 is relatively low, and to the naked eye, it appears that these peaks are broadened. The broadening and red-shift give evidence about the inhomogeneous distorted Bi–O lattice. The inhomogeneity could be due to the size effect or formed defects such as Bi and O vacancies, as observed from PXRD.

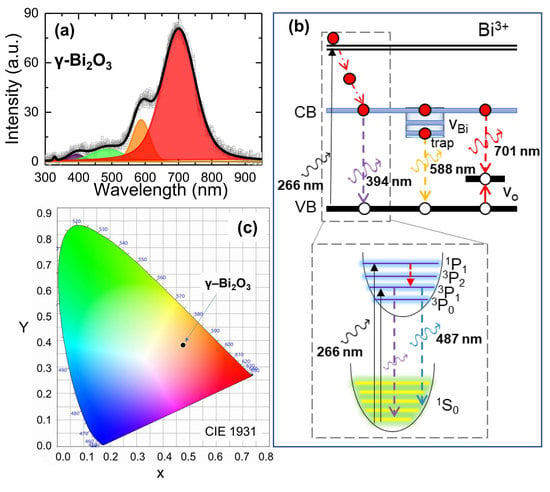
3.4. Photoluminescence Spectroscopy

PL spectroscopy is a powerful tool and has been used in examining electronic transitions and information in the search for impurities, defects, and optical bandgap in semiconductor materials. PL emission from different Bi2O3 polymorphs is mainly attributed to Bi3+ and Bi2+ intrinsic transitions and complex defects such as VO. The luminescence from Bi3+ appears from the blue region to the green region under UV excitation, attributed either to 3P11S0 transition or charge-transfer transitions between oxygen ligands and Bi3+ ions [46,47]. The emission from Bi2+ is attributed to 2P3/2(1) → 2P1/2 transitions, giving rise to luminescence spectra that peak in the wavelength range 591–637 nm under UV excitation [48,49]. Recently, the low-energy red-band emission has been attributed to crystal defects or defect levels associated with VO or bismuth interstitials formed during the growth process [50,51]. Figure 4a presents the RT PL spectra (open dots) of γ–Bi2O3 showing a strong and broad emission from ~350 to 900 nm centered at around 700 nm. The deconvolution of the PL spectra (black line) was carried out using the sum of four emission bands centered at 394, 487, 588, and 701 nm (Table 3), which agrees with the reported spectra in [26]. A schematic energy level diagram for the Bi3+ valence state is shown in Figure 4b. Bi3+ ions have a 6s2 configuration with ground state 1S0. The excited sp state gives a triplet (3P0, 3P1, 3P2) for parallel spin and a single 1P1 for antiparallel spin. The excitation usually occurs from the 1S0 ground state to the 3P1 and 1P1 excited states [49]. The estimated value of a direct bandgap for γ–Bi2O3 NPs using a UV-visible diffuse reflectance spectrum is ~2.9 eV (434 nm) (data are not shown), which is slightly lower than the reported value of 2.95 eV [3] and higher than 2.76–2.83 eV [30]. Therefore, the emission peak at 394 nm (2% of PL spectra) can be indexed as the band-to-band recombination in a direct transition manner (3P11S0). The emission peak at 487 nm (about 6% of PL spectra) should be attributed to blue-green emission corresponding to Bi3+ ions (bottom panel in Figure 4b). The yellow-orange emission at 588 nm (about 11% of PL spectra) is from an impurity trap associated with the surface VO interacting with interfacial bismuth vacancies (VBi) [24]. In general, high PL intensity indicates a higher recombination rate of the photo-excited electron-hole pair and vice versa. The strongest low-energy red emission band (81% of PL spectra), located around 701 nm, could be associated with various structural defects such as VO, VBi, and an interstitial defect that may have formed during the growth process. The effect of annealing at such a high temperature (550 °C) is more favorable to generate vacancies rather than interstitial defects if the energy and chemical balance between the NPs and the ambient gas is taken into consideration. Therefore, both VO and VBi could have been formed simultaneously. However, the observed oxygen deficiency from EDS, vacancies at O(2) sites from PXRD, a red-shift, and a line-width broadening from Raman spectra suggest that VO density defect levels could lead to intense red-band emission. Wang et al. also reported similar red-band emission centered at 705 nm and attributed to a high density of VO on the surface of γ–Bi2O3 [26]. Kumari et al. also reported emission maxima between 660 and 770 nm from composite α/β–Bi2O3 attributed to defect/impurity states induced by oxygen vacancies present in the nanostructures [47]. Recently, a schematic study carried out by Schmidt et al. reported an enhanced red-band emission from a sample with a high density of VO in α–Bi2O3 [51]. Wu et al. affirmed that the higher PL emission intensity of red-band emission means a higher VO density. Furthermore, luminescence is strongly affected by the process of sample preparation [52]. Therefore, under UV excitation, the red-band emission ~701 nm arises when the photogenerated holes trapped in the deep-level VO recombine with the electrons trapped at a shallow level located just below the conduction band.
The international commission on illumination (CIE) 1931 color space chromaticity diagram in the (x, y) coordinates system shows the orange color of the PL emission from γ–Bi2O3 NPs (Figure 5). The chromaticity coordinates (0.4759, 0.3819) with correlated color temperature (CCT) is 2274 K for γ–Bi2O3 NPs.

4. Discussion

Now we ask, what could be the possible mechanism behind the RT stabilization of γ–Bi2O3? Based on the above analysis, it appears that the excess VO generated within γ–Bi2O3 may have played an important role in RT stabilization [53]. The excess VO could be residing either at tetrahedral O(3) sites [16] or at the octahedral O(1) and/or O(2) sites. As discussed in the Introduction, there exists a high density of intrinsic VO defects on the surface of γ–Bi2O3 tetrahedra, i.e., O(3) (8c) sites [15]. However, according to theoretical calculations, the introduction of VO at O(3) sites makes the crystal structure of γ–Bi2O3 further distorted, due to which it loses its I23 symmetry. Therefore, as observed from PXRD analysis, it is possible that during the annealing process, a high density of VO defects could have been formed in γ–Bi2O3 at octahedra O(2) sites (in the internal Bi–O framework) such that the excess defects may have prevented the transformation from BCC to monoclinic α–Bi2O3 phase, which, in turn, resulted in the formation of RT stabilized γ–Bi2O3 NPs [26]. In conclusion, RT stabilized γ–Bi2O3 NPs with a mean diameter of 90 nm were successfully prepared at the expense of Bi NPs simply by annealing at 550 °C for a duration of 2 h in an ambient atmosphere. The proposed method is very mild, which eases the mass production of γ–Bi2O3 NPs. PXRD and Raman spectroscopy confirmed the RT stabilization of formed single-crystalline BCC γ–Bi2O3 NPs. The observed red-shift and broadening in the phonon modes associated with the inhomogeneously distorted Bi–O lattice were ascribed to Bi and oxygen vacancy defects. γ–Bi2O3 NPs exhibited a strong red-band emission, peaking at ~701 nm, and covering 81% integrated intensity of the PL spectra. Our findings suggest that the RT stabilization and enhanced red-band emission in γ‒Bi2O3 is mediated by excess oxygen ion vacancies generated at the octahedra O(2) sites during the thermal annealing process in an ambient atmosphere, as observed from PXRD. The new finding in this study is valuable in terms of providing a fundamental understanding of the RT stabilization of γ–Bi2O3 for future use as a photocatalyst.

Supplementary Materials

The following are available online at https://www.mdpi.com/2079-4991/10/6/1023/s1, Figure S1: Total 9 SEM images and EDS spectra with points, from which the chemical data is collected, Table S1: Summary of Bi and O atomic percentage collected from EDS spectra and their average value.

Author Contributions

Conceptualization, methodology, validation, formal analysis, investigation, writing—original draft preparation, visualization, project administration, A.C.G.; resources, C.-L.C.; resources, data curation, supervision, writing—review and editing, funding acquisition, S.Y.W. All authors have read and agreed to the published version of the manuscript.

Funding

This research was funded by the ministry of science and technology (MOST) of the Republic of China, grant numbers MOST-107-2112-M-259005-MY3 and MOST-107-2811-M-259-005. The article processing charge (APC) was funded by MOST.

Conflicts of Interest

The authors declare no conflict of interest.

References

  1. Sonkusare, V.N.; Chaudhary, R.G.; Bhusari, G.S.; Rai, A.R.; Juneja, H.D. Microwave-mediated synthesis, photocatalytic degradation and antibacterial activity of α-Bi2O3 microflowers/novel γ-Bi2O3 microspindles. Nano-Struct. Nano-Objects 2018, 13, 121–131. [Google Scholar] [CrossRef]
  2. Li, K.; Li, S.; Zhang, J.; Feng, Z.; Li, C. Preparation and stabilization of γ-Bi2O3 photocatalyst by adding surfactant and its photocatalytic performance. Mater. Res. Express 2017, 4, 065902. [Google Scholar] [CrossRef]
  3. Egorysheva, A.V.; Gaitko, O.M.; Kuvshinova, T.B.; Golodukhina, S.V.; Lebedev, V.A.; Erov, K.E. Targeted synthesis ultrafine α- and γ-Bi2O3 having different morphologies. Russ. J. Inorg. Chem. 2017, 62, 1426–1434. [Google Scholar] [CrossRef]
  4. Liu, G.; Li, S.; Lu, Y.; Zhang, J.; Feng, Z.; Li, C. Controllable synthesis of α-Bi2O3 and γ-Bi2O3 with high photocatalytic activity by α-Bi2O3→γ-Bi2O3→α-Bi2O3 transformation in a facile precipitation method. J. Alloy. Compd. 2016, 689, 787–799. [Google Scholar] [CrossRef]
  5. Wang, F.; Cao, K.; Zhang, Q.; Gong, X.; Zhou, Y. A computational study on the photoelectric properties of various Bi2O3 polymorphs as visible-light driven photocatalysts. J. Mol. Model. 2014, 20, 2506. [Google Scholar] [CrossRef] [PubMed]
  6. Iyyapushpam, S.; Nishanthi, S.T.; Pathinettam Padiyan, D. Enhanced photocatalytic degradation of methyl orange by gamma Bi2O3 and its kinetics. J. Alloy. Compd. 2014, 601, 85–87. [Google Scholar] [CrossRef]
  7. Hao, W.; Gao, Y.; Jing, X.; Zou, W.; Chen, Y.; Wang, T. Visible light photocatalytic properties of metastable γ-Bi2O3 with different morphologies. J. Mater. Sci. Technol. 2014, 30, 192–196. [Google Scholar] [CrossRef]
  8. Han, M.; Sun, T.; Tan, P.Y.; Chen, X.; Tan, O.K.; Tse, M.S. m-BiVO4@γ-Bi2O3 core–shell p–n heterogeneous nanostructure for enhanced visible-light photocatalytic performance. RSC Adv. 2013, 3, 24964–24970. [Google Scholar] [CrossRef]
  9. Sun, Y.; Wang, W.; Zhang, L.; Zhang, Z. Design and controllable synthesis of α-/γ- Bi2O3 homojunction with synergetic effect on photocatalytic activity. Chem. Eng. 2012, 211–212, 161–167. [Google Scholar] [CrossRef]
  10. Shang, J.; Zou, W.; Hao, W.; Xin, X.; Xu, H.; Wang, T. Visible-light photocatalytic properties of γ-Bi2O3 composited with Fe2O3. Rare Metal 2011, 30, 140–143. [Google Scholar] [CrossRef]
  11. Weber, M.; Rüffer, T.; Speck, F.; Göhler, F.; Weimann, D.P.; Schalley, C.A.; Seyller, T.; Lang, H.; Mehring, M. From a cerium-doped polynuclear bismuth oxido cluster to β-Bi2O3:Ce. Inorg. Chem. 2020, 59, 3353–3366. [Google Scholar] [CrossRef] [PubMed]
  12. Schumb, W.C.; Rittner, E.S. Polymorphism of bismuth trioxide1. J. Am. Chem. Soc. 1943, 65, 1055–1060. [Google Scholar] [CrossRef]
  13. Harwig, H.A.; Gerards, A.G. The polymorphism of bismuth sesquioxide. Thermochim. Acta 1979, 28, 121–131. [Google Scholar] [CrossRef]
  14. Mehring, M. From molecules to bismuth oxide-based materials: Potential homo- and heterometallic precursors and model compounds. Coord. Chem. Rev. 2007, 251, 974–1006. [Google Scholar] [CrossRef]
  15. Radaev, S.F.; Yu, V.I.S.; Kargin, F. Structural features of y-phase Bi2O3 and its place in the sillenite family. Acta Cryst. 1992, 48, 6. [Google Scholar] [CrossRef] [Green Version]
  16. Deng, H.; Hao, W.; Xu, H.; Wang, C. Effect of intrinsic oxygen vacancy on the electronic structure of γ-Bi2O3: First-principles calculations. J. Phys. Chem. C 2012, 116, 1251–1255. [Google Scholar] [CrossRef]
  17. Kröger, F.A.; Vink, H.J. Relations between the concentrations of imperfections in solids. J. Phys. Chem. Solids 1958, 5, 208–223. [Google Scholar] [CrossRef]
  18. Poleti, D.; Karanović, L.; Zdujić, M.; Jovalekić, Č.; Branković, Z. Mechanochemical synthesis of γ-Bi2O3. Solid State Sci. 2004, 6, 239–245. [Google Scholar] [CrossRef]
  19. Gurunathan, K. Photocatalytic hydrogen production using transition metal ions-doped γ-Bi2O3 semiconductor particles. Int. J. Hydrog. Energy 2004, 29, 933–940. [Google Scholar] [CrossRef]
  20. Wu, Y.-C.; Huang, Y.-T.; Yang, H.-Y. Crystallization mechanism and photocatalytic performance of vanadium-modified bismuth oxide through precipitation processes at room temperature. Cryst. Eng. Commun. 2016, 18, 6881–6888. [Google Scholar] [CrossRef]
  21. Popescu, T.; Lupu, A.R.; Feder, M.; Tarabasanu-Mihaila, D.; Teodorescu, V.S.; Vlaicu, A.M.; Diamandescu, L. In vitro toxicity evaluation of Ti4+-stabilized γ-Bi2O3 sillenites. Toxicol. Vitr. 2014, 28, 1523–1530. [Google Scholar] [CrossRef] [PubMed]
  22. Dapčević, A.; Poleti, D.; Karanović, L. Improved structural model of Pb-doped γ-Bi2O3: (Bi23.68Pb0.32)(Bi1.28Pb0.72)O38.48. Powder Diffr. 2012, 27, 2–7. [Google Scholar]
  23. Branković, M.Z.; Branković, O.G.; Poleti, D.D.; Karanović, Č.L.; Varela, A.J. Correlation between chemical composition of the γ- Bi2O3 phase and the properties of ZnO varistors. Chem. Ind. Chem. Eng. Q. 2005, 11, 4. [Google Scholar]
  24. Wang, Y.; Li, Z.; Yu, H.; Guo, L. Controllable synthesis of metastable γ-Bi2O3 architectures and optical properties. Mater. Sci. Semicond. Process. 2017, 64, 55–62. [Google Scholar] [CrossRef]
  25. Jia, B.; Zhang, J.; Luan, J.; Li, F.; Han, J. Synthesis and growth mechanism of various structures Bi2O3 via chemical precipitate method. J. Mater. Sci. Mater. 2017, 28, 11084–11090. [Google Scholar] [CrossRef]
  26. Wang, Y.; Li, Y. Metastable γ-Bi2O3 tetrahedra: Phase-transition dominated by polyethylene glycol, photoluminescence and implications for internal structure by etch. J. Colloid Interface Sci. 2015, 454, 238–244. [Google Scholar] [CrossRef] [PubMed]
  27. Lu, H.; Wang, S.; Zhao, L.; Dong, B.; Xu, Z.; Li, J. Surfactant-assisted hydrothermal synthesis of Bi2O3 nano/microstructures with tunable size. RSC Adv. 2012, 2, 3374–3378. [Google Scholar] [CrossRef]
  28. Jing, H.; Chen, X.; Jiang, X. Controlled synthesis of bismuth oxide microtetrahedrons and cubes by precipitation in alcohol–water systems. Micro Nano Lett. 2012, 7, 357–359. [Google Scholar] [CrossRef]
  29. Tseng, T.-K.; Choi, J.; Jung, D.-W.; Davidson, M.; Holloway, P.H. Three-dimensional self-assembled hierarchical architectures of gamma-phase flowerlike bismuth oxide. ACS Appl. Mater. Interfaces 2010, 2, 943–946. [Google Scholar] [CrossRef]
  30. Weber, M.; Rodriguez, R.D.; Zahn, D.R.T.; Mehring, M. γ-Bi2O3—To be or not to be? Comparison of the Sillenite γ-Bi2O3 and isomorphous sillenite-type Bi12SiO20. Inorg. Chem. 2018, 57, 8540–8549. [Google Scholar] [CrossRef]
  31. Weber, M.; Schlesinger, M.; Mehring, M. Evaluation of synthetic methods for Bismuth(III) oxide polymorphs: Formation of binary versus ternary oxides. Cryst. Growth Des. 2016, 16, 5678–5688. [Google Scholar] [CrossRef]
  32. Ahila, M.; Dhanalakshmi, J.; Selvakumari, J.C.; Padiyan, D.P. Heat treatment effect on crystal structure and design of highly sensitive room temperature CO2 gas sensors using anodic Bi2O3 nanoporous formed in a citric acid electrolyte. Mater. Res. Express 2016, 3, 105025. [Google Scholar] [CrossRef]
  33. Bandyopadhyay, S.; Dutta, S.; Dutta, A.; Pradhan, S.K. Mechanosynthesis of nanocrystalline fully stabilized bcc γ-phase of Bi2O3 without any additive: Manifestation of ferroelasticity in microstructure, optical, and transport properties. Cryst. Growth Des. 2018, 18, 6564–6572. [Google Scholar] [CrossRef]
  34. Salazar-Pérez, A.J.; Camacho-López, M.A.; Morales-Luckie, R.A.; Sánchez-Mendieta, V.; Ureña-Ñúñez, F.; Arenas-Alatorre, J. Structural evolution of Bi2O3 prepared by thermal oxidation of bismuth nano-particles. Superf. Vacío 2005, 18, 4–8. [Google Scholar]
  35. Gandhi, A.C.; Pant, J.; Pandit, S.D.; Dalimbkar, S.K.; Chan, T.-S.; Cheng, C.-L.; Ma, Y.-R.; Wu, S.Y. Short-range magnon excitation in NiO nanoparticles. J. Phys. Chem. C 2013, 117, 18666–18674. [Google Scholar] [CrossRef]
  36. Gandhi, A.C.; Wu, S.Y. Strong deep-level-emission photoluminescence in NiO nanoparticles. Nanomaterials 2017, 7, 231. [Google Scholar] [CrossRef]
  37. Yang, B.; Mo, M.; Hu, H.; Li, C.; Yang, X.; Li, Q.; Qian, Y. A rational self-sacrificing template route to β-Bi2O3 nanotube arrays. Eur. J. Inorg. Chem. 2004, 2004, 1785–1787. [Google Scholar] [CrossRef]
  38. Xiao, X.; Hu, R.; Liu, C.; Xing, C.; Qian, C.; Zuo, X.; Nan, J.; Wang, L. Facile large-scale synthesis of β-Bi2O3 nanospheres as a highly efficient photocatalyst for the degradation of acetaminophen under visible light irradiation. Appl. Catal. B Environ. 2013, 140–141, 433–443. [Google Scholar] [CrossRef]
  39. Gandhi, A.C.; Gaikwad, S.S.; Peng, J.-C.; Wang, C.-W.; Chan, T.S.; Wu, S.Y. Strong electron-phonon coupling in superconducting bismuth nanoparticles. APL Mater. 2019, 7, 031111. [Google Scholar] [CrossRef] [Green Version]
  40. Toby, B.H.; Von Dreele, R.B. GSAS-II: The genesis of a modern open-source all purpose crystallography software package. J. Appl. Cryst. 2013, 46, 6. [Google Scholar]
  41. Venugopalan, S.; Ramdas, A.K. Raman spectra of bismuth germanium oxide and bismuth silicon oxide. Phys. Rev. B 1972, 5, 4065–4079. [Google Scholar] [CrossRef]
  42. Egorysheva, A.V.; Yu, V.I.B.; Kargin, F.; Plotnichenko, V.G.; Koltashev, V.V.; Obraztsova, E.D.; Terekhov, S.V. Atomic structure features of sillenite crystals as probed by raman spectroscopy. Zhurnal Neorg. Khimii 2005, 38, 9. [Google Scholar]
  43. Wiehl, L.; Friedrich, A.; Haussühl, E.; Morgenroth, W.; Grzechnik, A.; Friese, K.; Winkler, B.; Refson, K.; Milman, V. Structural compression and vibrational properties of Bi12SiO20 sillenite from experiment and theory. J. Condens. Matter Phys. 2010, 22, 505401. [Google Scholar] [CrossRef] [PubMed] [Green Version]
  44. Mihailova, B.; Gospodinov, M.; Konstantinov, L. Raman spectroscopy study of sillenites. I. Comparison between Bi12(Si,Mn)O20 single crystals. J. Phys. Chem. Solids 1999, 60, 1821–1827. [Google Scholar] [CrossRef]
  45. Wojdowski, W. Vibrational Modes in Bi12GeO20 and Bi12SiO20 Crystals. Phys. Status Solidi B 1985, 130, 121–130. [Google Scholar] [CrossRef]
  46. Blasse, G.; Zhiran, H.; Winnubst, A.J.A.; Burggraaf, A.J. The luminescence of yitria stabilized zirconia doped with Bi2O3. Mater. Res. Bull. 1984, 19, 1057–1062. [Google Scholar] [CrossRef] [Green Version]
  47. Kumari, L.; Lin, J.-H.; Ma, Y.-R. One-dimensional Bi2O3 nanohooks: Synthesis, characterization and optical properties. J. Phys. Condens. Matter 2007, 19, 406204. [Google Scholar] [CrossRef]
  48. Hamstra, M.A.; Folkerts, H.F.; Blasse, G. Materials chemistry communications. Red bismuth emission in alkaline-earth-metal sulfates. J. Mater. Chem. 1994, 4, 1349–1350. [Google Scholar] [CrossRef]
  49. Gaft, M.; Reisfeld, R.; Panczer, G.; Boulon, G.; Saraidarov, T.; Erlish, S. The luminescence of Bi, Ag and Cu in natural and synthetic barite BaSO4. Opt. Mater. 2001, 16, 279–290. [Google Scholar] [CrossRef]
  50. Wu, Y.Q.; Lu, G.X. The roles of density-tunable surface oxygen vacancy over bouquet-like Bi2O3 in enhancing photocatalytic activity. Phys. Chem. Chem. Phys. 2014, 16, 4165–4175. [Google Scholar] [CrossRef]
  51. Schmidt, S.; Kubaski, E.T.; Li, M.S.; Bezzon, V.D.N.; Sequinel, T.; Tebcherani, S.M. Blue or red photoluminescence emission in α-Bi2O3 needles: Effect of synthesis method. Luminscence 2018, 33, 1281–1287. [Google Scholar] [CrossRef] [PubMed]
  52. Rafiaei, S.M.; Shokouhimehr, M. Impact of process parameters on luminescence properties and nanostructure of YVO4:Eu phosphor. Mater. Chem. Phys. 2019, 229, 431–436. [Google Scholar] [CrossRef]
  53. Shukla, S.; Seal, S. Mechanisms of room temperature metastable tetragonal phase stabilization in zirconia. Int. Mater. Rev. 2005, 50, 45–64. [Google Scholar] [CrossRef]
Figure 1. Plots of (a) SEM image; (b) the histogram of mean diameter distribution where the solid line represents long-normal distribution fit; and (c) EDS spectra of γ–Bi2O3 nanoparticles (NPs).
Nanomaterials 10 01023 g001
Figure 2. Rietveld refined (red line) PXRD spectra (open dots) of γ–Bi2O3 NPs. Green and blue lines represent the background and difference between observed and fitted PXRD spectra. A unit cell of γ–Bi2O3 is shown in the inset.
Nanomaterials 10 01023 g002
Figure 3. Deconvoluted (red line) room temperature (RT) Raman spectra (open dots) of γ–Bi2O3 NPs. The fitted values of frequencies and the corresponding vibration modes (A, E, and F) are shown.
Nanomaterials 10 01023 g003
Figure 4. (a) Deconvoluted (black line) RT PL spectra (open dots) of γ–Bi2O3 NPs. Inset in (a) shows a pie chart representing the integrated area of deconvoluted peaks; (b) a schematic energy level diagram for Bi3+ valence state.
Nanomaterials 10 01023 g004
Figure 5. CIE 1931 color space chromaticity diagram in the (x, y) coordinates system showing orange color (black dot) of the PL emission from γ–Bi2O3 NPs.
Nanomaterials 10 01023 g005
Table 1. Rietveld refined parameters for XPRD spectra of γ–Bi2O3 NPs. All structural and lattice parameters were allowed to very simultaneously until the weighted wR factor and the goodness of fitting (GOF), differed by less than one part in a thousand in two successive cycles 1.
SitesElementxyzOccupancy
24fBi(1)0.8244(1)0.6801(1)0.9881(1)0.9989(4)
2aBi(2)0000.943(8)
24fO(1)0.8690(7)0.7661(7)0.4884(16)1.0104(17)
8cO(2)0.8093(16)0.8093(16)0.8093(16)0.861(29)
8cO(3)0.162(3)0.162(3)0.162(3)1.08(4)
1 lattice parameter a = b = c =10.1115(1) Å; volume V = 1033.82(3) Å3; Space group I23 (No. 197); wR(%) = 2.460; goodness of fitting (GOF) (%) = 4.71.
Table 2. Summary of deconvoluted Raman spectra of γ–Bi2O3 NPs.
Vibration Symmetry [41]Frequency (cm−1)FWHM (cm−1)I.A. (%)
A81103.2
A89153.0
A141143.0
A157232.9
A281286.6
A3123614.6
A5283424.0
E/F111235.6
E125104.9
E257279.3
E381304.0
E448110.2
E614160.2
F206140.3
F3445413.2
F436120.05
F494261.6
F628241.1
?567222.3
?48150.05
Table 3. Summary of deconvoluted photoluminescence spectra of γ–Bi2O3 NPs.
Peak Center (nm)FWHM (nm)Integrated Area (a.u.)
39457259
487115912
588611657
70112011,936

