Development of Porous Titania Structure with Improved Photocatalytic Activity: Response Surface Modeling and Multi-Objective Optimization

 , ,
, ,
Abstract
1. Introduction
2. Materials and Methods
2.1. Materials
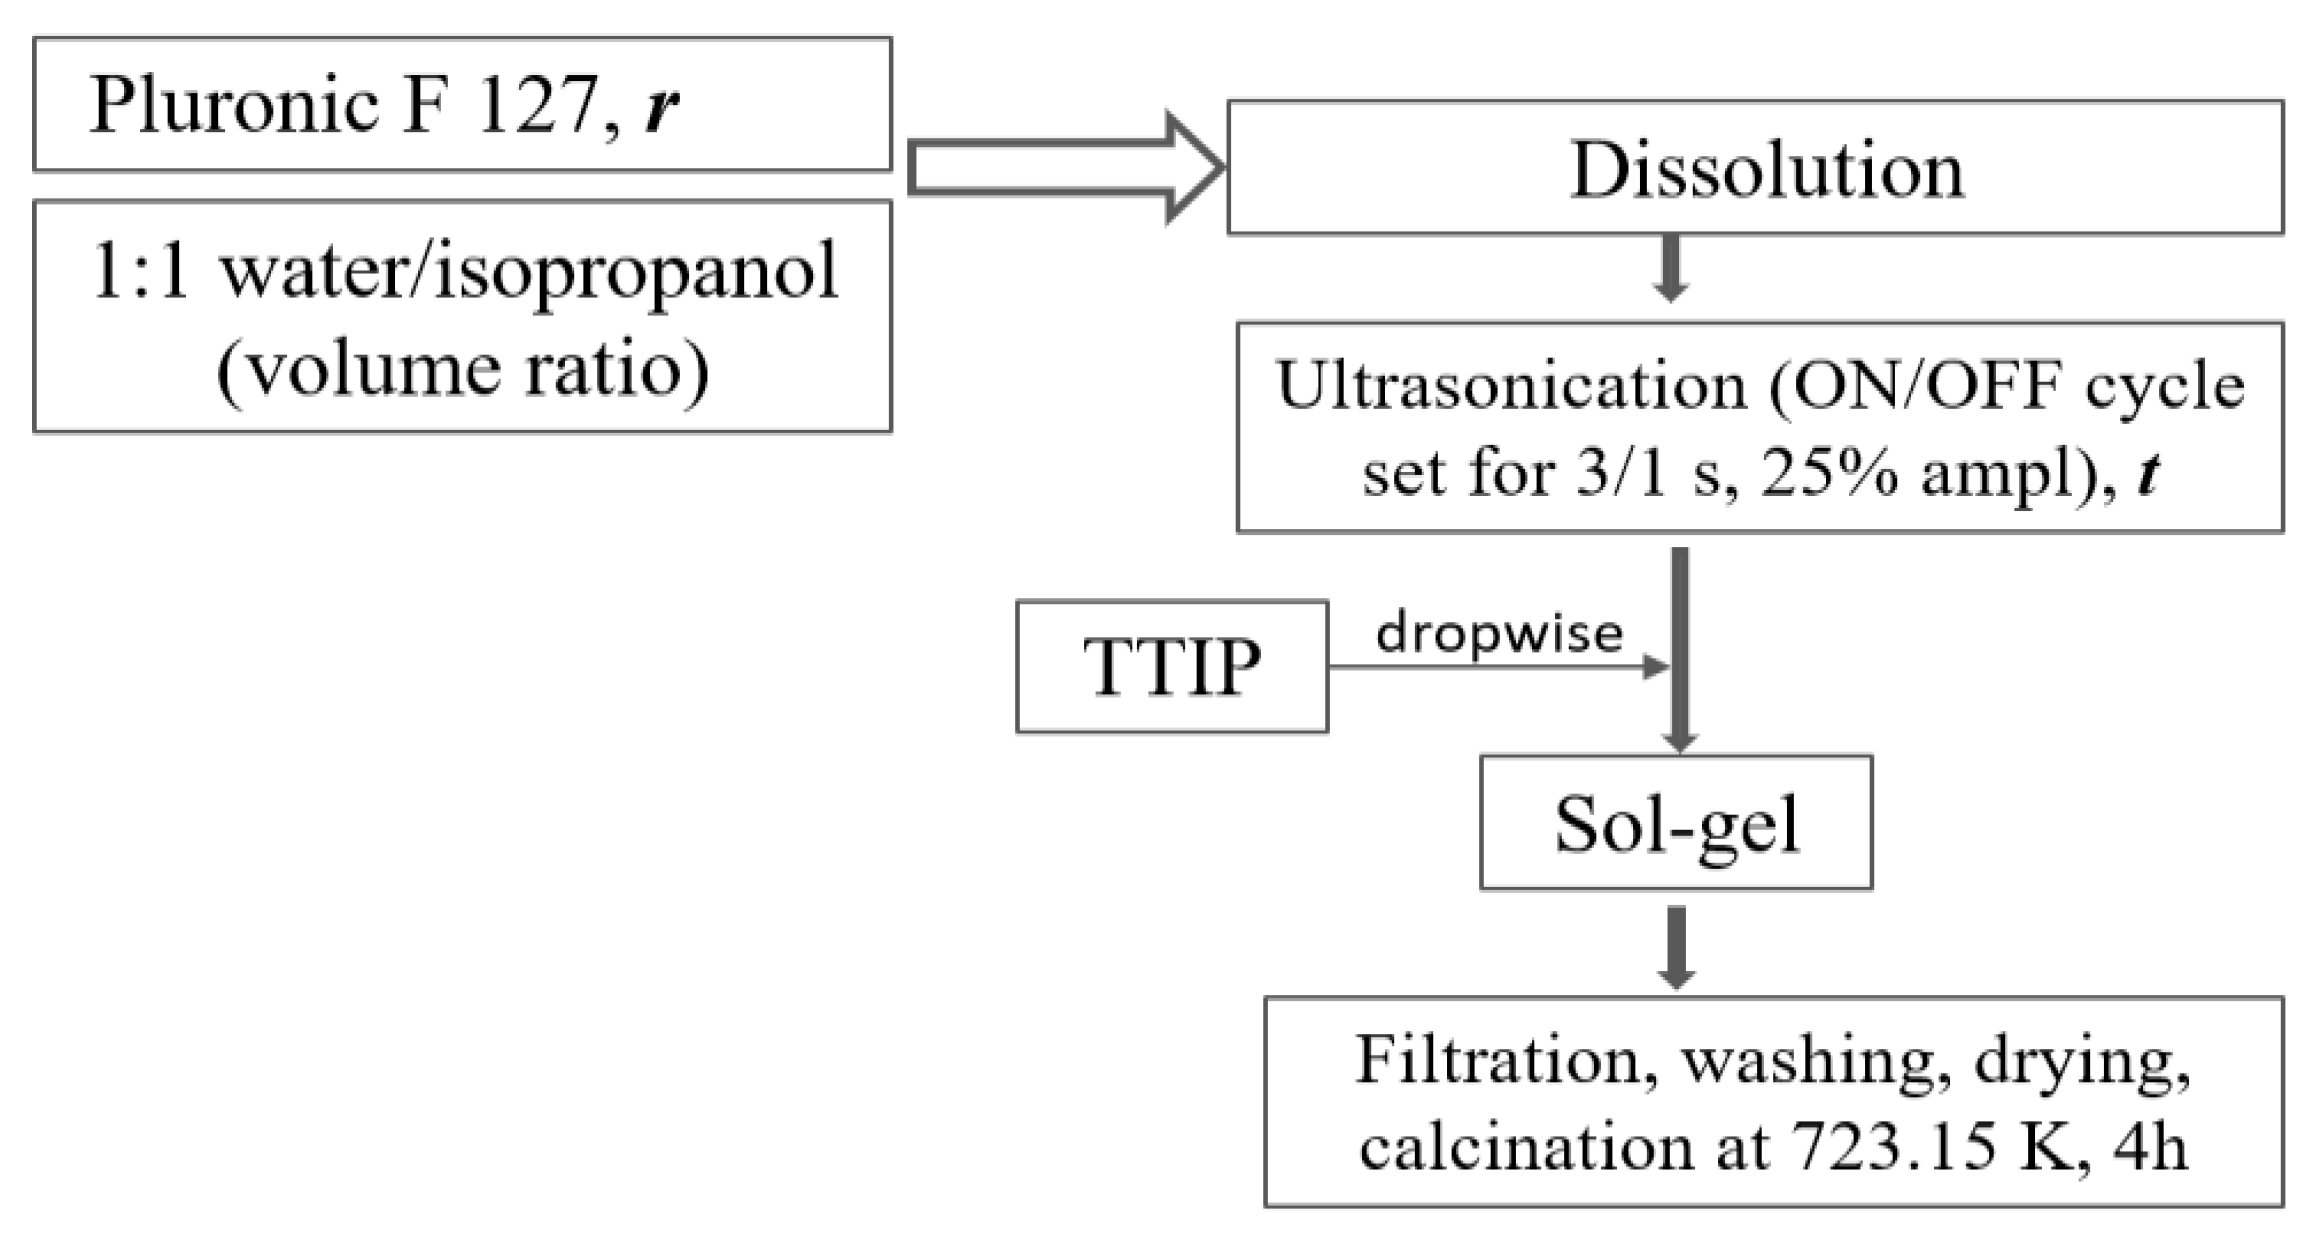
2.2. TiO2 Synthesis
2.3. Materials Characterization
2.4. Photocatalytic Experiment
3. Results and Discussions
3.1. Design of Experiments and Multiple Regression Modeling
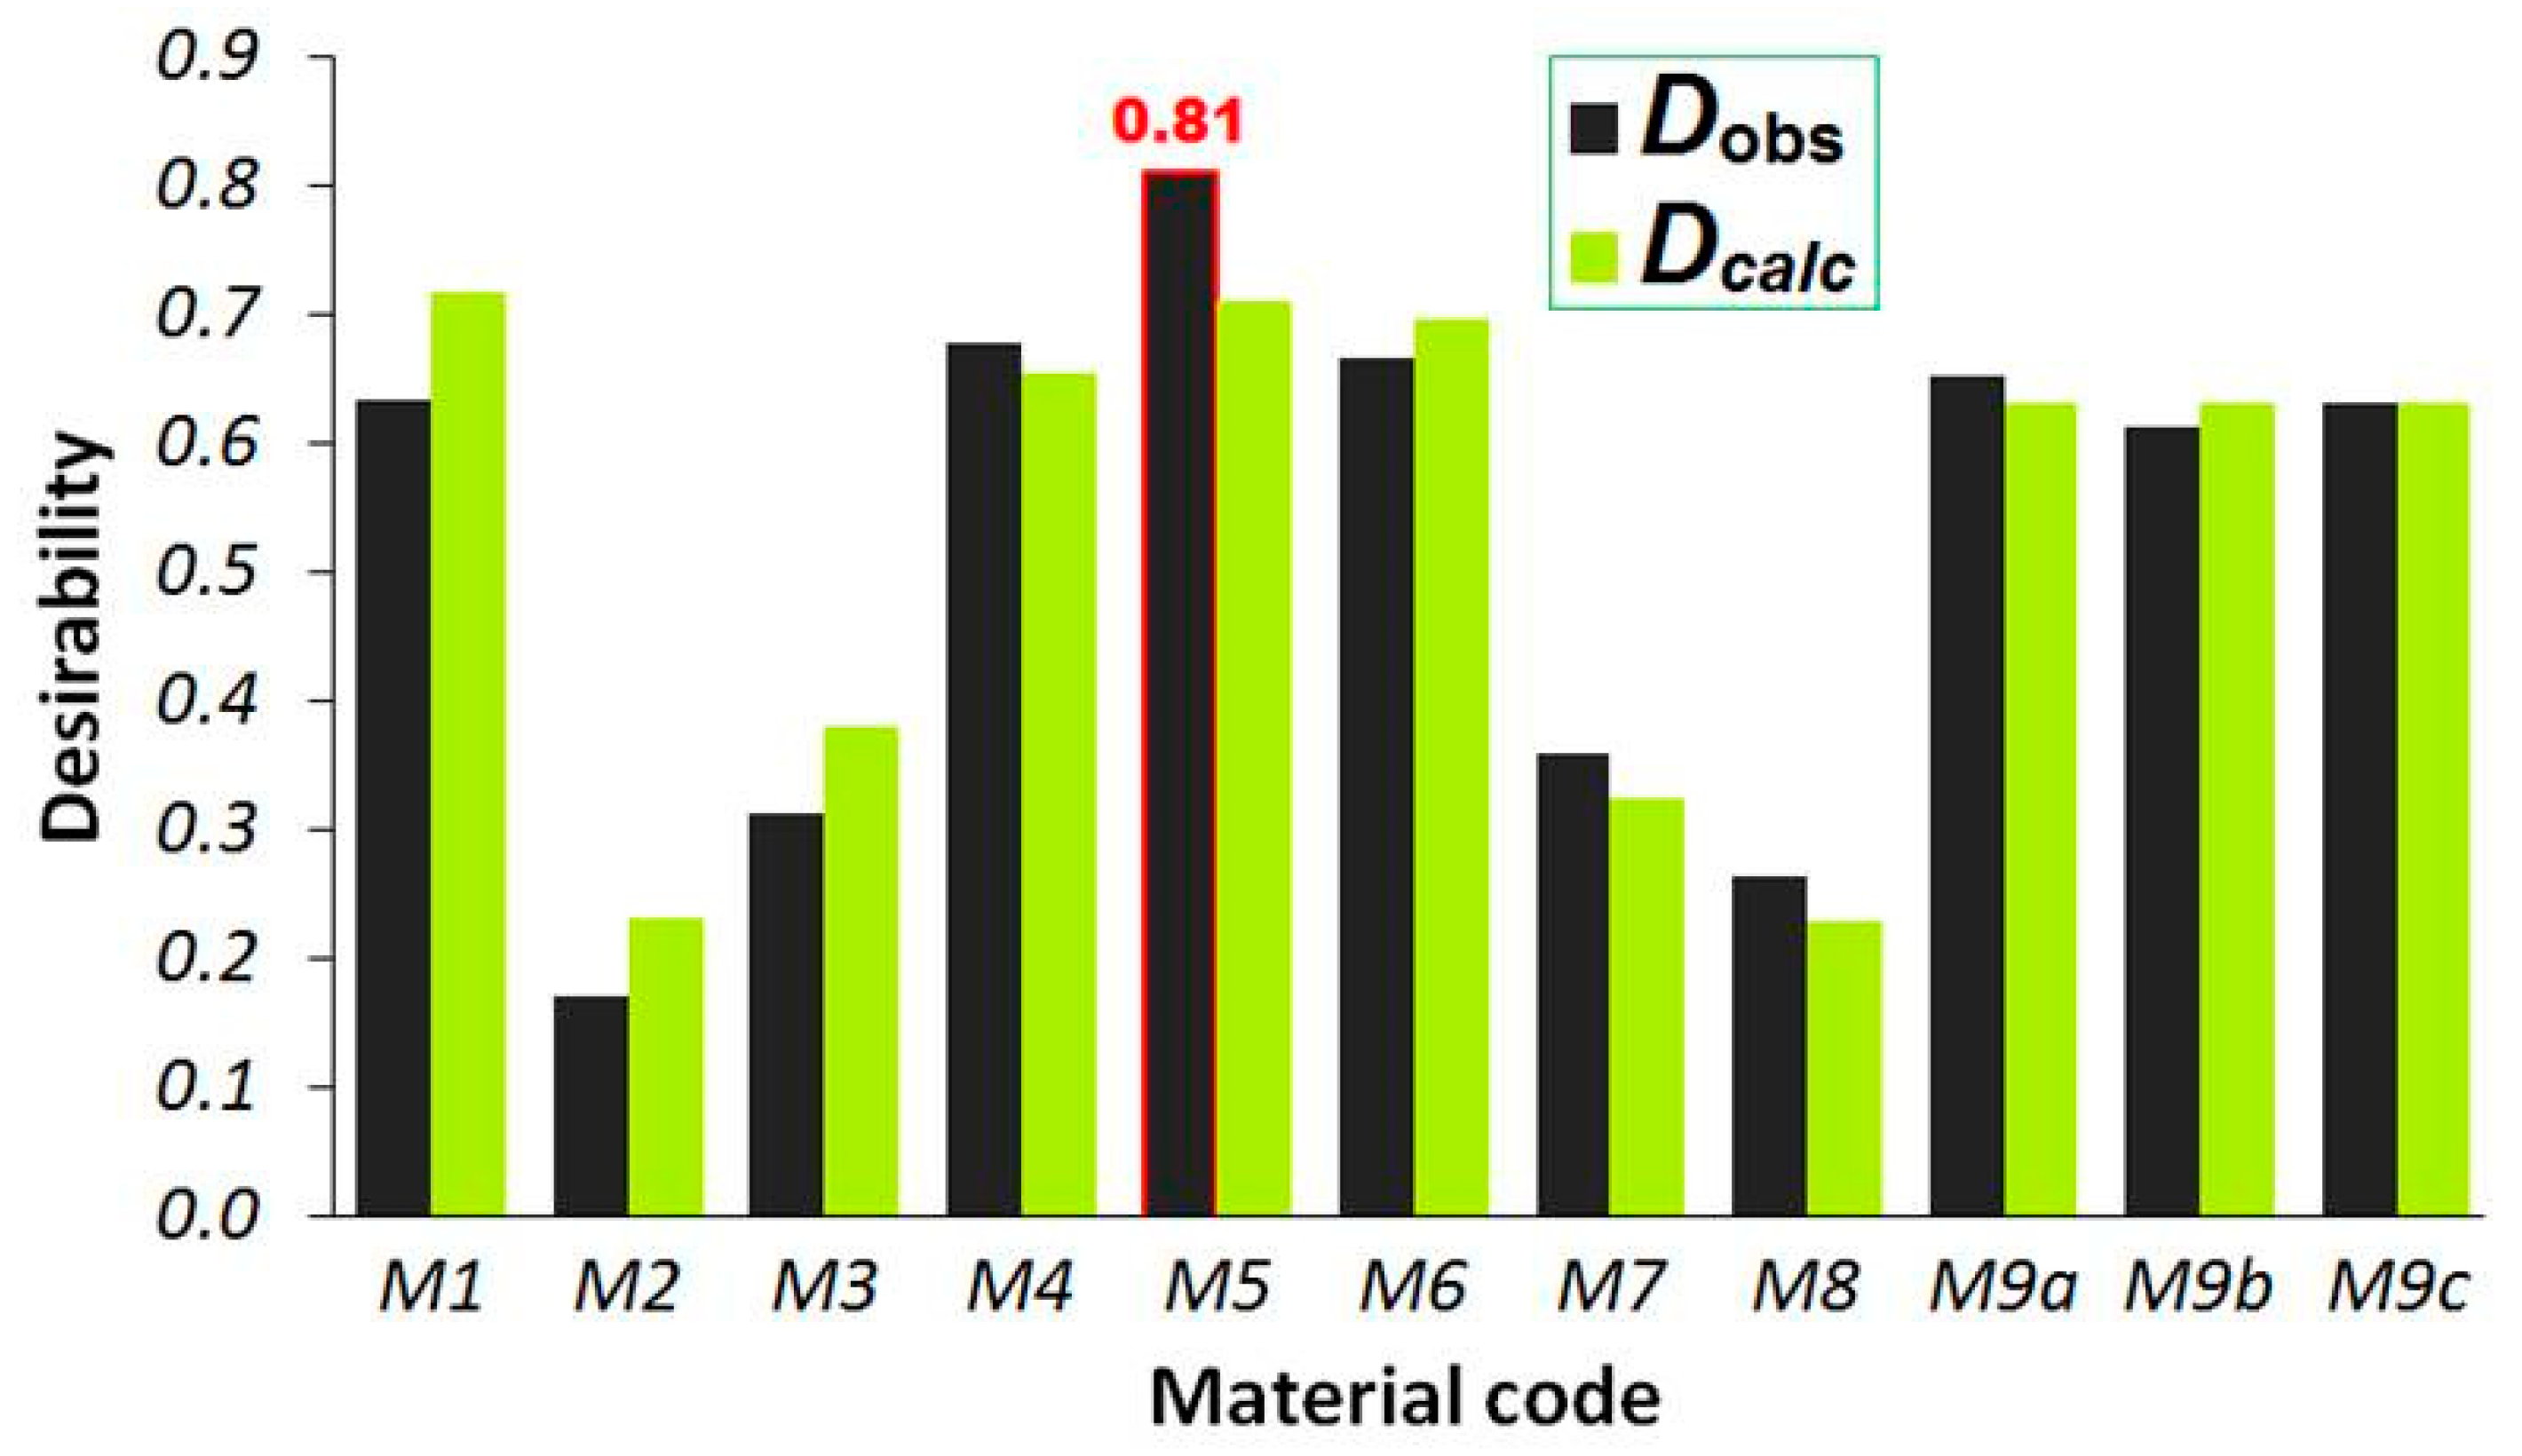
3.2. Multi-Objective Optimization
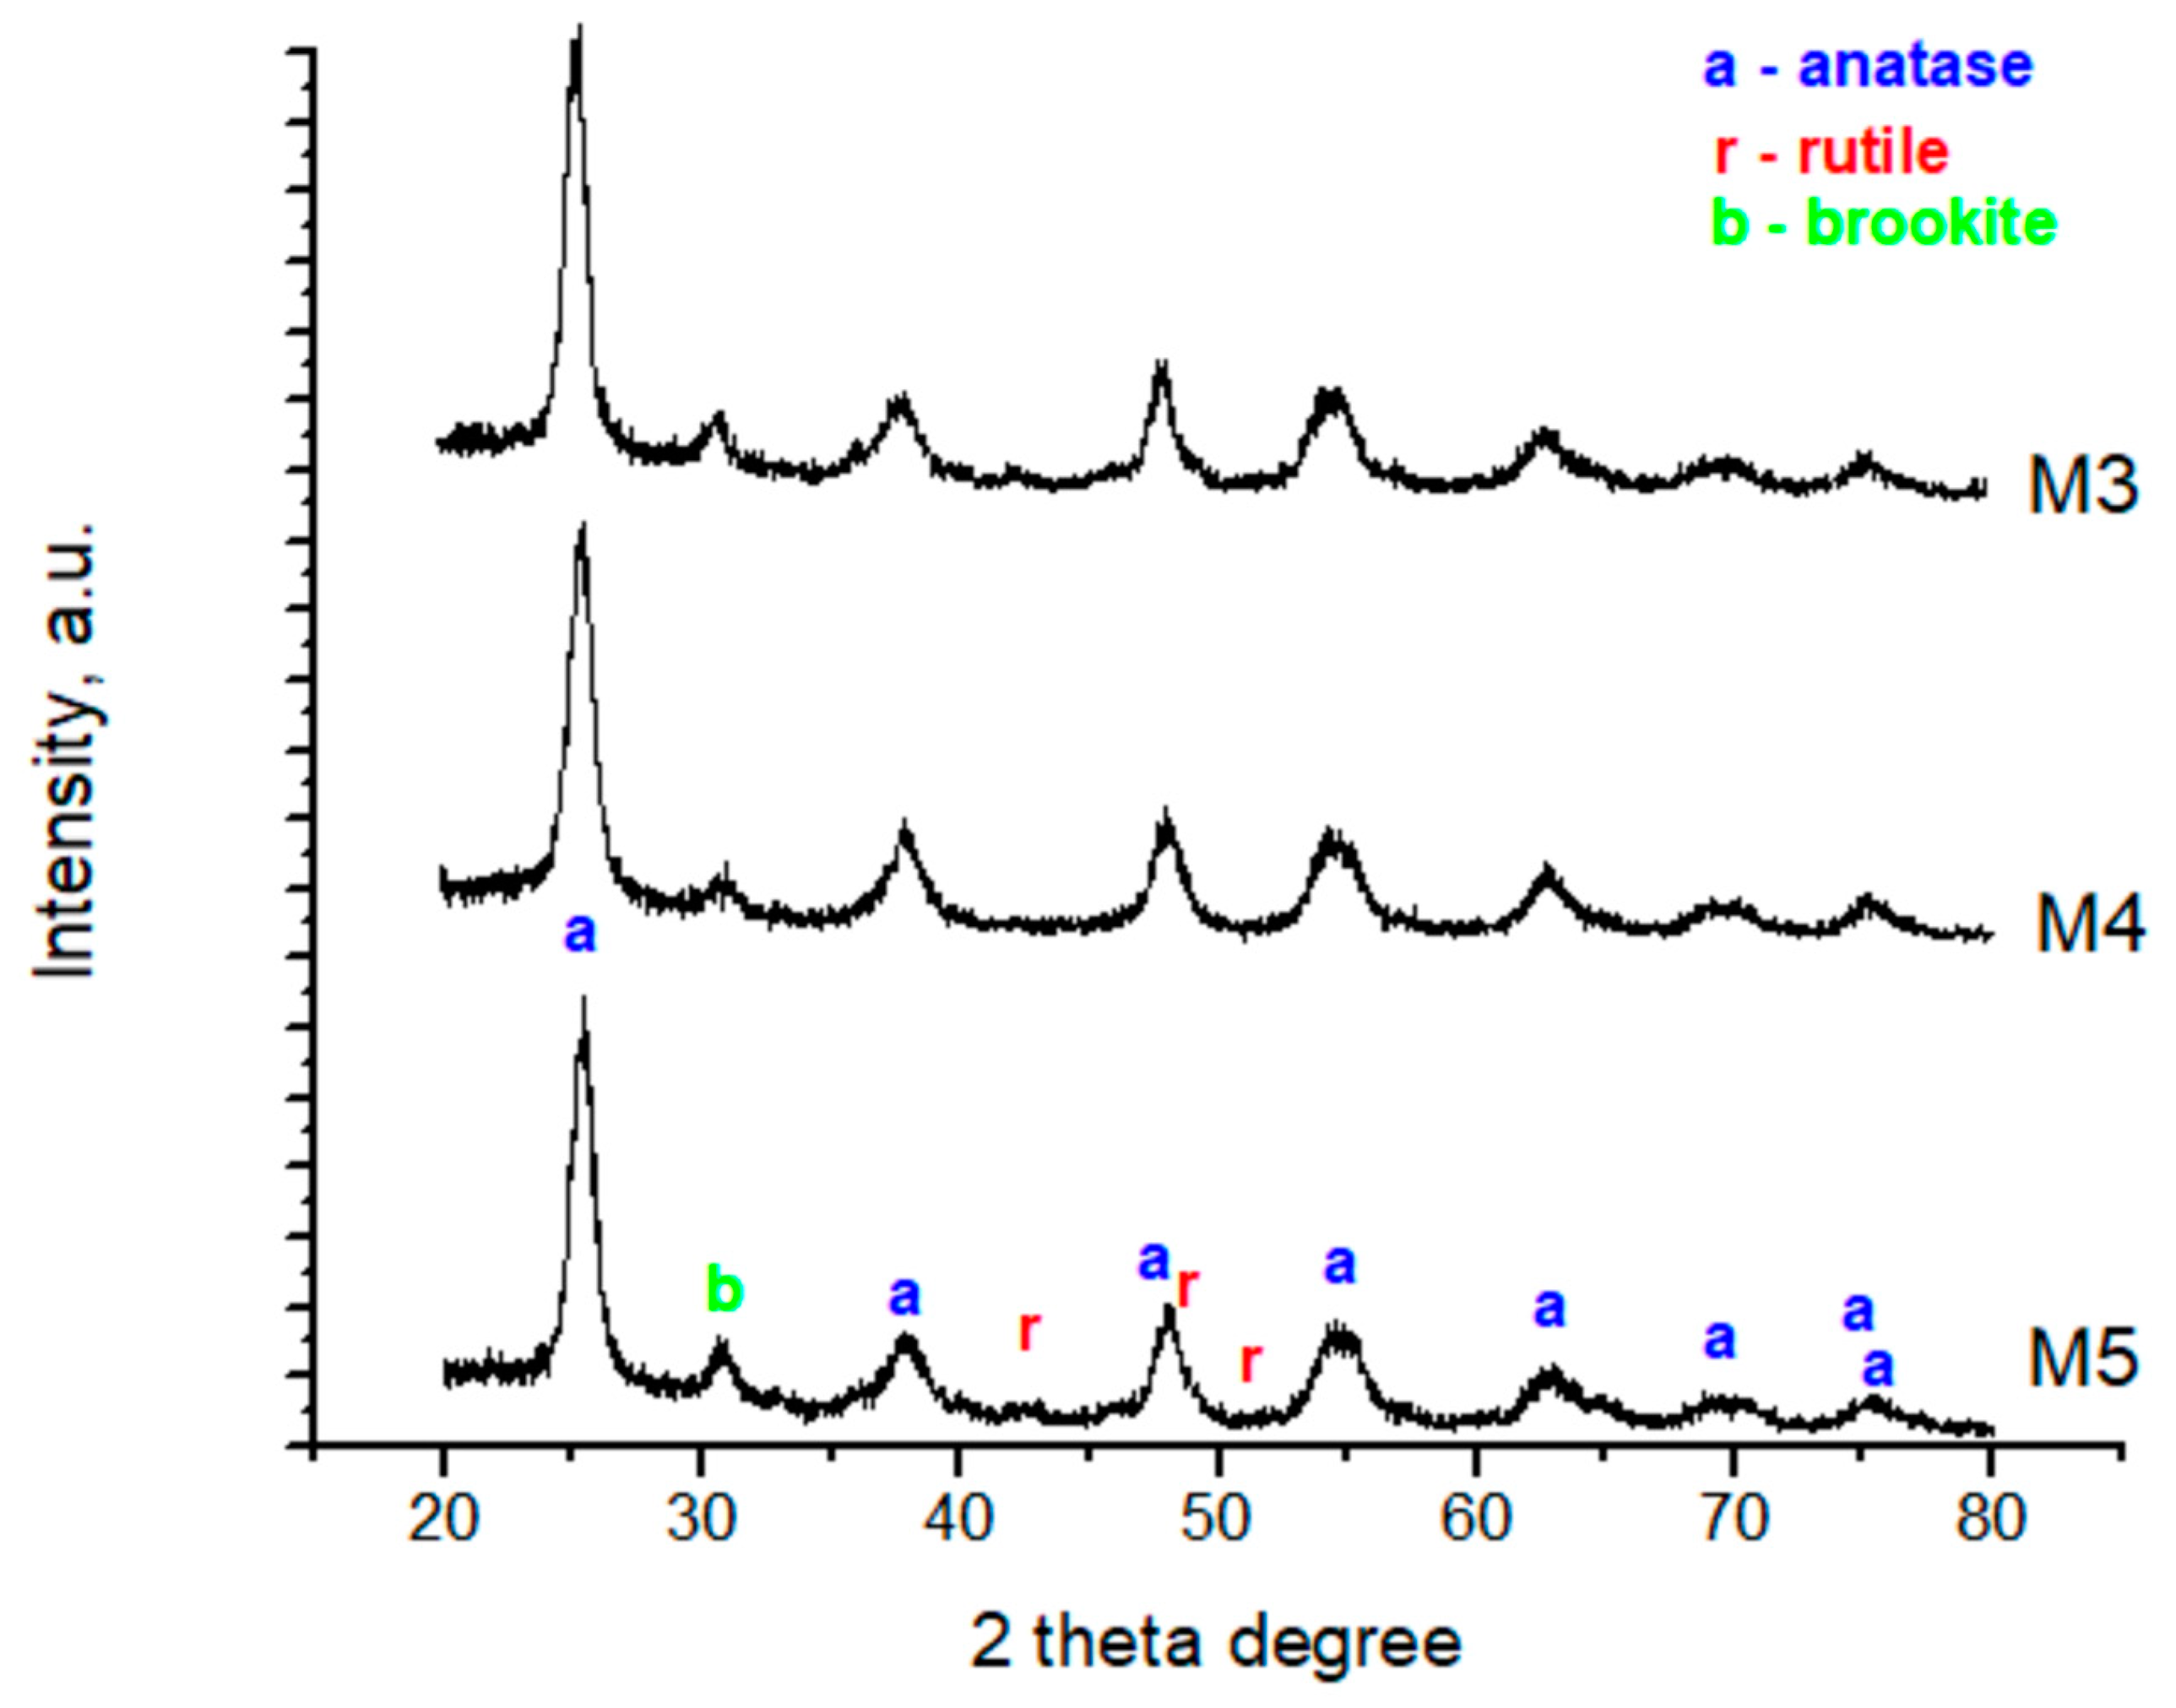
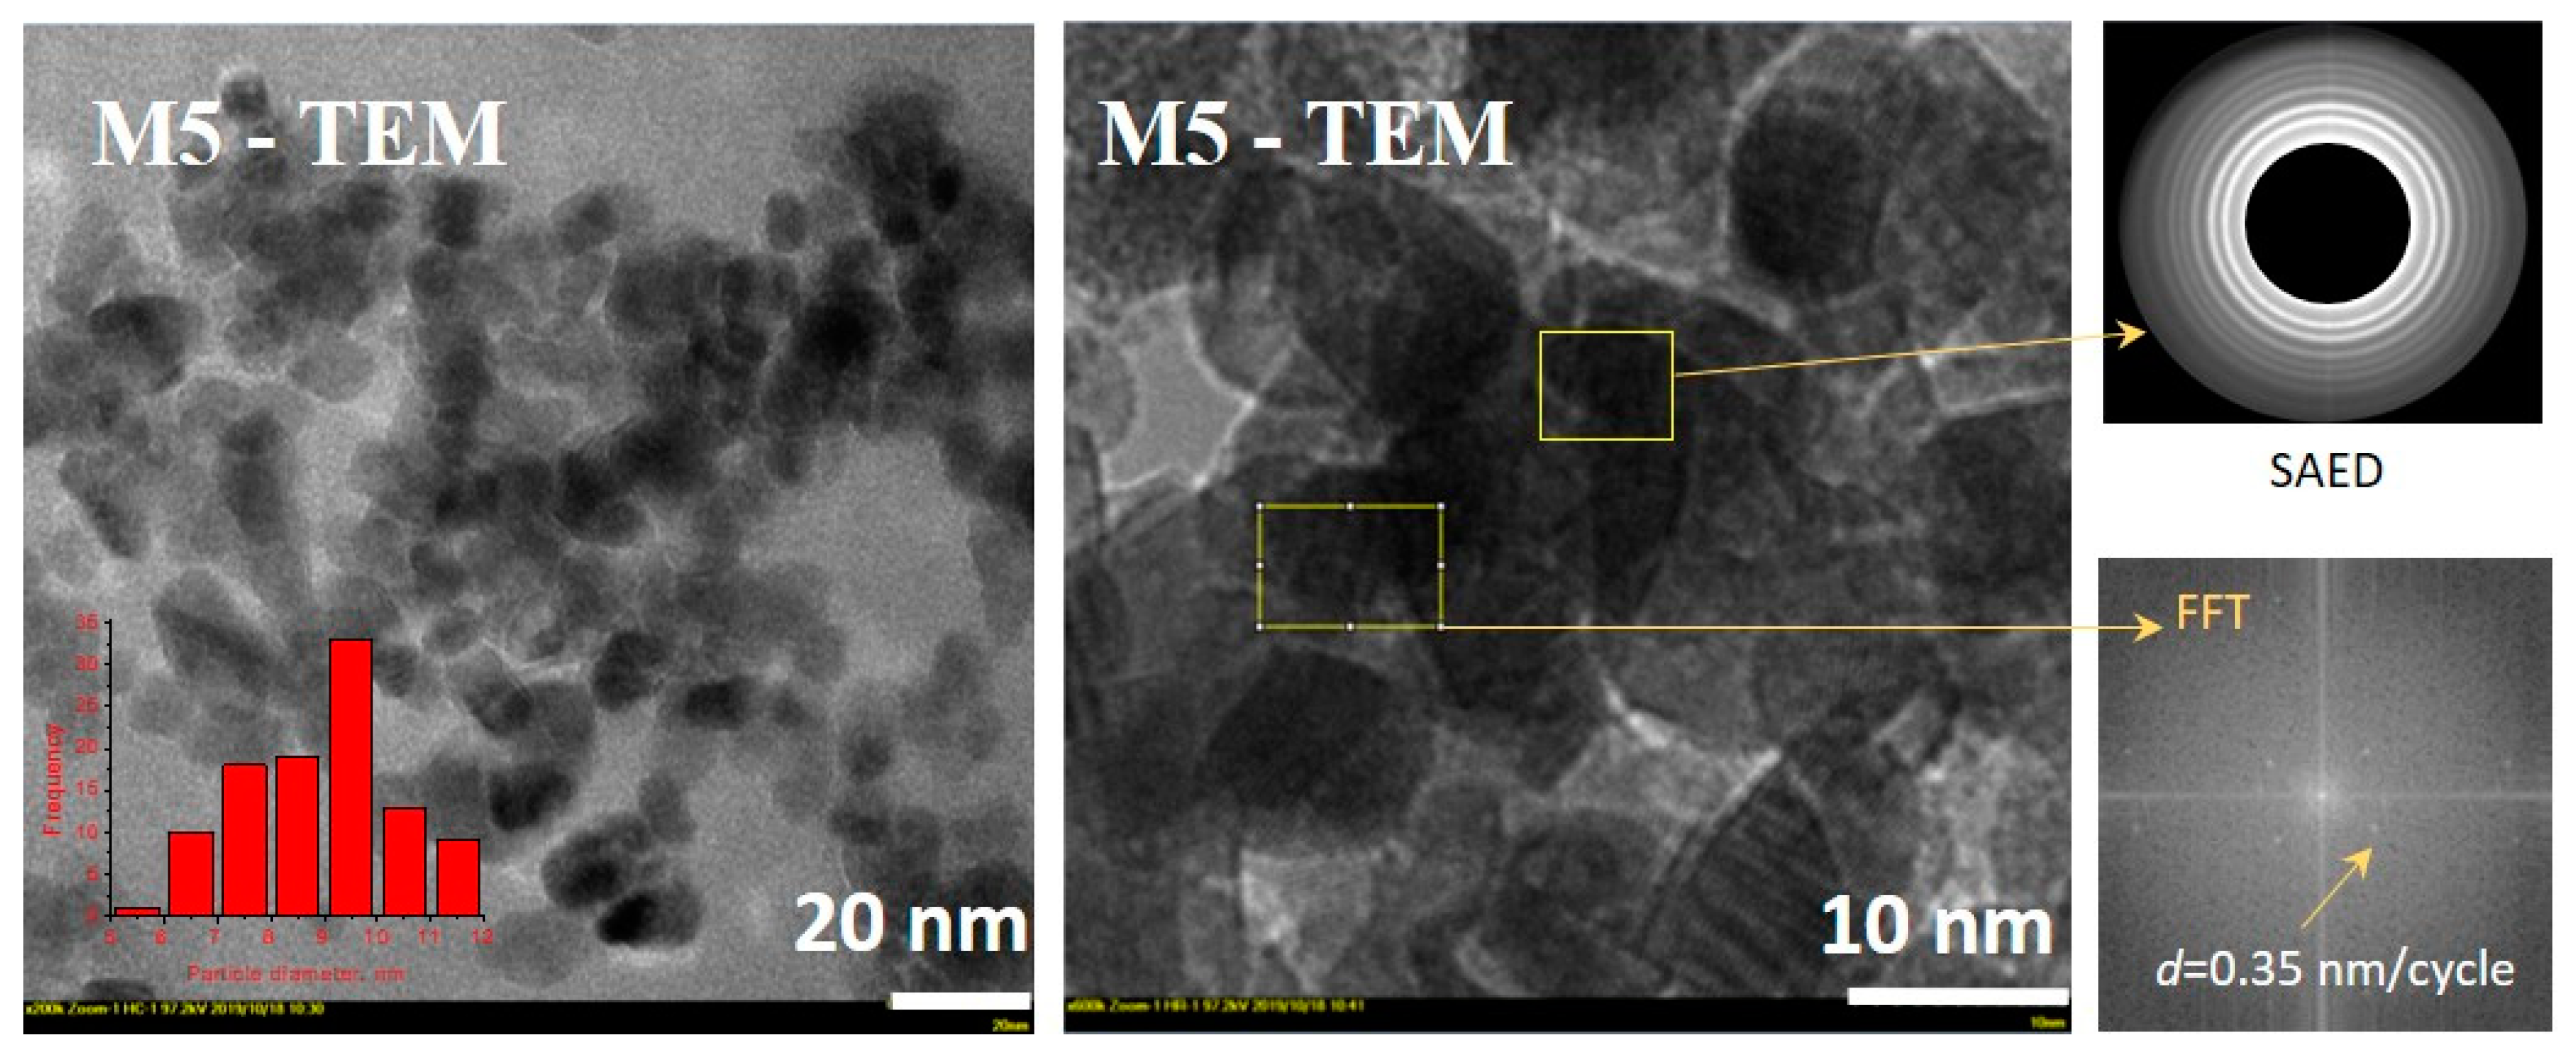
3.3. Characteristics of Optimum Material
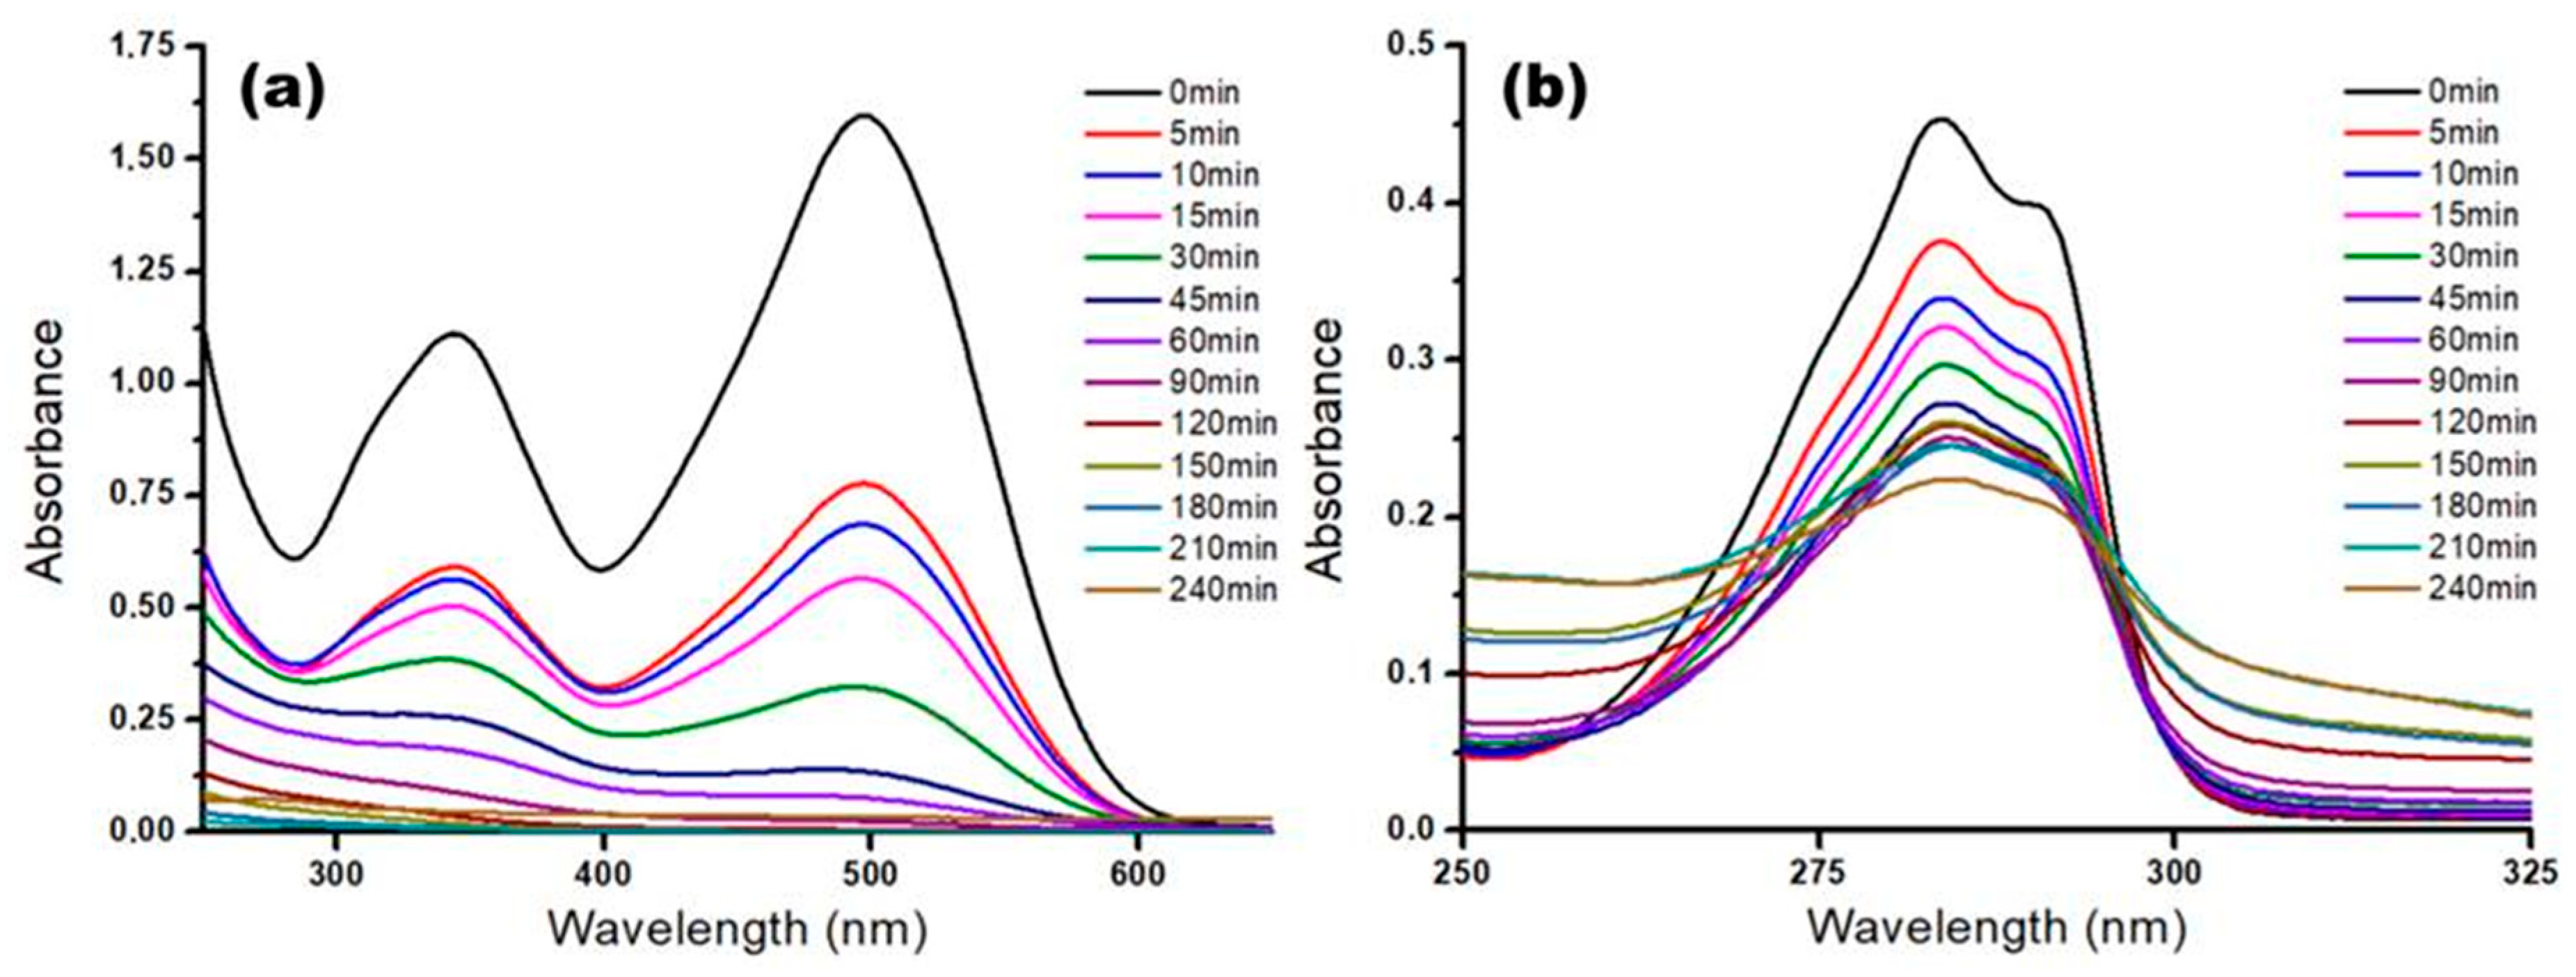
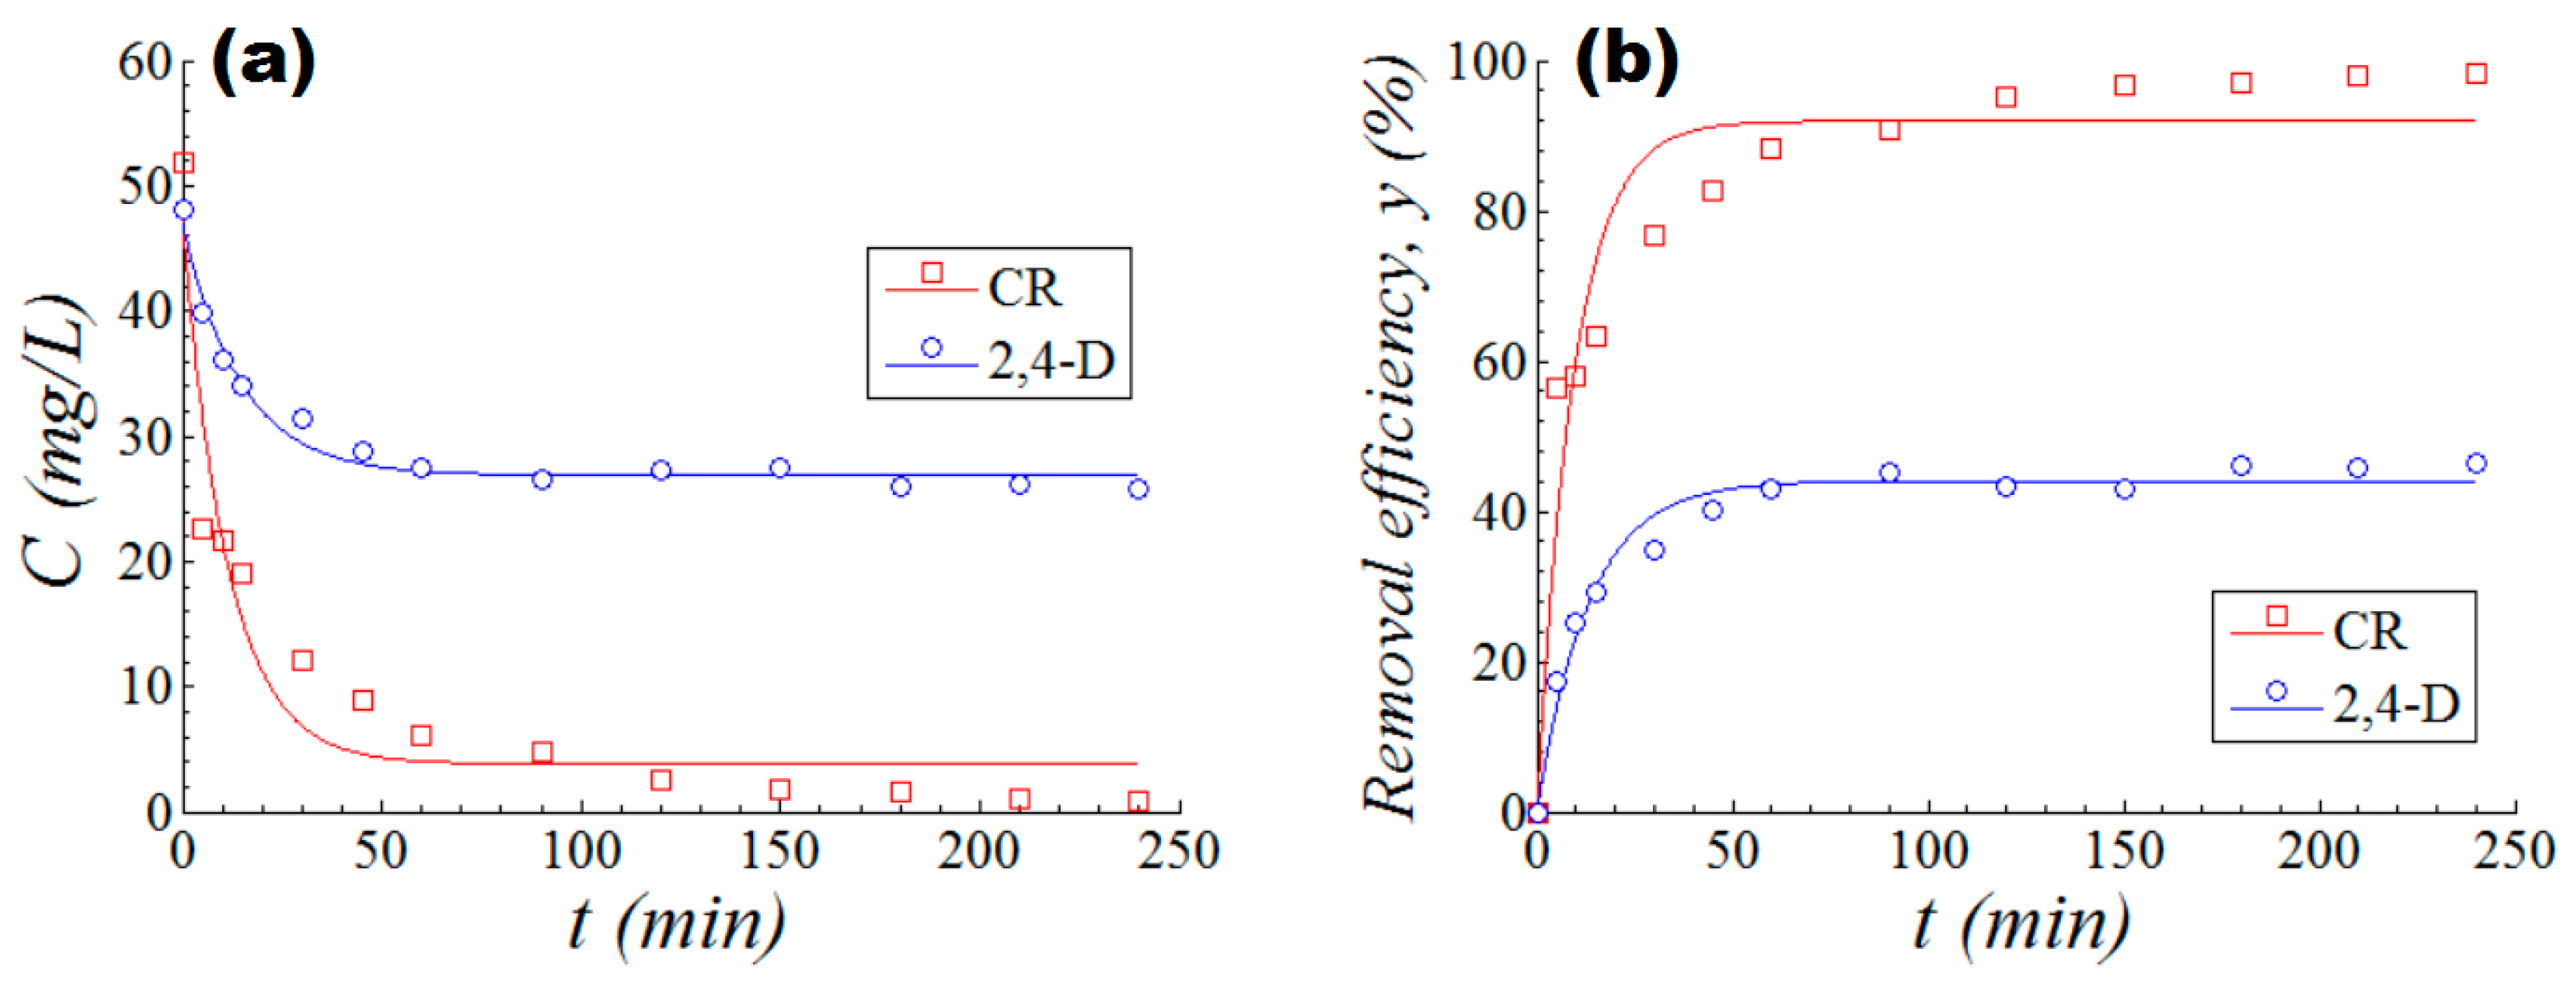
3.4. Kinetics of the Photocatalytic Process
4. Conclusions
Supplementary Materials
Author Contributions
Funding
Acknowledgments
Conflicts of Interest
References
- Haddad, M.; Oie, C.; Duy, S.V.; Sauvé, S.; Barbeau, B. Adsorption of micropollutants present in surface waters onto polymeric resins: Impact of resin type and water matrix on performance. Sci. Total Environ. 2019, 660, 1449–1458. [Google Scholar] [CrossRef] [PubMed]
- Sadri Moghaddam, S.; Alavi Moghaddam, M.R.; Arami, M. Coagulation/flocculation process for dye removal using sludge from water treatment plant: Optimization through response surface methodology. J. Hazard. Mater. 2010, 175, 651–657. [Google Scholar] [CrossRef] [PubMed]
- Saini, R.; Kumar, P. Simultaneous removal of methyl parathion and chlorpyrifos pesticides from model wastewater using coagulation/flocculation: Central composite design. J. Environ. Chem. Eng. 2016, 4, 673–680. [Google Scholar] [CrossRef]
- Liu, J.; Wang, N.; Zhang, H.; Baeyens, J. Adsorption of Congo red dye on FexCo3-xO4 nanoparticles. J. Environ. Manag. 2019, 238, 473–483. [Google Scholar] [CrossRef] [PubMed]
- Liu, W.; Yang, Q.; Yang, Z.; Wang, W. Adsorption of 2,4-D on magnetic graphene and mechanism study. Colloid. Surf. A 2016, 509, 367–375. [Google Scholar] [CrossRef]
- Secula, M.S.; Suditu, G.D.; Poulios, I.; Cojocaru, C.; Cretescu, I. Response surface optimization of the photocatalytic decolorization of a simulated dyestuff effluent. Chem. Eng. J. 2008, 141, 18–26. [Google Scholar] [CrossRef]
- Verma, M.; Haritash, A.K. Degradation of amoxicillin by Fenton and Fenton-integrated hybrid oxidation processes. J. Environ. Chem. Eng. 2019, 7, 102886. [Google Scholar] [CrossRef]
- López, N.; Plaza, S.; Afkhami, A.; Marco, P.; Esplugas, S. Treatment of Diphenhydramine with different AOPs including photo-Fenton at circumneutral pH. Chem. Eng. J. 2017, 318, 112–120. [Google Scholar] [CrossRef]
- Samoila, P.; Cojocaru, C.; Sacarescu, L.; Pascariu Dorneanu, P.; Domocos, A.-A.; Rotaru, A. Remarkable catalytic properties of rare-earth doped nickel ferrites synthesized by sol-gel auto-combustion with maleic acid as fuel for CWPO of dyes. Appl. Catal. B 2017, 202, 21–32. [Google Scholar] [CrossRef]
- Ghuge, S.P.; Saroha, A.K. Catalytic ozonation of dye industry effluent using mesoporous bimetallic Ru-Cu/SBA-15 catalyst. Proc. Saf. Environ. Prot. 2018, 118, 125–132. [Google Scholar] [CrossRef]
- Ignat, M.; Samoila, P.; Coromelci, C.; Sacarescu, L.; Asaftei, I.; Harabagiu, V.; Miron, C. Plasma generation in liquid as a new efficient synthesis approach of titania–zinc ferrite nano(photo)catalyst. C. R. Chimie 2018, 21, 310–317. [Google Scholar] [CrossRef]
- Pascariu, P.; Cojocaru, C.; Olaru, N.; Samoila, P.; Airinei, A.; Ignat, M.; Sacarescu, L.; Timpu, D. Novel rare earth (RE-La, Er, Sm) metal doped ZnO photocatalysts for degradation of Congo-Red dye: Synthesis, characterization and kinetic studies. J. Environ. Manag. 2019, 239, 225–234. [Google Scholar] [CrossRef] [PubMed]
- Rostami, M. Photodecomposition and adsorption of hazardous organic pollutants by Ce-doped ZnO@Ce-doped TiO2-N/S-dual doped RGO ternary nano-composites photocatalyst for water remediation. J. Mol. Struct. 2019, 1185, 191–199. [Google Scholar] [CrossRef]
- Bouazizi, N.; Vieillard, J.; Thebault, P.; Desriac, F.; Clamens, T.; Bargougui, R.; Couvrat, N.; Thoumire, O.; Brun, N.; Ladam, G.; et al. Silver nanoparticle embedded copper oxide as an efficient core-shell for the catalytic reduction of 4-nitrophenol and antibacterial activity improvement. Dalton Trans. 2018, 47, 9143–9155. [Google Scholar] [CrossRef]
- Bouazizi, N.; Vieillard, J.; Bargougui, R.; Couvrat, N.; Thoumire, O.; Morin, S.; Ladam, G.; Mofaddel, N.; Brun, N.; Azzouz, A.; et al. Entrapment and stabilization of iron nanoparticles within APTES modified graphene oxide sheets for catalytic activity improvement. J. Alloy. Compd. 2019, 771, 1090–1102. [Google Scholar] [CrossRef]
- Nakata, K.; Fujishima, A. TiO2 photocatalysis: Design and applications. J. Photochem. Photobiol. C 2012, 13, 169–189. [Google Scholar] [CrossRef]
- Coromelci-Pastravanu, C.; Ignat, M.; Popovici, E.; Harabagiu, V. TiO2-coated mesoporous carbon: Conventional vs. microwave-annealing process. J. Hazard. Mater. 2014, 278, 382–390. [Google Scholar] [CrossRef]
- Bezerra, M.A.; Santelli, R.E.; Oliveira, E.P.; Villar, L.S.; Escaleira, L.A. Response surface methodology (RSM) as a tool for optimization in analytical chemistry. Talanta 2008, 76, 965–977. [Google Scholar] [CrossRef]
- Witek-Krowiak, A.; Chojnacka, K.; Podstawczyk, D.; Dawiec, A.; Pokomeda, K. Application of response surface methodology and artificial neural network methods in modeling and optimization of biosorption process. Bioresour. Technol. 2014, 160, 150–160. [Google Scholar] [CrossRef]
- Rahimi-Nasrabadi, M.; Pourmortazavi, S.M.; Karimi, M.S.; Aghazadeh, M.; Ganjali, M.R.; Norouzi, P. Statistical optimization of experimental parameters for synthesis of two efficient photocatalyst: Erbium carbonate and erbium oxide nanoparticles. J. Mater. Sci. Mater. Electron 2017, 28, 15224–15232. [Google Scholar] [CrossRef]
- Costa, N.R.; Lourenco, J.; Pereira, Z.L. Desirability function approach: A review performance evaluation in adverse conditions. Chemom. Intell. Lab. Syst. 2011, 107, 234–244. [Google Scholar] [CrossRef]
- Thommes, M.; Kaneko, K.; Neimark, A.V.; Olivier, J.P.; Rodriguez-Reinoso, F.; Rouquerol, J.; Sing, K.S.W. Physisorption of gases, with special reference to the evaluation of surface area and pore size distribution (IUPAC Technical Report). Pure Appl. Chem. 2015, 87, 1051–1069. [Google Scholar] [CrossRef]
- Horikawa, T.; Do, D.D.; Nicholson, D. Capillary condensation of adsorbates in porous materials. Adv. Colloid Interface Sci. 2011, 169, 40–58. [Google Scholar] [CrossRef] [PubMed]
- Du, W.N.; Chen, S.T. Photo- and chemocatalytic oxidation of dyes in water. J. Environ. Manag. 2018, 206, 507–515. [Google Scholar] [CrossRef] [PubMed]
- March, J.G.; Gual, M.; Ramonell, J. A kinetic model for chlorine consumption in grey water. Desalination 2005, 181, 267–273. [Google Scholar] [CrossRef]


| Design Variables (Factors) | Coded Variables | Actual Values of Coded Levels | ||||
|---|---|---|---|---|---|---|
| −α | −1 | 0 | +1 | +α | ||
| Ratio of precursors’ weights (TTIP/Surfactant), r | x1 | 3 | 5 | 10 | 15 | 17 |
| Sonication time, t (min) | x2 | 18 | 30 | 60 | 90 | 102 |
| Run | Design Variables | Resulted Material (Code) | Responses (Material Characterization) 1 & (Application) 2 | ||||||
|---|---|---|---|---|---|---|---|---|---|
| Ratio of Precursors | Sonication Time (min) | ||||||||
| x1 | r | x2 | t | SBET (m2/g) 1 | VP (cm3/g) 1 | Y1 (%) 2 | Y2 (%) 2 | ||
| 1 | −1 | 5 | −1 | 30 | M1 | 108.46 | 0.276 | 91.98 | 39.80 |
| 2 | +1 | 15 | −1 | 30 | M2 | 110.26 | 0.288 | 90.26 | 32.34 |
| 3 | −1 | 5 | +1 | 90 | M3 | 99.54 | 0.259 | 87.71 | 36.39 |
| 4 | +1 | 15 | +1 | 90 | M4 | 132.05 | 0.331 | 88.03 | 41.93 |
| 5 | −α | 3 | 0 | 60 | M5 | 111.15 | 0.270 | 94.10 | 42.58 |
| 6 | +α | 17 | 0 | 60 | M6 | 126.36 | 0.299 | 91.39 | 38.17 |
| 7 | 0 | 10 | −α | 18 | M7 | 118.06 | 0.284 | 86.25 | 35.96 |
| 8 | 0 | 10 | +α | 102 | M8 | 120.33 | 0.296 | 84.06 | 37.43 |
| 9 | 0 | 10 | 0 | 60 | M9a | 122.32 | 0.291 | 91.85 | 37.96 |
| 10 | 0 | 10 | 0 | 60 | M9b | 121.97 | 0.292 | 90.46 | 38.05 |
| 11 | 0 | 10 | 0 | 60 | M9c | 122.71 | 0.289 | 91.16 | 37.88 |
| Sample | DScherrer (nm) | a (nm) | d (nm) | DW.H. (nm) | ξ |
|---|---|---|---|---|---|
| M3 | 10.375 | 0.351302 | 0.405649 | 18.561 | 0.0372 |
| M4 | 9.156 | 0.351191 | 0.405520 | 8.803 | -0.0002 |
| M5 | 9.701 | 0.351055 | 0.405363 | 9.064 | −6E−05 |
| No. (i) | Photocatalytic System | Pseudo first-order Reaction Rate Constant, ki (min−1) | Pseudo first-order Removal Rate Constant, γi (min−1) | Final Removal Efficiency (at t = 120 min) Y* (%) |
|---|---|---|---|---|
| 1 | M5 + CR dye | 8.86 × 10⁻² | 10.59 × 10⁻² | 98.40% |
| 2 | M5 + 2,4-D | 6.84 × 10⁻² | 7.51 × 10⁻² | 46.30% |
© 2020 by the authors. Licensee MDPI, Basel, Switzerland. This article is an open access article distributed under the terms and conditions of the Creative Commons Attribution (CC BY) license (http://creativecommons.org/licenses/by/4.0/).
Share and Cite
Mahu, E.; Ignat, M.; Cojocaru, C.; Samoila, P.; Coromelci, C.; Asaftei, I.; Harabagiu, V. Development of Porous Titania Structure with Improved Photocatalytic Activity: Response Surface Modeling and Multi-Objective Optimization. Nanomaterials 2020, 10, 998. https://doi.org/10.3390/nano10050998
Mahu E, Ignat M, Cojocaru C, Samoila P, Coromelci C, Asaftei I, Harabagiu V. Development of Porous Titania Structure with Improved Photocatalytic Activity: Response Surface Modeling and Multi-Objective Optimization. Nanomaterials. 2020; 10(5):998. https://doi.org/10.3390/nano10050998
Chicago/Turabian StyleMahu, Elvira, Maria Ignat, Corneliu Cojocaru, Petrisor Samoila, Cristina Coromelci, Iuliean Asaftei, and Valeria Harabagiu. 2020. "Development of Porous Titania Structure with Improved Photocatalytic Activity: Response Surface Modeling and Multi-Objective Optimization" Nanomaterials 10, no. 5: 998. https://doi.org/10.3390/nano10050998
APA StyleMahu, E., Ignat, M., Cojocaru, C., Samoila, P., Coromelci, C., Asaftei, I., & Harabagiu, V. (2020). Development of Porous Titania Structure with Improved Photocatalytic Activity: Response Surface Modeling and Multi-Objective Optimization. Nanomaterials, 10(5), 998. https://doi.org/10.3390/nano10050998