Article

Bactericidal Silver Nanoparticles by Atmospheric Pressure Solution Plasma Processing

1
School of Chemistry and Physics, Queensland University of Technology, Brisbane 4000, Queensland, Australia
2
Centre for Materials Science, Queensland University of Technology, Brisbane 4000, Queensland, Australia
3
School of Biology and Environmental Science, Queensland University of Technology, Brisbane 4000, Queensland, Australia
4
School of Mechanical, Medical and Process Engineering, Queensland University of Technology, Brisbane 4000, Queensland, Australia
5
School of Chemical and Biomolecular Engineering, The University of Sydney, Sydney 2006, New South Wales, Australia
6
School of Engineering, University of South Australia, Adelaide 5001, South Australia, Australia
*
Author to whom correspondence should be addressed.
Nanomaterials 2020, 10(5), 874; https://doi.org/10.3390/nano10050874
Submission received: 3 April 2020 / Revised: 20 April 2020 / Accepted: 22 April 2020 / Published: 1 May 2020

Abstract

:
Silver nanoparticles have applications in plasmonics, medicine, catalysis and electronics. We report a simple, cost-effective, facile and reproducible technique to synthesise silver nanoparticles via plasma-induced non-equilibrium liquid chemistry with the absence of a chemical reducing agent. Silver nanoparticles with tuneable sizes from 5.4 to 17.8 nm are synthesised and characterised using Transmission Electron Microscopy (TEM) and other analytic techniques. A mechanism for silver nanoparticle formation is also proposed. The antibacterial activity of the silver nanoparticles was investigated with gram-positive and gram-negative bacteria. The inhibition of both bacteria types was observed. This is a promising alternative method for the instant synthesis of silver nanoparticles, instead of the conventional chemical reduction route, for numerous applications.

Graphical Abstract

1. Introduction

Silver (Ag) nanoparticles have been widely studied due to their applications in a broad area of industries, such as biomedical engineering, textiles, healthcare, electronics, optics, and chemical engineering [1,2,3,4]. A number of synthesis techniques have been developed for the generation of silver nanoparticles [5]. Chemical reduction is one of the most popular techniques that employs reducing agents, such as ascorbic acid, to reduce the silver from its precursor solution [6]. However, thorough water treatment processes are required to remove the unused reducing agents from the final product since some reducing agents, such as hydrazine and sodium borohydride, are toxic [2]. Nanoparticle agglomeration occurs due to the high active surface area and capping agents, such as Poly (Viny Pyrrolidone) (PVP) or Poly (Vinyl Alcohol) (PVA), which are used to prevent the agglomeration of the formed nanoparticles [4]. A number of other methods are also used for the silver nanoparticle synthesis such as biosynthesis, photochemical and sonochemical pathways [3,4]. These techniques still require either several processing steps or time to obtain pure yield of the synthesised product. Here, we address these issues and demonstrate a versatile synthesis of functional silver nanoparticles by atmospheric pressure solution plasma processing.
Atmospheric pressure plasmas, which can be generated in low temperature and non-equilibrium conditions, are commonly referred to as cold plasmas [7,8,9,10]. Unlike low-pressure plasmas, expensive vacuum systems and pumps are not required for the cold atmospheric plasma generation. Several cold atmospheric plasma devices are available, such as Dielectric Barrier Discharge (DBD) plasma sources, microwave plasma systems, plasma jets, plasma arrays, etc. Of these systems, plasma sources based on DBD are versatile and are commonly used [8]. These are generally powered with AC power supplies within the range of 50 Hz to a few hundred kHz. A wide range of gases can be employed in these systems, such as Helium (He), Argon (Ar), Nitrogen (N2), and air. The highest plasma density has been reported in microwave plasmas and the electron temperature of the plasmas can reach several eV [8]. A typical plasma discharge contains charged species, energetic photons and radical species [10]. Interactions between the cold plasma and different materials lead to diverse reactions. The main classes of these reactions are plasma etching, plasma-assisted deposition, and plasma treatment processes (functionalisation) [7,11]. The depth of the plasma surface functionalisation is only about a few nanometers, while the depth of etching could be up to hundreds of nanometres and the films of micrometre and larger thickness can be deposited [10].
Among the many reactive species generated by plasma–liquid interactions, solvated electrons are of particular interest because they are highly reactive and can reduce a number of cations, anions and neutral species [12]. The nanoparticles of noble metals (Au, Ag, Pd, Pt), other metals (Ni, Cu, Zn, Sn), metal alloys and metallic compounds (MoS2, ZnMgS), metallic oxides (CuO, ZnO, TiO2), and nano composites have been produced by solution plasma processing [13].
Several experimental setups have been reported for the plasma–liquid synthesis of Ag nanoparticles [14]. Parameters such as precursor medium, electrode configuration, and electric power sources were varied in these studies. The production of silver nanoparticles, using an aqueous electrochemical cell with a micro plasma cathode and a solid metal anode was demonstrated by Richmonds et al. [11]. Kondeti et al. have performed Ag nanoparticle synthesis using Radio Frequency (RF) plasma jet by using an Ar and H2 gas mixture [1]. Thai et al. used Alternative Current (AC) glow discharge plasma to produce spherical nanoparticles. They were able to synthesise nanoparticle sizes varying from three to a few hundred nanometres in a spherical shape [3].
In the current study, a simple-to-use, single-step approach based on atmospheric pressure DBD plasma is used to synthesise stabilised Ag nanoparticles within a few minutes of time. This synthesis method does not require any added reducing agents and only stabiliser agents were used with the silver precursor. The effects of the plasma exposure time and the chemical changes occurring during the treatment were studied. Ultraviolet-visible (UV-vis) spectroscopy, transmission electron microscopy (TEM), and zeta sizer instruments were used to characterise the synthesised Ag nanoparticles. We also characterised the DBD plasma using optical emission spectroscopy (OES) studies, and the antibacterial effect of the synthesised Ag nanoparticles was also investigated. This method is scalable, environmentally friendly and versatile.

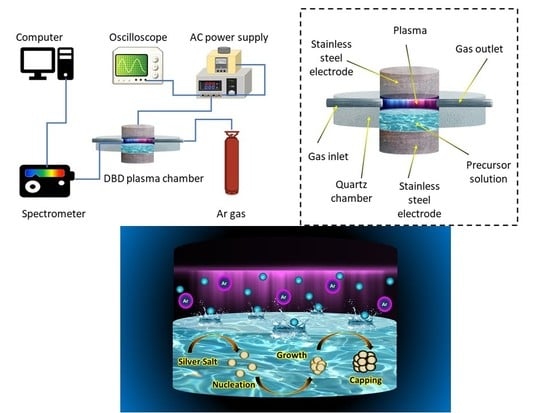
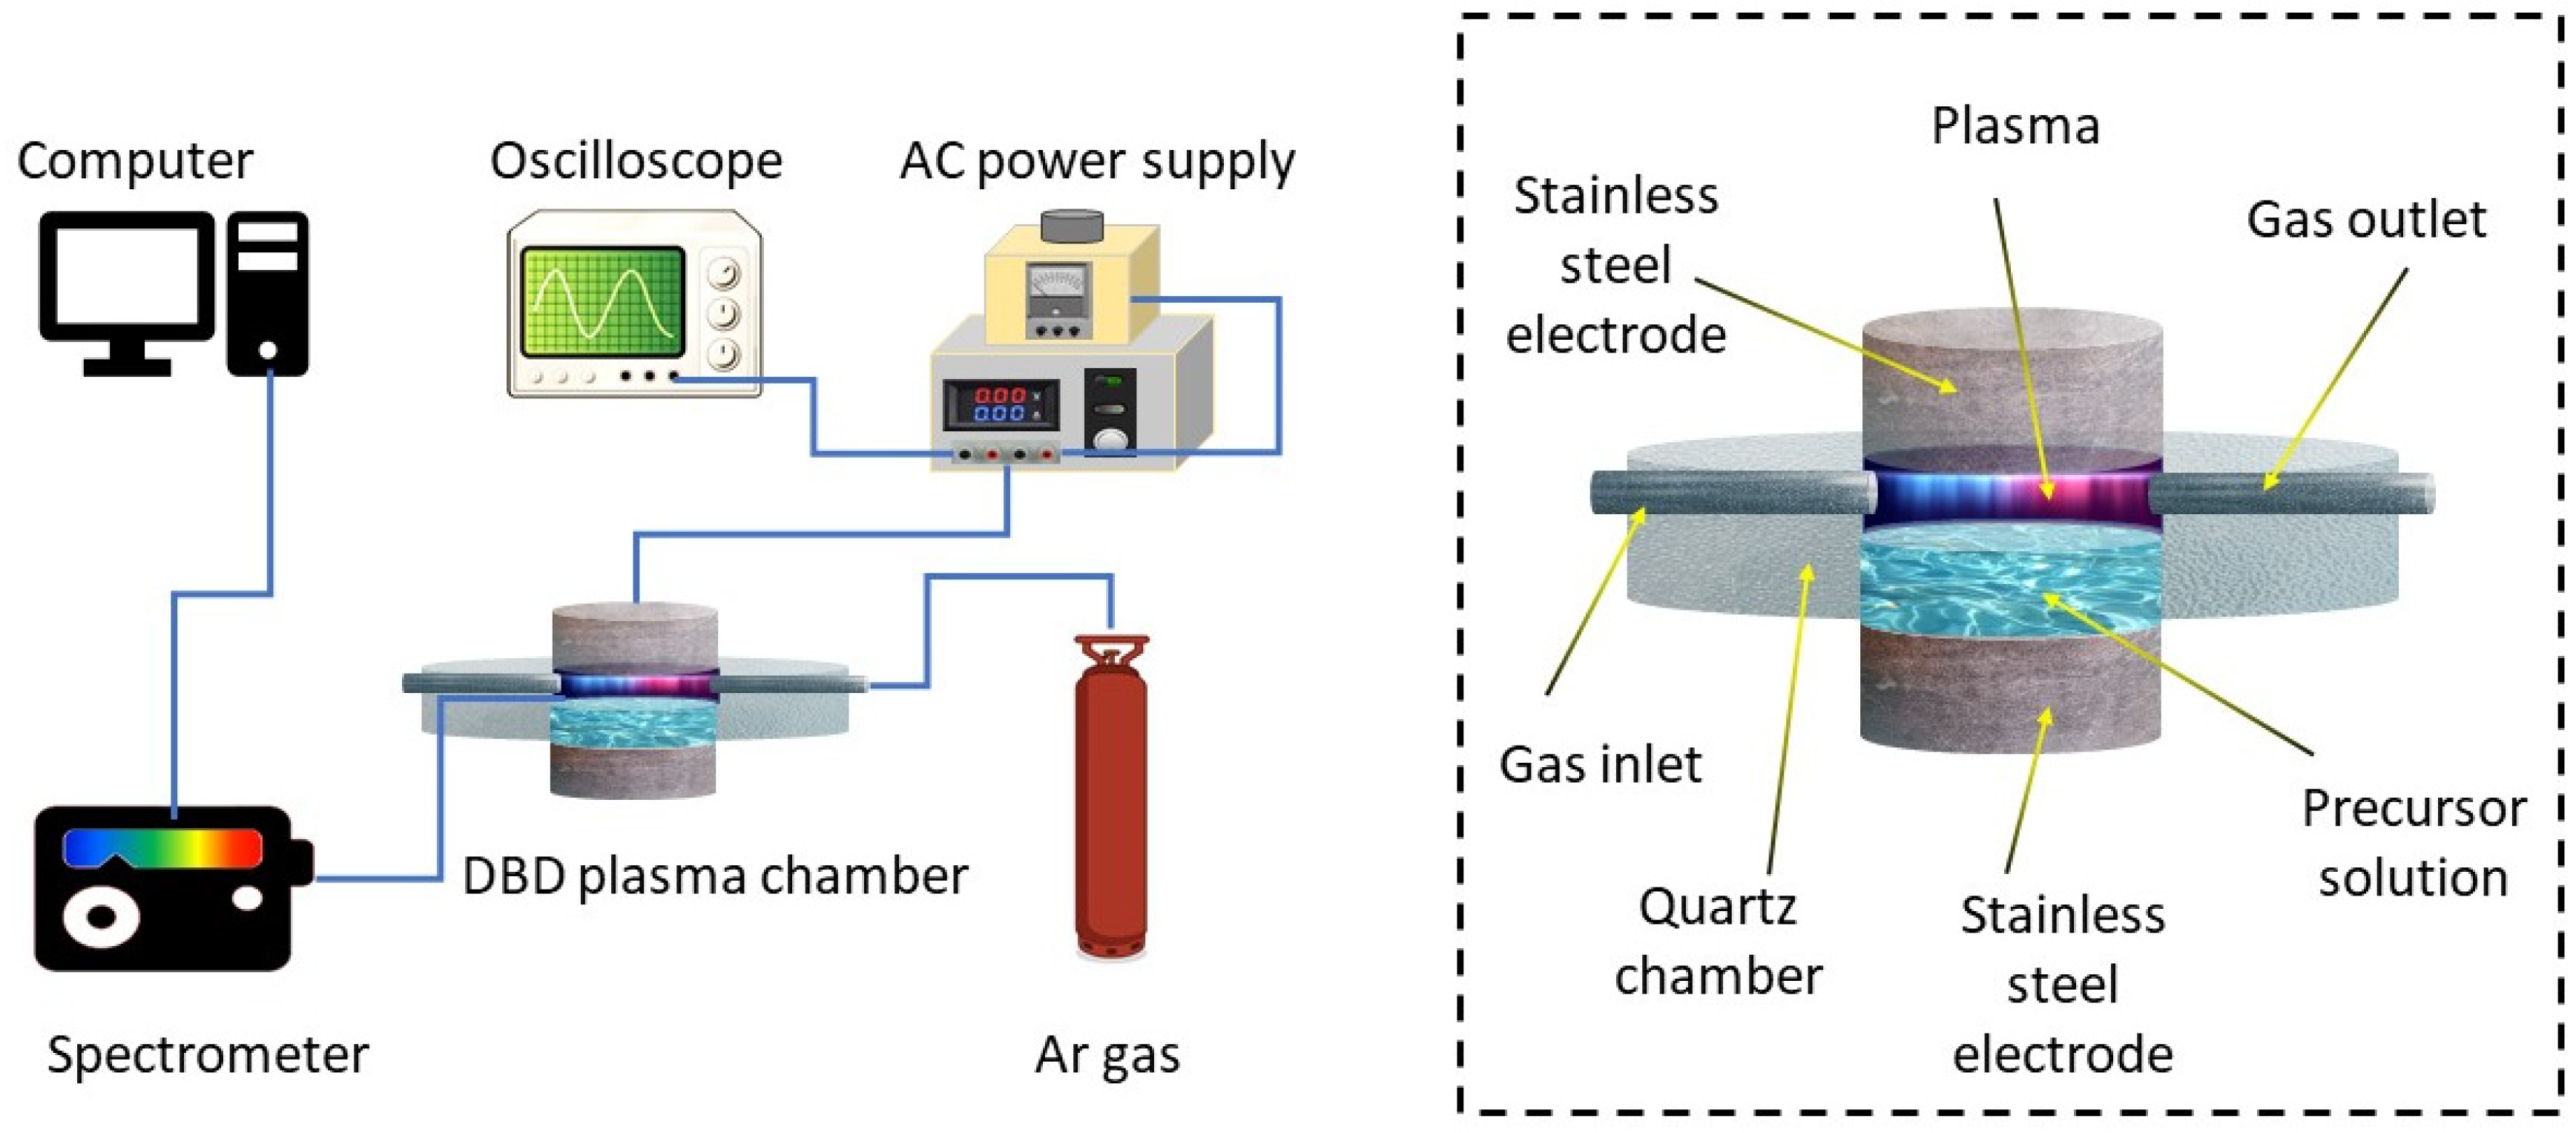
2. Experimental Methods

Figure 1 shows a schematic diagram of the DBD plasma reactor used for this work. The reactor is a cylindrical structure made of quartz. The silver precursor solution was prepared by mixing 1.2 mM of aqueous Silver Nitrate (AgNO3) solution with 34 mM of Sodium Citrate solution in the ratio of 1:3 v/v. The hollow centre part of the plasma chamber could be filled with the precursor solution and could be covered with a quartz lid. The centre part was connected to the gas feeding line and the outlet. The total volume of the chamber is 25 mL and during the experiment 4 mL of the precursor solution was used. The lid and the bottom of the quartz chamber act as the dielectric barriers, with their thickness being 2 mm and the distance between the dielectric barriers being 8 mm. A high voltage was applied to the stainless-steel electrodes by CTP 2000K power supply and the amplitude and frequency were 30 kV and 9.1 kHz, respectively. Voltage and current measurements were made using Rigol DS6104 oscilloscope.
Optical emission spectroscopy (OES) were conducted using an Andor SR-500 spectrometer, Newton CCD camera and fibre optic cable (Oxford Instruments plc, Oxon, UK). The absorption spectra of the resulting solutions were recorded on a UV-Vis spectrometer (Cary 60 UV-Vis Spectrophotometer, Agilent Technologies Inc., Santa Clara, CA, USA). Transmission electron microscopy (TEM, JEOL 2100, JEOL Ltd., Tokyo, Japan) was used to analyse the geometry and size distribution of the nanoparticles. During the sample preparation, an aqueous solution of suspended nanoparticles was added dropwise on carbon-coated copper TEM grids and dried under ambient conditions overnight. A selected area electron diffraction (SAED) ring pattern was used to calculate the crystal spacings using the reported procedure [15]. Lattice fringe spacing was determined by the profile plot of Image J software. Malvern Zetasizer Nano ZS (Malvern Panalytical Ltd., Malvern, UK) used for the Dynamic Light Scattering (DLS) measurements to determine the size distribution. Glass cuvettes were used as sample holders and the samples were filtered through “Hydraflon” hydrophilised PTFE filters with pore size of 0.22 µm before the data acquisition. The measurement parameters are: material refractive index 1.40, Dispersant Refractive index 1.330, and measurement temperature 25 °C.
For the antibacterial studies, a modified version of the Mueller-Hinton method was used [16,17]. 6-mm Whatman® filter papers and Luria-Bertani (LB) broth and agar were supplied by Sigma-Aldrich Pty Ltd., Castle Hill, NSW, Australia. The E. coli DH5α strain was purchased from New England Biolabs Ltd., Ipswich, MA, USA. Staphylococcus aureus ATCC® 25923™ was purchased from Thermo Fisher Scientific Pty Ltd., Waltham, MA, USA. E. coli and S. aureus were cultured on LB agar plates and single colonies were used to inoculate 10 mL of LB broth and grown at 37 °C until the optical density (OD) at 600 nm reached 0.6. A total of 200 μL of the liquid culture was evenly spread on nutrient agar plates. A total of 10 μL of each silver nano particle sample exposed to different plasma exposure times was added to the centre of a 6-mm filter paper disk prior to placement on the inoculated LB agar plates and incubated overnight at 37 °C to observe zones of bacterial growth inhibition.

3. Results and Discussion

3.1. Particle Formation and Characterisation

The colour of the precursor solution changed to yellow after a few minutes of the plasma treatment, indicating the formation of the nanoparticles. All the samples present the characteristic surface plasmon resonance peak of silver nanoparticles (Figure 2). A slight but significant peak was observable for 1 min of plasma exposure, but this later became more prominent. The width of the each plasmon is related to the size distribution of the nanoparticles. The 3-min, 5-min and 7-min samples produced peaks at 369 nm, 394 nm and 396 nm, respectively. The 1-min and 10-min samples have their surface plasmon peaks at 404 nm and 416 nm, respectively. Since equal volumes of samples reacted using the same concentration of precursor, the peak height of the absorbance can be directly proportional to the concentration of the synthesised nanoparticles. The nanoparticle concentration increases until it reaches 5 min and then there is a slight decrease at 7 min. At 10-min plasma exposure, the decrease is more prominent and the plasmon resonance peak is red shifted, which can be attributed to polydisperse distribution of silver nanoparticles [18].
Unlike microscopic techniques, DLS measures the hydrodynamic diameter of the theoretical sphere (rather than the physical size) that diffuses with the same speed as the measured nanoparticle. This is determined by the stabilisers adsorbed on to the nanoparticle, and the solvation shell also moves along with the particle [19]. Therefore, the size measured using the DLS technique is slightly larger than the results obtained by the microscopic techniques. Moreover, DLS measurements are hardly possible on smaller particles in a polydisperse solution [20]. According to the DLS data obtained from the samples (Table 1 and Figure 2 right), there is a decrease in nanoparticle size with an increase in plasma exposure time. The largest average diameter of 20.06 nm is observed at 3 min of plasma treatment and it was then observed that the diameter decreases gradually with an increase in treatment time. The lowest average particle diameter of 9.99 nm was observed at 10 min of plasma exposure. This is an important finding since sub 10-nm silver nanoparticles has been proven to be extremely effective on antibacterial activity. Since DLS measures the hydrodynamic diameter of the nanoparticles, the actual size of the resulting particles can be much smaller than 9.99 nm, which will be far more effective on disinfection processes. Additionally, more than 90% of the volume percentage can be found within the peak area, indicating a narrow distribution of nanoparticles formed during the experiment.
The morphology of the silver nanoparticles has been analysed using TEM. Figure 3a–d show the images of the particles synthesised under 3, 5, 7 and 10 min of cold plasma exposure. The shape is near spherical and the average diameters of the nanoparticles were 17.9 ± 8.9, 14.3 ± 1.6, 10.6 ± 2.3, and 5.4 ± 1.4 nm, respectively. The High-resolution transmission electron microscopy (HRTEM) images of the silver nanoparticles synthesised under different plasma exposure times are shown in the Figure 3e–g.
The fringe spacing is measured to be 0.235, 0.14 and 0.202 nm, which corresponds to the (111), (220) and (200) planes of silver. The d spacings are 0.236, 0.220, 0.141 and 0.121, indicating the face-centred cubic (fcc) crystal structure. The results are consistent with the previous reports in literature [5,21,22]. The sizes obtained on these samples match with the data obtained in the above DLS measurements.

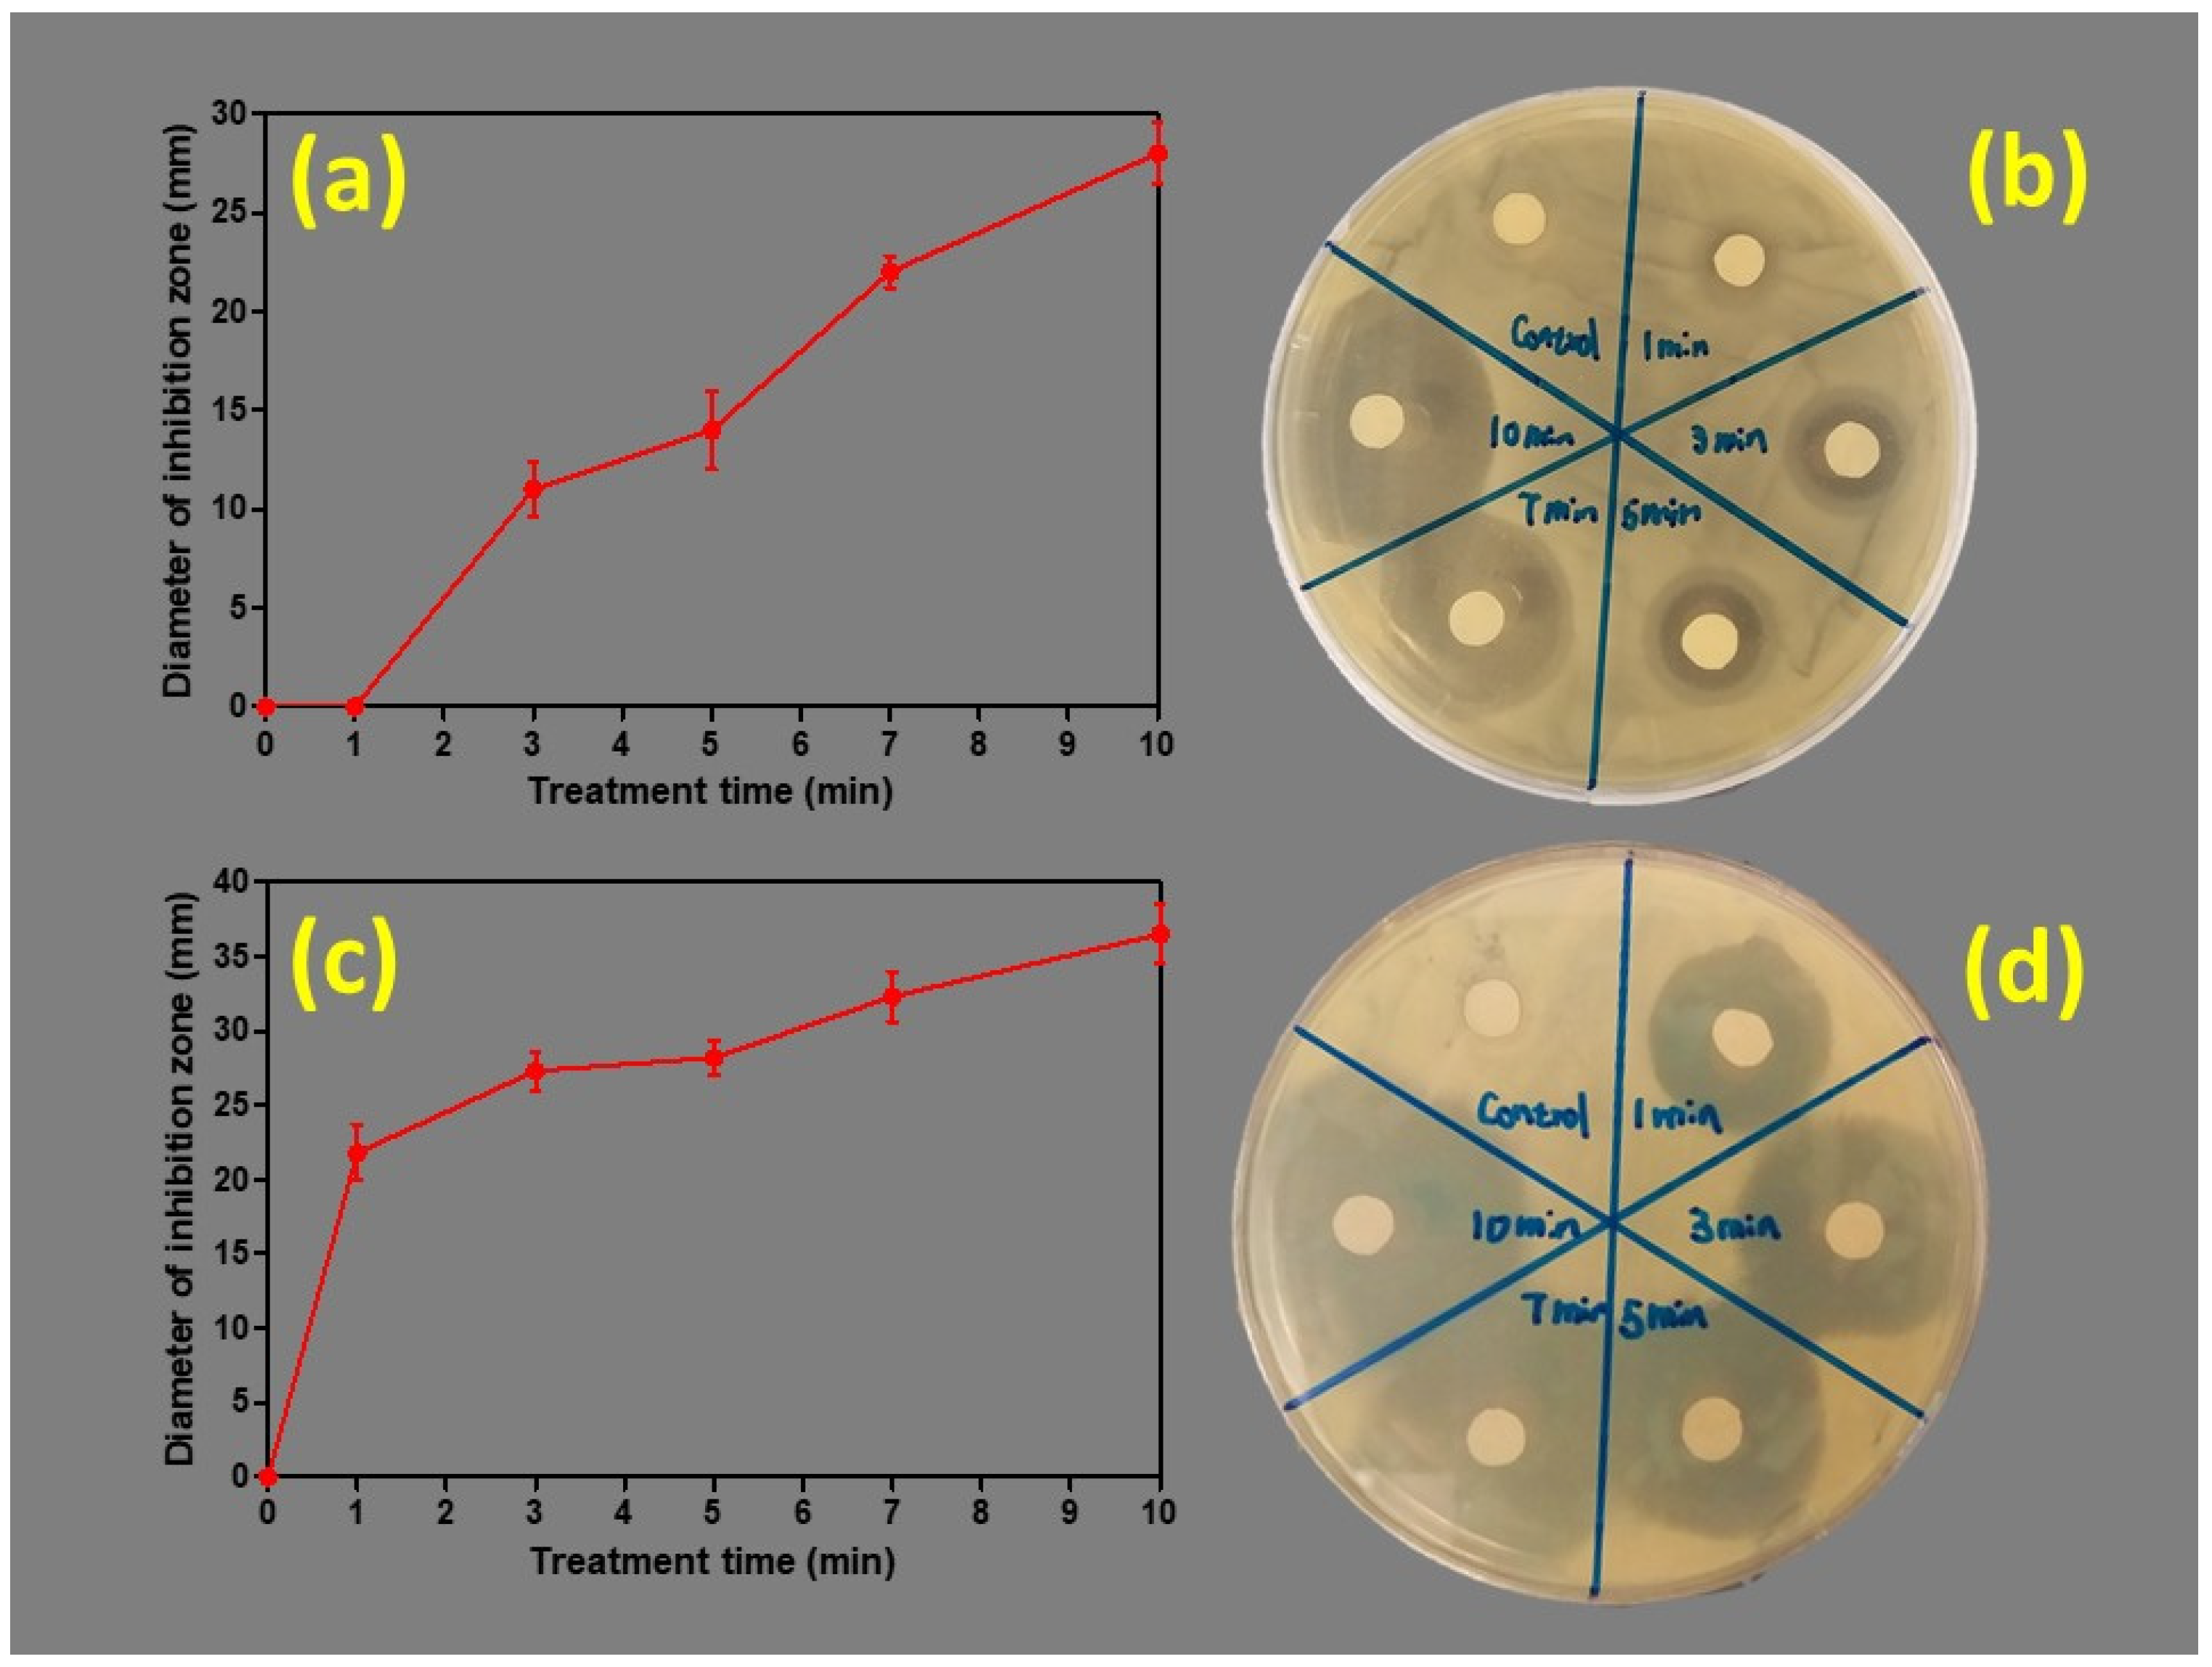
3.2. Antibacterial Properties

Equal volumes of nanoparticle suspensions were infused onto the filter paper disks that were added to bacterial plates and the growth inhibition zones were observed after incubation for 24 h. The variation in the size of the inhibition zones was shown to depend on the plasma exposure (treatment) time, as shown in Figure 4. The diameter of the growth inhibition zone was observed to increase when the plasma exposure (treatment) time was increased. S. aureus was seen to be more sensitive to the silver nano particles compared to E. coli. Based on the UV-Vis data, there was a slight difference in the silver nanoparticle concentrations in the 5-min, 7-min and 10-min plasma-treated samples. However, this antibacterial study showed an inverse relationship between the silver nanoparticle size and the antibacterial activity (Figure 4). These observations align with previous studies where decreased particle size increased the antibacterial effect of silver nanoparticles [23,24,25,26].
Silver nanoparticles are capable of increasing concentrations of reactive oxygen species and decreasing reactive nitrogen species, which cause oxidative stress in bacteria [27,28]. Anti-fungal and anti-viral activities are also reported for silver nanoparticles [29]. The attachment of nanoparticles to the cell wall and cell membranes damages the cell wall and internal structures and causes changes to biochemical pathways. Properties of the nanoparticles, such as size, shape, surface coating and surface charge, also affect the antibacterial activity [30]. S. aureus inhibition by silver nanoparticles has been reported to occur through cell wall damage [31]. For E. coli, a variety of toxic effects have been reported upon exposure to silver nanoparticles, including respiratory inhibition, plasma membrane depolarisation, the leakage of intercellular potassium ions, and metabolic activity inhibition [32].

3.3. Mechanism of Nanoparticle Formation

The mechanism of nanoparticle formation is related to the species generated by the plasma and is illustrated in Figure 5 (right). The chemical reactions taking place during the experiment occur in three different regions. These are the plasma region, plasma–liquid interface and liquid region. Species present in the plasma are excited atoms, ions, electrons and UV photons. In this experiment, Ar DBD has been used and, hence, the main energy carriers for the generation of reactive species are excited Ar atoms and few nitrogen species. The origin of nitrogen species may be due to the dissolved nitrogen in the solution or impurities of the gas. Species such as OH, O3, and H2O2 can also be generated due to the presence of water vapour from the aqueous precursor solution. Optical emission spectroscopy (OES) measurements were performed to identify the species in the plasma discharge. This analyses the light emissions from the constituents of the plasma, such as neutral or ionised gas atoms, free radicals and other molecules. Figure 5 (left) shows the emission spectra of the plasma, which is dominated by argon bands. The hydroxyl band (A2Σ to X2 Π, 0 - 0, 1 - 1, 2 - 2), at 309 nm [33], can be identified and would originate due to the dissociation of water. The second positive system emission of N2 (C3Πµ to B3Πg) can be seen in low intensity at 337, 357 and 380 nm. The nitrogen lines may occur due to the dissolved nitrogen in the aqueous precursor solution. Moreover, oxygen emission lines can be found in 777 nm and 844 nm. Identified spectral lines for argon are included in Table 2 including transitions, relative intensities, and energy levels.
The transfer of these species occurs in the plasma–liquid interface and a fraction of these species is transported into the liquid interface. Within the gas–liquid interface, the possible reactions to take part are the recombination, absorption or desorption of reactive species and the solvation of the electrons [34]. Due to the complex mechanisms of these chemical reactions, a number of unexplained questions remain regarding the plasma-induced liquid chemistry.
The solvated electrons absorbed into the liquid penetrate a few nanometers and react with solvent molecules to induce a number of chemical reactions [12] inclusive of the reduction of silver ions Equation (1). The redox potential of Ag+/Ag is (+0.799 V), which makes the instant capture of the solvated electrons and synthesis of the reduced silver atoms. The atmospheric pressure plasma may have electrons with an energy level up to 20.2 eV and it is possible for the positive ions to also have energy levels above 10 eV [3]. The following reaction is possible within the few nanometres of the liquid surface.
eaq + Ag+ → Ag
Furthermore, solvated electrons react with water and H+ to form more H, which reacts with silver ions to reduce them to Ag Equations (2) and (3). These reactions form H, which also contributes to the further reduction of silver ions.
eaq + H+ → H
eaq + H2O → H + OH
The synthesis of silver nanoparticles in the liquid occurs by the nucleation of the reduced metal atoms due to the liquid chemistry initiated by the DBD plasma. According to the OES spectra, excited Ar, OH and N2 species were identified. The reduction could occur due to a number of species, such as plasma electrons, hydrogen radicals, solvated electrons and hydrogen peroxide [14]. Thai et al. reported that fragments of water continuously ionised to produce OH+, O+, and H+ because the ionisation energies are located below the energy threshold. Additionally, the reaction between H and silver cations also forms silver metal atoms by the following reaction in Equations (2) and (3), which also facilitates the formation of Ag seeds.
H + Ag+ →Ag + H+
Nanoparticle growth occurs eventually by the combination of metallic atom clusters which are surrounded by the citrate capping agents. According to Equations (1)–(4), the amount of reducing agents required to form silver ions depends on the exposure time, and the reaction kinetics can be controlled by varying it. According to the TEM images, the size and the size distribution of the synthesised nanoparticles depend on the plasma exposure. This phenomenon can be explained using the La Mer’s model [2,35]. On low plasma exposure duration, the reducing species in the solution are scarce and few nuclei are formed for the nucleation step. As such, only particle growth can be observed with a broader size range. When the exposure time increases, the enhanced reduction rate generates more nuclei, which leads to the formation of silver nanoparticles of a smaller size. The amount of the reactants available for the particle growth step decreases due to the large number of nuclei, and a relatively smaller number of nanoparticles can be observed in a narrow size distribution.

4. Conclusions

Silver nanoparticles were successfully synthesised by DBD solution plasma processing. Our results suggest that the plasma exposure time is an important factor for the resulting silver nanoparticle concentration and morphology. The morphology was characterised by Transmission Electron Microscopy (TEM) and the optical properties were determined by ultraviolet and visible spectroscopy. The DLS technique was used to determine the hydrodynamic diameter of the particles. OES measurements were made to identify the species present in the cold plasma. The antibacterial properties of the synthesised silver nanoparticles were studied using S. aureus as a model of gram-positive bacteria and E. coli as a gram-negative bacterium. The results indicate that the synthesised nanoparticles demonstrated increased anti-microbial activity with decreasing nanoparticle size. This work demonstrates the possibility of producing silver nanoparticles without the need for toxic reducing agents. The resulting nanomaterials can be successfully employed in electronics, plasmonic and biological applications. The same technique can be used for the synthesis of other various metal nanoparticles, removing the need for chemical reducing agents, leading to much more economically and environmentally favozurable processes.

Author Contributions

Conceptualization, J.W. and K.O.; Data curation, J.W.; Formal analysis, J.W. and W.L.; Funding acquisition, K.V. and K.O.; Investigation, J.W. and W.L.; Methodology, J.W., R.Z., R.Z. and K.O.; Project administration, K.O.; Resources, K.O.; Supervision, P.S.; A.G. and K.O.; Validation K.V. and K.O.; Writing—original draft, J.W.; Writing—review & editing, R.S., P.S., K.V. and K.O. All authors have read and agreed to the published version of the manuscript.

Funding

This research was funded by ARC discovery project DP1810125 grant from the Australian Research Council.

Acknowledgments

The work was partially supported by the Australian Research Council (ARC). The authors would like to acknowledge the support given by QUT HDR tuition fee scholarship. QUT–Central Analytical Research Facility (CARF) for technical support and characterization.

Conflicts of Interest

The authors declare no conflict of interest.

References

  1. Kondeti, V.S.S.K.; Gangal, U.; Yatom, S.; Bruggeman, P.J. Ag+ reduction and silver nanoparticle synthesis at the plasma–liquid interface by an RF driven atmospheric pressure plasma jet: Mechanisms and the effect of surfactant. J. Vac. Sci. Technol. A 2017, 35, 061302. [Google Scholar] [CrossRef]
  2. Nishimoto, M.; Abe, S.; Yonezawa, T. Preparation of Ag nanoparticles using hydrogen peroxide as a reducing agent. New J. Chem. 2018, 42, 14493–14501. [Google Scholar] [CrossRef]
  3. Thai, P.; Abe, S.; Kosugi, K.; Saito, N.; Takahashi, K.; Sasaki, T.; Kikuchi, T. Interaction and transfer of charged particles from an alternating current glow discharge in liquids: Application to silver nanoparticle synthesis. J. Appl. Phys. 2019, 125, 063303. [Google Scholar] [CrossRef]
  4. Vimala, K.; Sivudu, K.S.; Yallapu, M.M.; Sreedhar, B.; Raju, K.M. Controlled silver nanoparticles synthesis in semi-hydrogel networks of poly(acrylamide) and carbohydrates: A rational methodology for antibacterial application. Carbohydr. Polym. 2009, 75, 463–471. [Google Scholar] [CrossRef]
  5. Li, S.; Shen, Y.; Xie, A.; Yu, X.; Qiu, L.; Zhang, L.; Zhang, Q. Green synthesis of silver nanoparticles using Capsicum annuum L. extract. Green Chem. 2007, 9, 852–858. [Google Scholar] [CrossRef]
  6. Zhang, Z.; Shen, W.; Xue, J.; Liu, Y.; Liu, Y.; Yan, P.; Liu, J.; Tang, A.J. Recent advances in synthetic methods and applications of silver nanostructures. Nanoscale Res. Lett. 2018, 13, 54. [Google Scholar] [CrossRef] [Green Version]
  7. Fanelli, F.; Fracassi, F. Atmospheric pressure non-equilibrium plasma jet technology: General features, specificities and applications in surface processing of materials. Surf. Coat. Technol. 2017, 322, 174–201. [Google Scholar] [CrossRef]
  8. Bardos, L.; Baránková, H. Cold atmospheric plasma: Sources, processes, and applications. Thin Solid Films 2010, 518, 6705–6713. [Google Scholar] [CrossRef]
  9. Gorbanev, Y.; Leifert, D.; Studer, A.; O’Connell, D.; Chechik, V. Initiating radical reactions with non-thermal plasmas. Chem. Commun. 2017, 53, 3685–3688. [Google Scholar] [CrossRef] [Green Version]
  10. Cullen, P.J.; Milosavljevi, V.; Milosavljević, V. Spectroscopic characterization of a radio-frequency argon plasma jet discharge in ambient air. Prog. Theor. Exp. Phys. 2015, 2015, 63. [Google Scholar] [CrossRef] [Green Version]
  11. Richmonds, C.; Sankaran, R.M. Plasma-liquid electrochemistry: Rapid synthesis of colloidal metal nanoparticles by microplasma reduction of aqueous cations. Appl. Phys. Lett. 2008, 93, 131501. [Google Scholar] [CrossRef]
  12. Rumbach, P.; Bartels, D.M.; Sankaran, R.M.; Go, D.B. The solvation of electrons by an atmospheric-pressure plasma. Nat. Commun. 2015, 6, 7248. [Google Scholar] [CrossRef] [PubMed]
  13. Saito, G.; Akiyama, T. Nanomaterial Synthesis Using Plasma Generation in Liquid. J. Nanomater. 2015, 2015, 1–21. [Google Scholar] [CrossRef] [Green Version]
  14. Patel, J.; Nemcova, L.; Maguire, P.D.; Graham, W.; Mariotti, D. Synthesis of surfactant-free electrostatically stabilized gold nanoparticles by plasma-induced liquid chemistry. Nanotechnology 2013, 24, 245604. [Google Scholar] [CrossRef] [Green Version]
  15. Maugel, T.K.; Goodhew, P.J. Electron Microscopy and Analysis. Trans. Am. Microsc. Soc. 1976, 95, 243. [Google Scholar] [CrossRef]
  16. Ho, P.-L.; Chow, K.H.; Yuen, K.-Y.; Ng, W.S.; Chau, P.Y. Comparison of a novel, inhibitor-potentiated disc-diffusion test with other methods for the detection of extended-spectrum beta-lactamases in Escherichia coli and Klebsiella pneumoniae. J. Antimicrob. Chemother. 1998, 42, 49–54. [Google Scholar] [CrossRef] [Green Version]
  17. Skov, R.; Smyth, R.; Larsen, A.R.; Bolmström, A.; Karlsson, A.; Mills, K.; Frimodt-Moller, N.; Kahlmeter, G. Phenotypic Detection of Methicillin Resistance in Staphylococcus aureus by Disk Diffusion Testing and Etest on Mueller-Hinton Agar. J. Clin. Microbiol. 2006, 44, 4395–4399. [Google Scholar] [CrossRef] [Green Version]
  18. Dong, P.; Cheng, X.; Jin, Z.; Huang, Z.; Nie, X.; Wang, X.; Zhang, X. The green synthesis of Ag-loaded photocatalyst via DBD cold plasma assisted deposition of Ag nanoparticles on N-doped TiO2 nanotubes. J. Photochem. Photobiol. A Chem. 2019, 382, 111971. [Google Scholar] [CrossRef]
  19. Tomaszewska, E.; Soliwoda, K.; Kadziola, K.; Tkacz-Szczesna, B.; Celichowski, G.; Cichomski, M.; Szmaja, W.; Grobelny, J. Detection Limits of DLS and UV-Vis Spectroscopy in Characterization of Polydisperse Nanoparticles Colloids. J. Nanomater. 2013, 2013, 1–10. [Google Scholar] [CrossRef] [Green Version]
  20. Cumberland, S.; Lead, J. Particle size distributions of silver nanoparticles at environmentally relevant conditions. J. Chromatogr. A 2009, 1216, 9099–9105. [Google Scholar] [CrossRef]
  21. Davey, W.P. Precision Measurements of the Lattice Constants of Twelve Common Metals. Phys. Rev. 1925, 25, 753–761. [Google Scholar] [CrossRef]
  22. Vidhu, V.; Philip, D. Spectroscopic, microscopic and catalytic properties of silver nanoparticles synthesized using Saraca indica flower. Spectrochim. Acta Part A Mol. Biomol. Spectrosc. 2014, 117, 102–108. [Google Scholar] [CrossRef] [PubMed]
  23. Morones, J.R.; Elechiguerra, J.L.; Camacho, A.; Holt, K.; Kouri, J.; Ramírez, J.T.; Yacaman, M.J. The bactericidal effect of silver nanoparticles. Nanotechnology 2005, 16, 2346–2353. [Google Scholar] [CrossRef] [PubMed] [Green Version]
  24. Lok, C.-N.; Ho, C.-M.; Chen, R.; He, Q.-Y.; Yu, W.-Y.; Cheng, Y.H.; Tam, P.K.-H.; Chiu, J.-F.; Che, C.-M. Silver nanoparticles: Partial oxidation and antibacterial activities. JBIC J. Boil. Inorg. Chem. 2007, 12, 527–534. [Google Scholar] [CrossRef]
  25. Agnihotri, S.; Mukherji, S.; Mukherji, S. Size-controlled silver nanoparticles synthesized over the range 5–100 nm using the same protocol and their antibacterial efficacy. RSC Adv. 2014, 4, 3974–3983. [Google Scholar] [CrossRef] [Green Version]
  26. Baker, C.; Pradhan, A.; Pakstis, L.; Pochan, D.J.; Shah, S.I. Synthesis and antibacterial properties of silver nanoparticles. J. Nanosci. Nanotechnol. 2005, 5, 244–249. [Google Scholar] [CrossRef]
  27. Tang, S.; Zheng, J. Antibacterial Activity of Silver Nanoparticles: Structural Effects. Adv. Heal. Mater. 2018, 7, 1701503. [Google Scholar] [CrossRef]
  28. Quinteros, M.; Aristizábal, V.C.; Dalmasso, P.; Paraje, M.; Páez, P.L. Oxidative stress generation of silver nanoparticles in three bacterial genera and its relationship with the antimicrobial activity. Toxicol. Vitr. 2016, 36, 216–223. [Google Scholar] [CrossRef]
  29. Koduru, J.R.; Kailasa, S.K.; Bhamore, J.R.; Kim, K.-H.; Dutta, T.; Vellingiri, K. Phytochemical-assisted synthetic approaches for silver nanoparticles antimicrobial applications: A review. Adv. Colloid Interface Sci. 2018, 256, 326–339. [Google Scholar] [CrossRef]
  30. Xiu, Z.-M.; Zhang, Q.; Puppala, H.L.; Colvin, V.L.; Alvarez, P.J. Negligible Particle-Specific Antibacterial Activity of Silver Nanoparticles. Nano Lett. 2012, 12, 4271–4275. [Google Scholar] [CrossRef]
  31. Mirzajani, F.; Ghassempour, A.; Aliahmadi, A.; Esmaeili, M.A. Antibacterial effect of silver nanoparticles on Staphylococcus aureus. Res. Microbiol. 2011, 162, 542–549. [Google Scholar] [CrossRef] [PubMed]
  32. Bondarenko, O.; Sihtmäe, M.; Kuzmičiova, J.; Ragelienė, L.; Kahru, A.; Daugelavicius, R. Plasma membrane is the target of rapid antibacterial action of silver nanoparticles in Escherichia coli and Pseudomonas aeruginosa. Int. J. Nanomed. 2018, 13, 6779–6790. [Google Scholar] [CrossRef] [PubMed] [Green Version]
  33. Shirafuji, T.; Nakamura, Y.; Azuma, S.; Sotoda, N.; Isshiki, T. Au-nanoparticle-embedded cross-linked gelatin films synthesized on aqueous solution in contact with dielectric barrier discharge. Jpn. J. Appl. Phys. 2017, 57, 0102BE. [Google Scholar] [CrossRef]
  34. Xie, P.; Qi, Y.; Wang, R.; Wu, J.; Li, X. Aqueous Gold Nanoparticles Generated by AC and Pulse-Power-Driven Plasma Jet. Nanomaterials 2019, 9, 1488. [Google Scholar] [CrossRef] [PubMed] [Green Version]
  35. Park, B.K.; Jeong, S.; Kim, D.; Moon, J.; Lim, S.; Kim, J.S. Synthesis and size control of monodisperse copper nanoparticles by polyol method. J. Colloid Interface Sci. 2007, 311, 417–424. [Google Scholar] [CrossRef]
Figure 1. Schematic diagram of the DBD plasma setup used for the Ag nanoparticles synthesis. Inset: detailed diagram of the DBD plasma system.
Nanomaterials 10 00874 g001
Figure 2. Ultraviolet-visible (UV-Vis) spectra of the silver nanoparticles synthesised on different plasma exposure times (left); size distribution of Ag nanoparticles measured by the Dynamic Light Scattering (DLS) method technique for different plasma exposure times (right).
Nanomaterials 10 00874 g002
Figure 3. Transmission Electron Microscopy (TEM) images of the nanoparticles synthesised under different plasma exposure times: (a) 3 min, (b) 5 min, (c) 7 min, (d) 10 min; size distribution of the nanoparticles determined from TEM: (e) 3 min, (f) 5 min, (g) 7 min, (h) 10 min; HRTEM of nanoparticles (i) 3 min, (j) 5 min, (k) 7 min, (l) 10 min.
Nanomaterials 10 00874 g003
Figure 4. Treatment (plasma exposure time) time curves for (a) E. coli and (c) S. aureus. Example optical image of E. coli clearance zones (b) and S. aureus (d) on agar plates with different silver nanoparticle samples under visible light.
Nanomaterials 10 00874 g004
Figure 5. OES spectrum of the Argon DBD plasma used to treat the precursor solution (left); schematic representation of the DBD plasma assisted silver nanoparticle formation (right).
Nanomaterials 10 00874 g005
Table 1. Variation of DLS size values on different exposure times of cold plasma.
Plasma Exposure (min) DLS (nm) % VolumeStandard Deviation
320.0690.95.543
516.1695.93.746
715.2792.24.322
109.9998.43.405
Table 2. Observed optical emission spectroscopy (OES) data of the argon emission spectral lines. Transition, initial energy levels (Ei) and final energy levels (Ef) taken from Ref [10].
Wavelength (nm)TransitionRelative Intensity (a.u)Ei (eV)Ef (eV)
6962p2 → 1s561,37113.3311.55
7072p3 → 1s515,58713.3011.55
7152p5 → 1s5328413.2811.55
7272p2 → 1s426,82113.3311.62
7382p3 → 1s430,89613.3011.62
7502p1 → 1s255,71913.4811.83
7512p5 → 1s436,43413.2711.62
7632p6 → 1s565,54913.1711.55
7722p2 → 1s365,45013.1511.55
7952p4 → 1s357,75613.2811.72
8012p6 → 1s448,87513.0911.55
8102p7 → 1s450,47713.1511.62
8112p9 → 1s562,02813.0811.55
8262p2 → 1s261,61313.3311.83
8412p3 → 1s227,47413.3011.83
8422p8 → 1s461,27713.0911.62
8522p4 → 1s218,47413.2811.83

