Influence of Experimental Parameters of a Continuous Flow Process on the Properties of Very Small Iron Oxide Nanoparticles (VSION) Designed for T1-Weighted Magnetic Resonance Imaging (MRI)

 , , , ,
  ,
, 
Abstract
1. Introduction
2. Experimental Section
2.1. Materials
2.2. Batch Synthesis of VSION
2.3. Flow Synthesis of VSION
2.4. Characterizations
3. Results and Discussion
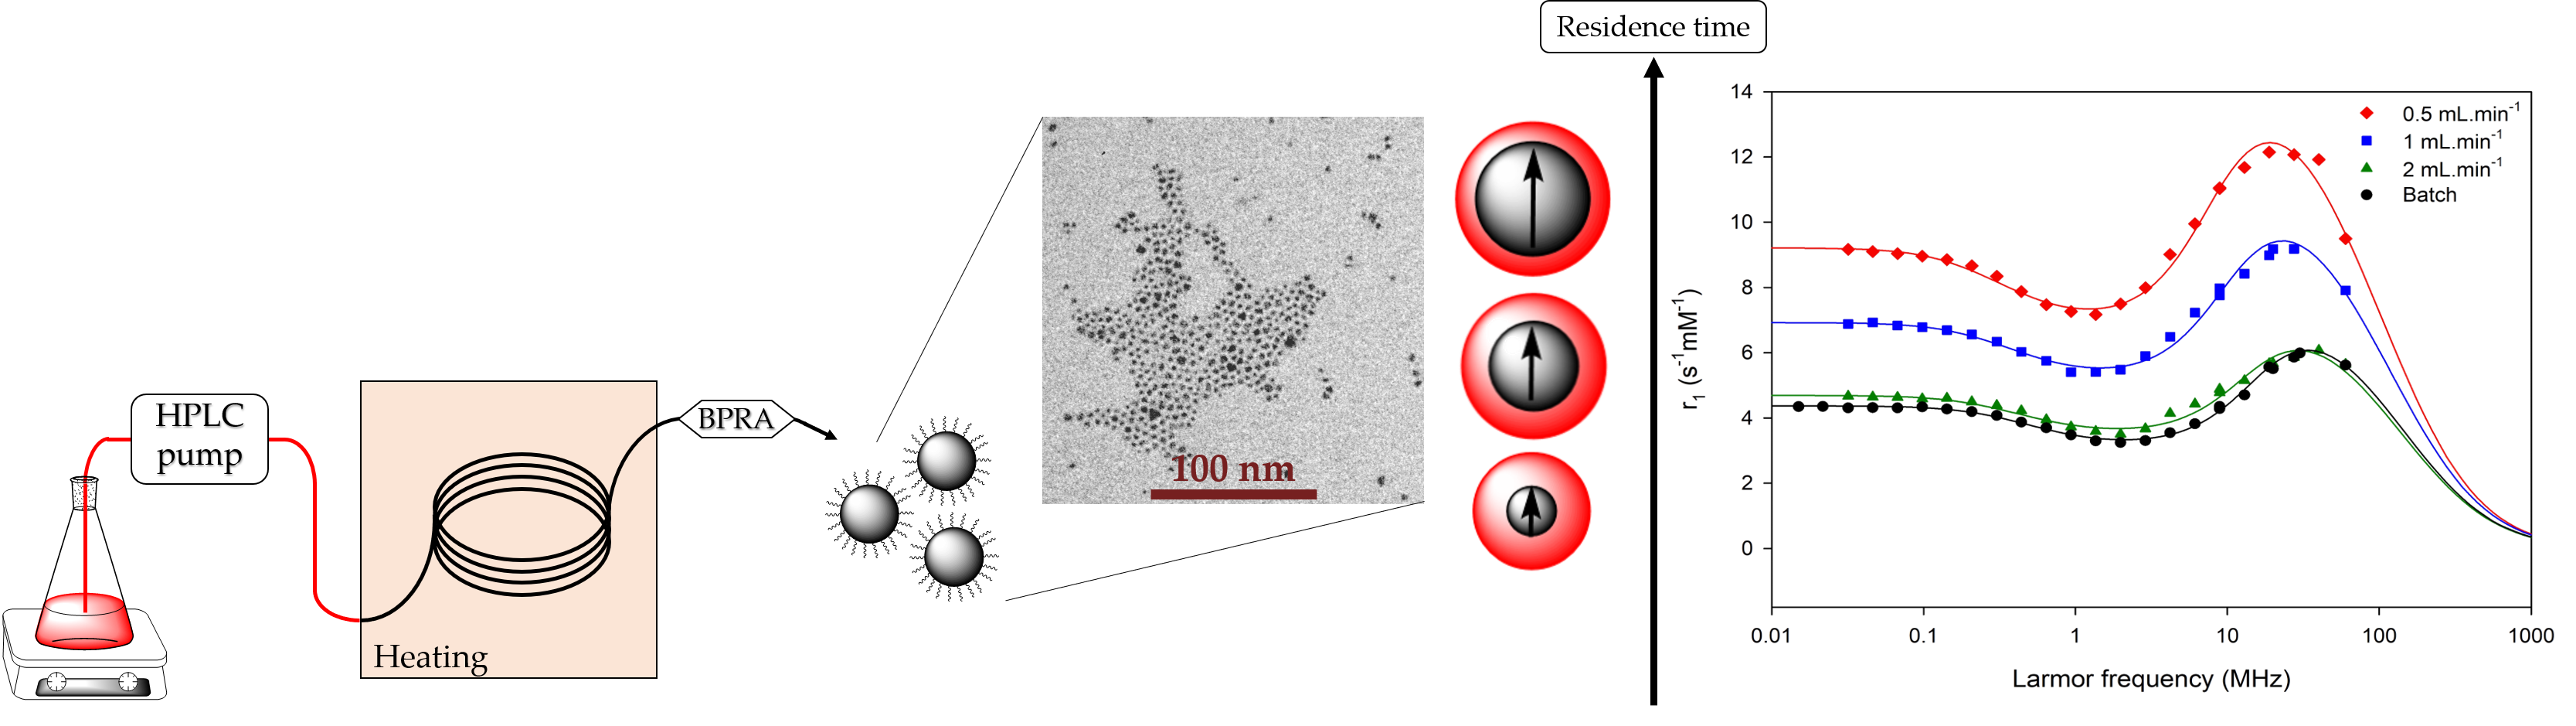
3.1. VSION Formation by Thermal Decomposition Using Batch Process
3.2. Influence of Experimental Parameters on Nanoparticles Formation by Thermal Decomposition Using Flow Process
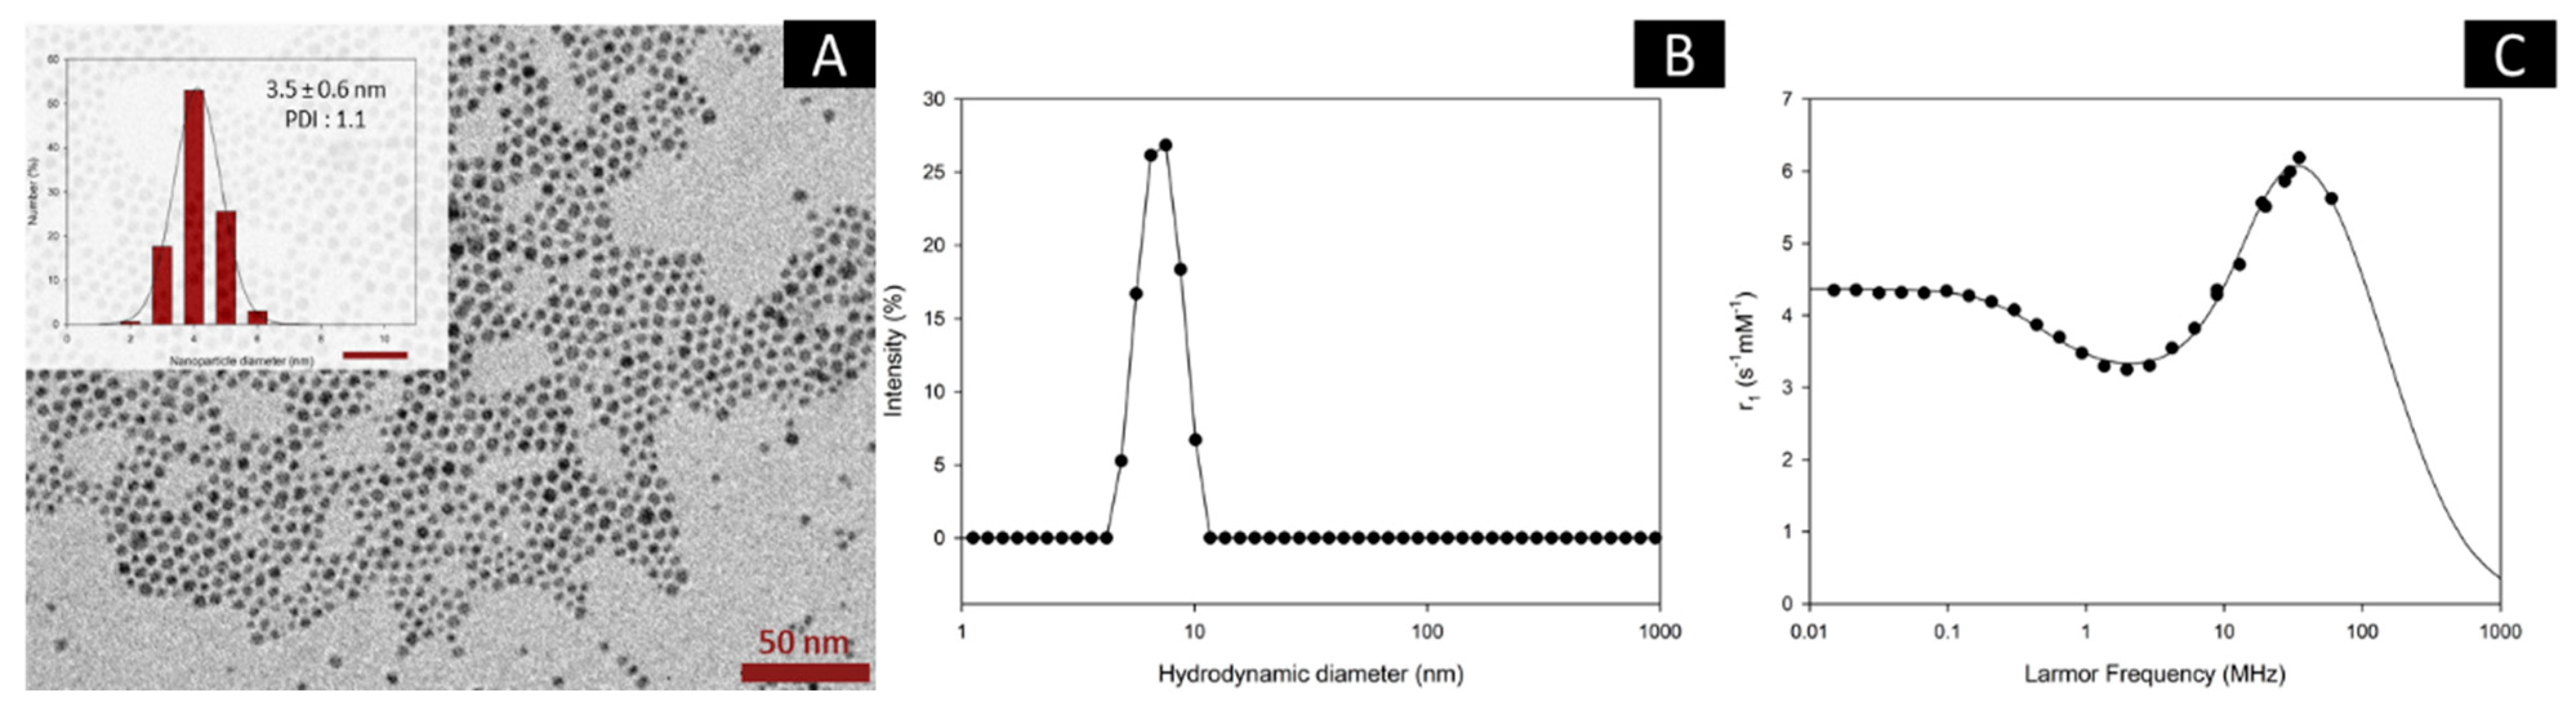
3.3. Influence of the Ligand/Precursor Molar Ratio and Ligand Nature
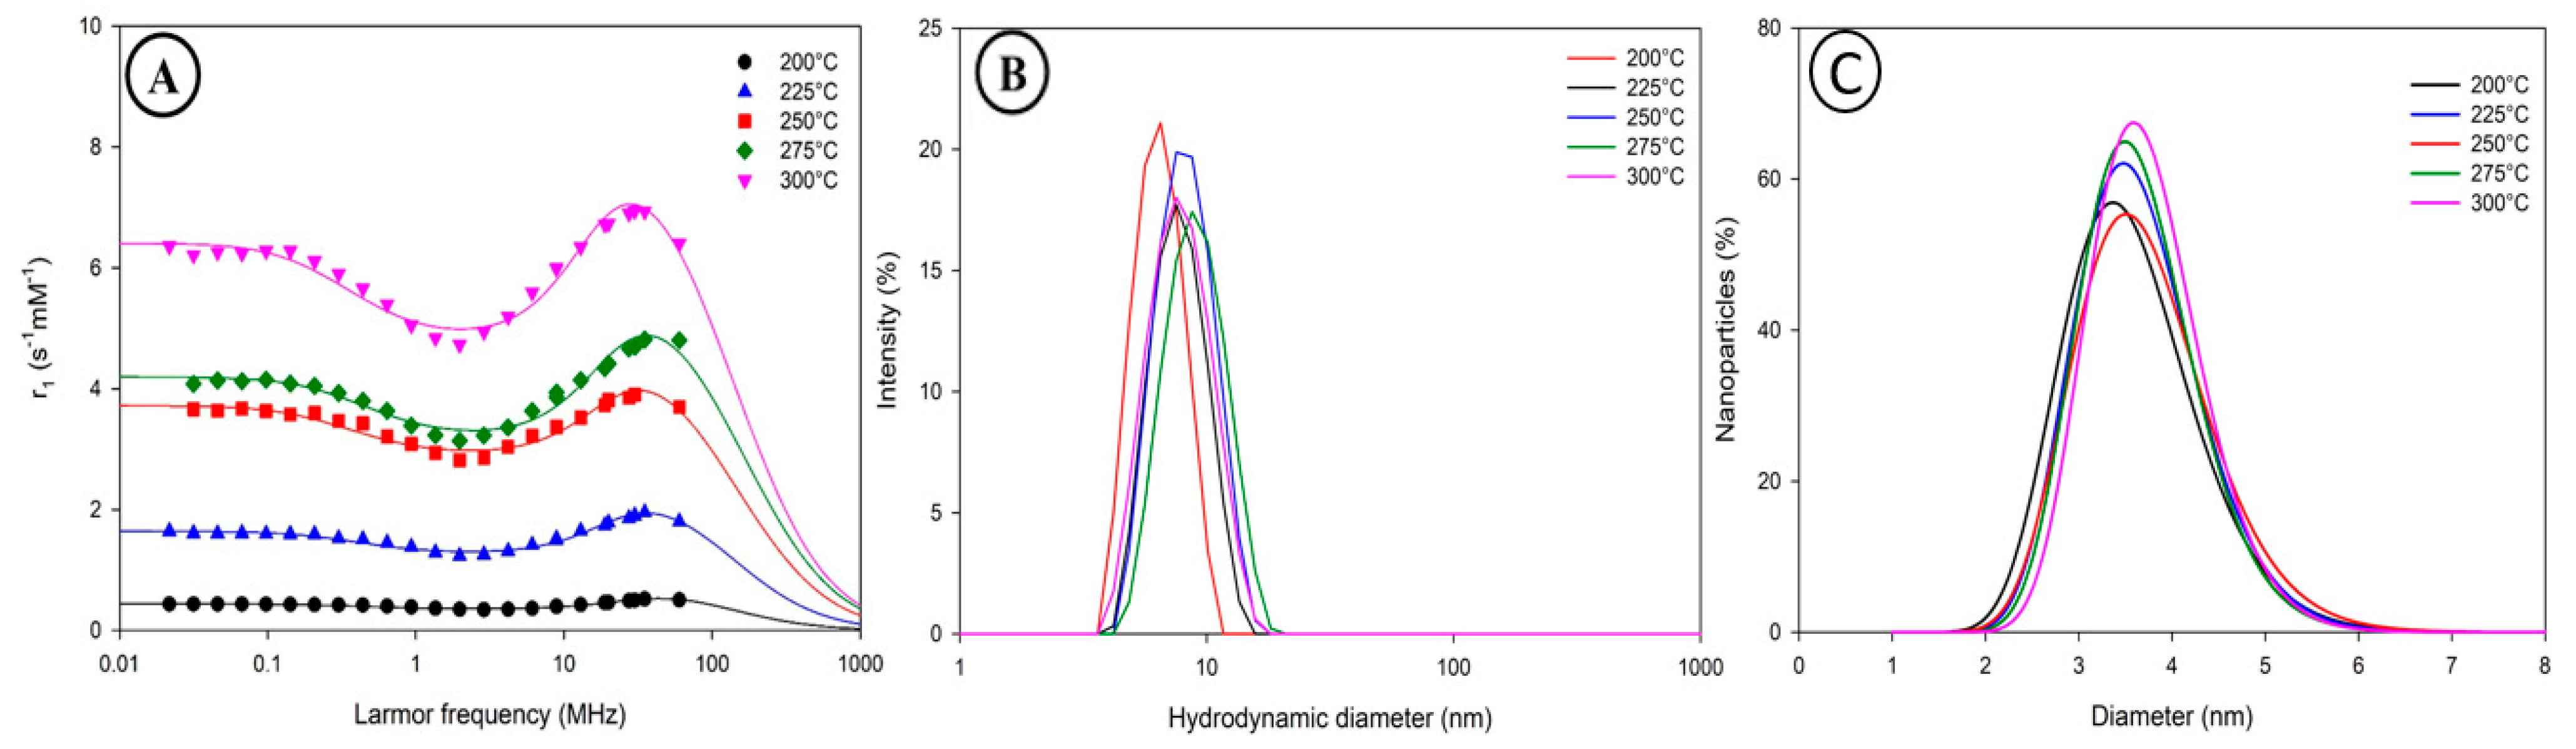
3.4. Influence of Temperature
3.5. Influence of Pressure
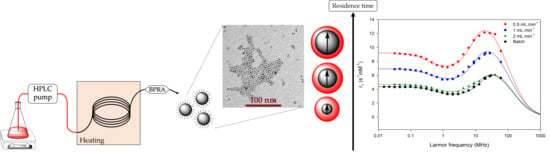
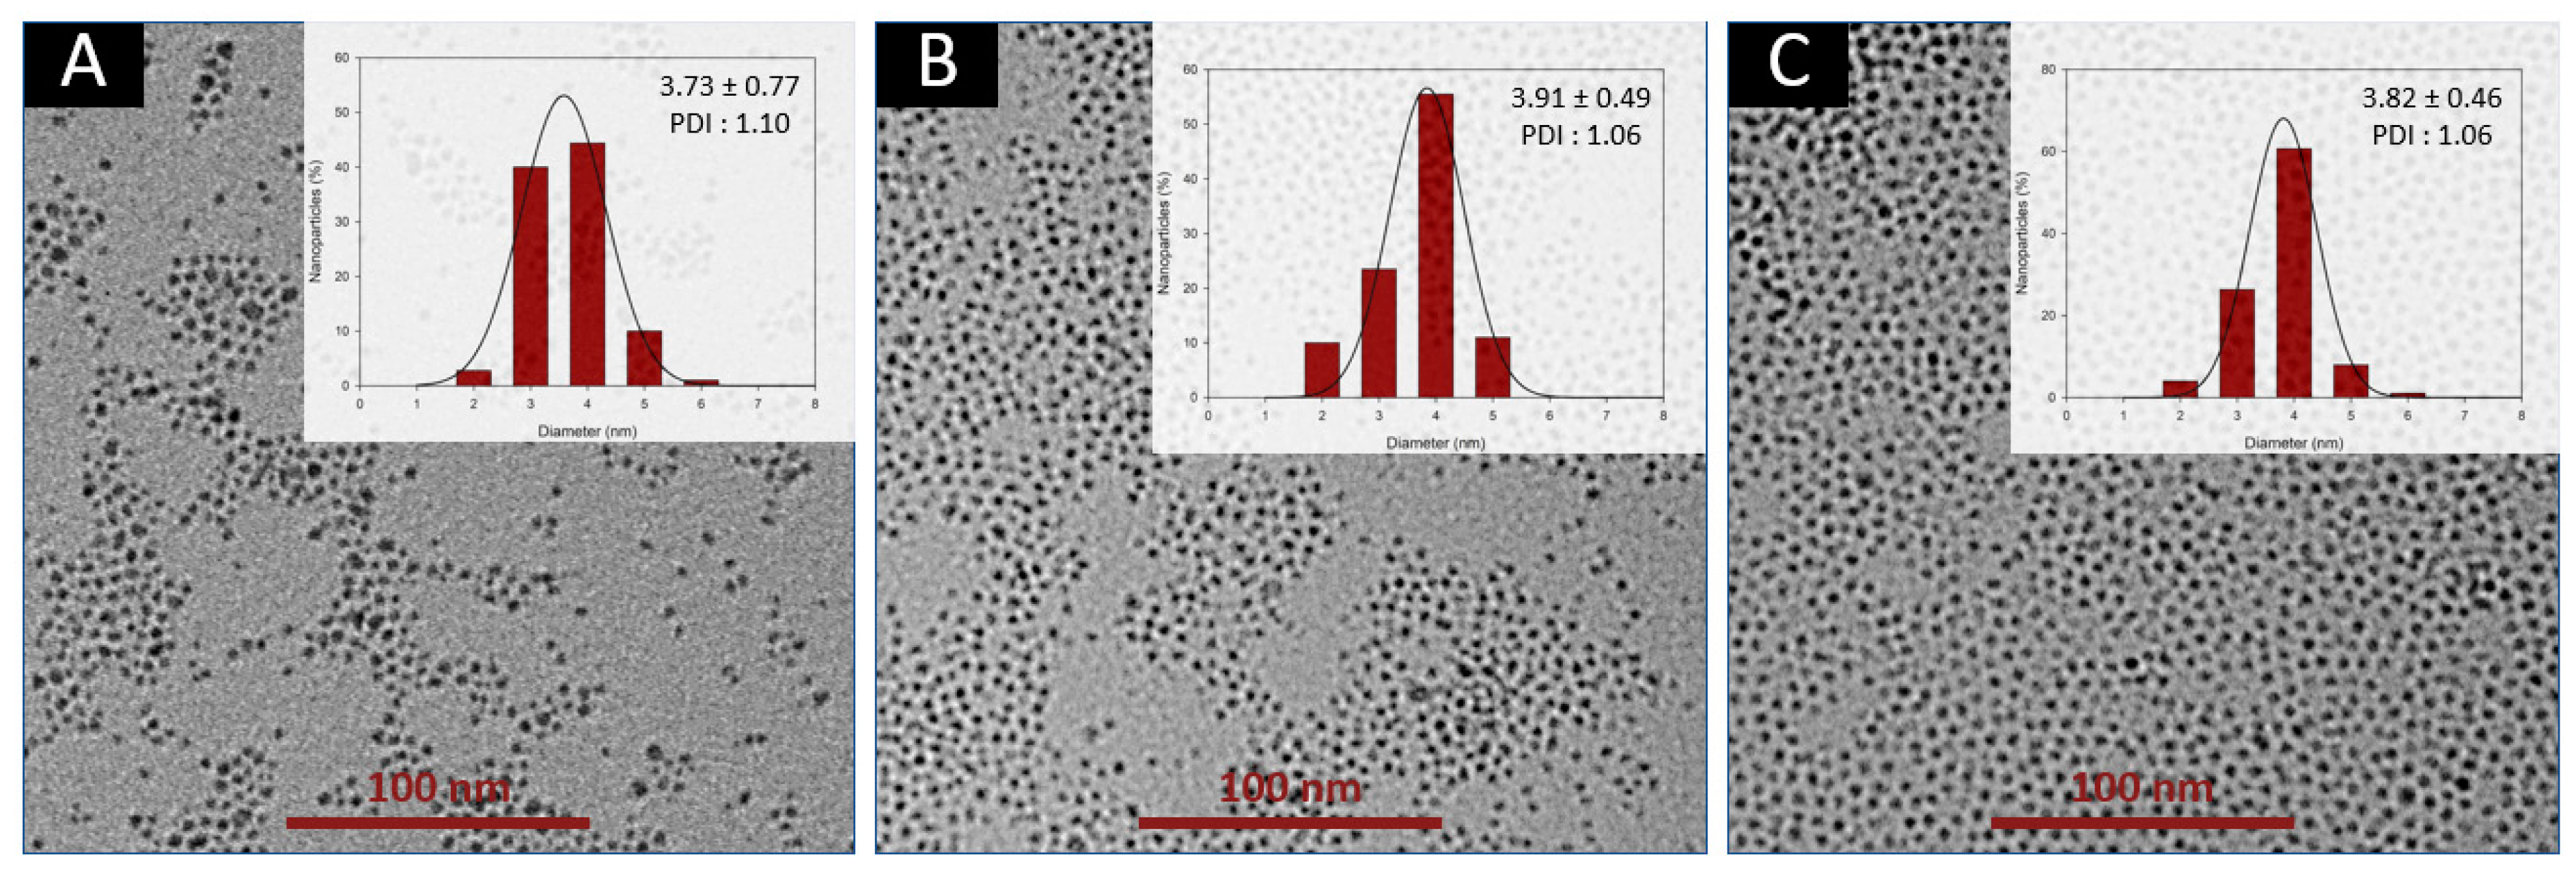
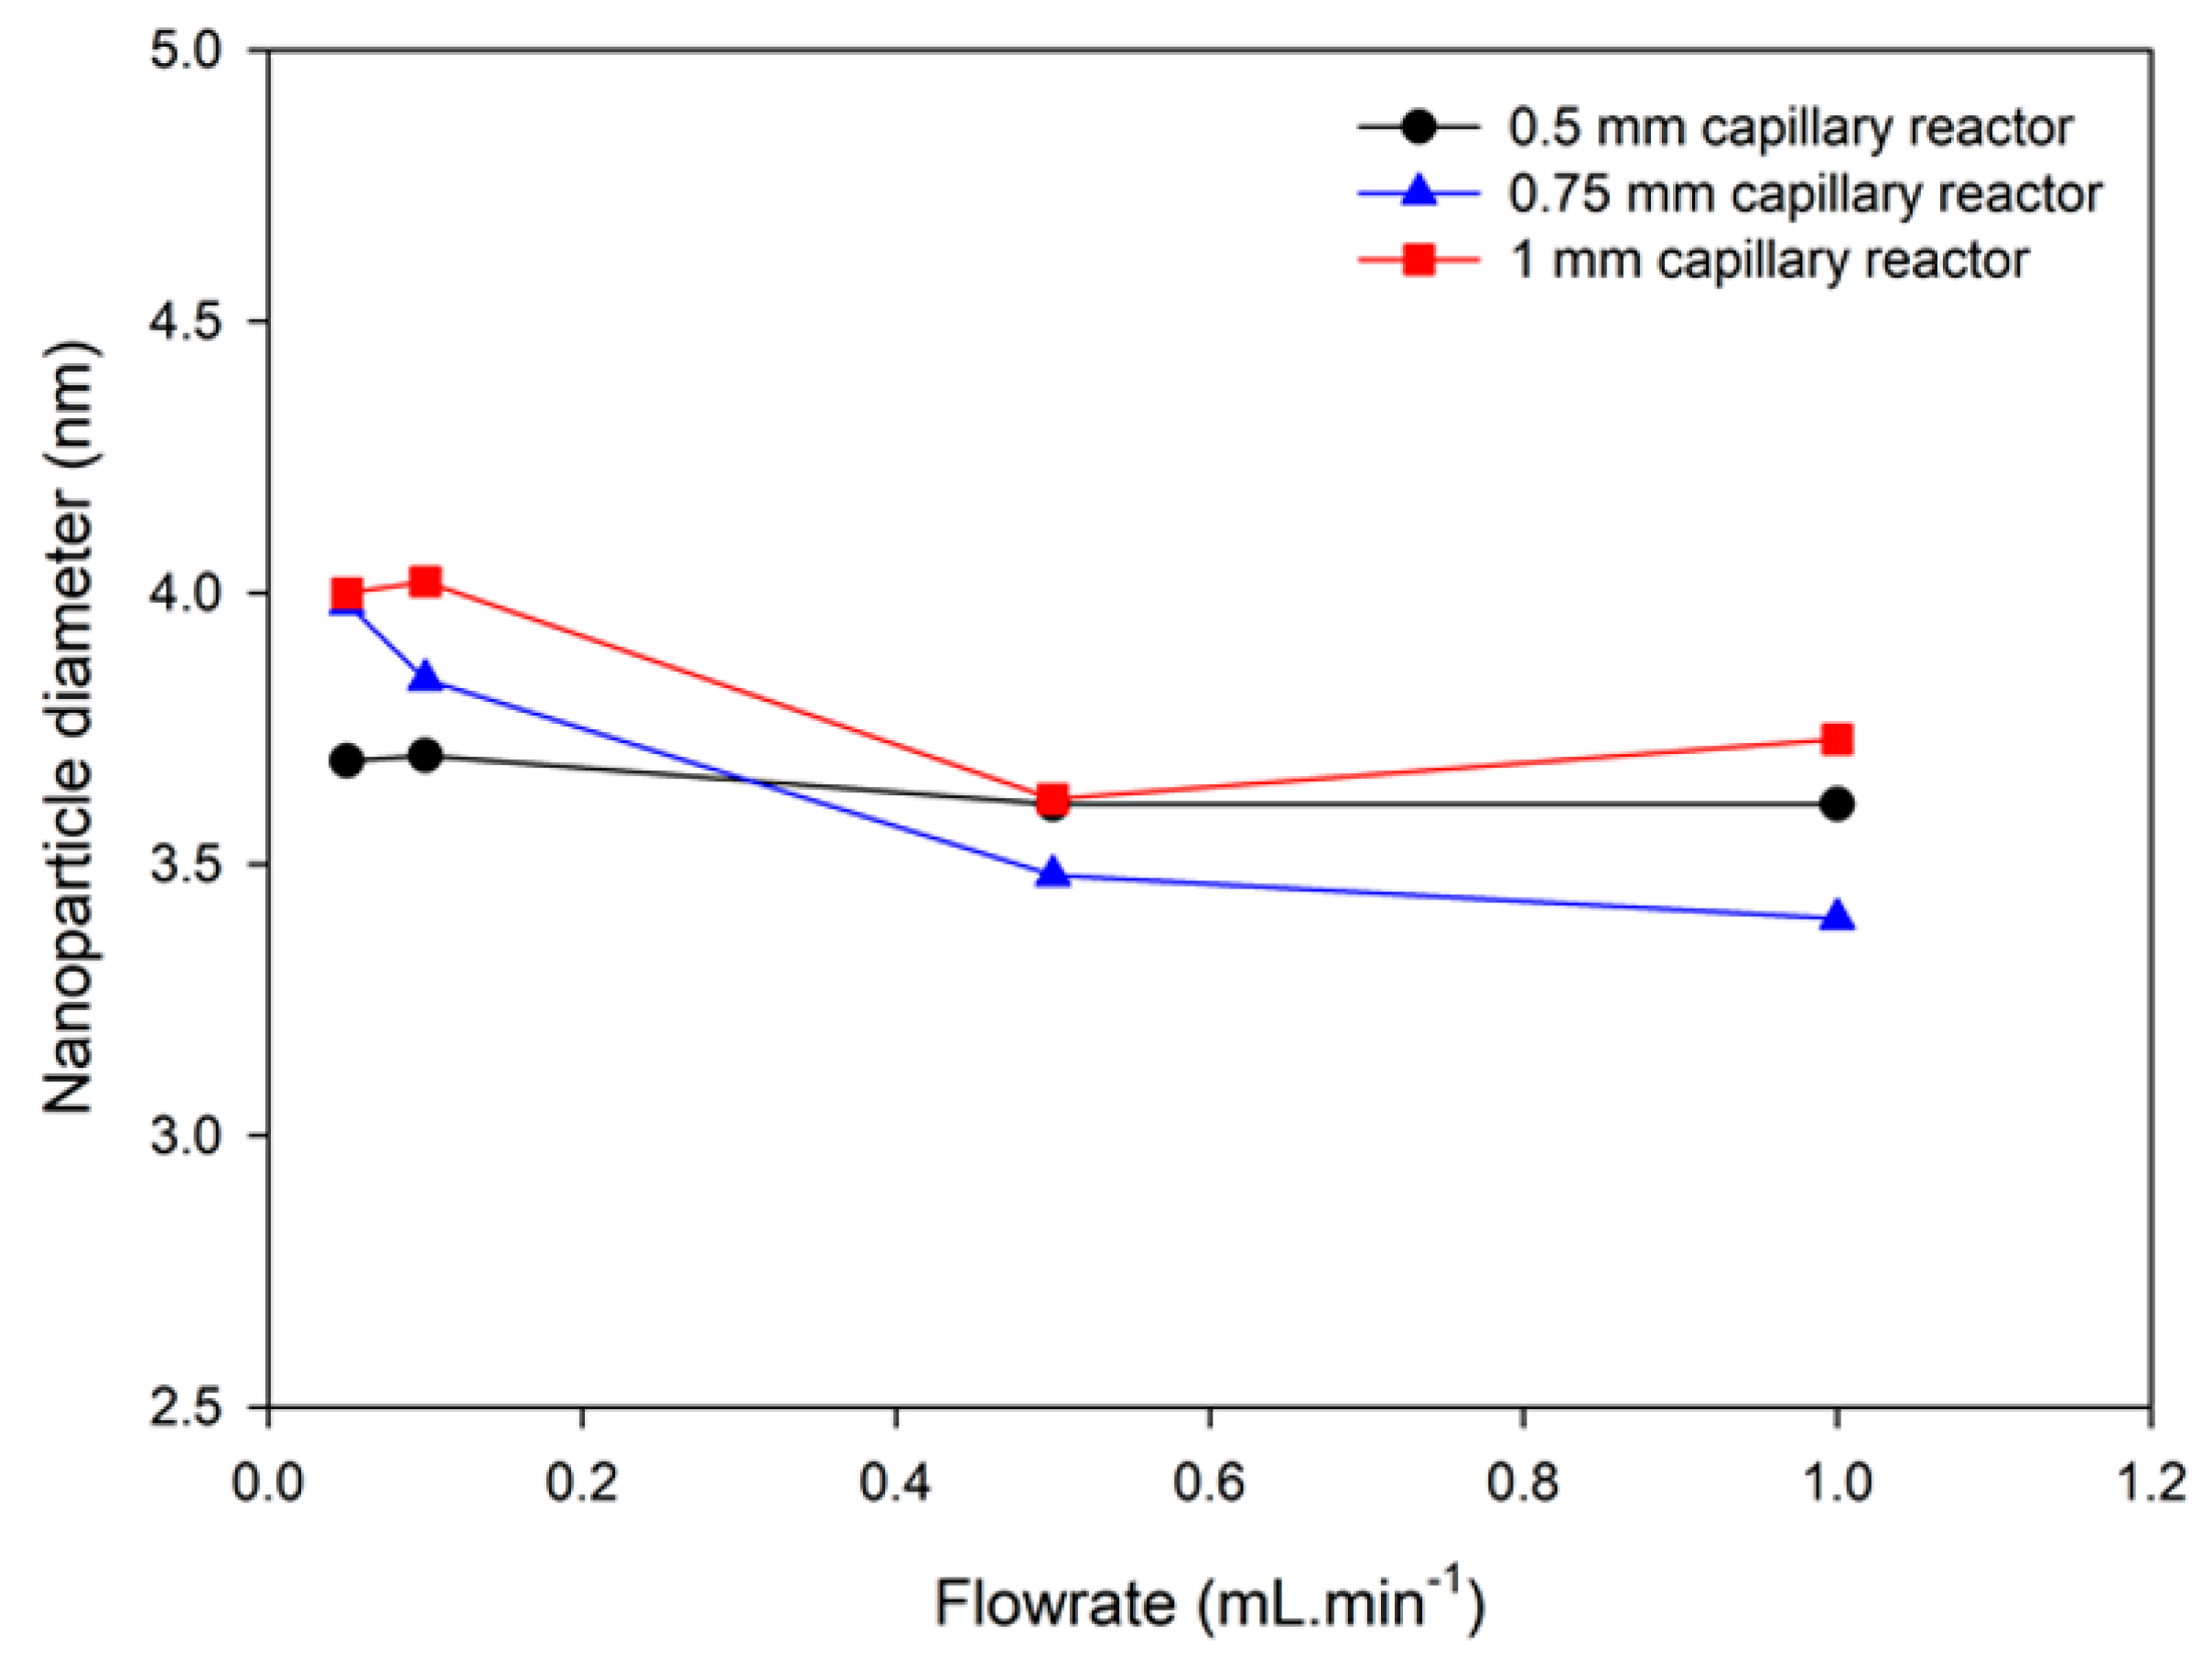
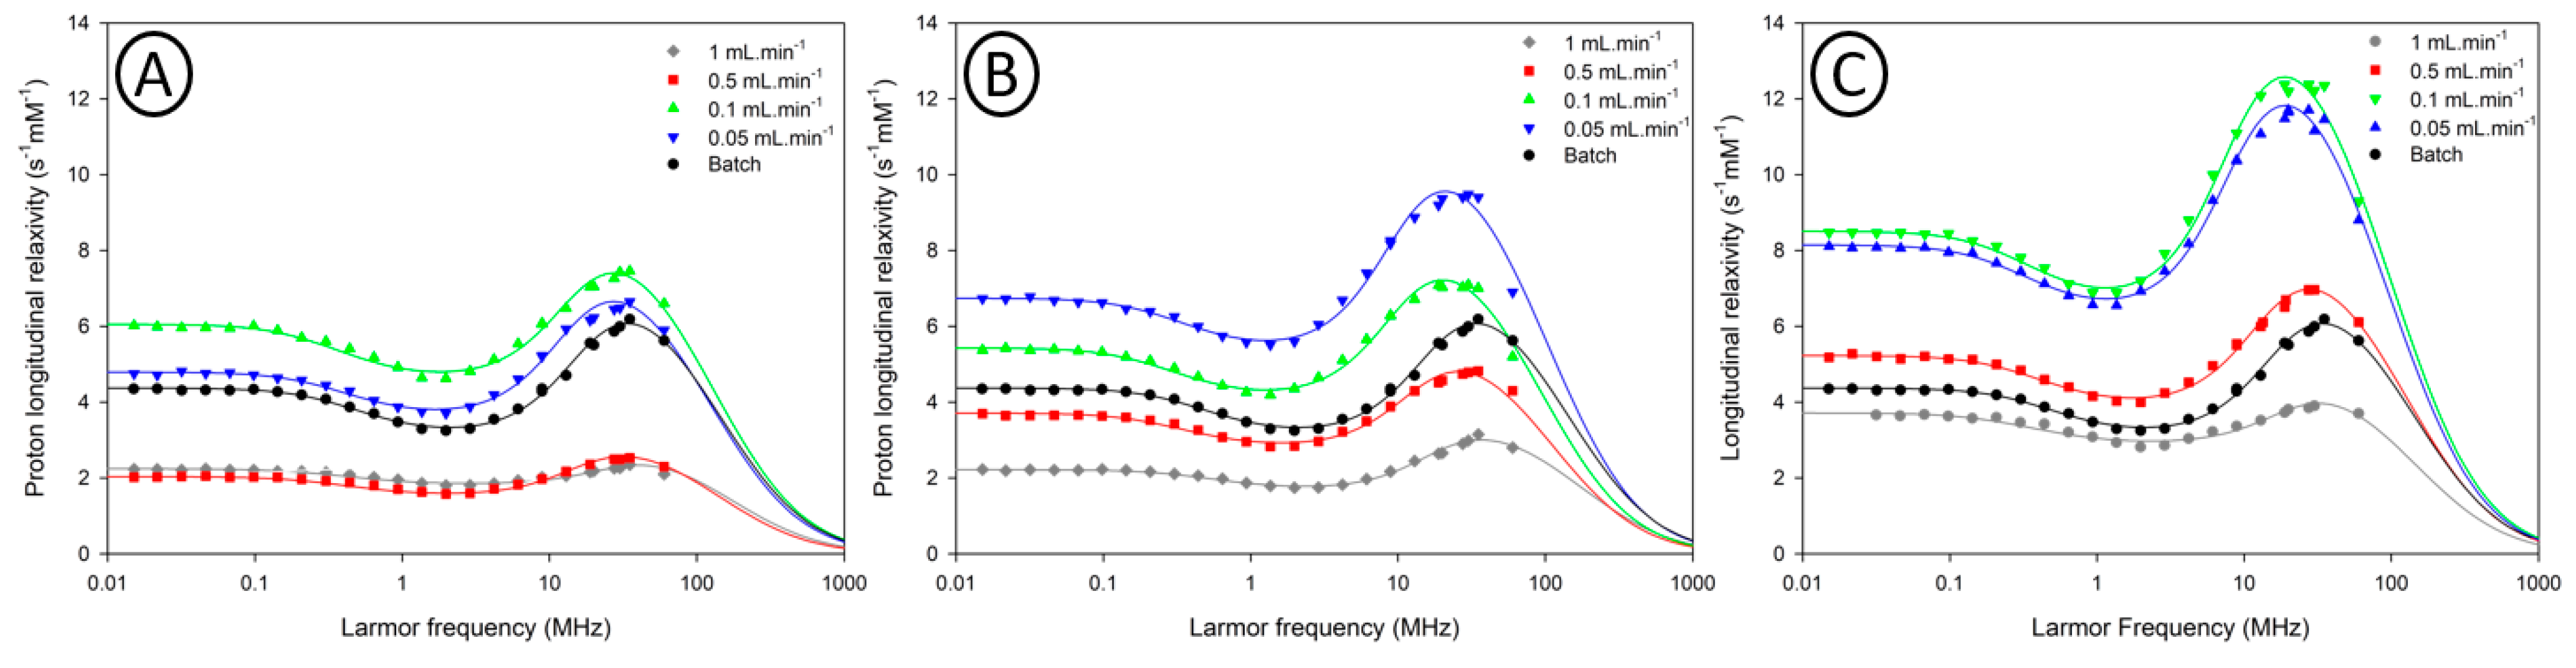
3.6. Influence of Residence Time in the Capillary Reactor
4. Conclusions
Supplementary Materials
Author Contributions
Funding
Acknowledgments
Conflicts of Interest
References
- Shen, S.; Wu, A.; Chen, X. Iron oxide nanoparticles-based contrast agents for magnetic resonance imaging. Mol. Pharm. 2016, 14, 1352–1364. [Google Scholar] [CrossRef] [PubMed]
- Qiao, R.; Yang, C.; Gao, M. Superparamagnetic iron oxide nanoparticles: From preparations to in vivo MRI applications. J. Mater. Chem. 2009, 19, 6274–6293. [Google Scholar] [CrossRef]
- Vangijzegem, T.; Stanicki, D.; Laurent, S. Magnetic iron oxide nanoparticles for drug delivery: Applications and characteristics. Expert Opin. Drug Deliv. 2019, 16, 69–78. [Google Scholar] [CrossRef] [PubMed]
- Mou, X.; Ali, Z.; Li, S.; He, N. Applications of magnetic nanoparticles in targeted drug delivery system. J. Nanosci. Nanotechnol. 2015, 15, 54–62. [Google Scholar] [CrossRef] [PubMed]
- Wahajuddin, S.A. Superparamagnetic iron oxide nanoparticles: Magnetic nanoplatforms as drug carriers. Int. J. Nanomed. 2012, 7, 3445–3471. [Google Scholar] [CrossRef] [PubMed]
- Hedayatnasab, Z.; Abnisa, F.; Daud, W.M.A.W. Review on magnetic nanoparticles for magnetic nanofluid hyperthermia application. Mater. Design 2014, 123, 174–196. [Google Scholar] [CrossRef]
- Blanco-Andujar, C.; Walter, A.; Cotin, G.; Bordeianu, C.; Mertz, D.; Felder-Flesch, D.; Begin-Colin, S. Design of iron oxide-based nanoparticles for MRI and magnetic hyperthermia. Nanomedicine 2016, 11, 1889–1910. [Google Scholar] [CrossRef]
- Li, L.; Jiang, W.; Luo, K.; Song, H.; Lan, F.; Wu, Y.; Gu, Z. Superparamagnetic iron oxide nanoparticles as MRI contrast agents for non-invasive stem cell labeling and tracking. Theranostics 2013, 3, 595–615. [Google Scholar] [CrossRef]
- Tefft, B.J.; Uthamaraj, S.; Harburn, J.J.; Klabusay, M.; Dragomir-Daescu, D.; Sandhu, G.S. Cell labeling and targeting with superparamagnetic iron oxide nanoparticles. J. Vis. Exp. 2015, 104, 1–9. [Google Scholar] [CrossRef]
- Merbach, A.; Helm, L.; Tóth, É. The Chemistry of Contrast Agents in Medical Magnetic Resonance Imaging; John Wiley & Sons: Hoboken, NJ, USA, 2013. [Google Scholar]
- Wang, Y.J. Superparamagnetic iron oxide based MRI contrast agents: Current status of clinical application. Quant. Imaging Med. Surg. 2011, 1, 35–40. [Google Scholar]
- Reimer, P.; Balzer, T. Ferucarbotran (Resovist): A new clinically approved RES-specific contrast agent for contrast-enhanced MRI of the liver: Properties, clinical development, and applications. Eur. Radiol. 2003, 13, 1266–1276. [Google Scholar] [CrossRef] [PubMed]
- Kim, B.H.; Lee, N.; Kim, H.; An, K.; Park, Y.I.; Choi, Y.; Shin, K.; Lee, Y.; Kwon, S.G.; Na, H.B.; et al. Large-scale synthesis of uniform and extremely small-sized iron oxide nanoparticles for high-resolution T1 magnetic resonance imaging contrast agents. J. Am. Chem. Soc. 2011, 133, 12624–12631. [Google Scholar] [CrossRef] [PubMed]
- Ramalho, J.; Semelka, R.C.; Ramalho, M.; Nunes, R.H.; Alobaidy, M.; Castillo, M. Gadolinium-based contrast agent accumulation and toxicity: An update. Am. J. Neuroradiol. 2016, 37, 1192–1198. [Google Scholar] [CrossRef] [PubMed]
- Wertman, R.; Altun, E.; Martin, D.R.; Mitchell, D.G.; Leyendecker, J.R.; O’Malley, R.B.; Parsons, D.J.; Fuller, E.R.; Semelka, R.C. Risk of nephrogenic systemic fibrosis: Evaluation of gadolinium chelate contrast agents at four American universities. Radiology 2008, 248, 799–806. [Google Scholar] [CrossRef]
- Robert, P.; Violas, X.; Grand, S.; Lehericy, S.; Idée, J.; Ballet, S.; Corot, C. Linear gadolinium-based contrast agents are associated with brain gadolinium retention in healthy rats. Investig. Radiol. 2016, 51, 73–82. [Google Scholar] [CrossRef]
- Arena, F.; Bardini, P.; Blasi, F.; Gianolio, E.; Marini, G.M.; La Cava, F.; Valbusa, G.; Aime, S. Gadolinium presence, MRI hyperintensities, and glucose uptake in the hypoperfused rat brain after repeated administrations of gadodiamide. Neuroradiology 2019, 61, 163–173. [Google Scholar] [CrossRef]
- Zhou, Z.; Wang, L.; Chi, X.; Bao, J.; Yang, L.; Zhao, W.; Chen, Z.; Wang, X.; Chen, X.; Gao, J. Engineered iron-oxide-based nanoparticles as enhanced T1 contrast agents for efficient tumor imaging. ACS Nano 2013, 7, 3287–3296. [Google Scholar] [CrossRef]
- Shin, T.; Choi, Y.; Kim, S.; Cheon, J. Recent advances in magnetic nanoparticle-based multi-modal imaging. Chem. Soc. Rev. 2015, 44, 4501–4516. [Google Scholar] [CrossRef]
- Vangijzegem, T.; Stanicki, D.; Boutry, S.; Paternoster, Q.; Vander Elst, L.; Muller, R.N.; Laurent, S. VSION as high field MRI T1 contrast agent: Evidence of their potential as positive contrast agent for magnetic resonance angiography. Nanotechnology 2018, 29, 1–14. [Google Scholar] [CrossRef]
- Laurent, S.; Forge, D.; Port, M.; Roch, A.; Robic, C.; Vander Elst, L.; Muller, R.N. Magnetic iron oxide nanoparticles: Synthesis, stabilization, vectorization, physicochemical characterizations, and biological applications. Chem. Rev. 2008, 108, 2064–2110. [Google Scholar] [CrossRef]
- Laird, T. How to minimise scale up difficulties. Chem. Ind. Dig. 2010, 23, 51–56. [Google Scholar]
- Makgwane, P.R.; Ray, S.S. Synthesis of nanomaterials by continuous-flow microfluidics: A review. J. Nanosci. Nanotechnol. 2014, 14, 1338–1363. [Google Scholar] [CrossRef] [PubMed]
- Fanelli, F.; Parisi, G.; Degennaro, L.; Luisi, R. Contribution of microreactor technology and flow chemistry to the development of green and sustainable synthesis. Bellstein J. Org. Chem. 2017, 13, 520–542. [Google Scholar] [CrossRef] [PubMed]
- Roch, A.; Muller, R.N.; Gillis, P. Theory of proton relaxation induced by superparamagnetic particles. J. Chem. Phys. 1999, 110, 5403–5411. [Google Scholar] [CrossRef]
- Roch, A.; Gossuin, Y.; Muller, R.N.; Gillis, P. Superparamagnetic colloid suspensions: Water magnetic relaxation and clustering. J. Magn. Mag. Mater. 2005, 293, 532–539. [Google Scholar] [CrossRef]
- Hannecart, A.; Stanicki, D.; Vander Elst, L.; Muller, R.N.; Brûlet, A.; Sandre, O.; Schatz, C.; Lecommandoux, S.; Laurent, S. Embedding of superparamagnetic iron oxide nanoparticles into membranes of well-defined poly(ethylene oxide)-block-poly(ε-caprolactone) nanoscale magnetovesicles as ultrasensitive MRI probes of membrane bio-degradation. J. Mat. Chem. B 2019, 7, 4692–4705. [Google Scholar] [CrossRef]
- Boutry, S.; Forge, D.; Burtea, C.; Mahieu, I.; Murariu, O.; Laurent, S.; Vander Elst, L.; Muller, R.N. How to quantify iron in an aqueous or biological matric: A technical note. Contrast Media Mol. Imaging 2009, 4, 299–304. [Google Scholar] [CrossRef]
- Chantrell, R.W.; Popplewell, J.; Charles, S.W. Measurements of particle size distribution parameters in ferrofluids. IEEE Trans. Magn. 1978, 14, 975–977. [Google Scholar] [CrossRef]
- Ivanov, A.O.; Kantorovich, S.S.; Reznikov, E.N.; Holm, C.; Pshenichnikov, A.F.; Lebedev, A.V.; Chremos, A.; Camp, P.J. Magnetic properties of polydisperse ferrofluids: A critical comparison between experiment, theory, and computer simulation. Phys. Rev. 2007, 75, 1–12. [Google Scholar] [CrossRef]
- Cogoni, G.; Grosso, M.; Baratti, R.; Romagnoli, J.A. Time evolution of the PSD in crystallisation operations: An analytical solution based on Ornstein-Ulhenbeck process. AIChE 2012, 58, 3731–3739. [Google Scholar] [CrossRef]
- Scherrer, P. Bestimmung der Größe und der inneren Struktur von Kolloidteilchen mittels Röntgenstrahlen. Gottingen. Math. Phys. Kl. 1918, 2, 98–100. [Google Scholar]
- Kwon, S.G.; Piao, Y.; Park, J.; Angappane, S.; Jo, Y.; Hwang, N.; Park, J.; Hyeon, T. Kinetics of monodisperse iron oxide nanocrystal formation by “heating-up” process. J. Am. Chem. Soc. 2007, 129, 12571–12584. [Google Scholar] [CrossRef]
- Donegá, C.; Liljeroth, P.; Vanmaekelbergh, D. Physicochemical evaluation of the hot-injection method, a synthesis route for monodisperse nanocrystals. Nanocrystals 2005, 12, 1152–1162. [Google Scholar]
- Van Embden, J.; Chesman, A.S.R.; Jasienak, J.J. The heat-up synthesis of colloidal nanocrystals. Chem. Mater. 2015, 27, 2246–2285. [Google Scholar] [CrossRef]
- Lamer, V.K.; Dinegar, R.H. Theory, production and mechanism of formation of monodispersed hydrosols. J. Am. Chem. Soc. 1950, 72, 4847–4854. [Google Scholar] [CrossRef]
- Stanicki, D.; Vander Elst, L.; Muller, R.N.; Laurent, S. Synthesis and processing of magnetic nanoparticles. Curr. Op. Chem. Eng. 2015, 8, 7–14. [Google Scholar] [CrossRef]
- Park, J.; An, K.; Hwang, Y.; Park, J.; Noh, H.; Kim, J.; Park, J.; Hwang, N.; Hyeon, T. Ultra-large-scale syntheses of monodisperse nanocrystals. Nat. Mater. 2004, 3, 891–895. [Google Scholar] [CrossRef]
- Baaziz, W.; Pichon, B.P.; Fleutot, S.; Liu, Y.; Lefevre, C.; Greneche, J.; Toumi, M.; Mhiri, T.; Begin-Colin, S. Magnetic iron oxide nanoparticles: Reproducible tuning of the size and nanosized-dependent composition, defects, and spin canting. J. Phys. Chem. C 2014, 118, 3795–3810. [Google Scholar] [CrossRef]
- Hou, Y.; Xu, Z.; Sun, S. Controlled synthesis and chemical conversions of FeO nanoparticles. Angew. Chem. 2007, 46, 6329–6332. [Google Scholar] [CrossRef]
- Harris, R.A.; Shumbula, P.M.; Van der Walt, H. Analysis of the interaction of surfactants oleic acid and oleylamine with iron oxide nanoparticles through molecular mechanics modeling. Langmuir 2015, 31, 3934–3943. [Google Scholar] [CrossRef]
- Qi, B.; Ye, L.; Stone, R.; Dennis, C.; Crawford, T.M.; Mefford, O.T. Influence of ligand-precursor molar ratio on the size evolution of modifiable iron oxide nanoparticles. J. Phys. Chem. C 2013, 117, 5429–5435. [Google Scholar] [CrossRef]
- Xu, Z.; Shen, C.; Hou, Y.; Gao, H.; Sun, S. Oleylamine as both reducing agent and stabilizer in a facile synthesis of magnetite nanoparticles. Chem. Mater. 2009, 21, 1778–1780. [Google Scholar] [CrossRef]
- Belaïd, S.; Stanicki, D.; Vander Elst, L.; Muller, R.; Laurent, S. Influence of experimental parameters on iron oxide nanoparticles properties synthesized by thermal decomposition: Size and nuclear magnetic resonance studies. Nanotechnology 2018, 29, 1–30. [Google Scholar] [CrossRef] [PubMed]
- Nightingale, A.M.; Krishnadasan, S.H.; Berhanu, D.; Niu, X.; Drury, C.; McIntyre, R.; Valsami-Jones, E.; DeMello, J.C. A stable droplet reactor for high temperature nanocrystal synthesis. Lab. Chip. 2011, 11, 1221–1227. [Google Scholar] [CrossRef] [PubMed]
- Jiao, M.; Zeng, J.; Jing, L.; Liu, C.; Gao, M. Flow synthesis of biocompatible Fe3O4 nanoparticles: Insight into the effects of residence time, fluid velocity, and tube reactor dimension on particle size distribution. Chem. Mater. 2015, 27, 1299–1305. [Google Scholar] [CrossRef]
- Estelrich, J.; Sánchez-Martin, M.J.; Busquets, M.A. Nanoparticles in magnetic resonance imaging: From simple to dual contrast agents. Int. J. Nanomed. 2015, 10, 1727–1741. [Google Scholar]
- Hashemi, R.H.; Bradley, W.G.; Lisanti, C.J. MRI: The Basics; Lippincott Williams & Wilkins: Philadelphia, PA, USA, 2004. [Google Scholar]
- Laurent, S.; Vander Elst, L.; Muller, R.N. Comparative study of the physicochemical properties of six clinical low molecular weight gadolinium contrast agents. Contrast Media Mol. Imaging 2006, 1, 128–137. [Google Scholar] [CrossRef]


| BPRA (psi) | 20 MHz | 60 MHz | ||
|---|---|---|---|---|
| r1 (s−1mM−1) | r2 (s−1mM−1) | r1 (s−1mM−1) | r2 (s−1mM−1) | |
| 5 | 0.5 | 0.7 | 0.6 | 1.2 |
| 20 | 1.4 | 1.9 | 1.5 | 3.3 |
| 40 | 3.7 | 5.3 | 3.7 | 8.8 |
| 75 | 3.6 | 5 | 3.7 | 8.6 |
| 100 | 3.6 | 5 | 3.7 | 8.6 |
| Capillary Inner Diameter (mm) | Flow Rate(mL·min−1) | Residence Time (min) | Diameter | NMRD Data | Relaxivity Measurements | ||||
|---|---|---|---|---|---|---|---|---|---|
| DPCS (nm) | DTEM (nm) | PDI | DNMRD (nm) | Ms (A·m²·kg−1) | r2/r1 (20 MHz) | r2/r1 (60 MHz) | |||
| 0.5 | 0.05 | 3.93 | 6.1 | 3.69 ± 0.81 | 1.16 | 6.82 | 38.4 | 1.58 | 2.42 |
| 0.5 | 0.1 | 1.96 | 6.2 | 3.70 ± 0.84 | 1.14 | 6.50 | 41.2 | 1.54 | 2.30 |
| 0.5 | 0.5 | 0.39 | 8.8 | 3.70 ± 0.92 | 1.15 | 7.18 | 25.4 | 1.45 | 2.26 |
| 0.5 | 1 | 0.20 | 6.6 | 3.61 ± 0.72 | 1.15 | 5.82 | 27 | 1.40 | 2.19 |
| 0.75 | 0.05 | 8.84 | 9.1 | 3.98 ± 1.00 | 1.23 | 7.34 | 41.6 | 1.57 | 2.63 |
| 0.75 | 0.1 | 4.42 | 8.8 | 3.84 ± 0.76 | 1.16 | 7.76 | 34.8 | 1.56 | 2.60 |
| 0.75 | 0.5 | 0.88 | 8.1 | 3.48 ± 0.76 | 1.20 | 7.28 | 31 | 1.56 | 2.53 |
| 0.75 | 1 | 0.44 | 6.8 | 3.40 ± 0.82 | 1.23 | 5.68 | 30.5 | 1.50 | 2.49 |
| 1 | 0.05 | 15.71 | 7.1 | 4.00 ± 0.94 | 1.19 | 7.52 | 44.8 | 1.63 | 2.55 |
| 1 | 0.1 | 7.85 | 9.5 | 4.02 ± 0.80 | 1.14 | 7.52 | 46.6 | 1.73 | 2.74 |
| 1 | 0.5 | 1.57 | 8.1 | 3.62 ± 0.74 | 1.17 | 6.70 | 39.8 | 1.58 | 2.48 |
| 1 | 1 | 0.79 | 7.7 | 3.73 ± 0.77 | 1.10 | 6.96 | 33.9 | 1.53 | 2.43 |
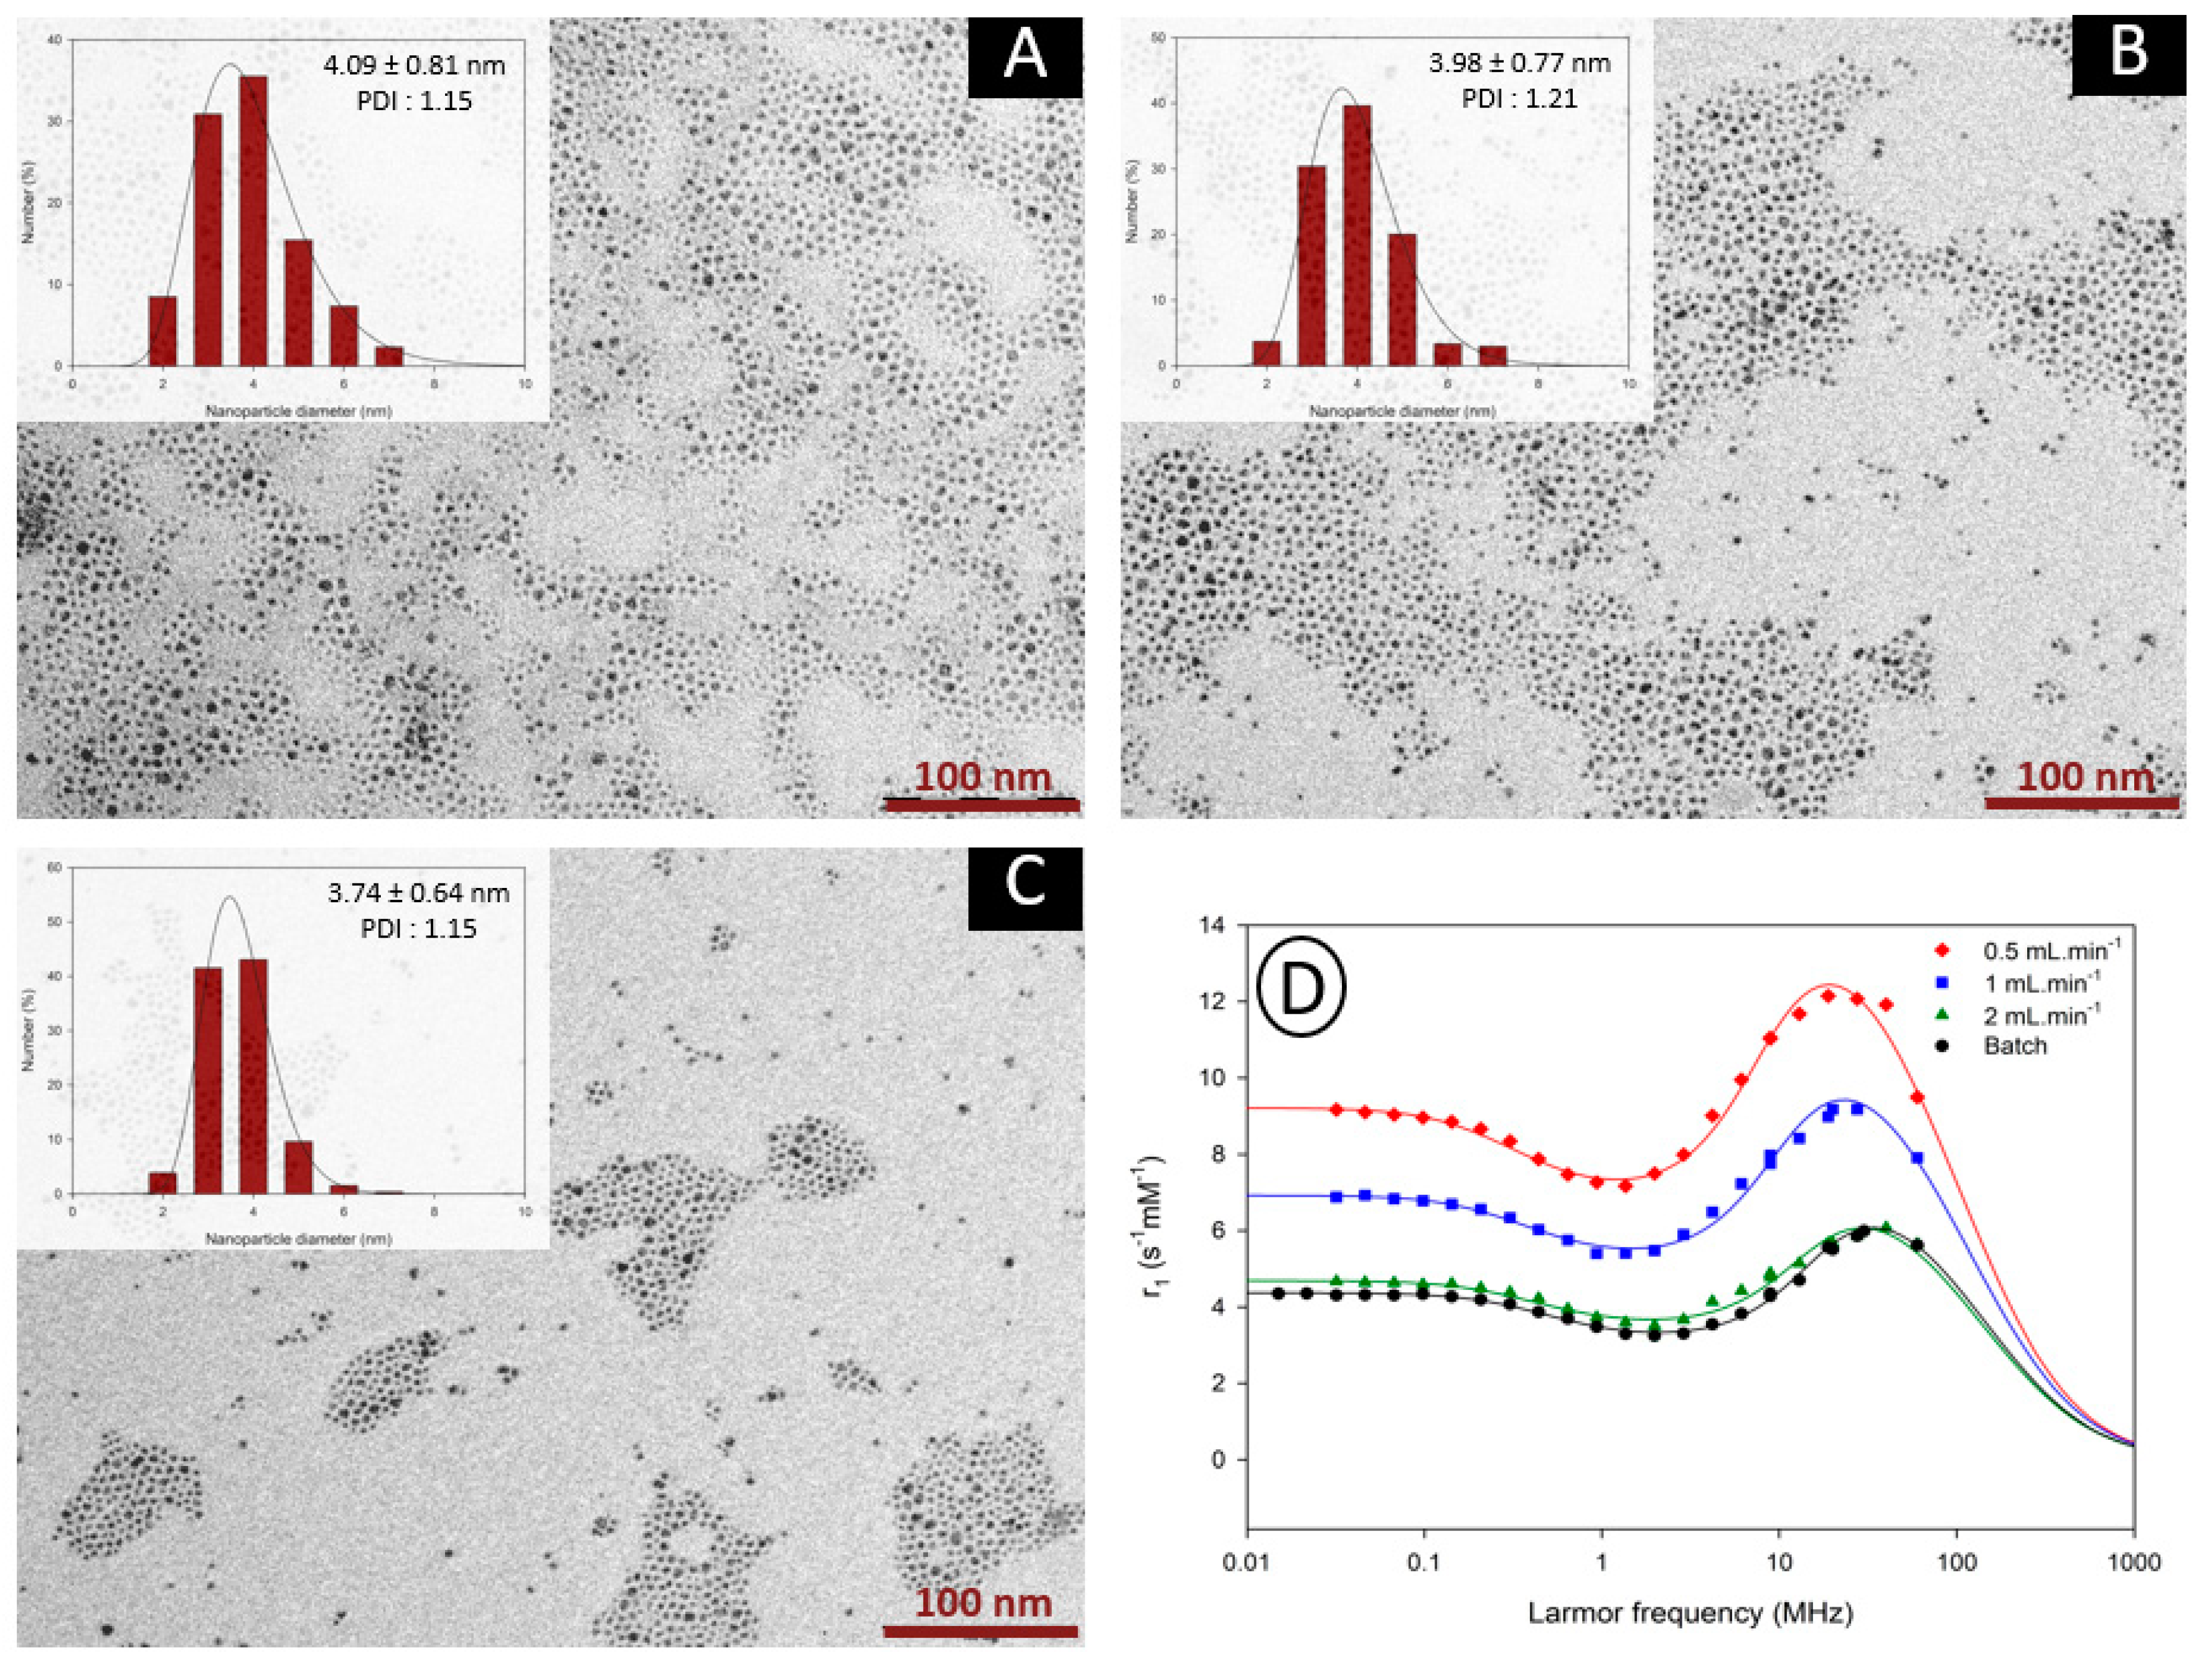
| 2.4 | 0.5 | 9 | 7.3 | 4.09 ± 0.81 | 1.15 | 7.44 | 47.3 | 1.84 | 2.69 |
| 2.4 | 1 | 4.5 | 9.3 | 3.98 ± 0.77 | 1.21 | 7.04 | 44.2 | 1.63 | 2.59 |
| 2.4 | 2 | 2.25 | 8.1 | 3.74 ± 0.64 | 1.15 | 6.62 | 38.6 | 1.51 | 2.46 |
| Flow Rate (mL·min−1) | Diameter | MSAT (emu/g) | ||
|---|---|---|---|---|
| DTEM (nm) | DVSM (nm) | DXRD (nm) | ||
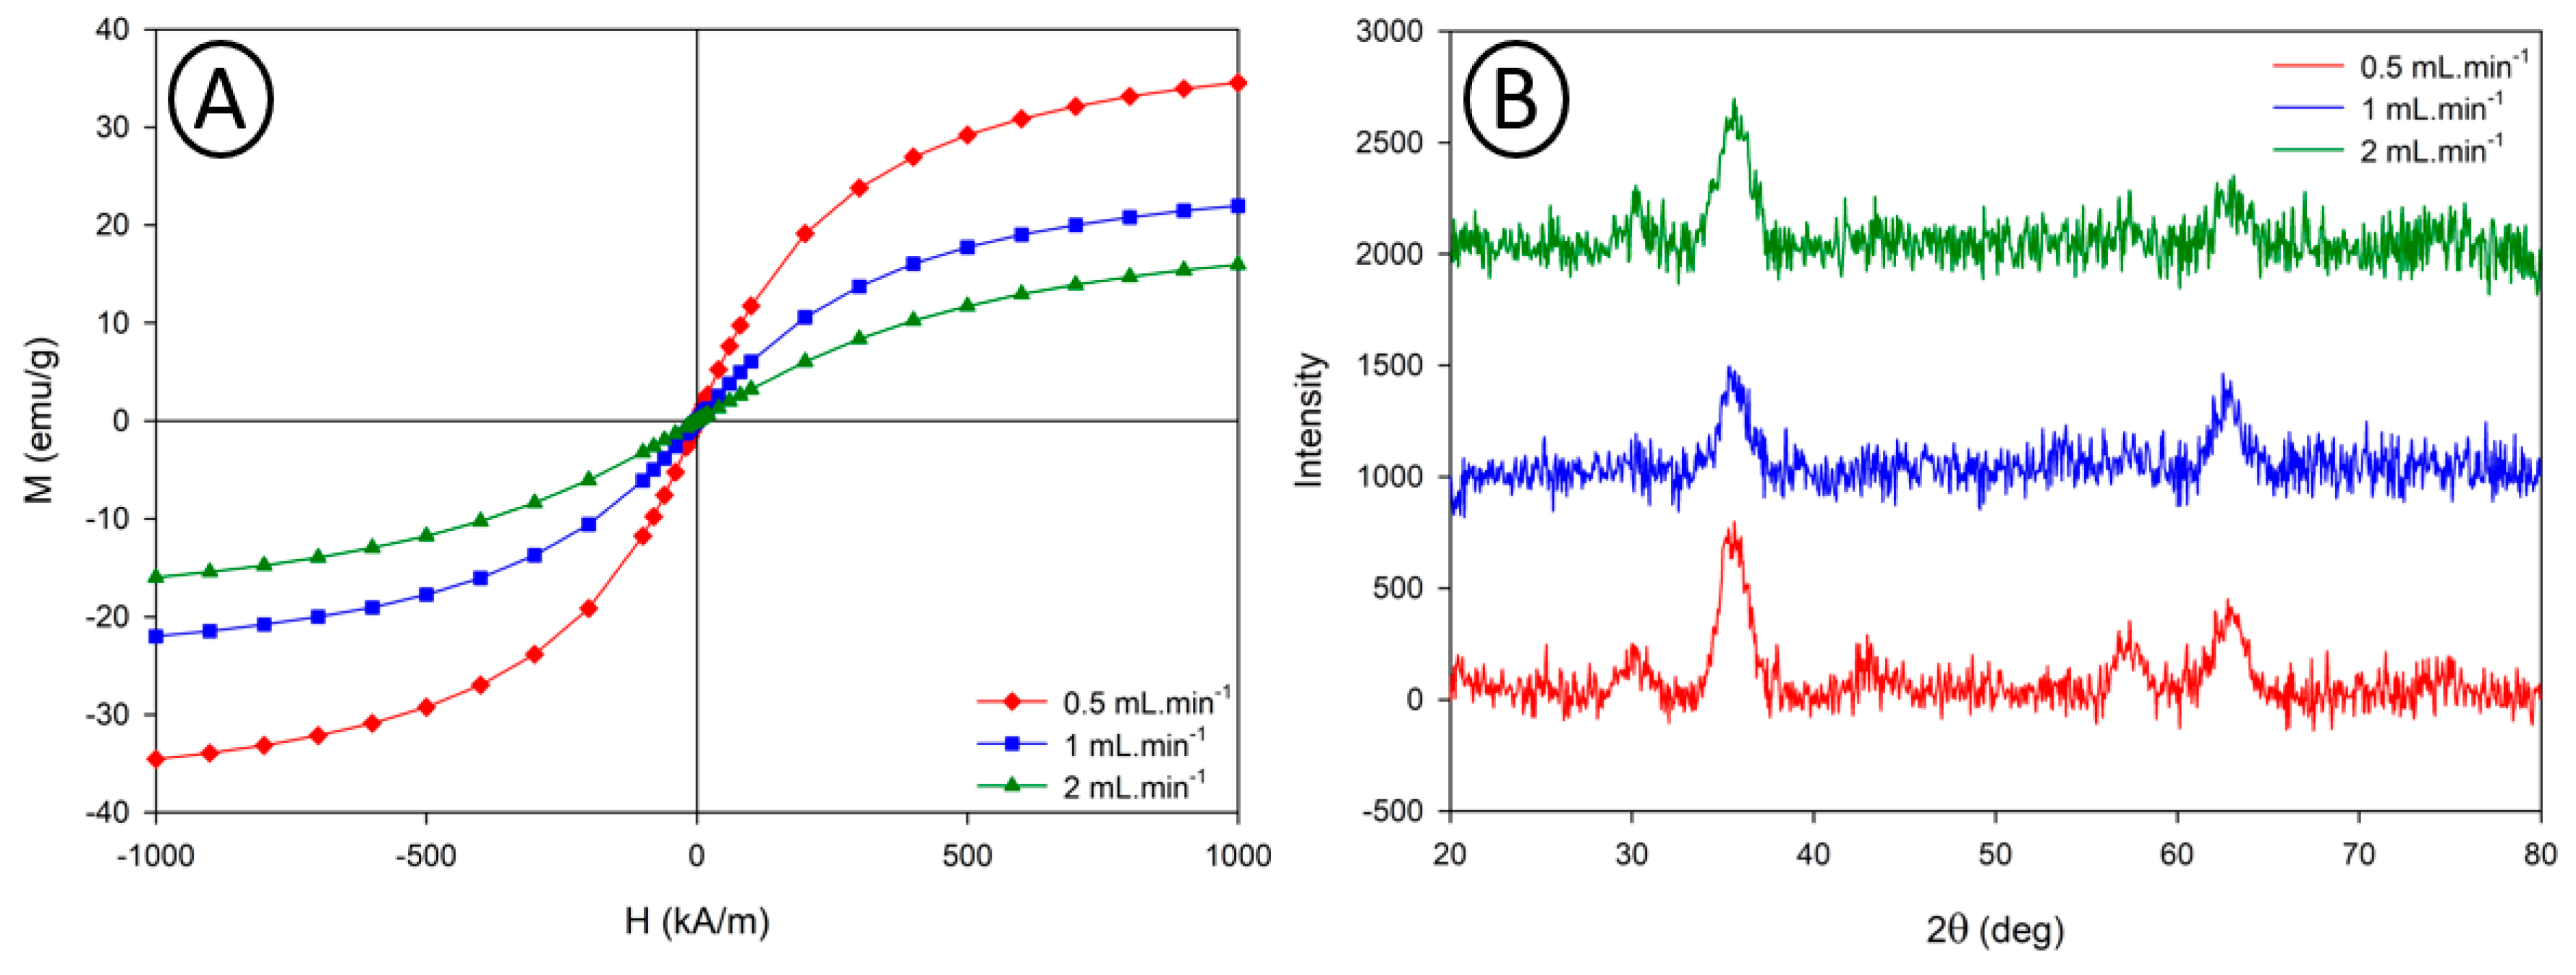
| 0.5 | 3.71 ± 0.76 | 4.16 ± 0.91 | 5.02 | 40.1 |
| 1 | 3.98 ± 0.77 | 3.90 ± 0.76 | 4.59 | 26.4 |
| 2 | 3.74 ± 0.64 | 3.51 ± 0.58 | 4.16 | 20.4 |
© 2020 by the authors. Licensee MDPI, Basel, Switzerland. This article is an open access article distributed under the terms and conditions of the Creative Commons Attribution (CC BY) license (http://creativecommons.org/licenses/by/4.0/).
Share and Cite
Vangijzegem, T.; Stanicki, D.; Panepinto, A.; Socoliuc, V.; Vekas, L.; Muller, R.N.; Laurent, S. Influence of Experimental Parameters of a Continuous Flow Process on the Properties of Very Small Iron Oxide Nanoparticles (VSION) Designed for T1-Weighted Magnetic Resonance Imaging (MRI). Nanomaterials 2020, 10, 757. https://doi.org/10.3390/nano10040757
Vangijzegem T, Stanicki D, Panepinto A, Socoliuc V, Vekas L, Muller RN, Laurent S. Influence of Experimental Parameters of a Continuous Flow Process on the Properties of Very Small Iron Oxide Nanoparticles (VSION) Designed for T1-Weighted Magnetic Resonance Imaging (MRI). Nanomaterials. 2020; 10(4):757. https://doi.org/10.3390/nano10040757
Chicago/Turabian StyleVangijzegem, Thomas, Dimitri Stanicki, Adriano Panepinto, Vlad Socoliuc, Ladislau Vekas, Robert N. Muller, and Sophie Laurent. 2020. "Influence of Experimental Parameters of a Continuous Flow Process on the Properties of Very Small Iron Oxide Nanoparticles (VSION) Designed for T1-Weighted Magnetic Resonance Imaging (MRI)" Nanomaterials 10, no. 4: 757. https://doi.org/10.3390/nano10040757
APA StyleVangijzegem, T., Stanicki, D., Panepinto, A., Socoliuc, V., Vekas, L., Muller, R. N., & Laurent, S. (2020). Influence of Experimental Parameters of a Continuous Flow Process on the Properties of Very Small Iron Oxide Nanoparticles (VSION) Designed for T1-Weighted Magnetic Resonance Imaging (MRI). Nanomaterials, 10(4), 757. https://doi.org/10.3390/nano10040757