Article

Alteration of the Mitochondrial Effects of Ceria Nanoparticles by Gold: An Approach for the Mitochondrial Modulation of Cells Based on Nanomedicine

by
Patricia Gutiérrez-Carcedo
1,2,
Sergio Navalón
3,
Rafael Simó
2,
Xavier Setoain
4,
Carolina Aparicio-Gómez
1,
Ibane Abasolo
5,
Victor Manuel Victor
6,7,
Hermenegildo García
3,* and
José Raúl Herance
1,*
1
Medical Molecular Imaging Research Group, Vall d’Hebron Research Institute, CIBBIM-Nanomedicine, Universitat Autònoma de Barcelona (UAB) and Biomedical Imaging Group, Biomedical Research Networking Center in Bioengineering, Biomaterials and Nanomedicine (CIBER-BBN), 08035 Barcelona, Spain
2
Diabetes and Metabolism Research Unit, Vall d’Hebron Research Institute, Department of Endocrinology, Vall d’Hebron Research Institute, UAB, Biomedical Research Center in Diabetes Network and Associated Metabolic Diseases (CIBERDEM), 08035 Barcelona, Spain
3
Deparment of Chemistry and Instiute of Chemical Technology (CSIC-UPV), Universitat Politècnica de València, 46022 Valencia, Spain
4
Hospital Clinic, Biophysics and Bioengineering Unit, Biomedicine Department, School of Medicine, University of Barcelona, and CIBER-BBN, 08036 Barcelona, Spain
5
Functional Validation & Preclinical Research (FVPR), Group of Drug Delivery & Targeting, CIBBIM-Nanomedicine, Vall d’Hebron Research Institute, UAB, CIBBER-BBN, 08035 Barcelona, Spain
6
Service of Endocrinology and Nutrition, University Hospital Doctor Peset, FISABIO, 46017 Valencia, Spain
7
CIBERehd, Department of Physiology, University of Valencia, 46010 Valencia, Spain
*
Authors to whom correspondence should be addressed.
Nanomaterials 2020, 10(4), 744; https://doi.org/10.3390/nano10040744
Submission received: 3 March 2020 / Revised: 4 April 2020 / Accepted: 8 April 2020 / Published: 13 April 2020

Abstract

:
Ceria nanoparticles are cell compatible antioxidants whose activity can be enhanced by gold deposition and by surface functionalization with positive triphenylphosphonium units to selectively target the mitochondria. The antioxidant properties of these nanoparticles can serve as the basis of a new strategy for the treatment of several disorders exhibiting oxidative stress, such as cancer, diabetes or Alzheimer’s disease. However, all of these pathologies require a specific antioxidant according with their mechanism to remove oxidant species excess in cells and diminish their effect on mitochondrial function. The mechanism through which ceria nanoparticles neutralize oxidative stress and their effect on mitochondrial function have not been characterized yet. In the present study, the mitochondria antioxidant effect of ceria and ceria-supported gold nanoparticles, with or without triphenylphosphonium functionalization, was assessed in HeLa cells. The effect caused by ceria nanoparticles on mitochondria function in terms of mitochondrial membrane potential (∆Ψm), adenosine triphosphate (ATP) production, nuclear respiratory factor 1 (NRF1) and nuclear factor erythroid–2–like 1 (NFE2L1) was reversed by the presence of gold. Furthermore, this effect was enhanced when nanoparticles were functionalized with triphenylphosphonium. Our study illustrates how the mitochondrial antioxidant effect induced by ceria nanoparticles can be modulated by the presence of gold.

1. Introduction

The use of nanoparticles (NPs) in biomedicine continues to be a rapidly growing research field due to their powerful applications in medicine. Different types of NPs have been proposed for various biomedical applications such as drug delivery, bioimaging, thermotherapy and antioxidant therapy [1,2,3,4,5]. Furthermore, NPs can be functionalized to recognize specific biological targets, improving their effect; for example, triphenylphosphonium (TPP) and anti-HER2 can be used to target mitochondria [6,7] or specific tumor cells [8], respectively. Among all types of NPs proposed for biomedical applications, ceria NPs (CeO2) are among the most promising due to their physicochemical properties, versatility and biocompatibility [9].
CeO2 is a well-established antioxidant agent in biomedicine [10,11]. The antioxidant properties of CeO2 can be enhanced when it is combined with certain metals such as gold, silver or platinum [12,13,14,15,16], which have been proposed as biocompatible materials acting as radical scavengers and catalase-like enzymes to treat oxidative stress (OS) [14,17,18,19,20]. Furthermore, it has been suggested that CeO2 NPs, alone or in combination with metals, protect against radiation and have beneficial effects on different pathologies such as dementia and infection [21,22,23,24,25]. In addition, CeO2 can be functionalized with TPP to target CeO2 to the mitochondria, increasing its antioxidant behavior in cells [7].
Mitochondria are cellular organelles that play key physiological roles in cells, and are the major source of OS, as they generate a high amount of reactive oxygen species (ROS) when they do not work properly. OS is a pathological process generated by an imbalance between ROS and antioxidants, and it is associated with several disorders such as diabetes, obesity, stroke, Parkinson’s disease, Alzheimer’s disease, Friedrich’s ataxia and cancer [26,27]. Thus, OS is considered a therapeutic target to treat multiple diseases [28] since the overproduction of ROS causes oxidative damage to DNA, lipids, proteins and other biomolecules, altering their function and constituting the origin of different diseases [26,29,30,31]. The reduction of ROS overproduction in the mitochondria is orchestrated endogenously by different antioxidant systems such as the nuclear respiratory factor (NRF), composed of nuclear respiratory factor 1 (NRF1) and nuclear factor erythroid 2-related factor 1 (NFE2L1), which are related to mitochondria efficiency and the expression of endogenic antioxidant defenses, respectively [32]. The reduction of ROS can also be achieved by decreasing exposure to environmental oxidant pollutants, increasing the levels of exogenous and/or endogenous antioxidants, stabilizing the mitochondrial energy production and efficiency or using mitochondrial uncouplers [33]. Diseases with OS needed to be treated with specific antioxidants, taking into account their cellular action mechanism, mainly by determining the influence on the mitochondria function as the main ROS source. Although widespread, the use of antioxidants to prevent oxidative stress can often yield inconclusive or contradictory results due to insufficient understanding of their mode of action and their effect on mitochondrial function [16,34,35]. This is the case with several NPs that have been proposed as antioxidants in preclinical studies, for which a lack of knowledge regarding their mitochondrial action mechanism has inevitably hampered their clinical translation [36].
In this study, the effect on the mitochondrial function of CeO2-supported gold (AuCeO2) conjugated (or not) to TPP groups (TPP–AuCeO2) was assessed. The aim of this work is to shed light on the mitochondrial effect of these NPs, and thus, to determine their utility for therapeutic purposes.

2. Materials and Methods

2.1. Synthesis and Characterization of NPs

2.1.1. Preparation of 3–Iodopropyl-Functionalized AuCeO2 (I–AuCeO2)

CeO2 and AuCeO2 were prepared following the methodology previously described by our group [20,37]. To obtain I–AuCeO2, AuCeO2 was silylated by stirring a suspension of dried AuCeO2 (314.5 mg) in 6 mL of an anhydrous toluene (Sigma-Aldrich, Madrid, Spain) solution containing 3–(iodopropyl)trimethoxysilane (61 mg, 0.34 mmol) (Sigma-Aldrich, Madrid, Spain) for 3 h at 85 °C. Afterwards, the mixture was allowed to cool at room temperature. Then, I–AuCeO2 was filtered and sequentially washed with toluene (3 × 100 mL), acetone (3 × 100 mL) and diethyl ether (2 × 100 mL) (all solvents from Sigma-Aldrich, Madrid, Spain), and later allowed to dry at room temperature under reduced pressure. The material was obtained as a brown solid, and the presence of iodopropyl groups was determined by FT-IR spectroscopy (Jasco FT-IR-460 PLUS, Easton, MD, USA), while the content of C was determined by chemical combustion analysis in a FISONS CHNOS analyzer (Fisons EA-1108-CHNS-O, Milano, Italy).

2.1.2. Preparation of Triphenylphosphonium-Functionalized AuCeO2 (TPP–AuCeO2)

One hundred seventy-five milligrams of I–AuCeO2 were suspended in 6 mL anhydrous toluene (Sigma-Aldrich, Madrid, Spain), and then triphenylphosphine (60 mg, 0.23 mmol) (Sigma-Aldrich, Madrid, Spain) was added to this mixture. The suspension was flushed with an argon stream (1 mL/min) (Linde, Barcelona, Spain) for 10 min, and heated at reflux temperature under magnetic stirring. Then, the system was cooled to room temperature and the resulting solid was recovered by filtration and washed sequentially with toluene (3 × 100 mL), acetone (3 × 100 mL) and diethyl ether (2 × 50 mL) (all solvents from Sigma-Aldrich, Madrid, Spain). The resulting TPP–AuCeO2 solid was dried at room temperature under reduced pressure. TPP–AuCeO2 was characterized by FT-IR spectroscopy, transmission electron microscopy (TEM) (JEM-2100F, Peabody, MA, USA), dynamic light scattering (DLS) using Zetasizer Nano ZS (Malvern Instrument, Malvern, UK) and nuclear magnetic resonance spectroscopy (NMR) (Varian Gemini 3000, Palo Alto, CA, USA).

2.2. Cell Culture

Experiments were performed with the human cervical carcinoma cell line, HeLa cells, (ATCC® CCL-2™, Manassas, VA, USA). Cells were cultured in DMEM supplemented with 10% heat-inactivated FBS, penicillin (50 U/mL) and streptomycin (50 mg/mL) (all components were from Thermo Fisher Scientific, Sant Cugat del Vallés, Spain) and incubated at 37 °C and 5% CO2 in a humidified atmosphere.

2.2.1. Cellular Viability and Proliferation

HeLa cells were seeded on 96-well plates (Scharlab, Sentmenat, Spain) at 35,000 cells/well. After 24 h, cells were incubated in the presence of CeO2, AuCeO2 or TPP–AuCeO2 at 10 and 20 µg/mL for 24, 48 and 72 h. Afterwards, cellular viability and proliferation were determined following the manufacturer’s protocol using an MTT Cell Assay Kit (Merck Millipore, Madrid, Spain)). Finally, the absorbance at 590 nm was measured using a Synergy Mx plate-reader spectrophotometer (BioTek Instruments, Winooski, VT, USA). Following the manufacturer’s protocol, controls were performed using a reference cell culture media with and without cells. An additional control with NPs at 1 μg/mL in cell culture media as also used. This NP concentration was chosen considering that commonly, less than 5% of NPs present in a cell culture media become internalized in the cultured cells [38].

2.2.2. Cellular Uptake and Internalization of Conjugate by Confocal Microscopy

HeLa cells were seeded at 8 × 10⁵ per dish in Nunc™ Glass culture dishes (Thermo Fisher Scientific, Sant Cugat del Vallés, Spain). After 24 h, different NPs (AuCeO2 or TPP–AuCeO2) at 20 µg/mL were added and incubated for 24 h (37 °C, 5% CO2 atmosphere (Linde, Barcelona, Spain)). Nuclei (Hoechst 33342 dye, 1:20,000, blue) (Life Technologies, Madrid, Spain), cell membrane (CellMaskTM, 1:10,000, green) (Life Technologies, Madrid, Spain), and mitochondria (MitoTracker™, 1:2,000, red) (Thermo Fisher Scientific, Sant Cugat del Vallés, Spain) were stained following the manufacturer’s protocol [39,40]. Fluorescence images were obtained in vivo using a FV1000-spectral confocal microscope (Olympus, Hamburg, Germany). Samples were maintained at 37 °C under 5% CO2 atmosphere during imaging and were illuminated simultaneously with laser light at 405 nm (exciting Hoechst, blue), 488 nm (exciting CellMask, green), and 561 nm (exciting MitoTracker, red), recording the emission from 425 to 603 nm in separate channels. The reflection signal of NPs was split by using a dichroic mirror (20/40) after irradiating at 633 nm. A Z-Stack study across the depth of the cells was performed with an interslice distance of 400 nm [41,42]. The Fiji image analysis software was used to analyze the images [43].

2.2.3. Measurement of the Mitochondrial O2 Consumption

HeLa cells were treated with NPs for 24 h, resuspended (5 × 10⁶ cells/mL) in Hank’s Balanced Salt Solution (HBSS) (GIBCO, Thermo Fisher Scientific, Sant Cugat del Vallés, Spain) and then placed in a gas-tight chamber, and O2 consumption was measured with a Clark-type O2 electrode (Rank Brothers, (Bottisham, UK). Sodium cyanide (10−3 M) was used to confirm whether the O2 consumption was mainly mitochondrial (95–99%) or not. The O2 consumption rate was calculated as nmol/min/106 cells and expressed as a percentage of the untreated control.

2.2.4. Measurement of Mitochondrial Membrane Potential (∆Ψm) and Total ROS Production

Cells were seeded in 48-well plates, and after 24 h, they were treated with the NPs in cell culture media at a concentration of 20 µg/mL for 24 h. ∆Ψm and total ROS were assessed by fluorescence microscopy (IX81 Olympus, Hamburg, Germany) after 30 min incubation in HBSS (GIBCO, Thermo Fisher Scientific, Sant Cugat del Vallés, Spain) with fluorescent probes 5 × 10⁻⁶ mol/L tetramethylrhodamine methyl ester (TMRM) and 2’7’–dichlorodihydrofluorescein diacetate (DCFH–DA), and Hoechst 33342 (all probes from Sigma-Aldrich, Madrid, Spain). Cells were washed twice with HBSS and a total of 16–25 images per well were recorded with the fluorescence microscope. The fluorescence signal in individual cells was recorded with a fluorescence microscope coupled with static cytometry software (“ScanR” version 2.03.2, IX81 Olympus). Controls were performed using HBSS, cells in HBSS and NPs solved in HBSS at 1 μg/mL.

2.2.5. ATP Determination

HeLa cells were grown in 96-well black plates and cultured for 48 h (37 °C, 5% CO2 atmosphere). Then, the cells were conditioned for 24 h in DMEM media (GIBCO, Thermo Fisher Scientific, Sant Cugat del Vallés, Spain) before treating them with the NPs (20 µg/mL). ATP measurements in cells treated and untreated with NPs were determined in triplicate by bioluminescence methodology following the manufacturer’s protocol (ATP determination Kit, ThermoFisher Scientific, Sant Cugat del Valles, Spain ) using a luminometer Synergy Mx plate reader fluorometer (BioTek Instruments, Winooski, VT, USA). Briefly, cells were washed with HBSS and 60 µL of assay buffer were added to each well. Then, 15 µL of luciferase buffer (8 ng/mL of luciferase) and 25 µL of D–luciferin buffer (2 mM of D–luciferin) was added to each well with an automatic injector, and the luminescence of each well was read in a luminometer before and after D-luciferin addition. Once the background luminescence was subtracted from each well, ATP measurements in cells treated with NPs were referred to those of the nontreated control cells. ATP assays were performed within the U20/FVPR of ICTS Nanbiosis.

2.2.6. Real-Time PCR

Total RNA was extracted from cell pools after treatment with the NPs using the RNA isolation kit, following the manufacturer’s protocol (Sigma-Aldrich, Madrid, Spain). The concentration and purity of the RNA were assessed by measuring the 260/280 ratio and 260/ 230 ratio using NanoDrop™ 2000 (Thermo Fisher Scientific, Waltham, MA, USA). Briefly, 1 μg of RNA was used to synthesize cDNA with the help of a kit (Thermo Scientific, Rockford, IL, USA) and the cDNA obtained was employed for RT-PCR analysis (7500 Fast RT-PCR system, Life technologies, Camarillo, CA, USA). Expression of NRF1 and NFE2L1 was assessed using SYBR Select Master Mix (Applied Biosystems, Beverly, MA, USA). GAPDH gene (Sigma-Aldrich, Madrid, Spain) expression was used as the endogenous control. The following primer (Sigma-Aldrich, Madrid, Spain) sequences were employed:
NRF1, 5’-CGGGACAGAGTCACCATTTGA-3’ and 3’-GGGGCACTGTACAGGATTTCA-5’ NFE2L1, 5’-CGGGACAGAGTCACCATTTGA-3’ and 3’-GGGGCACTGTACAGGATTTCA-5´ GAPDH, 5’-CGCATCTTCTTTTGCGTCG-3’ and 3’-TTGAGGTCAATGAAGGGGTCA-5’. Relative quantification was performed according to the comparative 2−ΔΔCt method.

2.2.7. Western Blot

Total protein extracts from HeLa cells were obtained after lysis with cold RIPA buffer containing proteases inhibitor cocktail (cOmplete™, Mini, EDTA-free Protease Inhibitor Cocktail, (Merck Madrid, Spain). Protein concentration was quantified using a BCA protein assay kit (Thermo Fisher Scientific, Sant Cugat del Vallés, Spain) [44]. 40 µg of protein was used in SDS-PAGE and then transferred to PVDF membranes and incubated with primary antibodies. NRF1 and NFE2L1 antibodies (both polyclonal with human reactivity and rabbit as biological source; Sigma-Aldrich, Madrid, Spain) were incubated overnight at 4 °C with a dilution 1/1000, followed by the secondary anti-Rabbit antibody for 1 h at room temperature with a dilution 1/25000. β-Actin (monoclonal with human reactivity and mouse as biological source Sigma-Aldrich, Madrid, Spain) was used as the housekeeping protein. Finally, detection was performed with ECL (GE Healthcare Life science, Sheffield, UK) using ImageQuant LAS 4000 (GE Healthcare, Uppsala, Sweden). Signals were quantified using ImageJ software (version 1.51u, Bethesda, MD, USA).

2.3. Statistical Analysis

The data obtained in this study are presented as the mean ± standard error of the mean (SEM). Statistical analysis was performed using Prism 6 statistical software (GraphPad Software, Version 6.01, Prism, San Diego, CA, USA). One-way analysis of variance (ANOVA) followed by Tukey-Kramer test to evaluate the significant differences between groups were performed. Values of p-value of < 0.05 are indicated as * and < 0.01 as **.

3. Results

3.1. Synthesis and Characterization of Nanoparticles

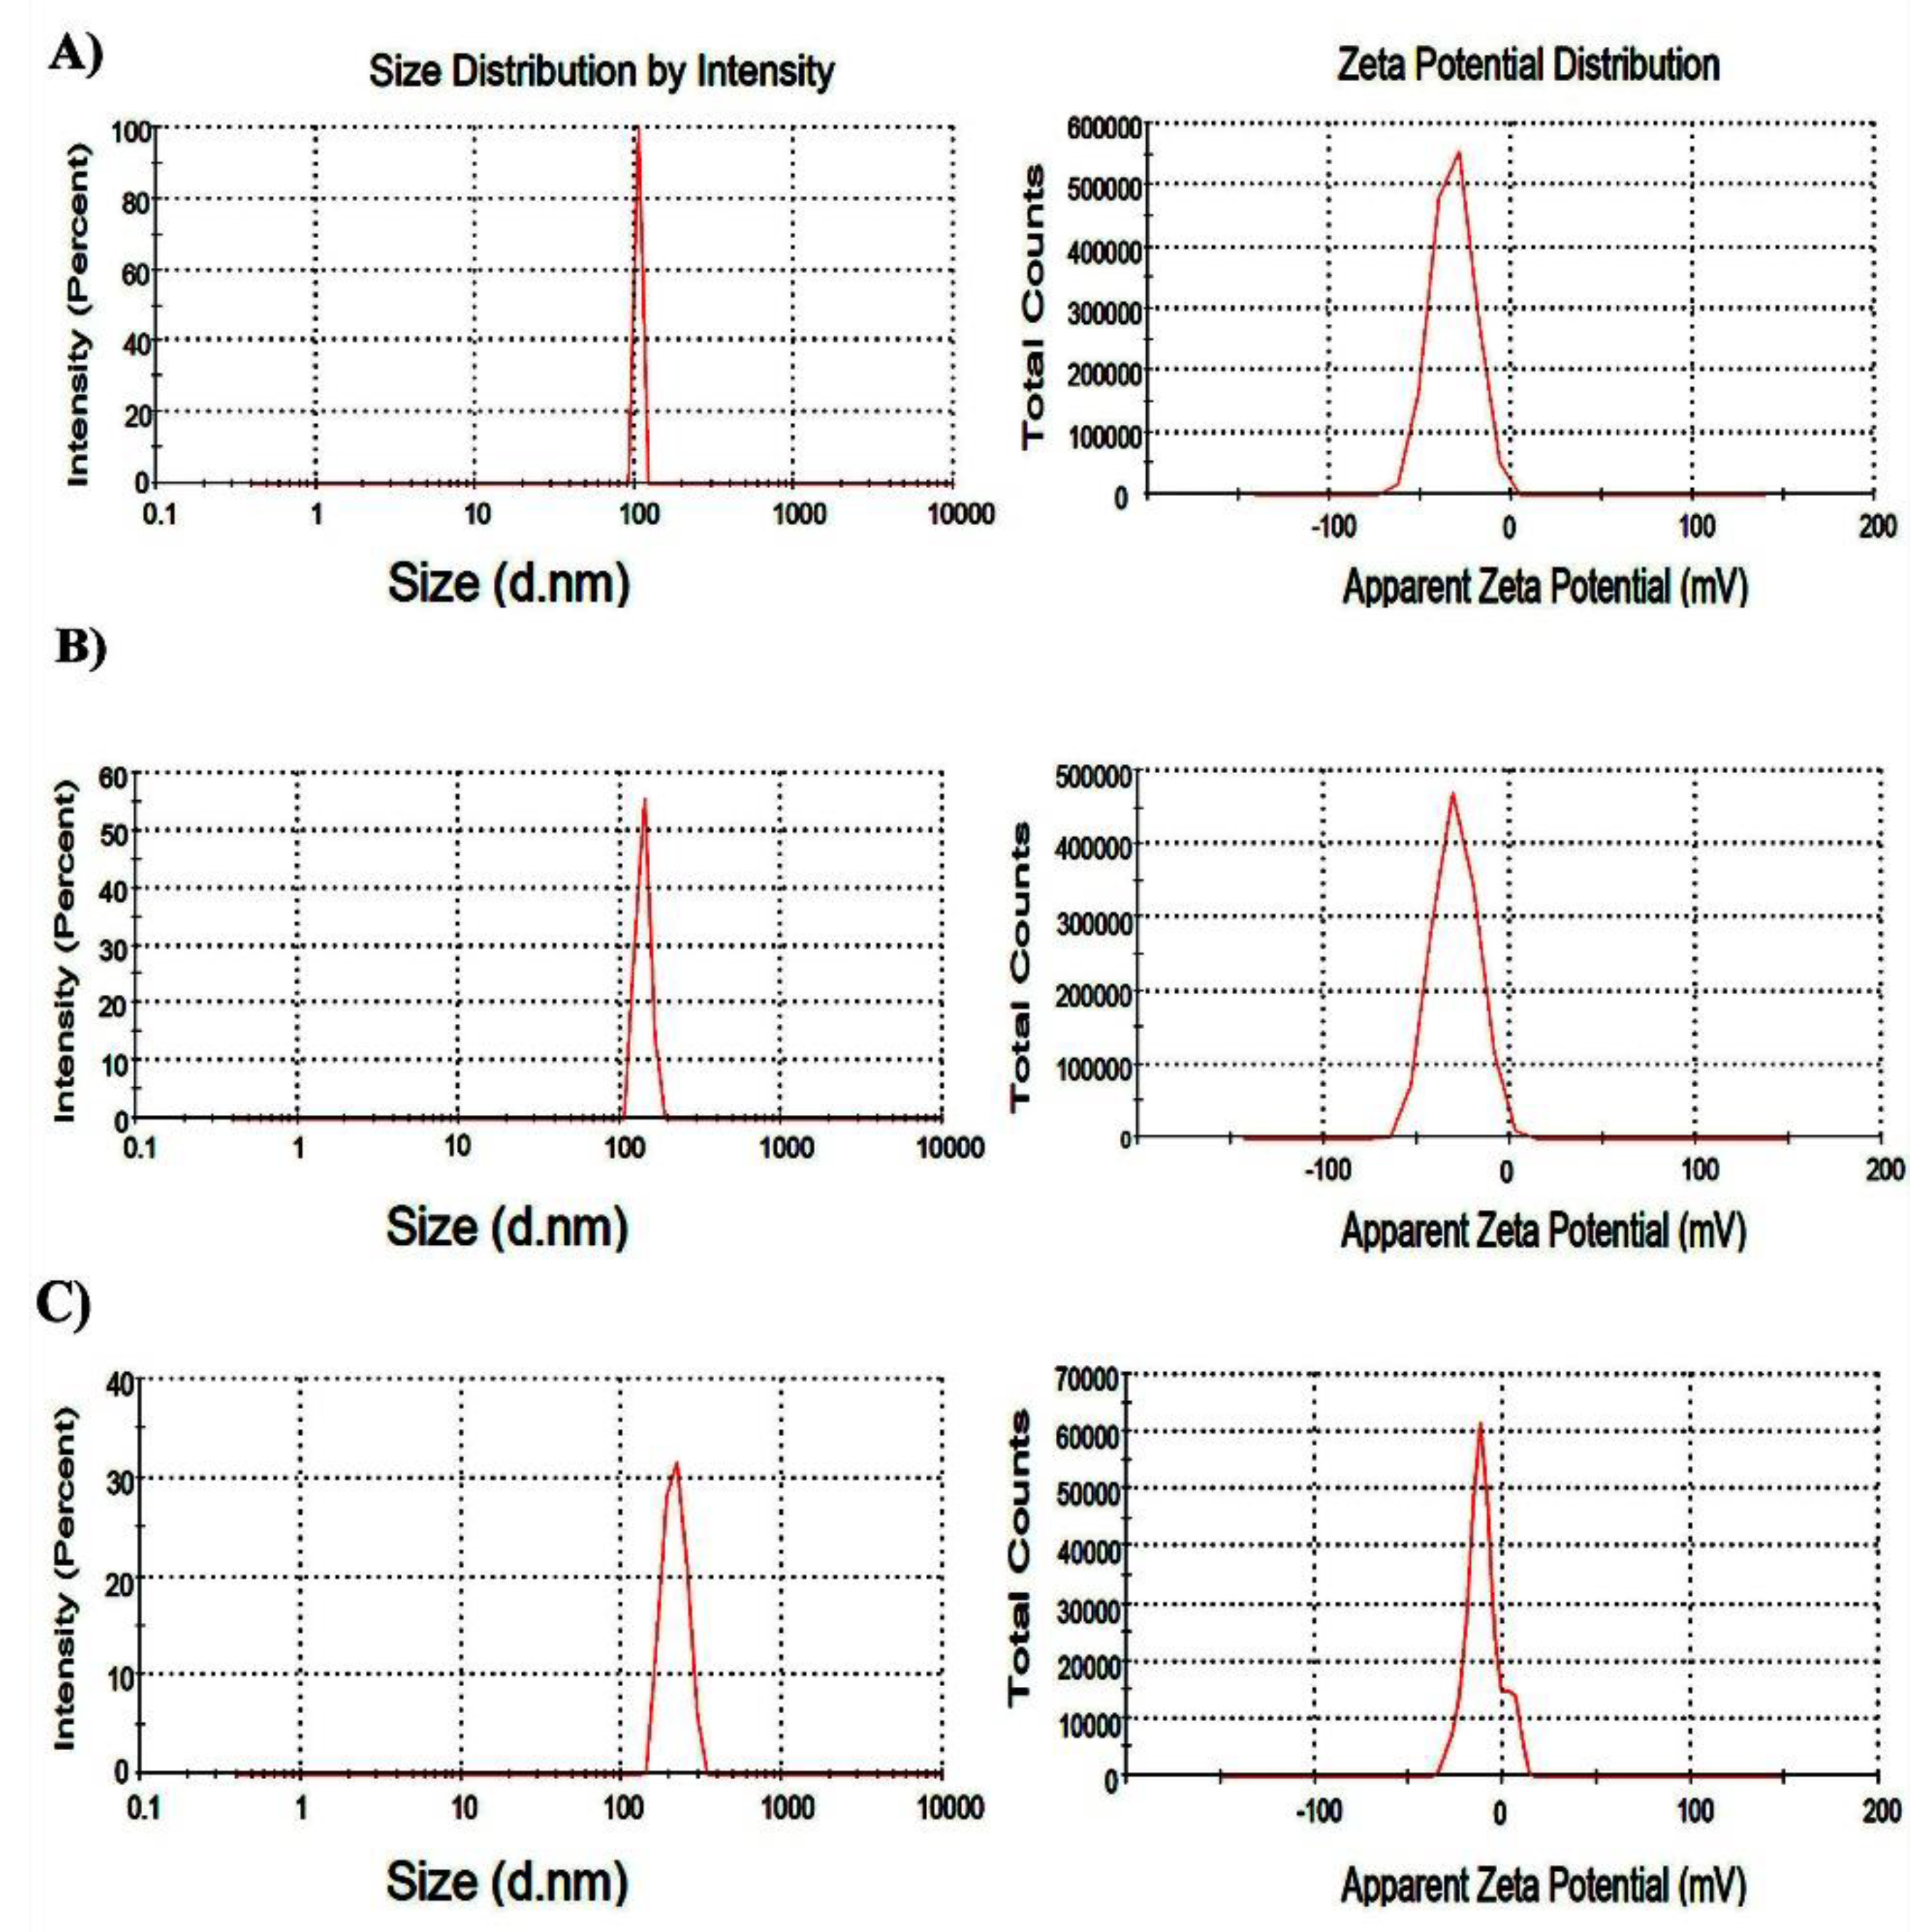
AuCeO2 and TPP–AuCeO2 were synthesized from CeO2 according the synthetic route shown in Scheme 1. For this purpose, colloidal CeO2 were prepared by hydrolysis of Ce4+, following previous reports [20]. Figure S1a shows the characteristic X-ray diffraction peaks of CeO2 nanoparticles. The FT-IR spectrum of CeO2 was recorded and the vibrations bands appearing at about 500 cm−1 and 3300 cm-1 were attributed to the vibrations of Ce–O and –OH, respectively (Figure 1). The surface area measured by isothermal N2 adsorption was 180 m2 g−1 and the average particle size of CeO2 measured by TEM was 5.2 ± 0.3 nm (Figure S1b) (average of ~100 NPs). The hydrodynamic size and zeta potential of the NPs measured by DLS were 105.7 nm and −32.1 mV, respectively (Figure 2A).
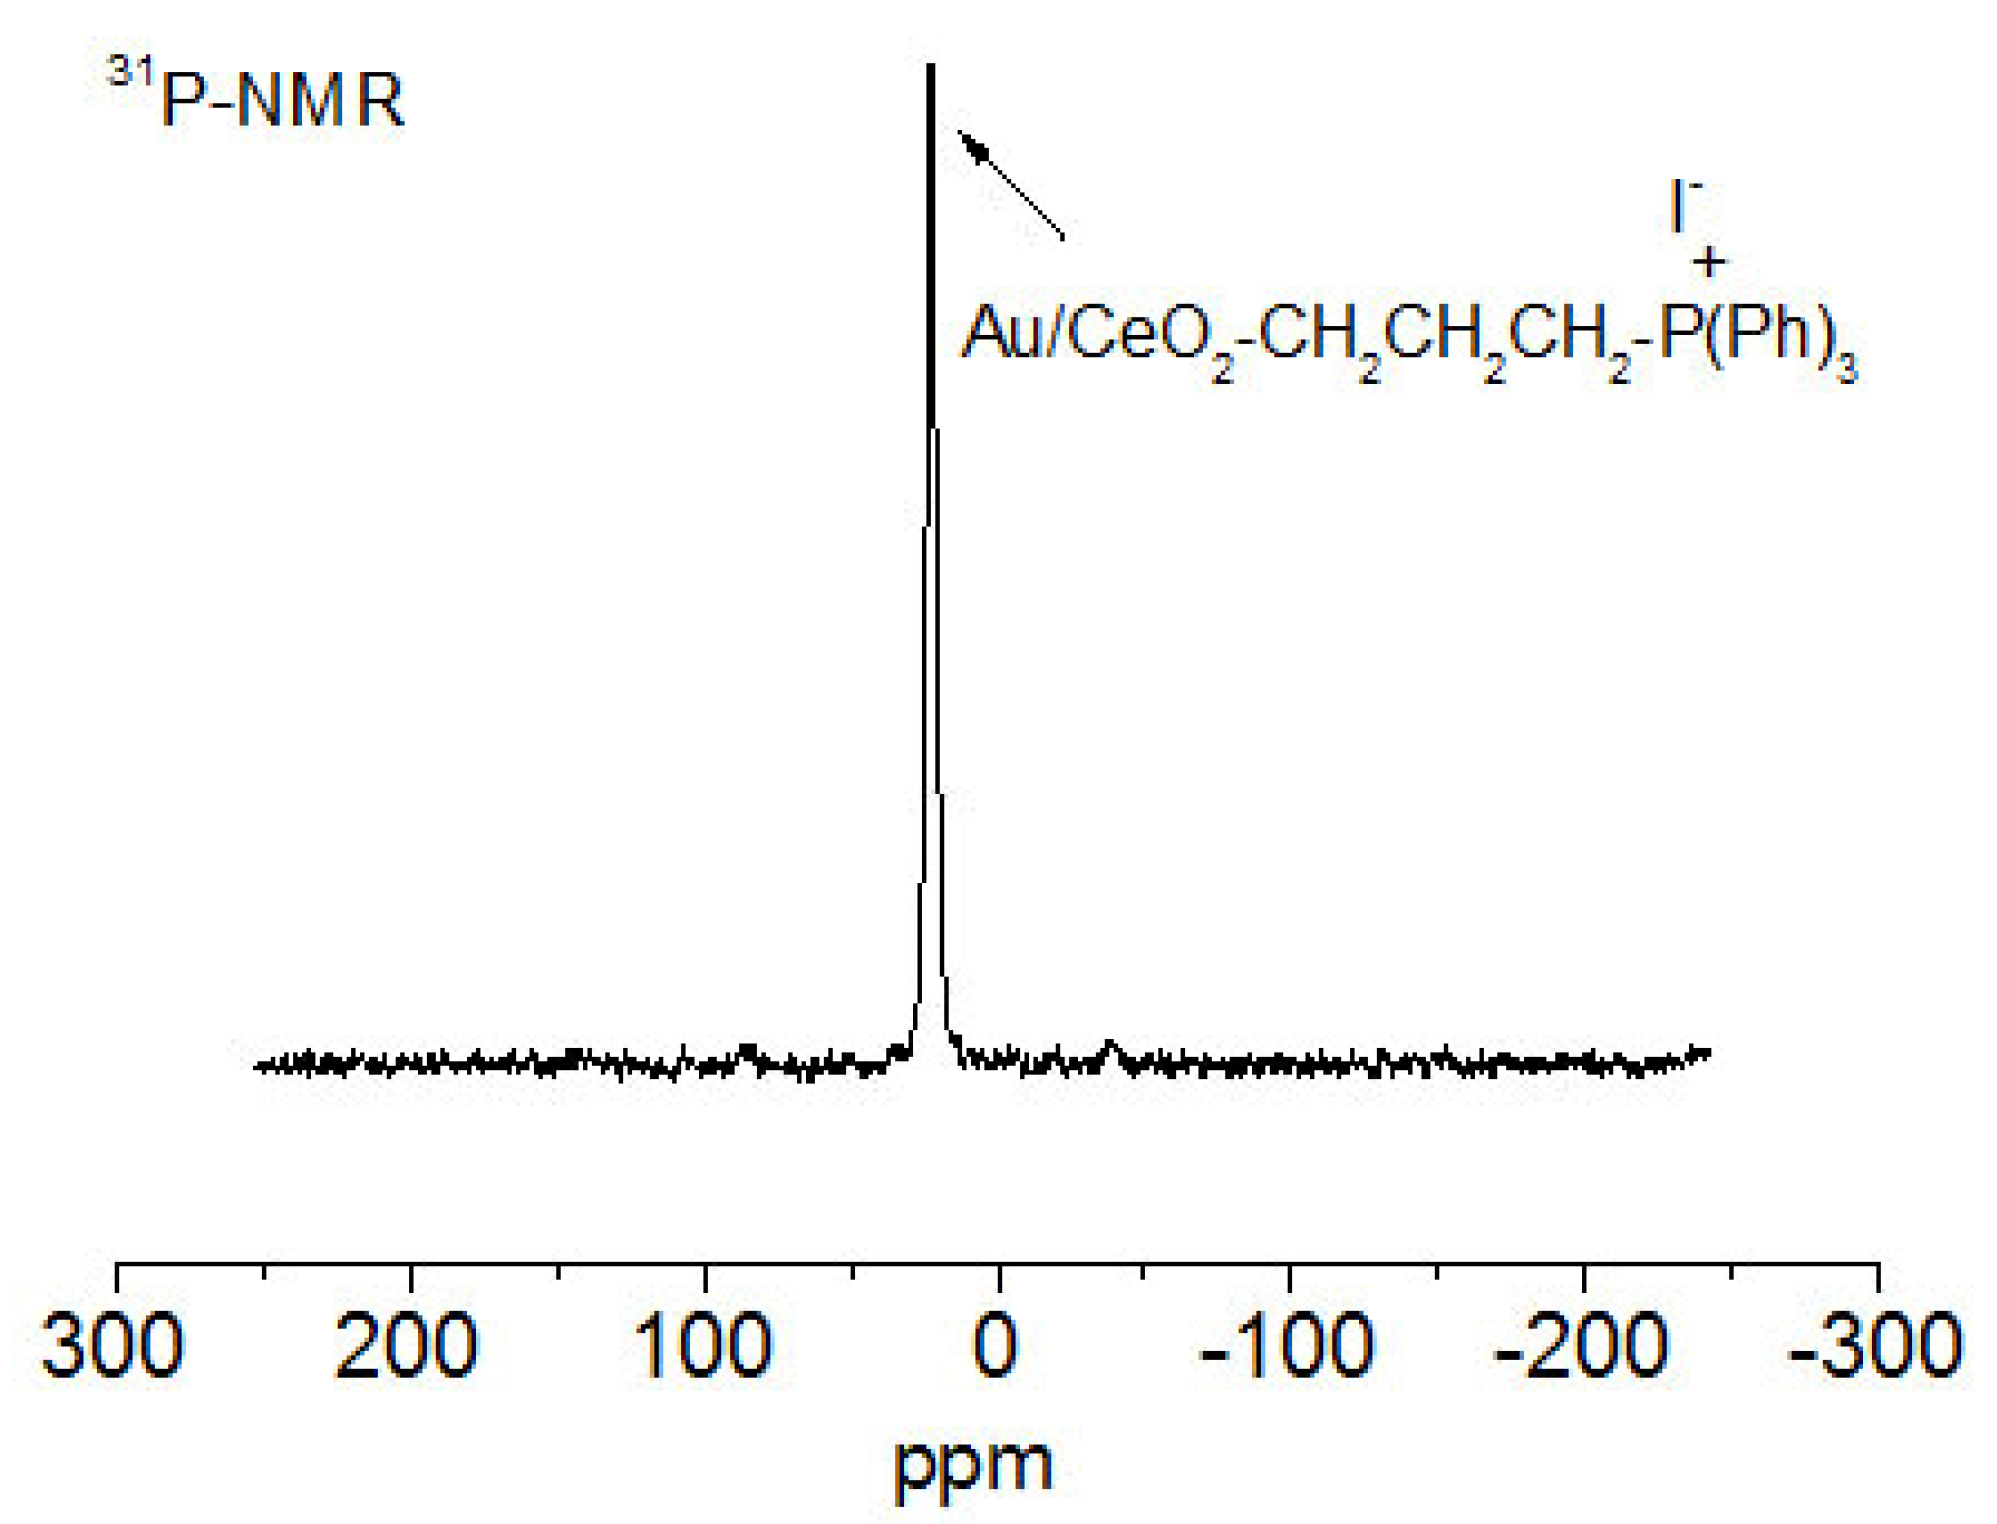
Once CeO2 had been characterized, AuCeO2 was prepared using the deposition-reduction method [20]. The percentage of gold on the AuCeO2 solid was 0.1 wt%, based on inductively coupled plasma atomic emission spectroscopy (ICP/AES) measurement. Figure S2 shows the representative DF-STEM images and gold particle size distribution (5.3 ± 3.0 nm) of approximately 100 NPs. The AuCeO2 composition was confirmed by DF-STEM analysis coupled to an energy dispersive X-ray (EDX) detector (Figure 1). Figure S3 shows a representative image of AuCeO2, its characteristic EDX spectrum and the homogeneous distribution of the elements (Ce, O and Au), as revealed by mapping analyses of each individual component in the sample. It should be noted that due to the large analyzed area of AuCeO2 (~500 nm × ~500 nm), it was not possible to observe individual Au NPs as in the case shown in Figure 1. DLS analysis of the AuCeO2 sample allowed us to estimate a hydrodynamic size and zeta potential of 139.2 nm and −29.2 mV, respectively (Figure 2B). On the other hand, the FT-IR spectrum of AuCeO2 sample showed the presence of –OH groups that are needed for further covalent functionalization with silyl groups (Figure 1). Thus, 3– (iodopropyl)trimethoxysilane was allowed to react with AuCeO2 in dry toluene to obtain ω–iodopropyl-functionalized AuCeO2 (I–AuCeO2). The presence of 3–iodopropyl groups anchored on the AuCeO2 surface was shown in the FT-IR spectrum by the presence of new bands at 2980 and 1450 cm−1, corresponding to stretching and bending vibrations of –CH2, respectively (Figure 1). In addition, new bands around 1150 cm−1 could be observed which were attributed to the Si–C and Si–O stretching vibrations. The loading of iodopropylsilyl groups on I–AuCeO2 was 4.1 mmol/g, based on the carbon content of this material, as determined by combustion chemical analysis. These iodo groups act as tethers that connect TPP to AuCeO2. This reaction was carried out by reacting I–AuCeO2 with PPh3 to form a strong P–C bond linkage between the positive charged TPP group and AuCeO2 (Scheme 1), showing a new approach to achieve TPP functionalization of CeO2 and probably other NPs with –OH groups in their structures. The success of this synthesis step was assessed by FT-IR spectroscopy (Figure 1) and 31P-NMR (Figure 3). FT-IR spectroscopy revealed that TPP was successfully anchored onto I–AuCeO2, as confirmed by the presence of the band at around 1600 and 700 cm−1 due to the C=C stretching and C–H bending vibrations caused by the TPP phenyl groups. The 31P-NMR spectrum showed a unique signal at 22.96 ppm, corresponding to the TPP units in TPP–AuCeO2 [45]. STEM-DF analyses coupled with an EDX detector allowed us to confirm the homogeneous distribution of the different elements present in the TPP–AuCeO2 sample (Ce, O, Au and P) (Figure S4). The presence of some residual nonreacted iodide was also detected. As in the case of AuCeO2, the analyzed area in the TPP–AuCeO2 sample was higher than 500 nm × 500 nm; this fact complicated the observation of the small Au NPs, as in the case shown in Figure S3. DLS measurements allowed us to estimate the hydrodynamic size and zeta potential of the TPP-AuCeO2 particles of 216.0 nm and −10.3 mV, respectively (Figure 2C), providing further evidence of the functionalization with TPP moieties. Gold particle size distribution in the TPP–AuCeO2 sample was measured by TEM and did not significantly change with respect to AuCeO2 samples.

3.2. Cell Culture Studies

3.2.1. Cellular Viability and Proliferation

Once the NPs had been successfully obtained, their biocompatibility was evaluated using HeLa cells, in which cell viability and proliferation were assessed. These studies were performed using CeO2, AuCeO2 and TPP–AuCeO2 at two usual concentrations employed in biomedicine (i.e., 10 and 20 µg/mL) [16]. The cytotoxicity of these NPs in HeLa cells was determined by MTT assay at 24, 48 and 72 h of incubation. The cellular viability at 10 µg/mL and 20 µg/mL for each NP showed a slight but nonsignificant decrease in cellular viability and proliferation rate after 72 h, being more pronounced at the higher concentration compared to controls (p = 0.085) (untreated cells) (Figure S5). Thus, it can be concluded that the NPs did not produce important cytotoxicity in these cells, and showed suitable biocompatibility for use in biomedical applications.

3.2.2. Cellular Uptake and Internalization of Conjugate by Confocal Microscopy

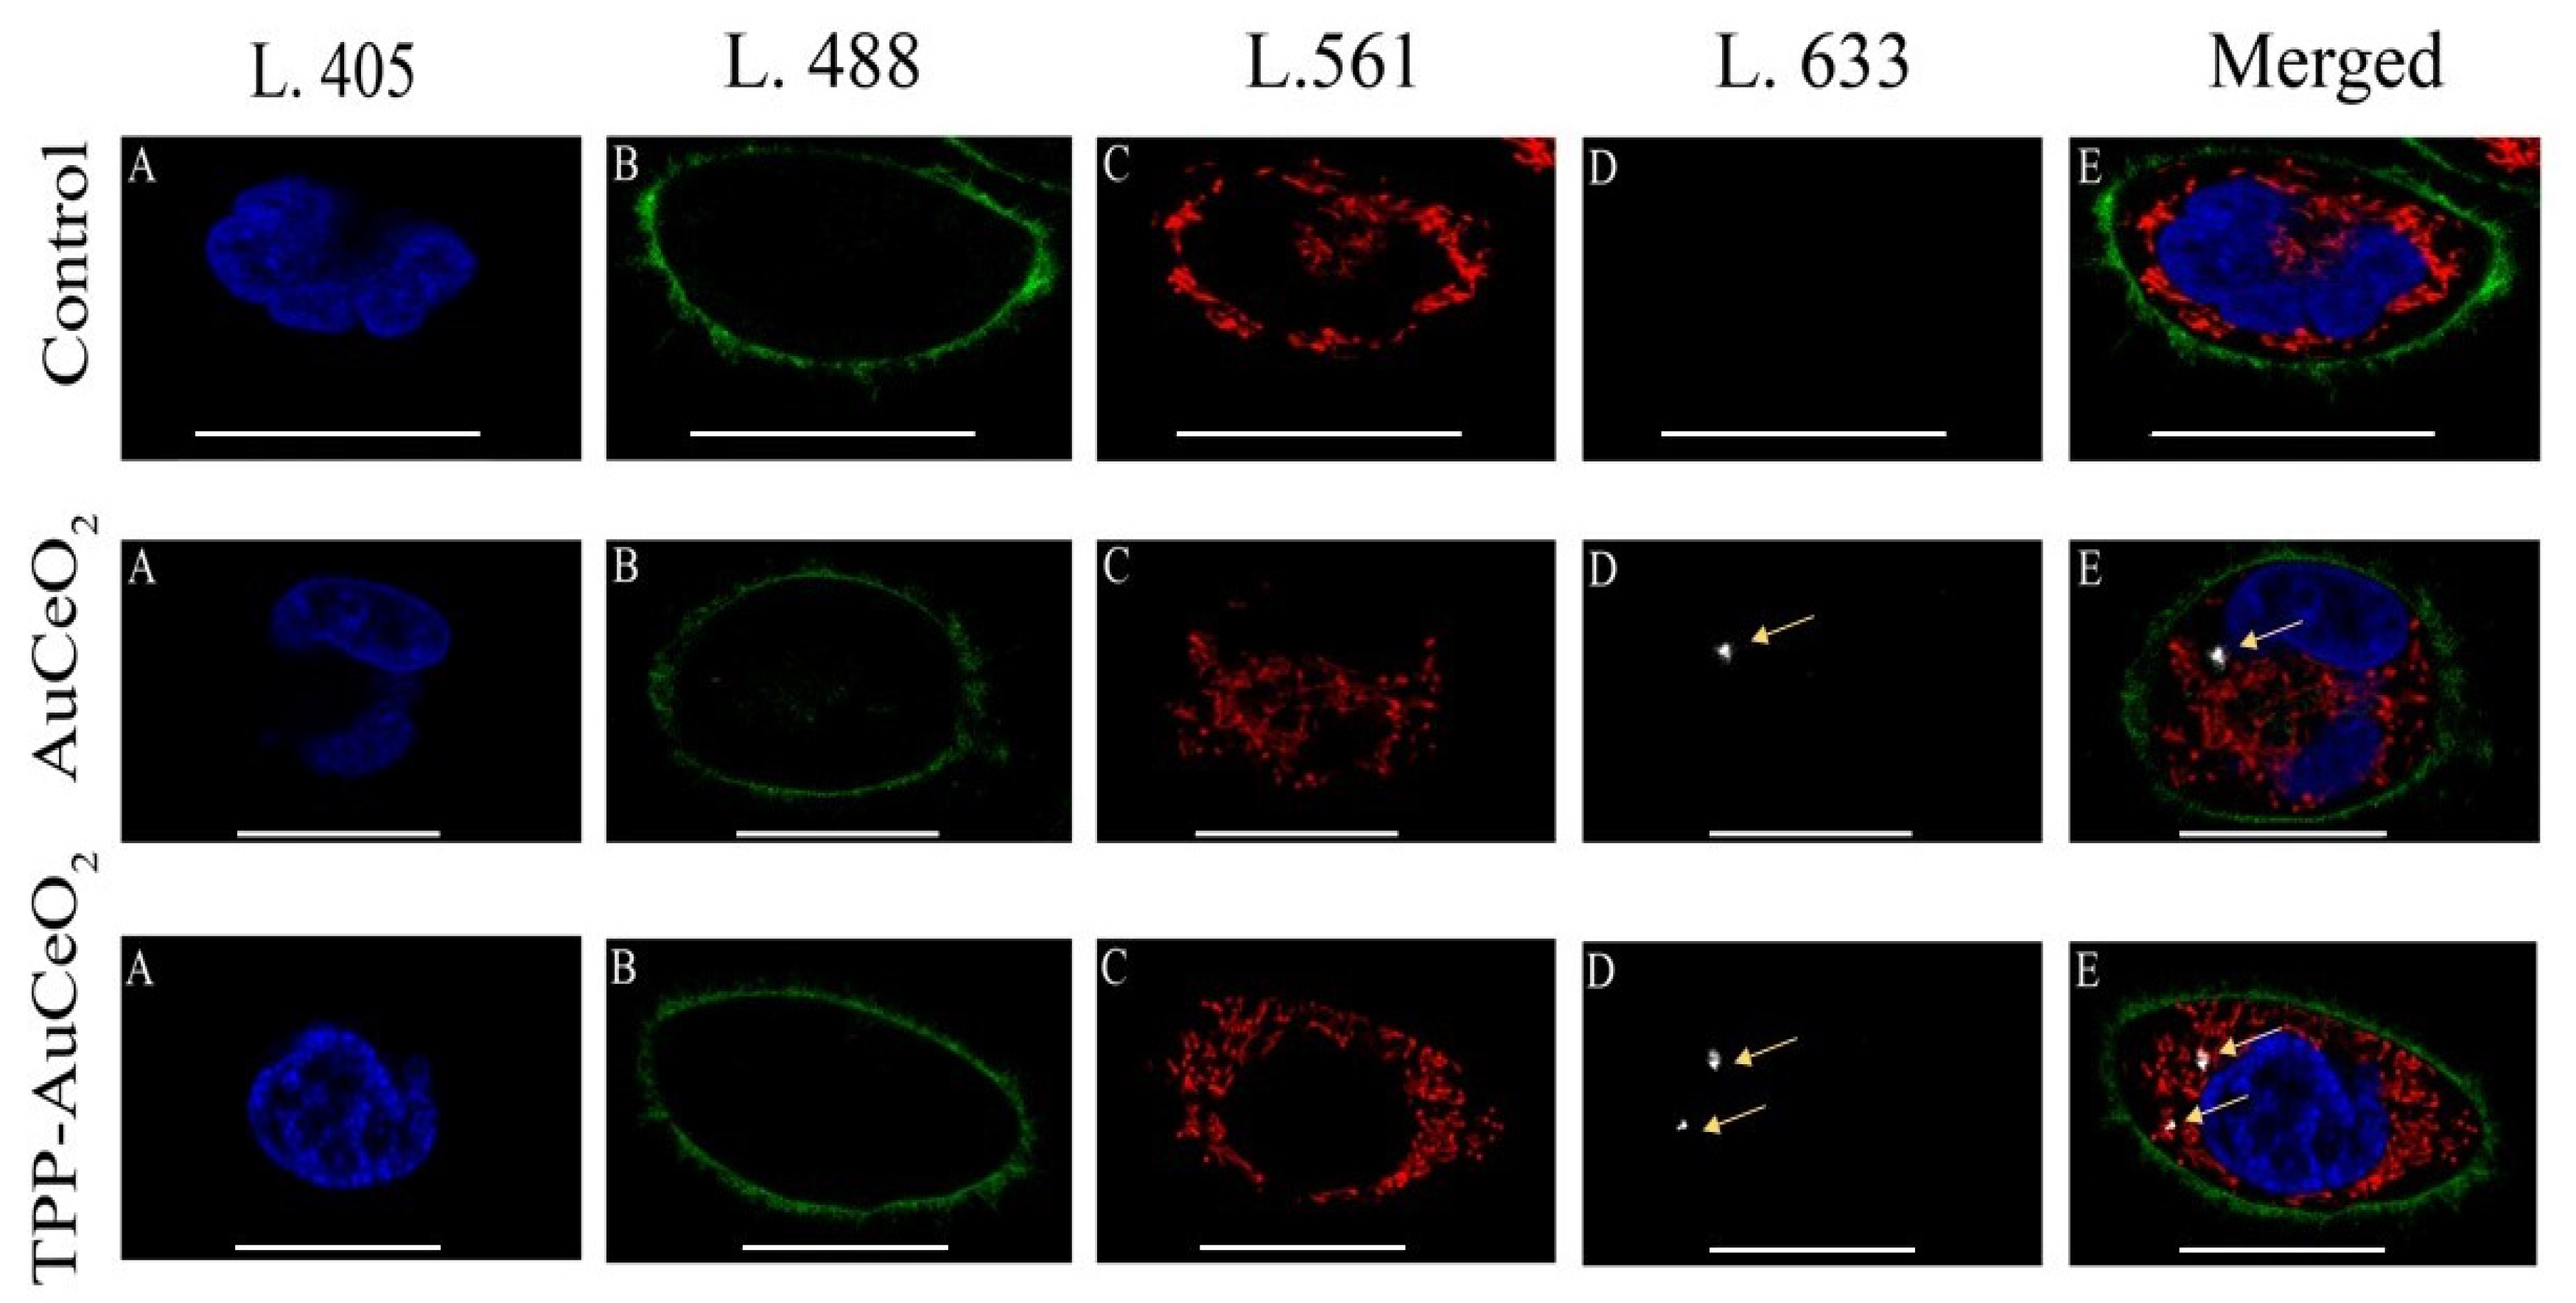
Confocal microscopy images confirmed the internalization of AuCeO2 and TPP–AuCeO2 in HeLa cells. NPs were visualized after irradiating cells with 633 nm laser (white spots in Figure 4D). To determine the cellular localization of the NPs in cells, different cellular organelles, such as the nucleus, cell membrane and mitochondria, were co-stained with blue, green and red fluorescent dyes, respectively (Figure 4A–C). The images revealed the presence of more than one NP per cell in the cellular cytoplasm (for AuCeO2) and next to the mitochondria (for TPP–AuCeO2) (Figure 4E). Finally, a Z-stack assessment was performed to confirm the internalization and localization of NPs [41,46], in agreement with the previous results (Figure S6).

3.2.3. Mitochondrial Functional Studies after Nanoparticles Treatments

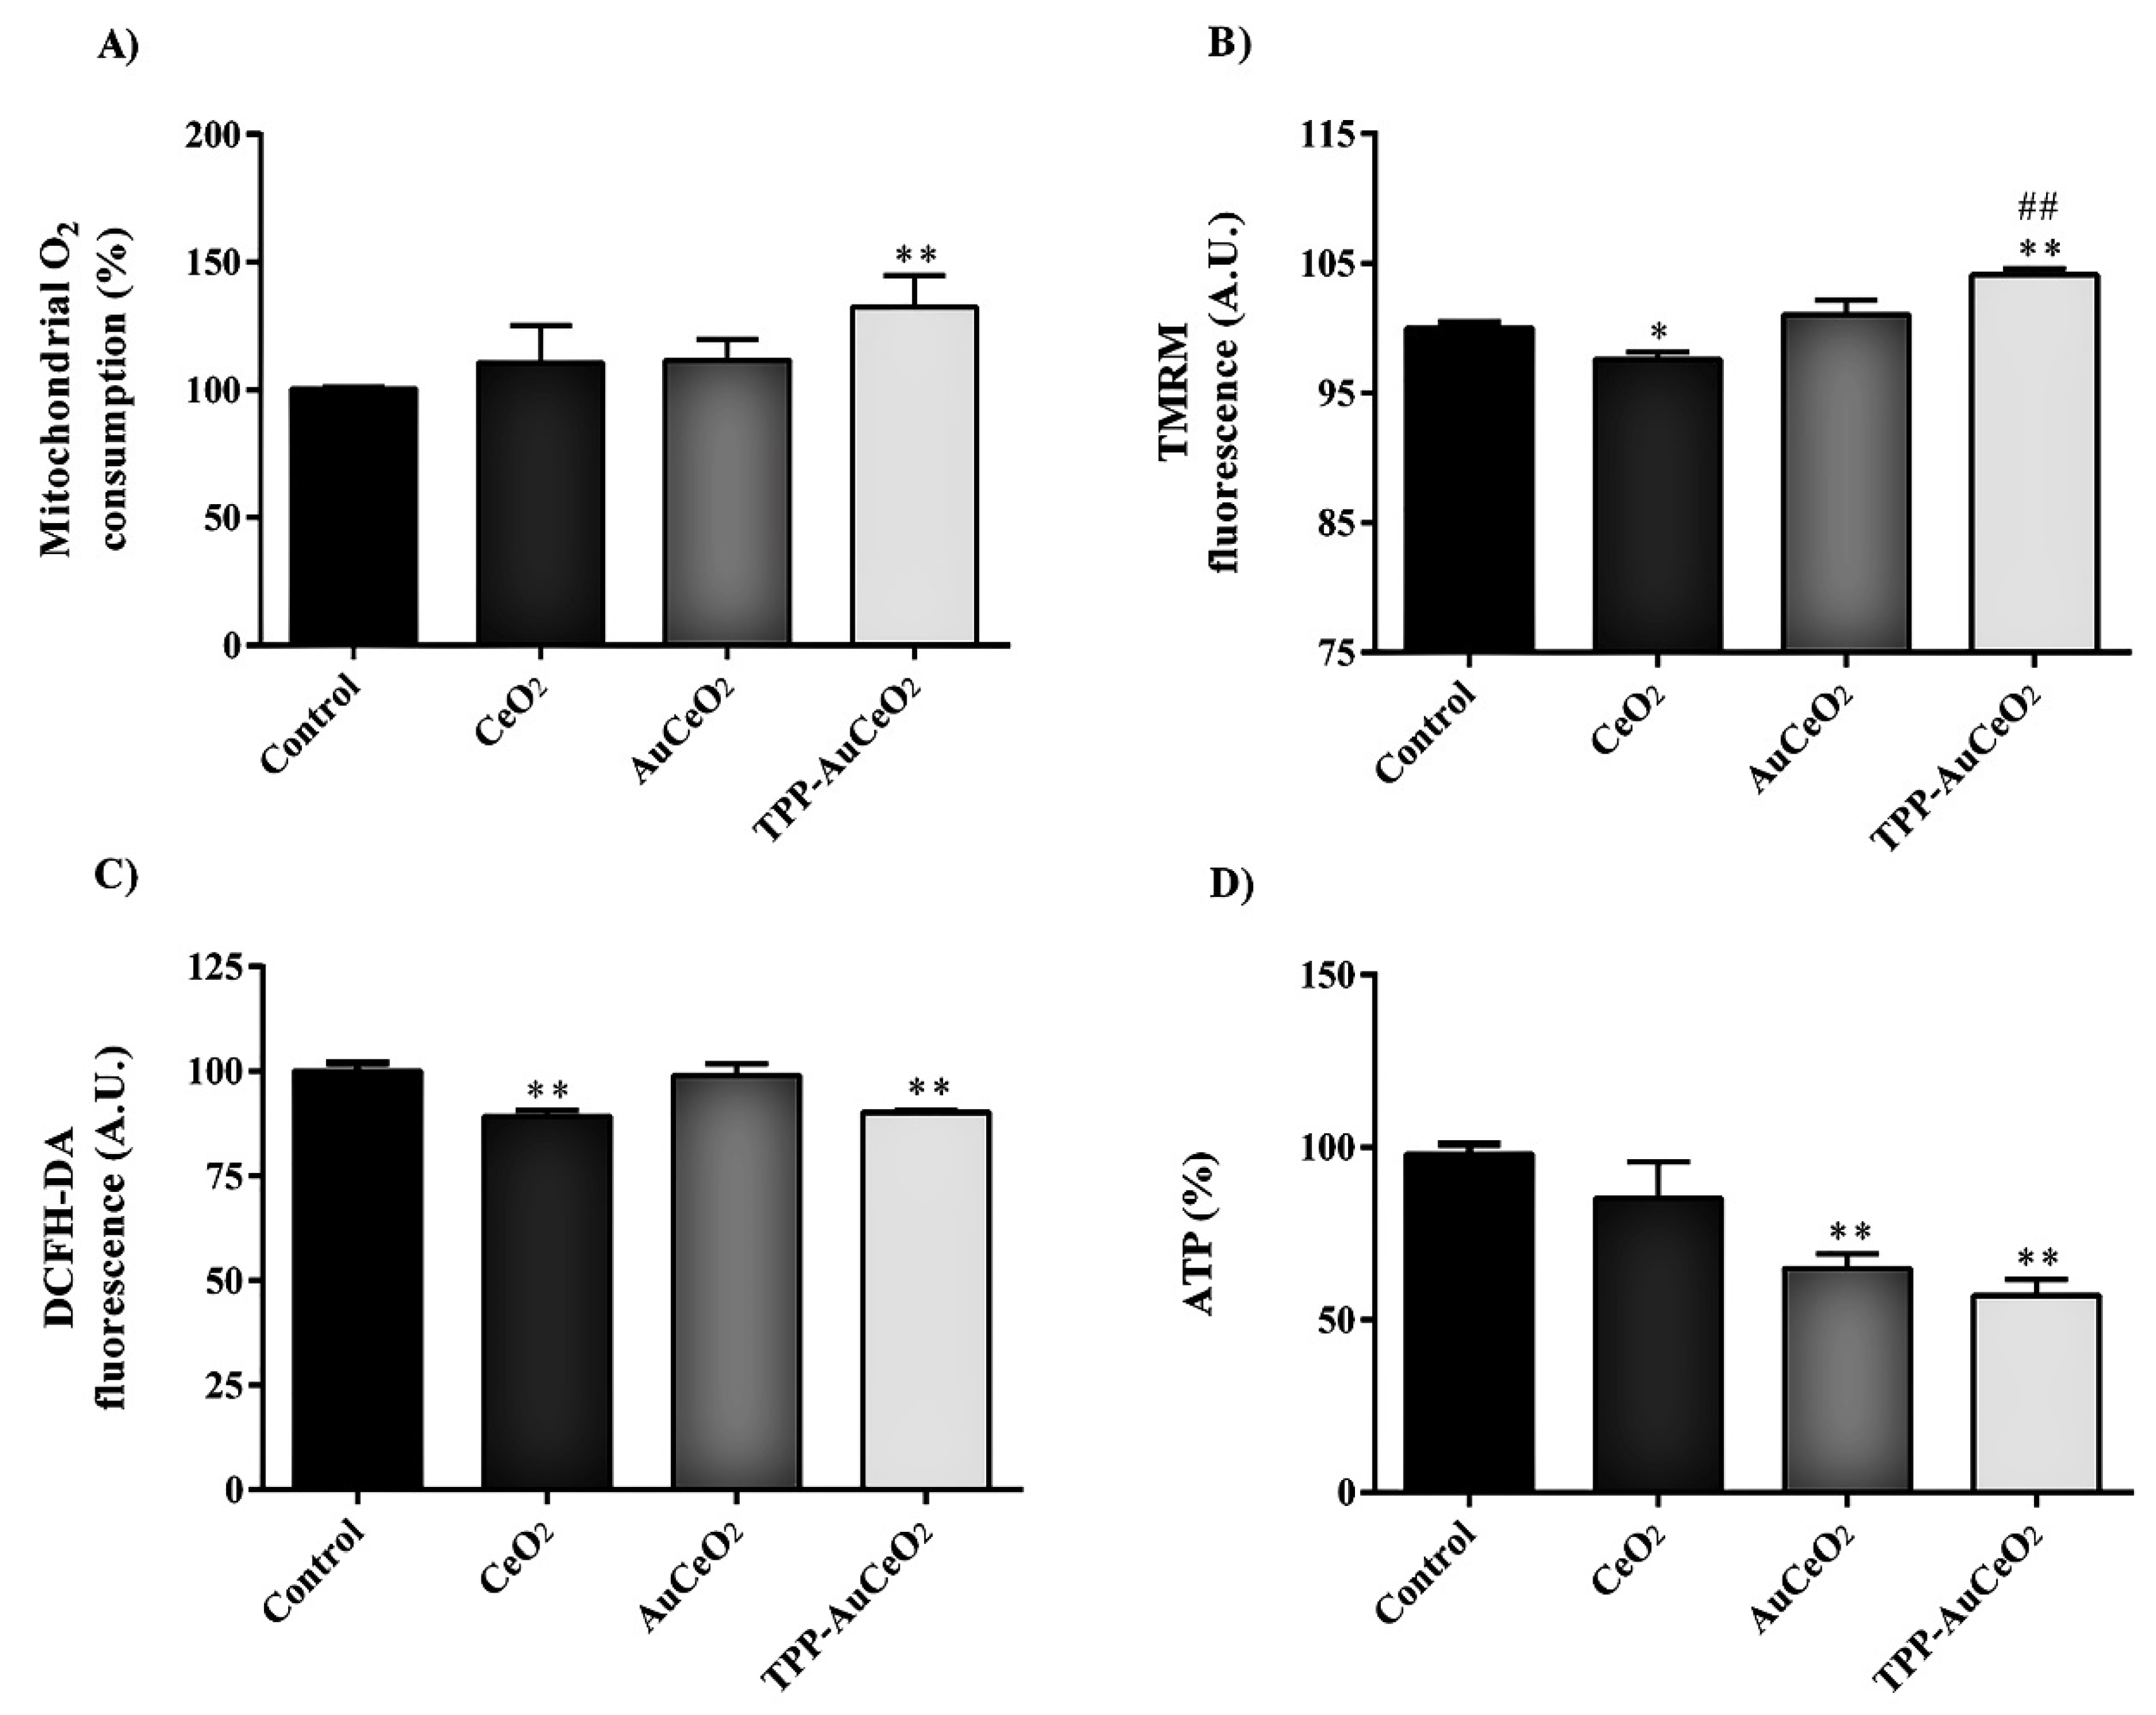
To determine the effects of CeO2, AuCeO2 and TPP–AuCeO2 at 20 µg/mL on mitochondrial function in HeLa cells after 24 h incubation, we initially measured mitochondrial O2 consumption in vitro using a Clark-type O2 electrode, and added sodium cyanide to confirm that this consumption had occurred in the mitochondria (Figure 5A). While treatment with CeO2 and AuCeO2 increased the mitochondrial O2 consumption rate slightly (p = 0.354 and p = 0.196, respectively), TPP–AuCeO2 induced a significant increase compared to untreated control cells (p < 0.01). This effect was probably related to the predisposition of TPP-functionalized NPs to accumulate near the mitochondria as observed by confocal microscopy.
To further explore the effect of NPs on mitochondrial function, the ∆Ψm of cells was determined using the TMRM probe and measuring the fluorescence in the samples at 690 nm (Figure 5B). A decrease in ∆Ψm in cells treated with CeO2 was observed with respect to untreated control cells (p < 0.05). However, when Au NPs were supported on CeO2, the AuCeO2 solid exhibited a slight ∆Ψm increase compared to negative controls. This ∆Ψm increase was higher and statistically significant when cells were treated with TPP–AuCeO2 (p < 0.01 compared to control cells and p < 0.001 compared to CeO2-treated cells).
To check if this increase in mitochondrial O2 consumption and ∆Ψm signal resulted in changes in ROS production, total cellular ROS content was assessed by measuring fluorescence emission in NP-treated cells at 527 nm (Figure 5C) after addition of DCFH–DA. CeO2 and TPP–AuCeO2 significantly reduced ROS production (p < 0.01 in both cases), but AuCeO2 had no significant effect on cellular ROS content, meaning that these NPs do not produce any OS in cells.
The production of ATP in cells after NP treatment (Figure 5D) was estimated using the luciferase method. Our data show that AuCeO2 and TPP–AuCeO2 were able to significantly reduce ATP production in cells (p < 0.01), unlike CeO2 that only reduced it slightly (p = 0.282).
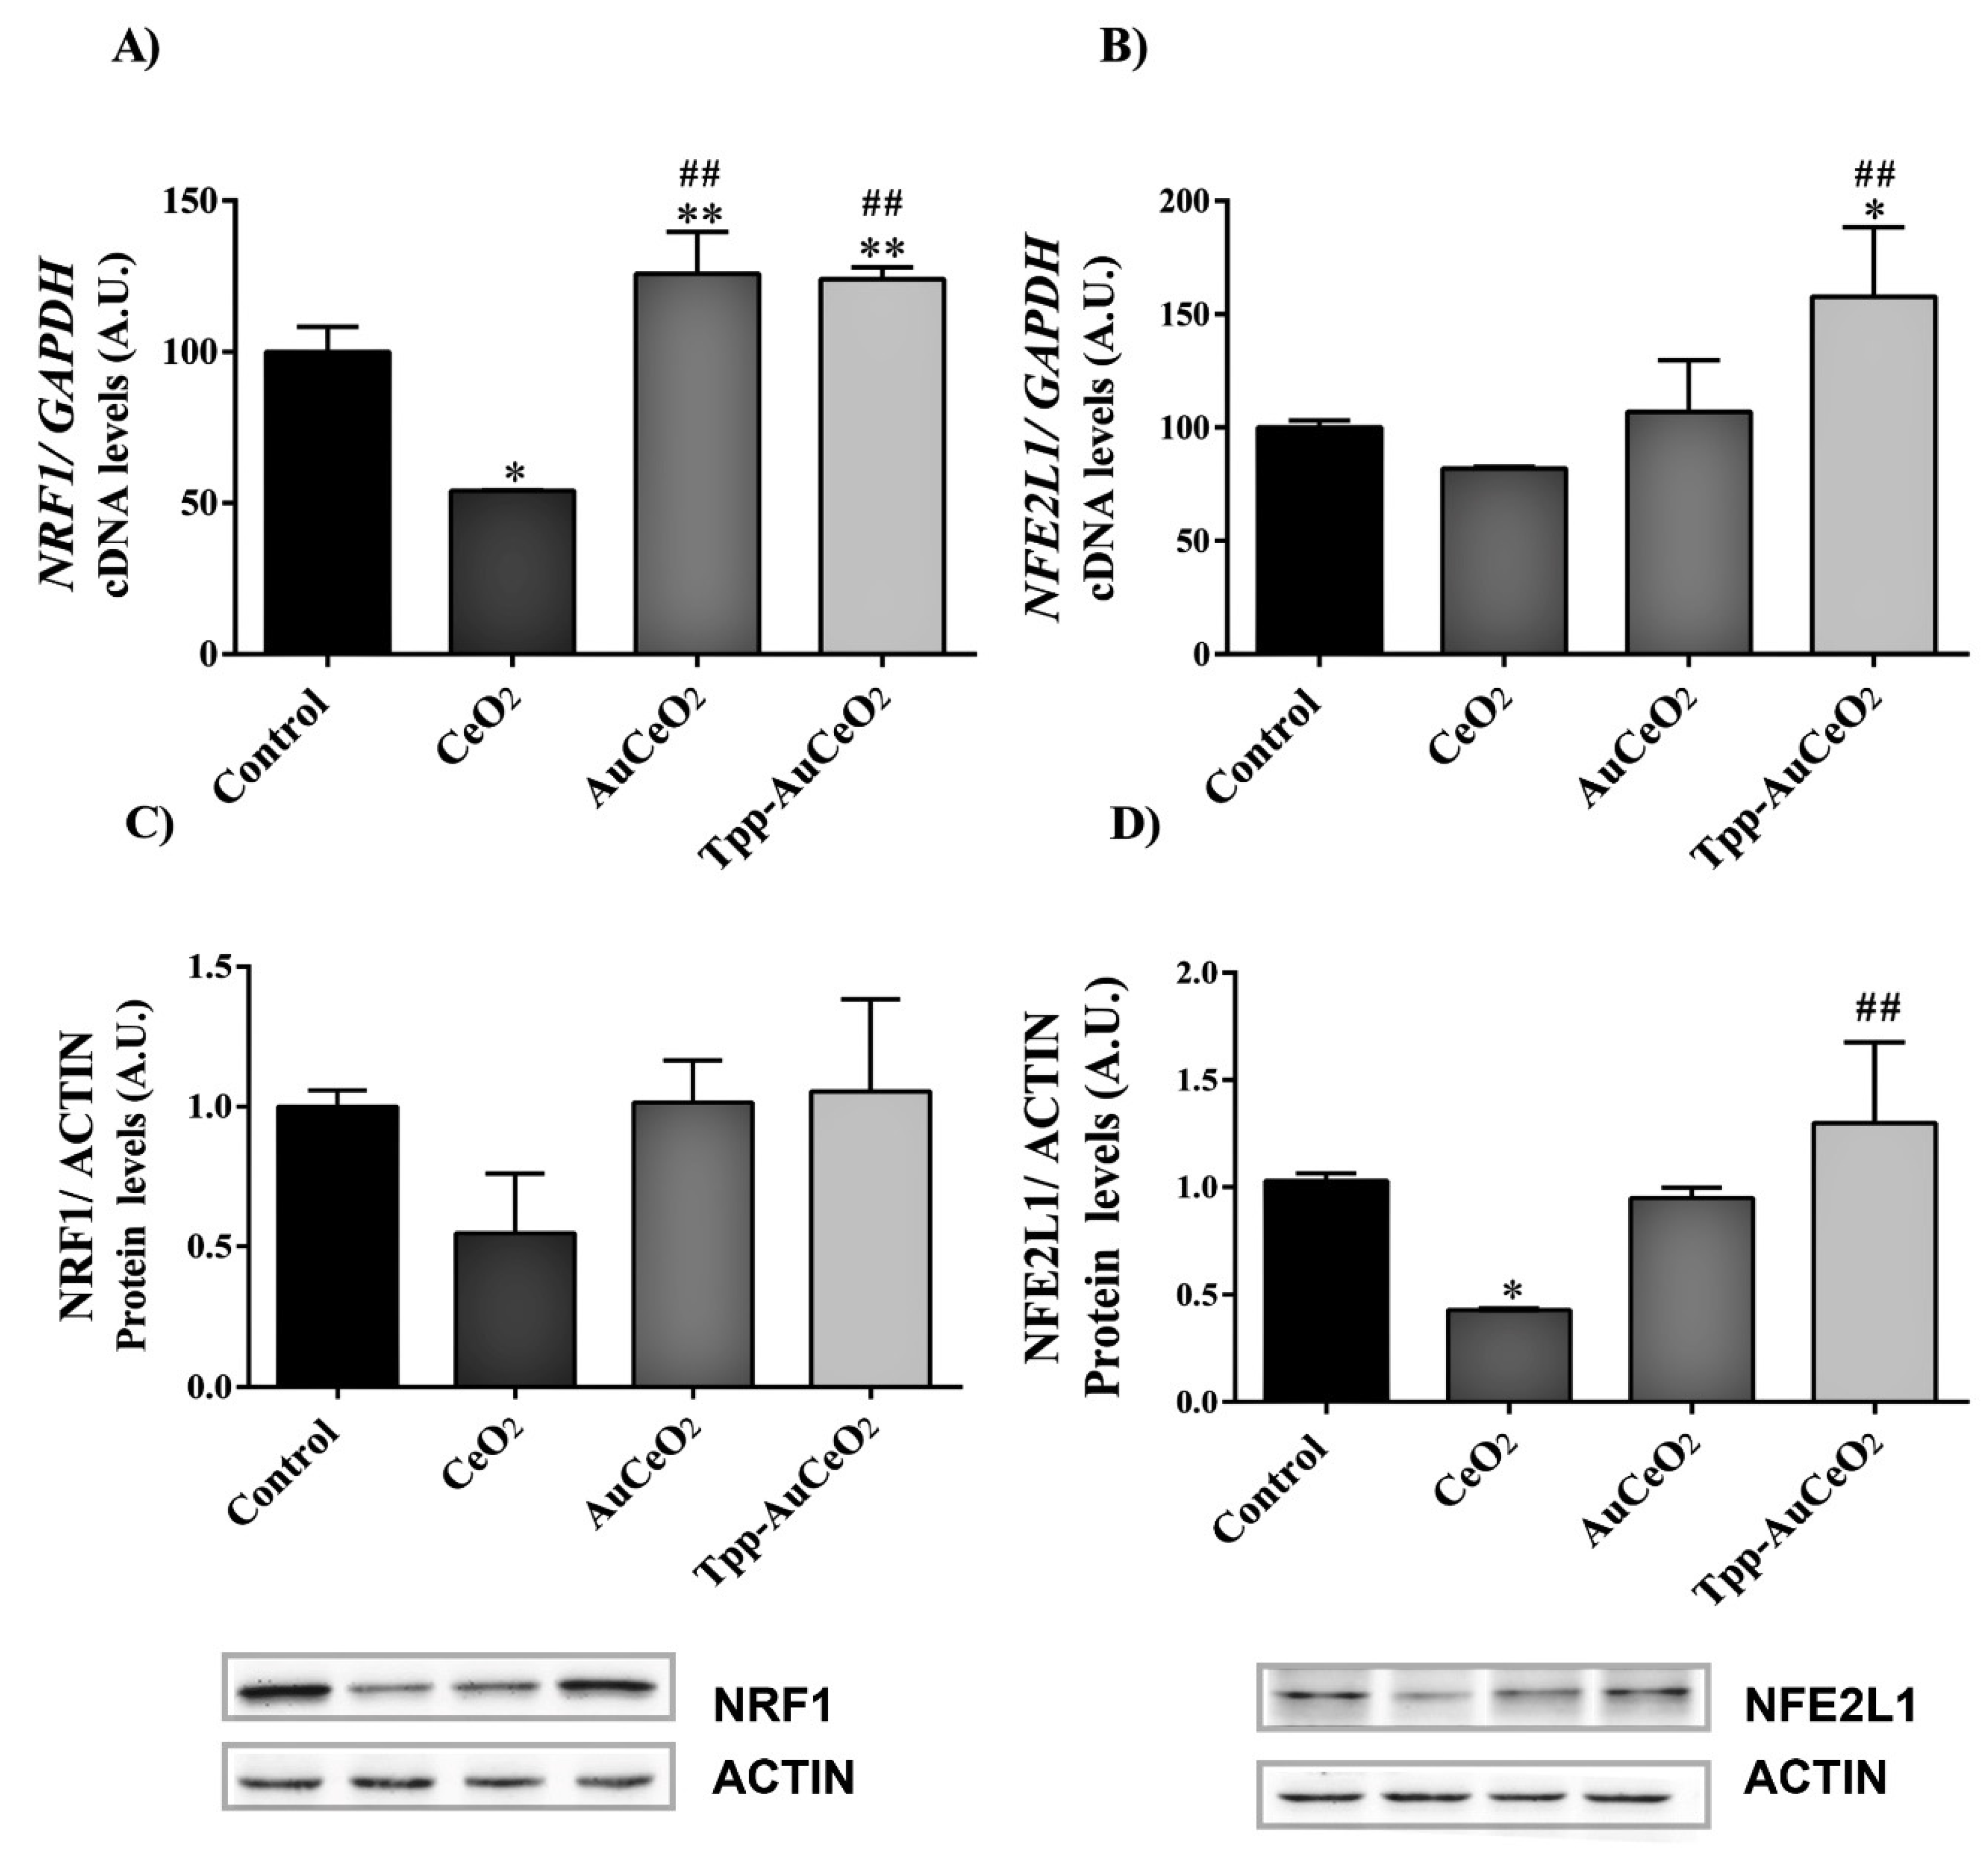
Additionally, RT-PCR showed a drop in NRF1 and NFE2L1 gene expression after CeO2 treatment (Figure 6A,B, respectively), which was only significant for NRF1 (p < 0.05). However, the presence of gold supported on CeO2 NPs significantly increased the expression of NRF1 (p < 0.01). The expression of NFE2L1 also significantly increased after TPP–AuCeO2 treatment only (p = 0.014), and showed an increasing trend with AuCeO2. However, the protein levels of NRF1 and NFE2L1 measured with western blot remained steady in the TPP–AuCeO2 group compared to the control group, but fell in the others, being moderate in AuCeO2, but considerable and statistically significant in CeO2 (p < 0.05) (Figure 6C,D, respectively). Finally, the increased of NRFE2L protein was statistically significant regarding the presence of Au, as revealed by the analysis between CeO2 and TPP–AuCeO2, following a similar tendency to that observed in the expression of this gene (Figure 6D).

4. Discussion

As previously noted, this manuscript aims to report the synthesis of CeO2, AuCeO2 and TPP–AuCeO2, as well as the evaluation of the effects of these NPs on mitochondrial function. Initially, CeO2 and AuCeO2 nanoparticles were obtained following a methodology previously described by our group [20]. In order to covalently functionalize AuCeO2 with TPP units, a new, two-step synthetic methodology was performed. This methodology is based on the functionalization of –OH groups present in the surface of the AuCeO2 solid through a silylation reaction to attach the iodoalkyl chain by strong covalent Ce–O–Si bonds, and subsequently perform a nucleophilic substitution reaction of iodide with PPh3. This methodology can be used to functionalize other similar NPs with the TPP group as long as they have –OH groups in their surface. Thus, the –OH groups of AuCeO2 were used to attach iodopropyl groups, thereby resulting in I–AuCeO2. Subsequently, the iodo group present in the I–AuCeO2 sample was reacted with PPh3, resulting with the formation of TPP–AuCeO2. The characterization data of all the NPs confirmed that Au deposition and the functionalization procedure did not significantly alter the size of CeO2, while zeta potential was less negative in the presence of Au or positive when NPs were functionalized with the TTP group.
Once NPs had been synthesized and characterized, the internalization of AuCeO2 and TPP–AuCeO2 was assessed by confocal microscopy. Since the internalization of both CeO2 and AuCeO2 in cells had been already confirmed in a previous study [20], we wanted to assess the ability of TPP–AuCeO2 to internalize and the effect caused by the presence of the TPP group when compared with unfunctionalized AuCeO2. Confocal microscopy z-stack analysis revealed that AuCeO2 and TPP–AuCeO2 were located mainly in the cytoplasm and next to the mitochondria, respectively. Furthermore, a biocompatibility study performed with all synthesized NPs confirmed that they did not affect viability and proliferation after 72 h of incubation in HeLa cells. The effects of these three types of NPs on mitochondrial function were subsequently assessed in HeLa cells. Treatment with these NPs resulted in an increase in mitochondrial O2 consumption, being only statistically significant with the presence of the TPP counterpart. This effect could be valuable in the treatment pathological conditions that require an increase of mitochondrial activity, such as diabetes, cancer, Alzheimer’s disease or obesity [47,48,49]. To further investigate the mitochondrial effect caused by these NPs, the cellular ∆Ψm was also measured. The behavior of NPs against ∆Ψm was completely different depending on the presence of Au in NPs; it decreased significantly with CeO2 and tended to increase with AuCeO2, being significantly higher with TPP–AuCeO2. These results suggest a change in mitochondrial function of cells induced by the presence of Au in CeO2 NPs that was increased by the proximity of these NPs to mitochondria after their TPP-functionalization. This data indicates that the presence of Au in CeO2 can notably alter notably mitochondrial function in cells. Another parameter related to mitochondria in eukaryotic cells is cellular ATP production, since it is mainly produced in the mitochondria. ATP production was found to be reduced in all NP treatment groups, but was only statistically significant for AuCeO2 and TPP–AuCeO2. These observations demonstrate that Au enhances ATP reduction when NPs accumulate near the mitochondria. To further explore if these effects on mitochondrial function affected cellular OS, ROS content was measured in cells after incubation with NPs. None of the NPs caused an increase in ROS content. In fact, the ROS content was significantly reduced by the presence of CeO2 and TPP–AuCeO2, and showed a trend toward reduction when incubated with AuCeO2. Therefore, these NPs did not enhance OS in cells despite altering the mitochondrial function. We suggest that the presence of Au in AuCeO2 and TPP–AuCeO2 NPs induced a change in the cellular mitochondrial function, thereby modulating its activity. In addition, TPP–AuCeO2 exhibited a similar tendency to AuCeO2 which was considerably higher and more noticeable than when only TPP moieties were present in NPs. This is the first time that this kind of behavior has been reported, which raises the possibility of modulating the mitochondrial action of the antioxidant CeO2 by Au. Thus, this work opens new avenues to synthesize personalized antioxidants based on CeO2 to treat diseases after taking into account mitochondrial needs, thereby enhancing the biomedical applicability of these NPs.
Our analysis was completed by studying the expression of NRF1 and NFE2L1 genes whose cellular expression was completely changed by the presence of Au in the NPs. The expression of both genes was reduced when cells were treated with CeO2, but increased when incubated with AuCeO2 and TPP–AuCeO2. NRF1 is an important gene for mitochondrial function, since it promotes the expression of genes related to mitochondrial respiration, mitochondrial biogenesis and mitochondrial DNA transcription and regulation [45,46,50]. Changes in NRF1 expression as a result of NP treatment may be associated with previously observed changes in cellular respiration and ATP production. The treated cells showed changes in NRF1 gene expression. Our results reveal that the presence of Au in CeO2 NPs increases the expression of this gene that is depleted in presence of CeO2, probably causing the alterations observed in ∆Ψm and ATP production. On the other hand, NFE2L1 acts as a transcription factor by binding to antioxidant response element sequences, thus regulating the expression of several genes involved in antioxidant defenses [51,52]. Our data confirm again that the presence of Au alters mitochondrial function, and its presence increases the expression of NFE2L1, which was reduced by CeO2, and therefore the expression of genes involved in the production of endogenic antioxidants. The fact that TPP–AuCeO2 can significantly enhance the expression of NRF1 and NFE2L1 highlights the potential of these NPs as modulators of mitochondrial function and OS in cells. In addition to RT-PCR experiments, the protein content of NRF1 and NFE2L1 in cells after NP treatment was measured by western blot. Both analyses showed a tendency of CeO2 to decrease the content of both proteins, being statistically significant in NFE2L1, while both proteins were increased in the presence of Au, with a greater increase when functionalized with TPP. Thus, the protein content seems to be aligned with the expression of genes, corroborating the outcomes.
Our findings show that the mitochondrial action mechanism of CeO2 in cells was modified by Au, and was more noticeable when it was targeted to mitochondria through functionalization with the TPP group. Therefore, although all these NPs have been proposed as antioxidants, their effects on mitochondrial function are completely different. Thus, these NPs can be used as personalized antioxidants agents to treat different diseases depending on their effect on the mitochondrial function. It should be mentioned that several pathologies require different antioxidants based on their effect on mitochondrial function. Nevertheless, further studies are required to gain a better understanding about the cellular mechanism and pathways affected by these NPs, especially those related with mitochondrial effects due to the TPP–AuCeO2 (Figure 5).

5. Conclusions

In summary, we have successfully established a new methodology for the functionalization of ceria nanoparticles with TPP groups. In addition, the effects of CeO2, AuCeO2 and TPP–AuCeO2 on the cellular mitochondrial function have been successfully assessed. For the first time, we have demonstrated that the presence of Au in CeO2 nanoparticles can modulate the effects on the mitochondrial function caused by CeO2 in cells. This effect can be enhanced by increasing the mitochondria-targeting ability of AuCeO2 through functionalization with TPP groups. This modulation of mitochondrial function may be used to enhance the therapeutic utility of these NPs for various biomedical applications.

Supplementary Materials

The following are available online at https://www.mdpi.com/2079-4991/10/4/744/s1, Figure S1. Powder XRD (performed in a Shimadzu XRD-7000 diffractometer using Cu Kα at a scanning speed of 1° per min in the 10 – 80° 2θ range (Shimadzu Europa GmbH, Duisburg, Germany) and representative TEM images of CeO2; Figure S2. TEM image of AuCeO2 with size distribution of Au NPs; Figure S3. TEM of AuCeO2 sample with its EDX spectrum and mapping of Au, Ce, O, Cu and C; Figure S4. TEM image of TPP–AuCeO2 with its EDX spectrum and mapping of Au, Ce, O, Cu, C, Si, P, and I; Figure S5. Effects of CeO2, AuCeO2 and TPP–AuCeO2 on cellular proliferation and viability in cells after 24, 48 and 72 h; Figure S6. Z-stack images of HeLa Cells incubated without NPs and with AuCeO2 and TPP–AuCeO2.

Author Contributions

Conceptualization: H.G. and J.R.H.; methodology: P.G.-C., S.N., I.A., V.M.V., C.A.-G., X.S. and J.R.H.; software: P.G.-C., C.A.-G. and V.M.V.; formal analysis: P.G.-C., C.A.-G., S.N., H.G., V.M.V., X.S., R.S., I.A., and J.R.H.; resources: J.R.H.; investigation: S.N., H.G., R.S., and J.R.H.; writing—manuscript preparation, P.G.-C., H.G., S.N., I.A., V.M.V., and J.R.H.; writing—original draft preparation, visualization, P.G.-C., H.G., S.N., I.A., V.M.V., and J.R.H.; and supervision, H.G., and J.R.H. All authors have read and agreed to the published version of the manuscript.

Funding

This research was funded by Carlos III Health Institute and the European Regional Development Fund, grant number CP13/00252 and PI16/1083; the Catalonian Agency for Management of University and Research Grants, grant number 2017SGR1303; the Ministry of Education of the Valencian Regional Government, grant number PROMETEO/2019/027, The Foundation for the Promotion of Health and Biomedical Research of Valencia Region, grant number Nanobetes2.

Acknowledgments

The authors would like to thank Julia Baguña Torres for her valuable assistance with the preparation of this manuscript.

Conflicts of Interest

The authors declare no conflict of interest.

References

  1. Shi, J.; Kantoff, P.W.; Wooster, R.; Farokhzad, O.C. Cancer nanomedicine: Progress, challenges and opportunities. Nat. Rev. Cancer 2016, 17, 20–37. [Google Scholar] [CrossRef] [PubMed]
  2. Huang, Y.; Fan, C.-Q.; Dong, H.; Wang, S.-M.; Yang, X.-C.; Yang, S. Current applications and future prospects of nanomaterials in tumor therapy. Int. J. Nanomed. 2017, 12, 1815–1825. [Google Scholar] [CrossRef] [PubMed] [Green Version]
  3. Cui, X.; Mathe, D.; Kovács, N.; Horvath, I.; Jauregui-Osoro, M.; De Rosales, R.T.M.; Mullen, G.E.D.; Wong, W.; Yan, Y.; Krüger, D.; et al. Synthesis, characterization, and application of Core–Shell Co0.16Fe2.84O4@NaYF4(Yb, Er) and Fe3O4@NaYF4(Yb, Tm) nanoparticle as trimodal (MRI, PET/SPECT, and optical) imaging agents. Bioconjugate Chem. 2015, 27, 319–328. [Google Scholar] [CrossRef] [Green Version]
  4. Martín, R.; Menchón, C.; Apostolova, N.; Victor, V.M.; Alvaro, M.; Herance, J.R.; García, H. Nano-jewels in biology. Gold and platinum on diamond nanoparticles as antioxidant systems against cellular oxidative stress. ACS Nano 2010, 4, 6957–6965. [Google Scholar]
  5. Diab, M.S.; Dkhil, M.A.M.; Bauomy, A.A.; Al-Quraishy, S. Antioxidant and hepatoprotective role of gold nanoparticles against murine hepatic schistosomiasis. Int. J. Nanomed. 2015, 10, 7467–7475. [Google Scholar] [CrossRef] [Green Version]
  6. Hou, J.; Yu, X.; Shen, Y.; Shi, Y.; Su, C.; Zhao, L. Triphenyl phosphine-functionalized chitosan nanoparticles enhanced antitumor efficiency through targeted delivery of doxorubicin to mitochondria. Nanoscale Res. Lett. 2017, 12, 158. [Google Scholar] [CrossRef] [Green Version]
  7. Kwon, H.J.; Cha, M.-Y.; Kim, K.; Kim, D.K.; Soh, M.; Shin, K.; Hyeon, T.; Mook-Jung, I. Mitochondria-targeting ceria nanoparticles as antioxidants for Alzheimer’s disease. ACS Nano 2016, 10, 2860–2870. [Google Scholar] [CrossRef]
  8. D’Hollander, A.; Jans, H.; Velde, G.V.; Verstraete, C.; Massa, S.; Devoogdt, N.; Stakenborg, T.; Muyldermans, S.; Lagae, L.; Himmelreich, U. Limiting the protein corona: A successful strategy for in vivo active targeting of anti-HER2 nanobody-functionalized nanostars. Biomaterials 2017, 123, 15–23. [Google Scholar] [CrossRef] [PubMed]
  9. Charbgoo, F.; Bin Ahmad, M.; Darroudi, M. Cerium oxide nanoparticles: Green synthesis and biological applications. Int. J. Nanomed. 2017, 12, 1401–1413. [Google Scholar] [CrossRef] [PubMed] [Green Version]
  10. Esch, F.; Fabris, S.; Zhou, L.; Montini, T.; Africh, C.; Fornasiero, P.; Comelli, G.; Rosei, R. Electron localization determines defect formation on ceria substrates. Science 2005, 309, 752–755. [Google Scholar] [CrossRef] [PubMed]
  11. Turner, S.; Lazar, S.; Freitag, B.; Egoavil, R.; Verbeeck, J.; Put, S.; Strauven, Y.; Van Tendeloo, G. High resolution mapping of surface reduction in ceria nanoparticles. Nanoscale 2011, 3, 3385. [Google Scholar] [CrossRef] [PubMed]
  12. Maldotti, A.; Juárez, R.; Molinari, A.; García, H. Photoinduced reactivity of Au–H intermediates in alcohol oxidation by gold nanoparticles supported on ceria. Chem. Sci. 2011, 2, 1831–1834. [Google Scholar] [CrossRef]
  13. Nelson, B.C.; Johnson, M.E.; Walker, M.L.; Riley, K.R.; Sims, C. Antioxidant cerium oxide nanoparticles in biology and medicine. Antioxidants 2016, 5, 15. [Google Scholar] [CrossRef] [PubMed] [Green Version]
  14. Bhagat, S.; Vallabani, N.V.S.; Shutthanandan, V.; Bowden, M.; Karakoti, A.S.; Singh, S. Gold core/ceria shell-based redox active nanozyme mimicking the biological multienzyme complex phenomenon. J. Colloid Interface Sci. 2018, 513, 831–842. [Google Scholar] [CrossRef] [PubMed]
  15. Grady, D.; Halloran, B.; Cummings, S.; Leveille, S.; Wells, L.; Black, D.; Byl, N. 1,25-Dihydroxyvitamin D 3 and muscle strength in the elderly: A randomized controlled trial. J. Clin. Endocrinol. Metab. 1991, 73, 1111–1117. [Google Scholar] [CrossRef] [PubMed]
  16. Herance, J.R.; García, H.; Gutiérrez-Carcedo, P.; Navalón, S.; Pineda-Lucena, A.; Palomino-Schätzlein, M.; Gutierrez, P.C. A translational approach to assess the metabolomic impact of stabilized gold nanoparticles by NMR spectroscopy. Analyst 2019, 144, 1265–1274. [Google Scholar] [CrossRef]
  17. Nayak, D.; Minz, A.P.; Ashe, S.; Rauta, P.R.; Kumari, M.; Chopra, P.; Nayak, B. Synergistic combination of antioxidants, silver nanoparticles and chitosan in a nanoparticle based formulation: Characterization and cytotoxic effect on MCF-7 breast cancer cell lines. J. Colloid Interface Sci. 2016, 470, 142–152. [Google Scholar] [CrossRef]
  18. Tanaka, M.; Kishimoto, Y.; Saita, E.; Suzuki-Sugihara, N.; Kamiya, T.; Taguchi, C.; Iida, K.; Kondo, K. Terminalia bellirica extract inhibits low-density lipoprotein oxidation and macrophage inflammatory response in vitro. Antioxidants 2016, 5, 20. [Google Scholar] [CrossRef] [Green Version]
  19. Chithrani, D.; Ghazani, A.A.; Chan, W.C.W. Determining the size and shape dependence of gold nanoparticle uptake into mammalian cells. Nano Lett. 2006, 6, 662–668. [Google Scholar] [CrossRef]
  20. Menchon, C.; Martin, R.; Apostolova, N.; Victor, V.M.; Alvaro, M.; Herance, J.R.; García, H. Gold nanoparticles supported on nanoparticulate ceria as a powerful agent against intracellular oxidative stress. Small 2012, 8, 1895–1903. [Google Scholar] [CrossRef]
  21. Della Rocca, J.; Liu, D.; Lin, W. Nanoscale Metal–Organic Frameworks for Biomedical Imaging and Drug Delivery. Acc. Chem. Res. 2011, 44, 957–968. [Google Scholar] [CrossRef] [PubMed] [Green Version]
  22. Li, H.; Yang, Z.-Y.; Liu, C.; Zeng, Y.-P.; Hao, Y.; Gu, Y.; Wang, W.-D.; Li, R. PEGylated ceria nanoparticles used for radioprotection on human liver cells under γ-ray irradiation. Free Radic. Boil. Med. 2015, 87, 26–35. [Google Scholar] [CrossRef] [PubMed]
  23. Kyosseva, S.V.; McGinnis, J.F. Cerium oxide nanoparticles as promising ophthalmic therapeutics for the treatment of retinal diseases. World J. Ophthalmol. 2015, 5, 23–30. [Google Scholar] [CrossRef]
  24. Fiorani, L.; Passacantando, M.; Santucci, S.; Di Marco, S.; Bisti, S.; Maccarone, R. Cerium Oxide Nanoparticles Reduce Microglial Activation and Neurodegenerative Events in Light Damaged Retina. PLoS ONE 2015, 10, e0140387. [Google Scholar] [CrossRef] [Green Version]
  25. Chen, B.-H.; Babu, K.S.; Anandkumar, M.; Tsai, T.; Kao, T.; Inbaraj, B.S. Cytotoxicity and antibacterial activity of gold-supported cerium oxide nanoparticles. Int. J. Nanomed. 2014, 9, 5515–5531. [Google Scholar] [CrossRef] [Green Version]
  26. Pham-Huy, L.A.; He, H.; Pham-Huy, C. Free radicals, antioxidants in disease and health. Int. J. Biomed. Sci. 2008, 4, 89–96. [Google Scholar]
  27. Asmat, U.; Abad, K.; Ismail, K. Diabetes mellitus and oxidative stress-A concise review. Saudi Pharm. J. 2015, 24, 547–553. [Google Scholar] [CrossRef] [Green Version]
  28. Lyakhovich, A.; Graifer, D. Mitochondria-mediated oxidative stress: Old target for new drugs. Curr. Med. Chem. 2015, 22, 3040–3053. [Google Scholar] [CrossRef]
  29. Lin, M.T.; Beal, M.F. Mitochondrial dysfunction and oxidative stress in neurodegenerative diseases. Nature 2006, 443, 787–795. [Google Scholar] [CrossRef]
  30. Perl, A. Oxidative stress in the pathology and treatment of systemic lupus erythematosus. Nat. Rev. Rheumatol. 2013, 9, 674–686. [Google Scholar] [CrossRef] [Green Version]
  31. Dalleau, S.; Baradat, M.; Guéraud, F.; Huc, L. Cell death and diseases related to oxidative stress: 4-hydroxynonenal (HNE) in the balance. Cell Death Differ. 2013, 20, 1615–1630. [Google Scholar] [CrossRef] [Green Version]
  32. Xiao, H.; Lü, F.; Stewart, D.; Zhang, Y. Mechanisms underlying chemopreventive effects of flavonoids via multiple signaling nodes within Nrf2-ARE and AhR-XRE gene regulatory networks. Curr. Chem. Boil. 2013, 7, 151–176. [Google Scholar] [CrossRef] [Green Version]
  33. Reinecke, F.; Smeitink, J.A.; Van Der Westhuizen, F. OXPHOS gene expression and control in mitochondrial disorders. Biochim. et Biophys. Acta (BBA) - Mol. Basis Dis. 2009, 1792, 1113–1121. [Google Scholar] [CrossRef] [PubMed] [Green Version]
  34. Casas, A.I.; Dao, V.T.-V.; Daiber, A.; Maghzal, G.J.; Di Lisa, F.; Kaludercic, N.; Leach, S.; Cuadrado, A.; Jaquet, V.; Seredenina, T.; et al. Reactive oxygen-related diseases: Therapeutic targets and emerging clinical indications. Antioxid. Redox Signal. 2015, 23, 1171–1185. [Google Scholar] [CrossRef] [Green Version]
  35. Schieber, M.; Chandel, N.S. ROS function in redox signaling and oxidative stress. Curr. Biol. 2014, 24, 1–25. [Google Scholar] [CrossRef] [PubMed] [Green Version]
  36. Hua, S.; De Matos, M.B.C.; Metselaar, J.M.; Storm, G. Current Trends and challenges in the clinical translation of nanoparticulate nanomedicines: Pathways for translational development and commercialization. Front. Pharmacol. 2018, 9, 790. [Google Scholar] [CrossRef] [PubMed]
  37. Apostolova, N.; Rovira-Llopis, S.; Asiri, A.M.; Baldovi, H.G.; Navalón, S.; Victor, V.M.; García, H.; Herance, J.R. Ceria nanoparticles with rhodamine B as a powerful theranostic agent against intracellular oxidative stress. RSC Adv. 2015, 5, 79423–79432. [Google Scholar] [CrossRef]
  38. Patel, P.; Kansara, K.; Singh, R.; Shukla, R.; Singh, S.; Dhawan, A.; Kumar, A. Cellular internalization and antioxidant activity of cerium oxide nanoparticles in human monocytic leukemia cells. Int. J. Nanomed. 2018, 13, 39–41. [Google Scholar] [CrossRef] [Green Version]
  39. Zhitomirsky, B.; Farber, H.; Assaraf, Y.G. LysoTracker and MitoTracker Red are transport substrates of P-glycoprotein: Implications for anticancer drug design evading multidrug resistance. J. Cell. Mol. Med. 2018, 22, 2131–2141. [Google Scholar] [CrossRef] [Green Version]
  40. Yang, L.; Nienhaus, G.U.; Shang, L. Mechanistic aspects of fluorescent gold nanocluster internalization by live HeLa cells. Nanoscale 2013, 5, 1537. [Google Scholar] [CrossRef]
  41. Torrano, A.; Blechinger, J.; Osseforth, C.; Argyo, C.; Reller, A.; Bein, T.; Michaelis, J.; Bräuchle, C. A fast analysis method to quantify nanoparticle uptake on a single cell level. Nanomedicine 2013, 8, 1815–1828. [Google Scholar] [CrossRef] [PubMed] [Green Version]
  42. Shah, N.B.; Dong, J.; Bischof, J.C. Cellular uptake and nanoscale localization of gold nanoparticles in cancer using label-free confocal raman microscopy. Mol. Pharm. 2010, 8, 176–184. [Google Scholar] [CrossRef] [PubMed]
  43. Schindelin, J.; Arganda-Carreras, I.; Frise, E.; Kaynig, V.; Longair, M.; Pietzsch, T.; Preibisch, S.; Rueden, C.; Saalfeld, S.; Schmid, B.; et al. Fiji: An open-source platform for biological-image analysis. Nat. Methods 2012, 9, 676–682. [Google Scholar] [CrossRef] [PubMed] [Green Version]
  44. Olson, B.J. Assays for determination of protein concentration. Curr. Protoc. Pharmacol. 2016, 73, A.3A.1–A.3A.32. [Google Scholar] [CrossRef] [PubMed]
  45. Hebbe, V.; Londez, A.; Goujon-Ginglinger, C.; Meyer, F.; Uziel, J.; Jugé, S.; Lacour, J. NMR enantiodifferentiation of triphenylphosphonium salts by chiral hexacoordinated phosphate anions. Tetrahedron Lett. 2003, 44, 2467–2471. [Google Scholar] [CrossRef]
  46. Belli, V.; Guarnieri, D.; Biondi, M.; Della Sala, F.; Netti, P.A. Dynamics of nanoparticle diffusion and uptake in three-dimensional cell cultures. Colloids Surf. B: Biointerfaces 2017, 149, 7–15. [Google Scholar] [CrossRef]
  47. Brand, M.D.; Affourtit, C.; Esteves, T.C.; Green, K.; Lambert, A.J.; Miwa, S.; Pakay, J.L.; Parker, N. Mitochondrial superoxide: Production, biological effects, and activation of uncoupling proteins. Free Radic. Boil. Med. 2004, 37, 755–767. [Google Scholar] [CrossRef]
  48. Echtay, K.S.; Roussel, D.; St-Pierre, J.; Jekabsons, M.B.; Cadenas, S.; Stuart, J.A.; Harper, J.A.; Roebuck, S.J.; Morrison, A.; Pickering, S.; et al. Superoxide activates mitochondrial uncoupling proteins. Nature 2002, 415, 96–99. [Google Scholar] [CrossRef]
  49. Brand, M.D.; Esteves, T.C. Physiological functions of the mitochondrial uncoupling proteins UCP2 and UCP3. Cell Metab. 2005, 2, 85–93. [Google Scholar] [CrossRef] [Green Version]
  50. Satoh, J.-I.; Kawana, N.; Yamamoto, Y. Pathway analysis of ChIP-Seq-based NRF1 target genes suggests a logical hypothesis of their involvement in the pathogenesis of neurodegenerative diseases. Gene Regul. Syst. Boil. 2013, 7, 139–152. [Google Scholar] [CrossRef] [Green Version]
  51. Biswas, M.; Chan, J.Y. Role of Nrf1 in antioxidant response element-mediated gene expression and beyond. Toxicol. Appl. Pharmacol. 2009, 244, 16–20. [Google Scholar] [CrossRef] [PubMed] [Green Version]
  52. Kim, H.M.; Han, J.W.; Chan, J.Y. Nuclear Factor Erythroid-2 Like 1 (NFE2L1): Structure, function and regulation. Gene 2016, 584, 17–25. [Google Scholar] [CrossRef] [PubMed]
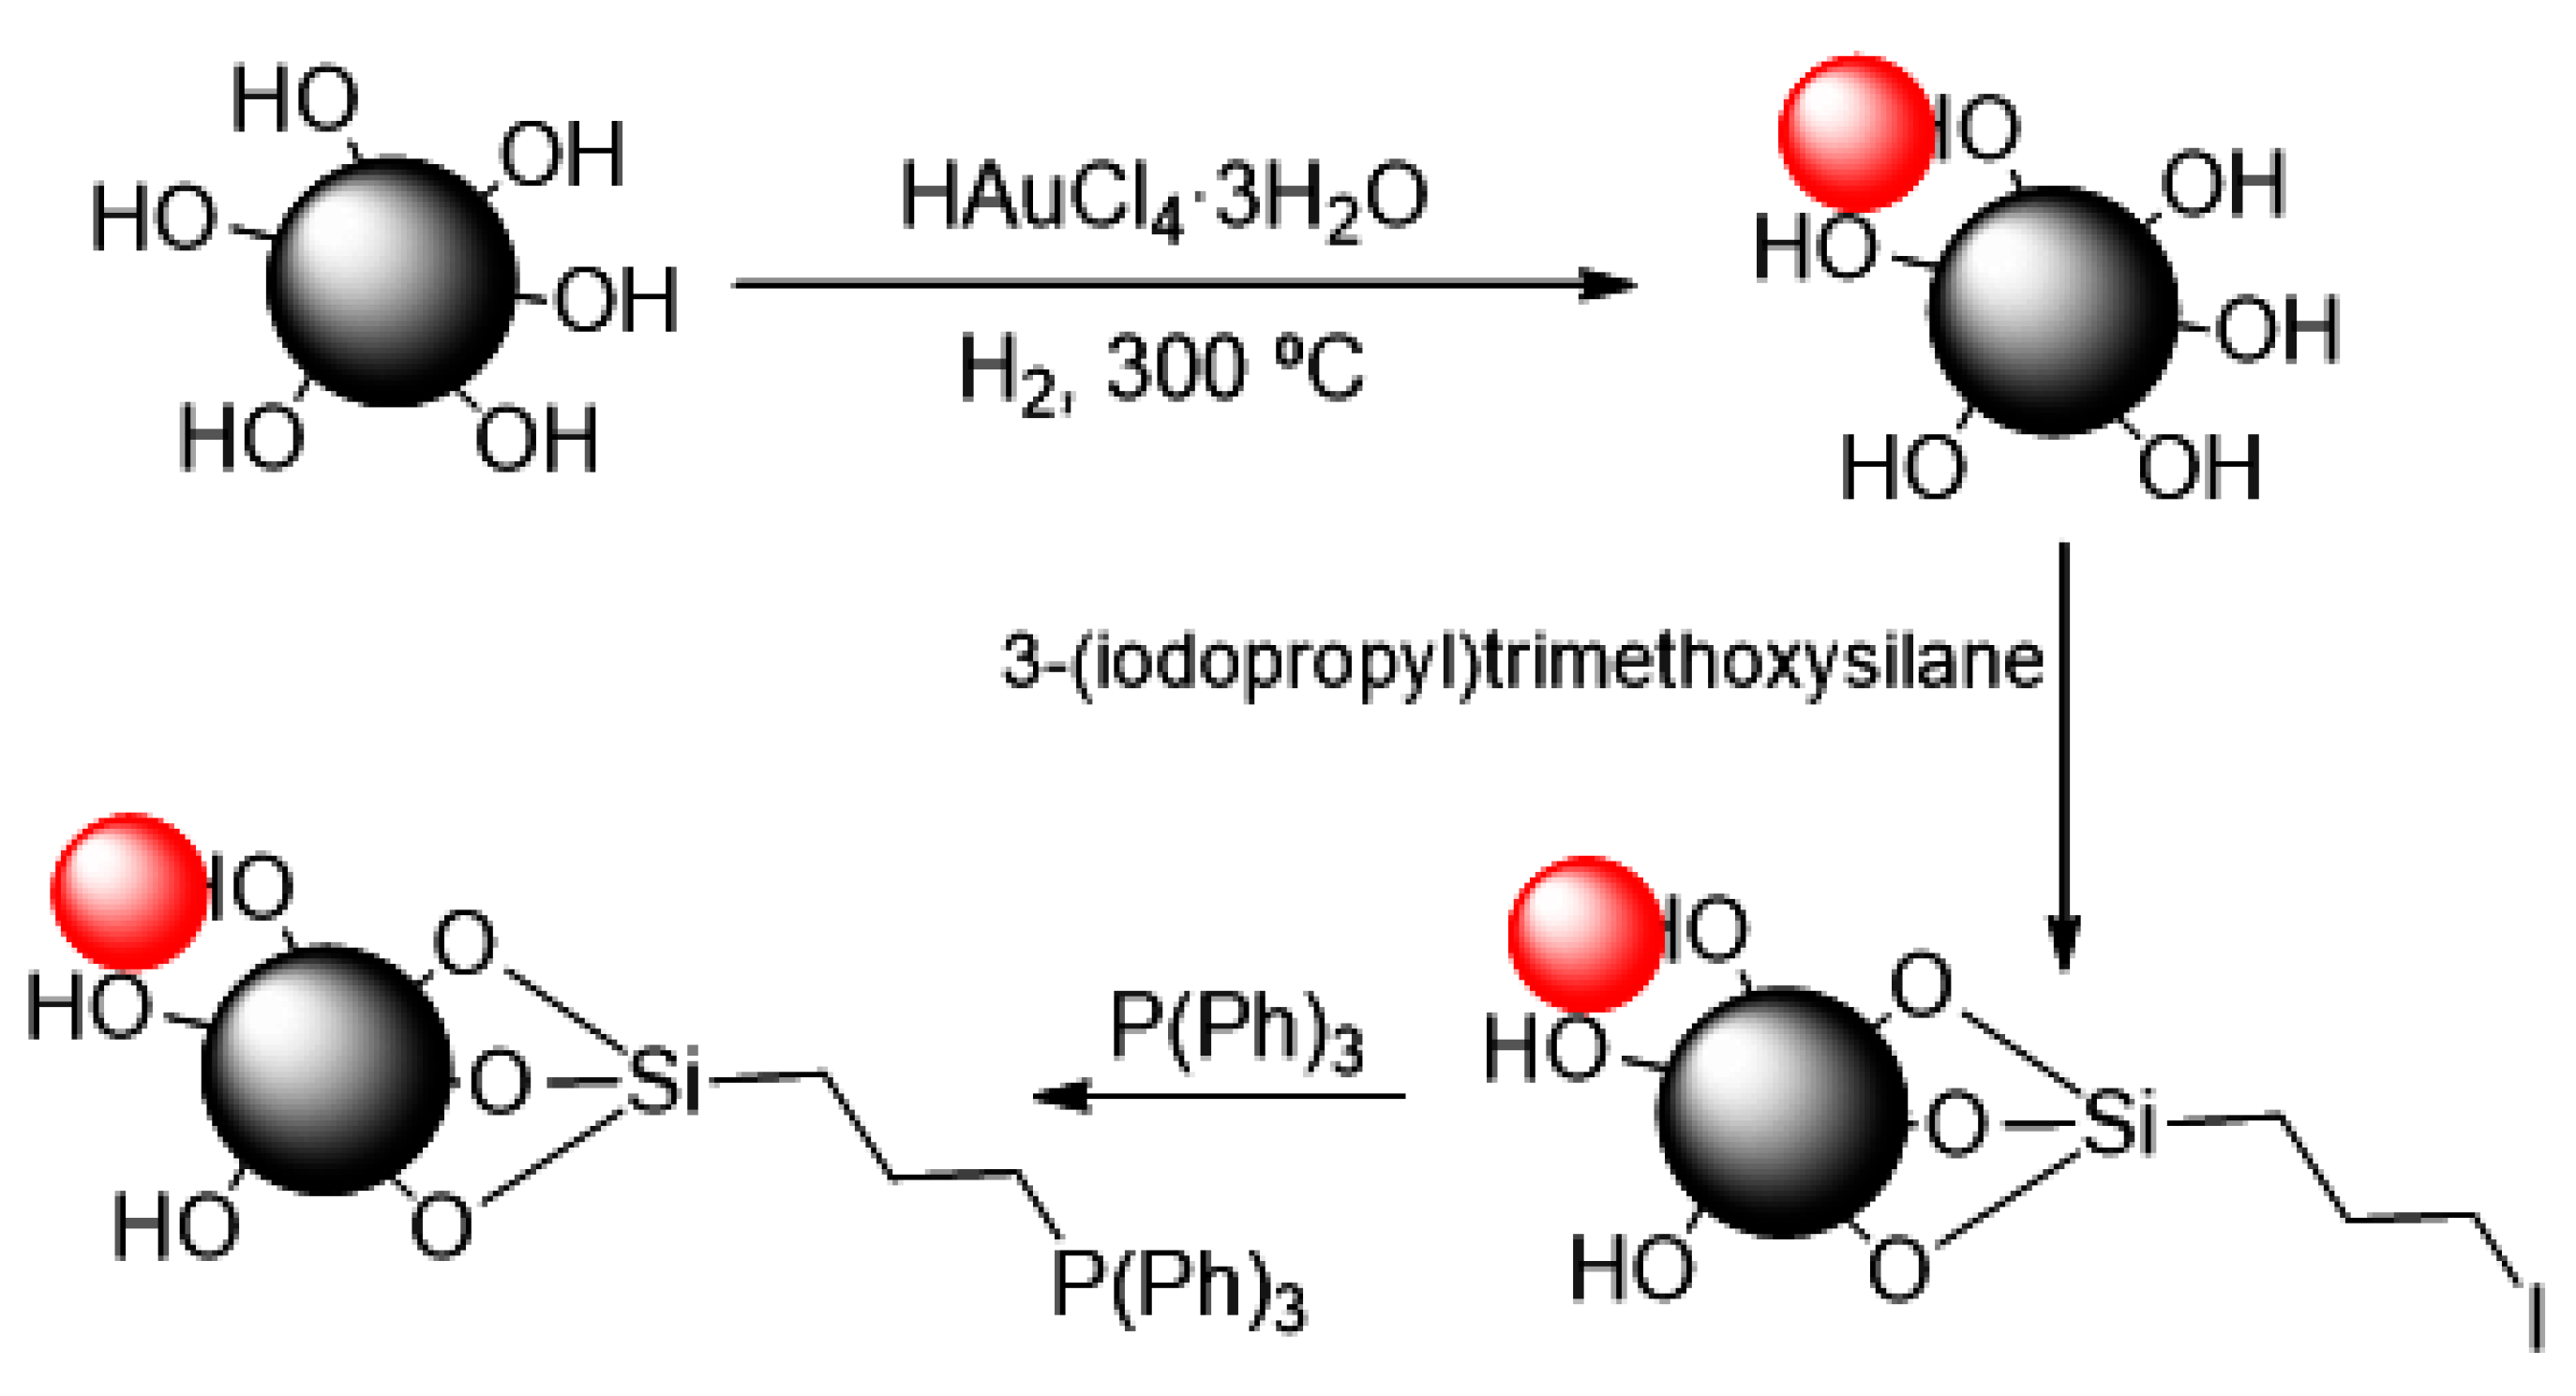
Scheme 1. Synthetic route to obtain AuCeO2 and TPP–AuCeO2 from CeO2 (dark sphere). Au and CeO2 NPs are represented as red and grey spheres, respectively.
Nanomaterials 10 00744 sch001
Figure 1. FT-IR spectra of some reagents employed to obtain TPP–AuCeO2. (A) PPh3, (B) Si(MeO)3–propyl–I, (C) CeO2, (D) AuCeO2, (E) I–AuCeO2, and (F) TPP–AuCeO2. The main bands employed to identify different functional groups are labelled in the spectra.
Nanomaterials 10 00744 g001
Figure 2. Dynamic light scattering spectra, hydrodynamic size and the zeta potential, of NPs. Analysis of (A) CeO2 (105.7 nm and −32.1 mV), (B) AuCeO2 (139.2 nm and −29.2 mV) and (C) TPP–AuCeO2 (216.0 nm and −10.3 mV) performed in water.
Nanomaterials 10 00744 g002
Figure 3. Solid-state 31P-NMR spectrum of TPP–AuCeO2 confirming the presence of the TPP group in TPP–AuCeO2.
Nanomaterials 10 00744 g003
Figure 4. In vivo confocal microscopy images of cellular uptake of AuCeO2 and TPP–AuCeO2 (20 µg/mL) in HeLa cells after 24h incubation.(A) Blue (Hoechst) to label the nucleus; (B) Green (CellMaskTM) to label the cell membrane; (C) Red (MitoTrackerTM) to label the mitochondrial; (D) light reflection of NPs at 633 nm (white spots, indicating the location by yellow arrow); and (E) colocalization of the cells and the NPs, showing the internalization of these NPs in both treatments (merged). (Scale bar = 20 µm).
Nanomaterials 10 00744 g004
Figure 5. Physiological parameters associated with mitochondrial function. (A) Mitochondrial O2 consumption of HeLa cells measured in a Clark-type O2 electrode, (B) ∆Ψm measured with the TMRM probe, (C) cellular ROS content measured with the DCFH-DA probe, and (D) ATP content measured with the luciferase method after 24 h of treatment with vehicle (control) or CeO2, AuCeO2, and TPP–AuCeO2 at 20 µg/mL. Data are presented as mean ± SEM * p < 0.05 versus control group 24 h; ** p < 0.01 versus control group 24 h. ## p < 0.01 versus CeO2.
Nanomaterials 10 00744 g005
Figure 6. RT-PCR and WB analysis of NRF1 and NFE2L1. Genes expressions of NRF1 (A) and NFE2L1 (B). Effects on the expression of both genes related to mitochondrial function in HeLa cells after 24h of treatments with CeO2, AuCeO2 and TPP–AuCeO2 (20 µg/mL) and vehicle (control). GAPDH gene expression was used as an endogenous control. Data are presented as mean ± SEM (n = 3). * p < 0.05 versus control group; ** p < 0.01 versus control group 24 h. # p < 0.05 versus CeO2. # p < 0.05 versus CeO2; ## p < 0.01 versus CeO2. Protein levels of: NRF1 (C) (67 kDa), and NFE2L1 (D) (85 kDa). ACTIN (45 kDa) was used as an endogenous control. Data are showed as mean ± SEM (n = 3). * p < 0.05 versus control.
Nanomaterials 10 00744 g006