Article

On the Effects of Diluted and Mixed Ionic Liquids as Liquid Substrates for the Sputter Synthesis of Nanoparticles

Materials Discovery and Interfaces, Institute for Materials, Faculty of Mechanical Engineering, Ruhr University Bochum, Universitätsstr. 150, D-44780 Bochum, Germany
*
Author to whom correspondence should be addressed.
Nanomaterials 2020, 10(3), 525; https://doi.org/10.3390/nano10030525
Submission received: 20 February 2020 / Revised: 9 March 2020 / Accepted: 12 March 2020 / Published: 14 March 2020

Abstract

:
The synthesis of nanoparticles by combinatorial sputtering in ionic liquids is a versatile approach for discovering new materials. Whereas the influence on nanoparticle formation of different pure ionic liquids has been addressed, the influence of (I) dilution of ionic liquid with solvents and (II) different mixtures of ionic liquids is less known. Therefore, mixtures of the ionic liquid [Bmim][(Tf)2N] with the organic solvent anisole and other ionic liquids ([Bmim][(Pf)2N], [BmPyr][(Tf)2N]) were used as liquid substrates for the sputter synthesis of nanoparticles, in order to investigate the influence of these mixtures on the size of the nanoparticles. First, mixtures of anisole with a suspension of sputtered Ag nanoparticles in [Bmim][(Tf)2N] were prepared in different volumetric steps to investigate if the stabilization of the NPs by the ionic liquid could be reduced by the solvent. However, a continuous reduction in nanoparticle size and amount with increasing anisole volume was observed. Second, Ag, Au and Cu were sputtered on ionic liquid mixtures. Ag nanoparticles in [Bmim][(Tf)2N]/[Bmim][(Pf)2N] mixtures showed a decrease in size with the increasing volumetric fraction of [Bmim][(Tf)2N], whereas all nanoparticles obtained from [Bmim][(Tf)2N]/[BmPyr][(Tf)2N] mixtures showed increasing size and broadening of the size distribution. Maximum sizes of sputtered Ag and Au NPs were reached in mixtures of [Bmim][(Tf)2N] with 20 vol.% and 40 vol.% [BmPyr][(Tf)2N]. The results indicate that ionic liquid mixtures with different portions of cations and anions have the capability of influencing the ionic liquid stabilization characteristics with respect to, e.g., nanoparticle size and size distribution.

1. Introduction

Ambits of metal nanoparticles (NPs), like catalysis [1,2,3,4], medical applications [5,6,7,8] and as additives in electrolytes [9,10,11], show their technological and scientific significance. For enabling applications of sputtered NPs in ionic liquids (ILs), studies of their stabilization procedure and possible improvements thereof, including tuning capabilities concerning their formation, are necessary. The most common technique for NP synthesis in a liquid environment is the wet chemical approach using metal precursors which are decomposed or reduced by chemical reactions [12,13,14,15,16]. However, this approach can have the drawback of byproducts remaining in the final NP solution from the mentioned reactions which can affect the NP size [17] and the general applicability of the NPs [18,19]. The physical vapor deposition of metals in ionic liquids (ILs) [18,20,21,22,23,24,25] where ILs [26,27] serve as a liquid “substrate” can avoid these drawbacks. ILs are liquid salts consisting of appropriate cations and anions with melting points at temperatures <100 °C. Many ILs are liquid at room temperature [28]. Due to the high number of suitable cations and anions, for enabling the theoretical fabrication of 1018 ILs [29], a task-specific IL can be designed for nearly every desired application. Since ILs have a negligible vapor pressure [27,30,31], they are frequently used as substrate or solvents for ultrahigh vacuum and green chemistry processes [32]. Additionally, the outstanding chemical and physical characteristics of ILs make them ideal for applications in catalysis [33] and as scavenging and reaction media for industry [34].
One physical vapor deposition synthesis route is the thermal evaporation of a metal on the surface of an IL [20,21,22]. However, the synthesis of binary or higher order NPs with this method is complicated. Since each element has its specific evaporation temperature and vapor pressure, an adjustment of a desired alloy composition is challenging [24]. The sputter deposition of metals in ILs [18,23,24,25] is an alternative physical vapor deposition synthesis pathway, permitting the fabrication of custom-designed multinary NPs. These can be synthesized with adjustable multinary composition and crystal structure, depending on the used sputter technique [35]. The chosen IL substrate for the sputter deposition controls the size and morphology of the NPs, but without the harm of (organic) impurities or byproducts [18,19]. One advantage of sputter and co-sputter depositions is that multinary systems in form of forced solid solutions can be fabricated, even when the elements are immiscible in bulk [36]. The tunable multinary NP composition, which enables the synthesis of tailored NPs for specific applications, is controlled by the deposition rates of the specific sputter sources [24,37], also influencing the NP growth process [38,39]. Additionally, sputter deposition is not limited by the availability of precursor chemicals or their reaction pathway, since, in principle, all vacuum compatible elements can be combined into multinary NPs by co-sputtering [23,24,25].
Sizes and size distributions of the NPs, which are further important characteristics for the fabrication of task-designed NPs, are mainly controlled by the used IL, as the structure of the IL ions controls the NP stabilization. Since the NP surface is known to have a lack of electrons [40,41], the negatively charged anions of an IL electrostatically form a first layer around the NP surface, which is then surrounded by the opposite charged cation of the IL. Thus, a protective double layer of IL ions around the NPs is developed [42,43]. The same charge of the surrounding protective layers leads to an electrostatic repulsion between the surrounded NPs, preventing agglomeration. Additionally, a steric stabilization occurs: Its strength depends on the coverage of the NPs with cations, having an alky chain dangling away from the NP surface [42,43]. The alkyl chains act as a protective cage, preventing the physical contact of the NPs by sort of pushing approaching NP cages away and impeding chemical bonds. The caged NPs are thus incorporated by a semi-organized nanostructure existing around the electric double layer cage into the IL network. This network is formed by electrostatic interactions and hydrogen bonds between the single IL ions [44], making the NPs movable within the IL but prevented from agglomeration [42]. The NP size depends on several structural and electrostatic characteristics of the IL ions being responsible for the strength of the NP cage and the general formation process during sputter deposition. Several publications report that an increasing alkyl chain length of the cations is directly linked to a decreasing NP diameter and size distribution, since longer alkyl chains increase the organization range of the specific IL and thus better prevent the caged NP from making physical contact [19,42,45]. Additionally, increasing the volume of the used IL anion is correlated with an increasing of the NP diameters stabilized in the specific ILs [46,47]. This effect occurs because the charge distributed over the anion stays constant (one elemental charge) and, thus, the charge density distributed over the anion decreases if the anion volume increases. Therefore, a weakening of the first stabilization shell of the NP cage due to reduced electrostatic forces occurs. Because of this reduction in the charge density in the case of increasing anion volumes, the IL organization and stabilization ability is reduced [48].
These stabilization factors mainly work inside the IL “bulk”. However, for the general nucleation and growth process of sputtered NPs on IL, the first interactions with the IL surface are considered to be the most important for the NP size [19,49]. Factors like surface structure, surface composition and ion orientation at the surface, macroscopically compiled into IL surface tension and viscosity [49], do also depend on the specific IL ion structures and interactions [50]. For example, it is assumed that the surface tension of the IL is directly correlated to the time the NPs spend on the IL surface and thus can grow due to further incoming atoms before being immersed into the IL “bulk” [19,49]. The viscosity is assumed to affect the subsequent behavior of the NPs within the IL, concerning possible aggregation and agglomeration due to the specific diffusion velocity [19].
By applying this information about stabilization factors and growth processes for the choice of the specific IL, the targeted NP size and size distribution can be reliably controlled. However, each IL seems to have a limit for stabilized NP sizes [23]. The size of sputtered NPs in ILs is typically <10 nm [23,24,25,51,52].
For some applications and for the purpose of in-depth studies it would be desirable to be able to achieve NP sizes up to several tens of nanometers. Here, we investigate if it is possible to destabilize the NP cage in a controlled way so that the NPs can grow bigger than the actual stabilization limit of a pure IL would allow. To this end, we destabilized the IL 1-butyl-3-methylimidazolium bis-(trifluoromethylsulfonyl)imide [Bmim][(Tf)2N] with anisole as an organic solvent and with two other ILs. Anisole, as a diluting solvent, was chosen since it is well solvable in ILs and does not destroy the ILs [53]. The used ILs 1-butyl-3-methylimidazolium bis-(perfluoroethylsulfonyl)imide [Bmim][(Pf)2N] and 1-butyl-1-methylpyrrolidinium bis-(trifluoromethylsulfonyl)imide [BmPyr][(Tf)2N] have been chosen so that only one ion, for [Bmim][(Pf)2N] the anion and for [BmPyr][(Tf)2N] the cation, differs from [Bmim][(Tf)2N], to investigate only the effects caused by one structural change, as depicted in Figure 1.
IL mixtures have been applied in the past for testing their general characteristics [54,55,56,57] as improved electrolyte for solar cells [58] and as stabilization matrices for NPs [59,60] and carbon nanotubes [61]. IL mixtures showed improved characteristics, like increased conductivity [54], gas solubility [56] and power conversion efficiencies [58] with respect to pure ILs. However, the application of IL mixtures as substrates for NP synthesis by sputter deposition to influence the NP size distribution has not been conducted so far. Our sputter setup allows simultaneous sputtering in four different binary IL mixtures in one experiment. Thus, identical deposition parameters are achieved for each mixture, and the obtained results can be directly correlated to the specific volumetric IL mixtures. The success of our approach of sputtering on clean, unused IL mixtures as a new method for targeted NP size control and for understanding the general NP formation processes in the ILs is confirmed by our results. Thus, we want to emphasize the suitability of sputtering on IL mixtures as new synthesis method for targeted NP size tuning.

2. Materials and Methods

The description of the synthesis routes is divided into sputter-deposition in IL mixtures and the dilution of the already-sputtered Ag in IL with anisole, since the mixture procedure was different. The TEM grid preparation was identical for all samples. ILs were purchased from Iolitec (Heilbronn, Germany) and stored and processed under Ar atmosphere in a glovebox with water and oxygen contents <0.5 ppm; no further purification was performed. Anisole was purchased from Acros Organics (Geel, Belgium). The characteristics of the chemicals are listed in Table 1. For simplification, the IL names are abbreviated as IL1 for [Bmim][(Tf)2N], IL2 for [Bmim][(Pf)2N] and IL3 for [BmPyr][(Tf)2N] (see Figure 1).

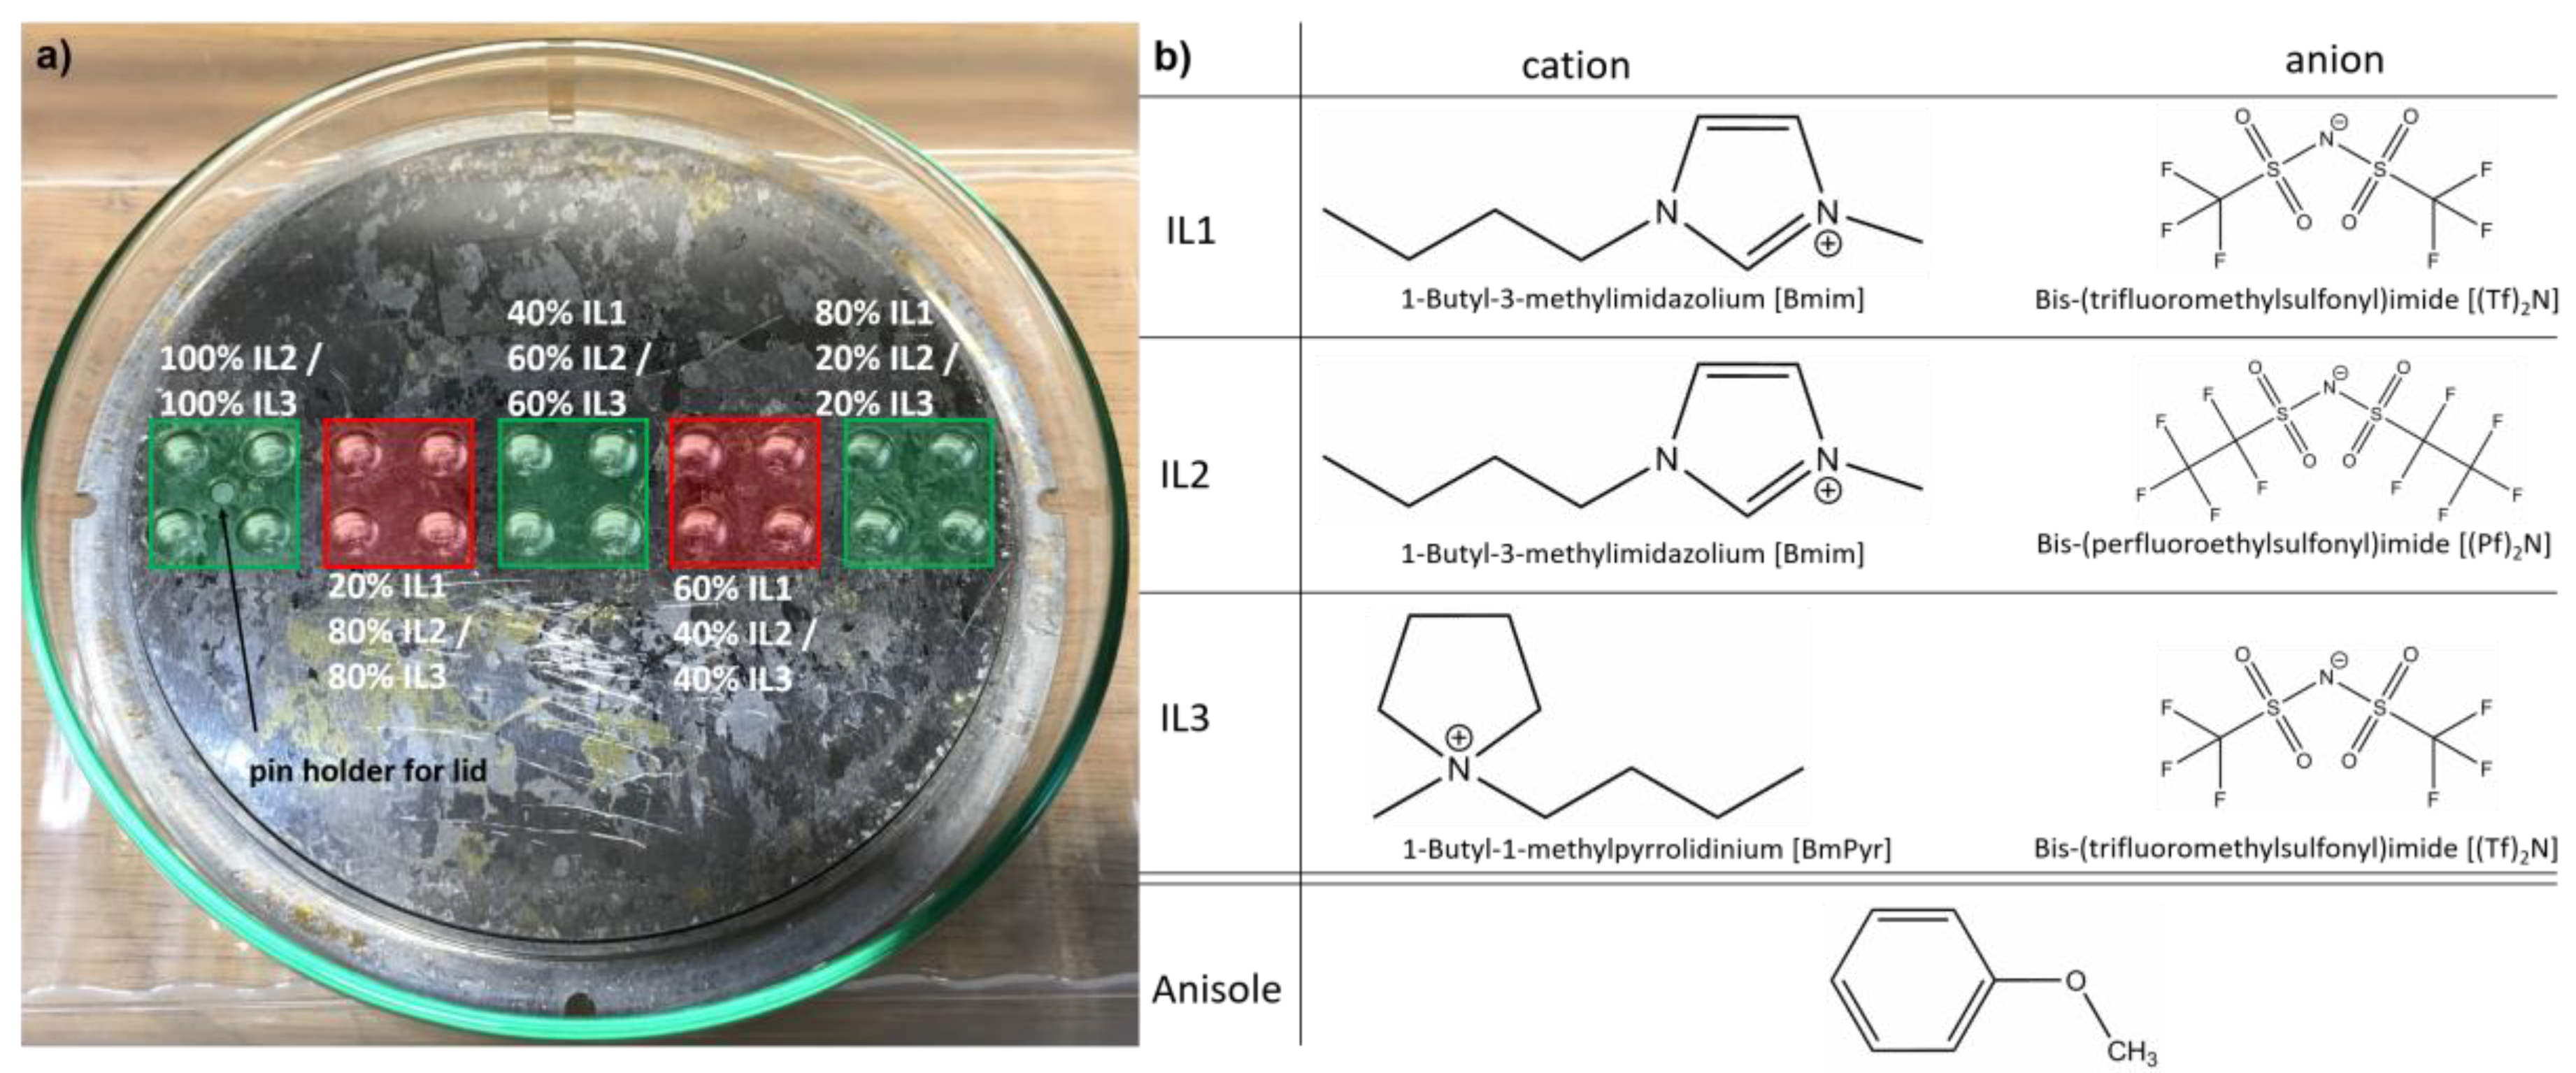
2.1. Depositions of Ag, Cu, Au into IL and IL Mixtures

Sputter depositions were performed in a commercial co-sputter system (AJA POLARIS-5 from AJA INTERNATIONAL, Inc., North Scituate, MA, USA) with 1.5-inch diameter magnetron sputter cathodes and multiple sputter source DC power supplies (DC-XS 1500 from AJA INTERNATIONAL, Inc., North Scituate, MA, USA). Ar was used as processing gas (purity 99.999%, Praxair, Düsseldorf, Germany). An Ag target (Sindlhauser Materials, Kempten, Germany), an Au target (Sindlhauser Materials, Kempten, Germany) and a Cu target (EvoChem, Offenbach am Main, Germany), all with the dimensions 38.1 mm diameter × 4.775 mm thick and purity 99.99%, were used. A custom-made cavity plate with an adaptable lid for covering unfilled cavities (see Figure 1) was used to expose the IL mixtures to the sputter flux (for details, see Meyer et al. [23]). The plate and lid were cleaned in an ultrasonic bath (30 min in technical acetone (purity 99.5%) and isopropanol (purity 99.7%), respectively) and dried in an oven at 80 °C for 60 min. An amount of 35 μ L IL (mixture) was filled in each used cavity for all depositions in the glovebox. Pure IL2 and IL3 were filled in a square array of four cavities located around the pin holder for the lid (see Figure 1). Since the “dilution” of IL2 and IL3 with the “diluting” IL1 was performed in 20 vol.% steps, which corresponds to 7 μ L for 35 μ L total volume per cavity, the next array of four cavities was filled with 28 μ L IL2/IL3 and 7 μ L IL1. This procedure was continued for the next three steps until a mixture of 7 μ L IL2/IL3 and 28 μ L IL1 was present in each of the four cavities of the last cavity array group (see Figure 1). All IL mixing and IL loading procedures into the cavity plate were conducted at room temperature (i.e., around 22 °C) in a glovebox. For analysis of pure IL2 and IL3 characteristics for Ag NPs, the TEM data from our previous publication of Ag sputtered in nine different ILs were used [23]. For the analysis of the pure IL1 characteristics for Au and Cu NPs, the TEM data of a previous publication concerning binary Au-Cu NPs synthesized from unary Au and Cu NPs in IL were used [25].
Before all depositions, the specific IL (mixture) was evacuated in the sputter chamber for at least 72 h to remove remaining water and oxygen, which could be present in the IL or could originate from the transport out of the glovebox positioned opposite the sputter chamber into the chamber, which takes around 10 s. Although no active mixing of the IL mixtures within the cavities was applied, the long evacuation time and the liquid movement due to Brownian motion and water and oxygen bubbles during outgassing are considered to contribute to a homogeneous mixture of the mixed ILs. After plasma ignition (see Table 2 for parameters), the targets were pre-cleaned for 120 s with a closed shutter in front of the cathodes, a plate rotation of 30 rotations per min and a continuous reduction in the Ar pressure to the deposition pressure. The pre-cleaning process removes possible oxide layers from the target surface [23,25]. Since Cu is the least noble of the chosen elements, the specific pre-cleaning time was doubled. After finishing pre-cleaning, the power was set to the specific deposition value and the shutter in front of the cathode was opened for the desired deposition time. The element-specific deposition rates led to different nominal film thicknesses (see Table 2). A film thickness of around 500 nm was intended to achieve sufficient NPs in the IL. The slightly lower film thickness of Au compared to the other elements is related to the price of the Au target and is justifiable with respect to the comparability of the results of the other depositions since the deposition time and thus the film thickness is known to only affect the NP concentration, not the NP size [18,49]. The cathode tilt was adjusted before opening the shutters to an angle of 12° between the normal of the cavity holder and the target normal. Rotation and cathode tilt lead to a homogenous deposition on the substrate. After each deposition, the plate with IL was transferred immediately into Ar atmosphere in the glovebox and the IL was collected and stored there. Whereas the pure ILs are colorless, the NP/IL suspensions showed colors: Au NPs generated a black color with a ruby-colored undertone, whereas Cu NPs caused a black-brown IL color. Ag NPs generated a yellow color in IL1 and IL2 and an orange color in IL3. No clear color development from yellow to orange was visible in IL1/IL3-mixtures for Ag NPs. All mixtures remained mainly yellow.

2.2. Dilution of Already-Sputtered Ag in IL1 with an Organic Solvent

Ag was sputtered in IL1 as initial state for the experiment since anisole would evaporate before the required sputter pressure in the chamber was reached. Thus, sputter deposition in an IL-anisole mixture is impossible. To overcome this obstacle, Ag NP/IL1 suspension was filled under Ar atmosphere and at room temperature into Schlenk flasks for further processing. The desired dilution steps are identical to the IL dilution steps but with a bigger total volume of 100 μ L : i.e., four Schlenk flasks were prepared with Ag IL volumes from 80 μ L to 20 μ L in 20 μ L steps and equipped with a magnetic stir bar. The flasks were closed under Ar atmosphere for transport out of the glovebox and connected to a Schlenk line. The specific anisole volume to reach 100 μ L total liquid volume was filled into the Schlenk flasks under an Ar counter stream via the Schlenk line. After the addition of anisole, the flasks were closed again, and the mixture was stirred for 60 min at 180 rotations per minute in Ar. After mixing, the closed Schlenk flasks were sluiced into the glovebox for storage.

2.3. TEM Sample Preparation and Analysis

TEM samples were prepared by dropping 2.5 μL IL (mixture) on the carbon-coated side of holey carbon-coated Au grids (200 mesh, Plano GmbH, Wetzlar, Germany) and leaving the IL at this side for adhesion of NPs for 2.5 h. In order to prevent grid contamination, which could originate from the interaction of the electron beam with IL during TEM, the grids were washed dropwise with dried acetonitrile for 1 h in inert conditions (see supporting information of Meyer et al. [23]) and then stored in Ar atmosphere. Grids were prepared for pure IL1 samples and all mixtures. For analysis of Ag in pure IL2 and IL3, the data of our previous study of Ag in nine different ILs [23] and, for Au and Cu in pure IL1, the data of the previous study concerning binary Au-Cu NPs in ILs [25], were re-analyzed for NP counts. In the previous studies, the grids were turned upside down before washing with acetonitrile. Tests with other samples revealed that the difference in mean NP diameter between turned and unturned grid is 0.1 nm for the value itself as well as the error. Thus, we consider this slight difference in sample preparation as negligible. Conventional TEM and high-resolution TEM (HRTEM) studies were performed using a FEI Tecnai F20 S/TEM instrument operated at 200 kV. For the mean diameter calculation and the size distribution determination, at least 240 NPs per sample were counted.

3. Results

3.1. Mixture of Ag/IL1 Suspension with Anisole

The NP size and size distribution in the IL1/anisole mixtures were analyzed by TEM, see Figure 2. The size of Ag NPs in pure IL1 was ( 5.4 ± 2.1 ) nm. The crystallinity of these NPs was confirmed by lattice fringes visible in HRTEM images, providing also information of a face centered cubic (fcc) structure by Fast Fourier Transformation (FFT) analysis of the image data. Since the amorphous carbon support of the TEM grid also contributes with diffuse rings with high intensities in the pattern to electron diffraction measurements, the determination of the NP crystal structure via diffraction in TEM is difficult. With increasing anisole volume, a significant reduction in NP amount and NP size was observed. Additionally, a constant decrease in the number of crystalline NPs was detected. Due to this substantial reduction in NP amount and size (see Figure 2), no further NP counting was performed.

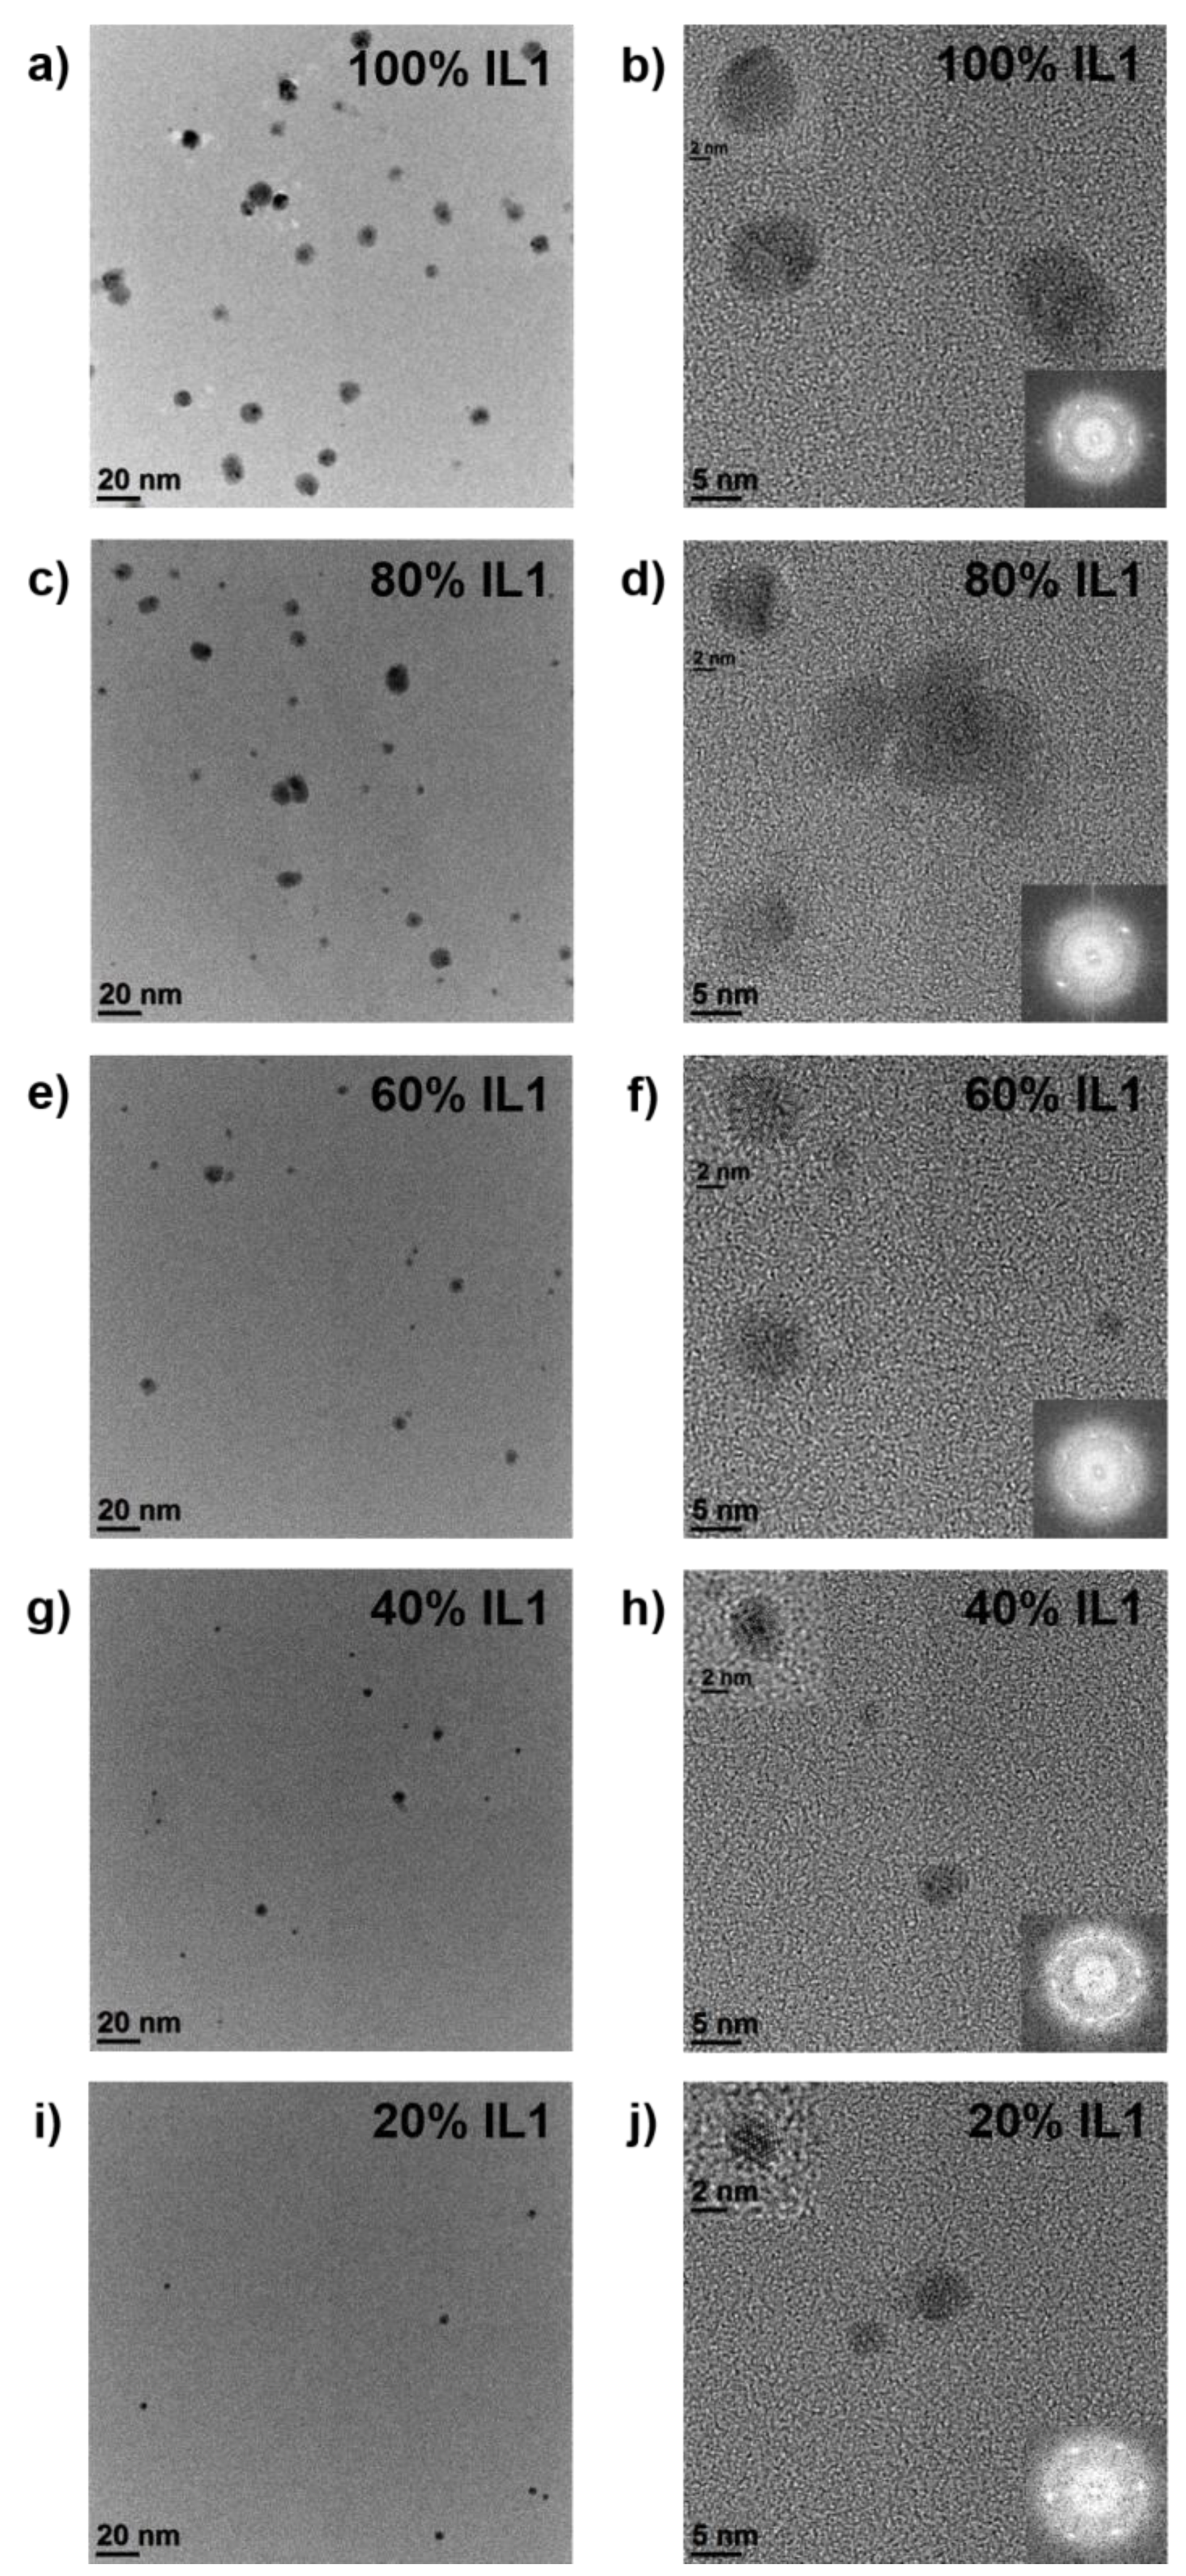
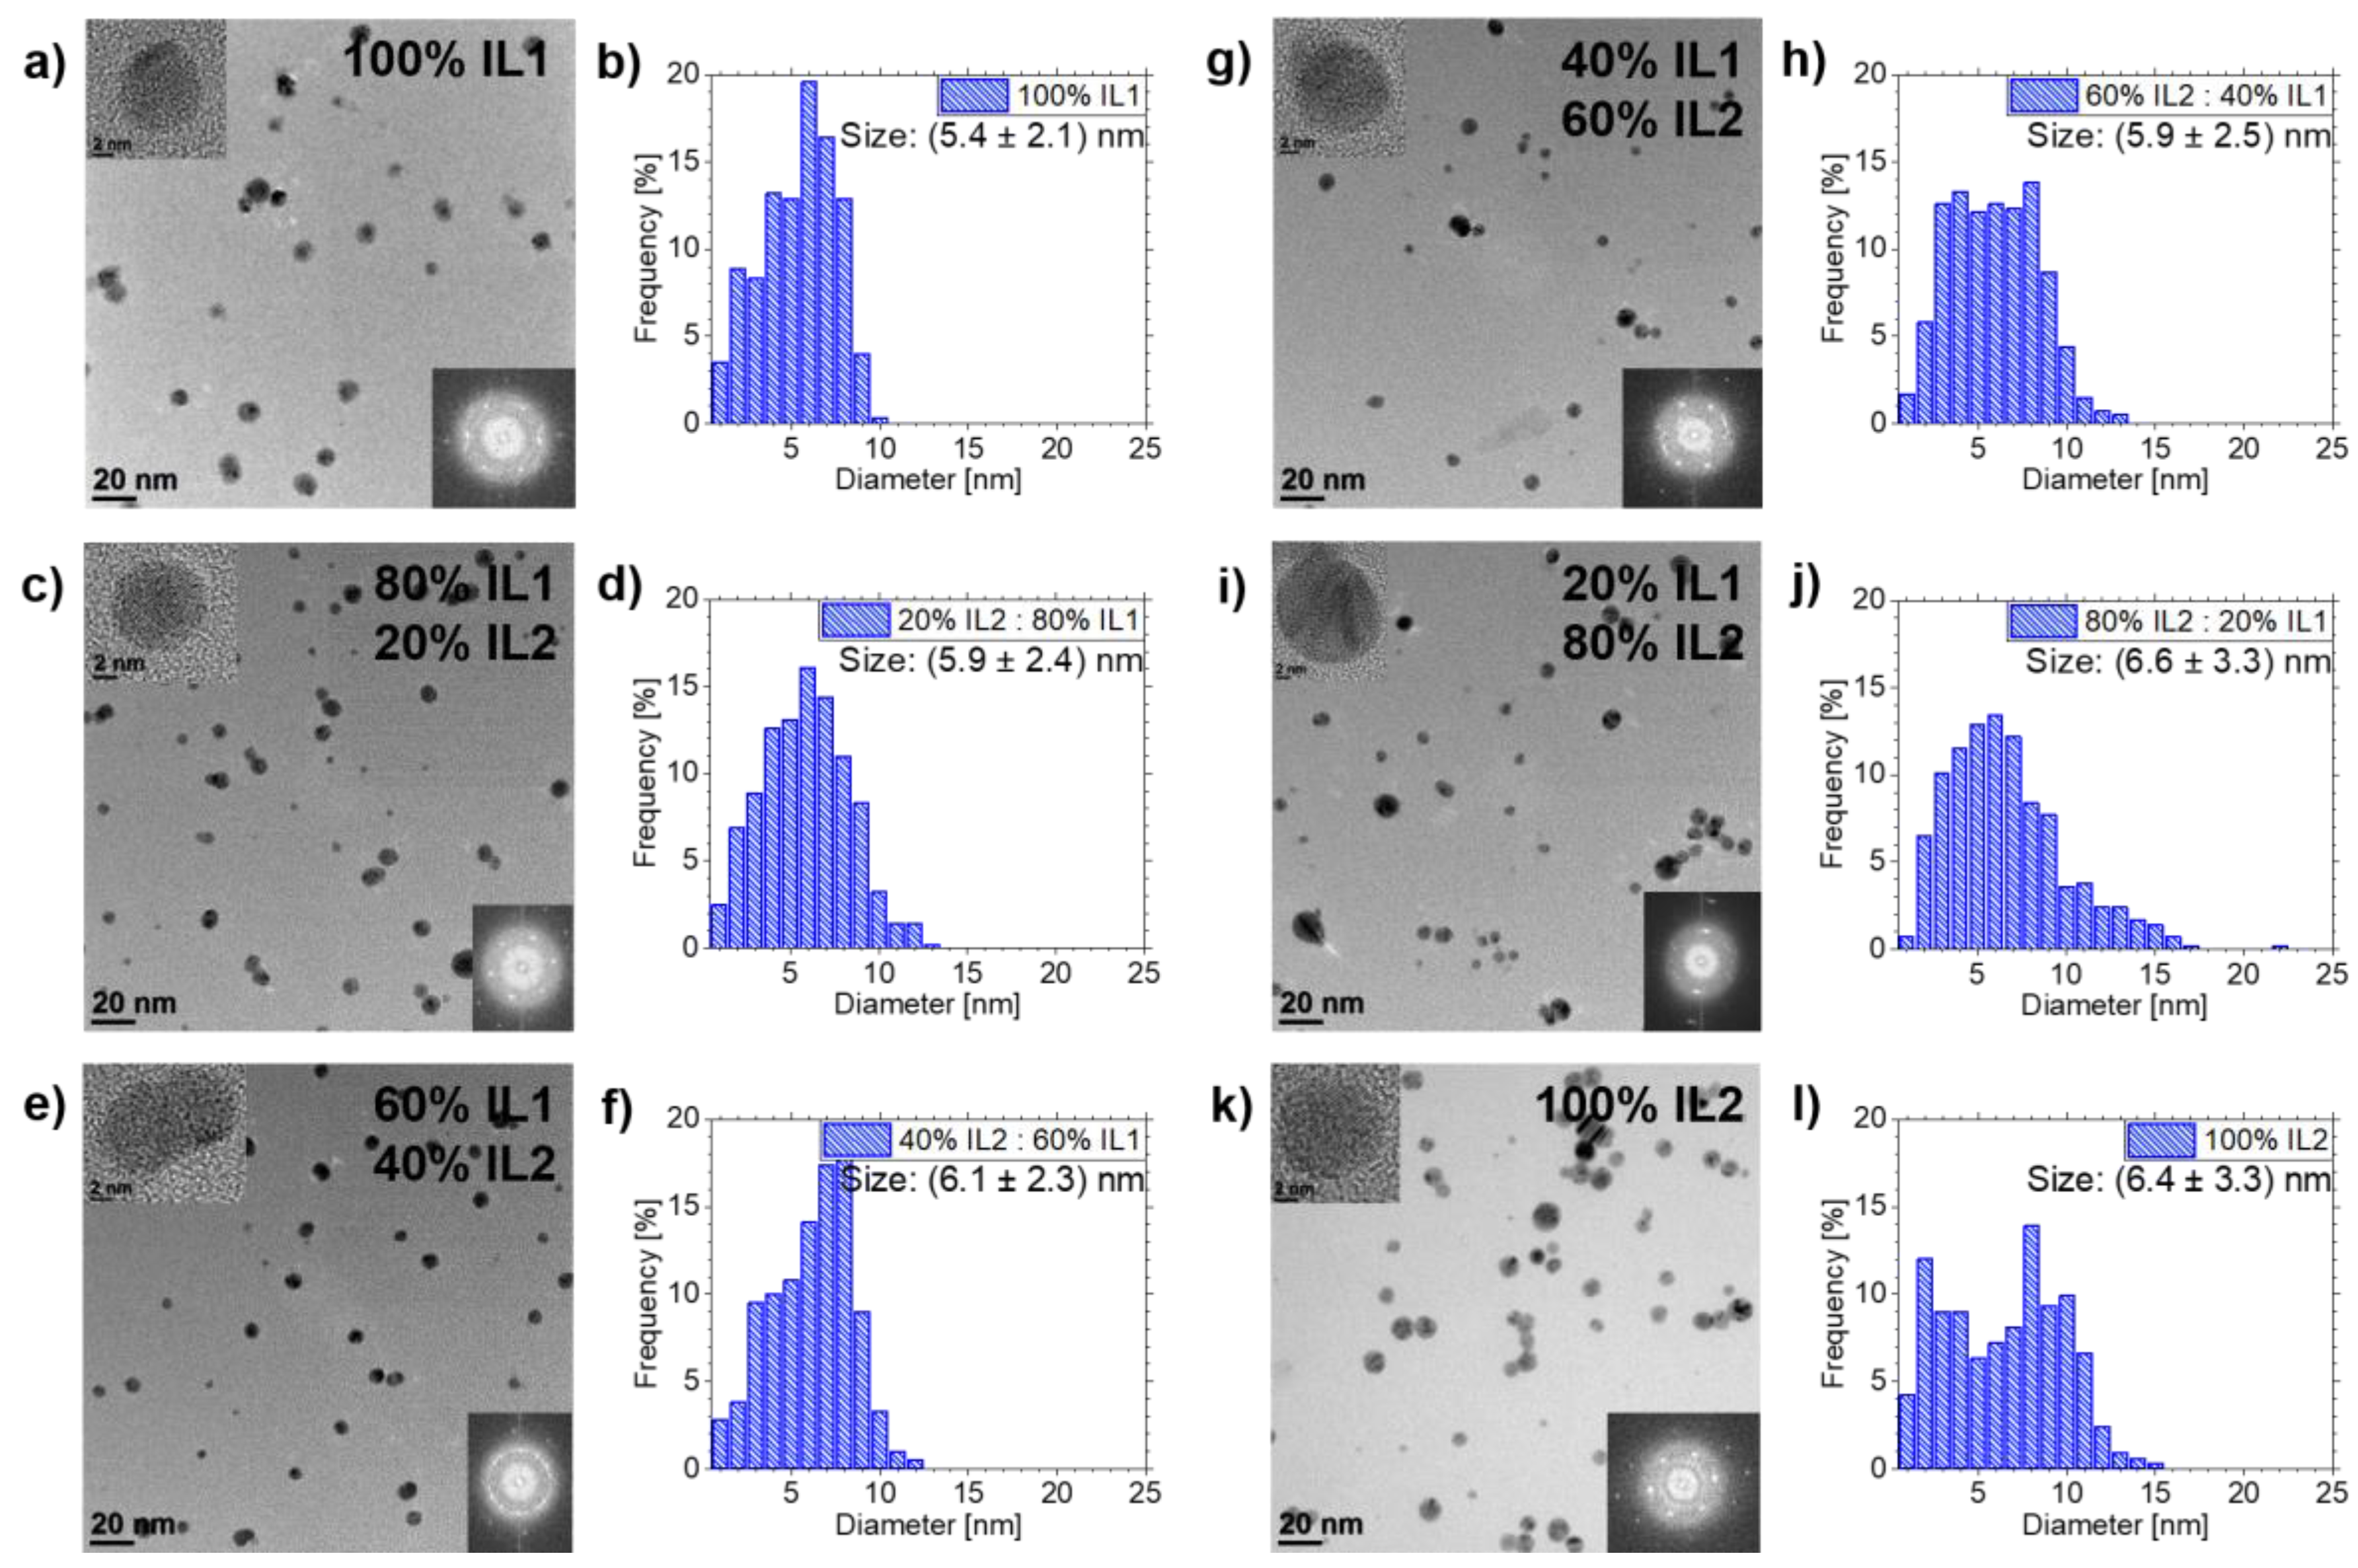
3.2. Ag NPs Sputtered in IL1/IL2-Mixtures

Using the above-described NP size analysis procedure, Ag NPs sputtered in IL1/IL2-mixtures were investigated. NP stabilization was successful in pure ILs and in all mixtures, see Figure 3. The Ag NPs showed fcc structure, as determined by analyzing FFT data of HRTEM images.
The mean sizes of the Ag NPs with increasing volumetric portion of IL2 are as follows: Starting with ( 5.4 ± 2.1 ) nm for pure IL1, the NP diameter increases to ( 5.9 ± 2.4 ) nm for 80 vol.% IL1/20 vol.% IL2, ( 6.1 ± 2.3 ) nm for 60 vol.% IL1/40 vol.% IL2, ( 5.9 ± 2.5 ) nm for 40 vol.% IL1/60 vol.% IL2, ( 6.6 ± 3.3 ) nm for 20 vol.% IL1/80 vol.% IL2 and ( 6.4 ± 3.3 ) nm for pure IL2. Additionally, the size distribution broadens with increasing IL2 fraction towards bigger NPs with respect to pure IL1. The biggest NP for pure IL1 has a diameter of 10 nm, whereas the biggest NP for pure IL2 has a diameter of 15 nm. The biggest NPs (22 nm diameter) in this mixture were detected for 20 vol.% IL1/80 vol.% IL2.

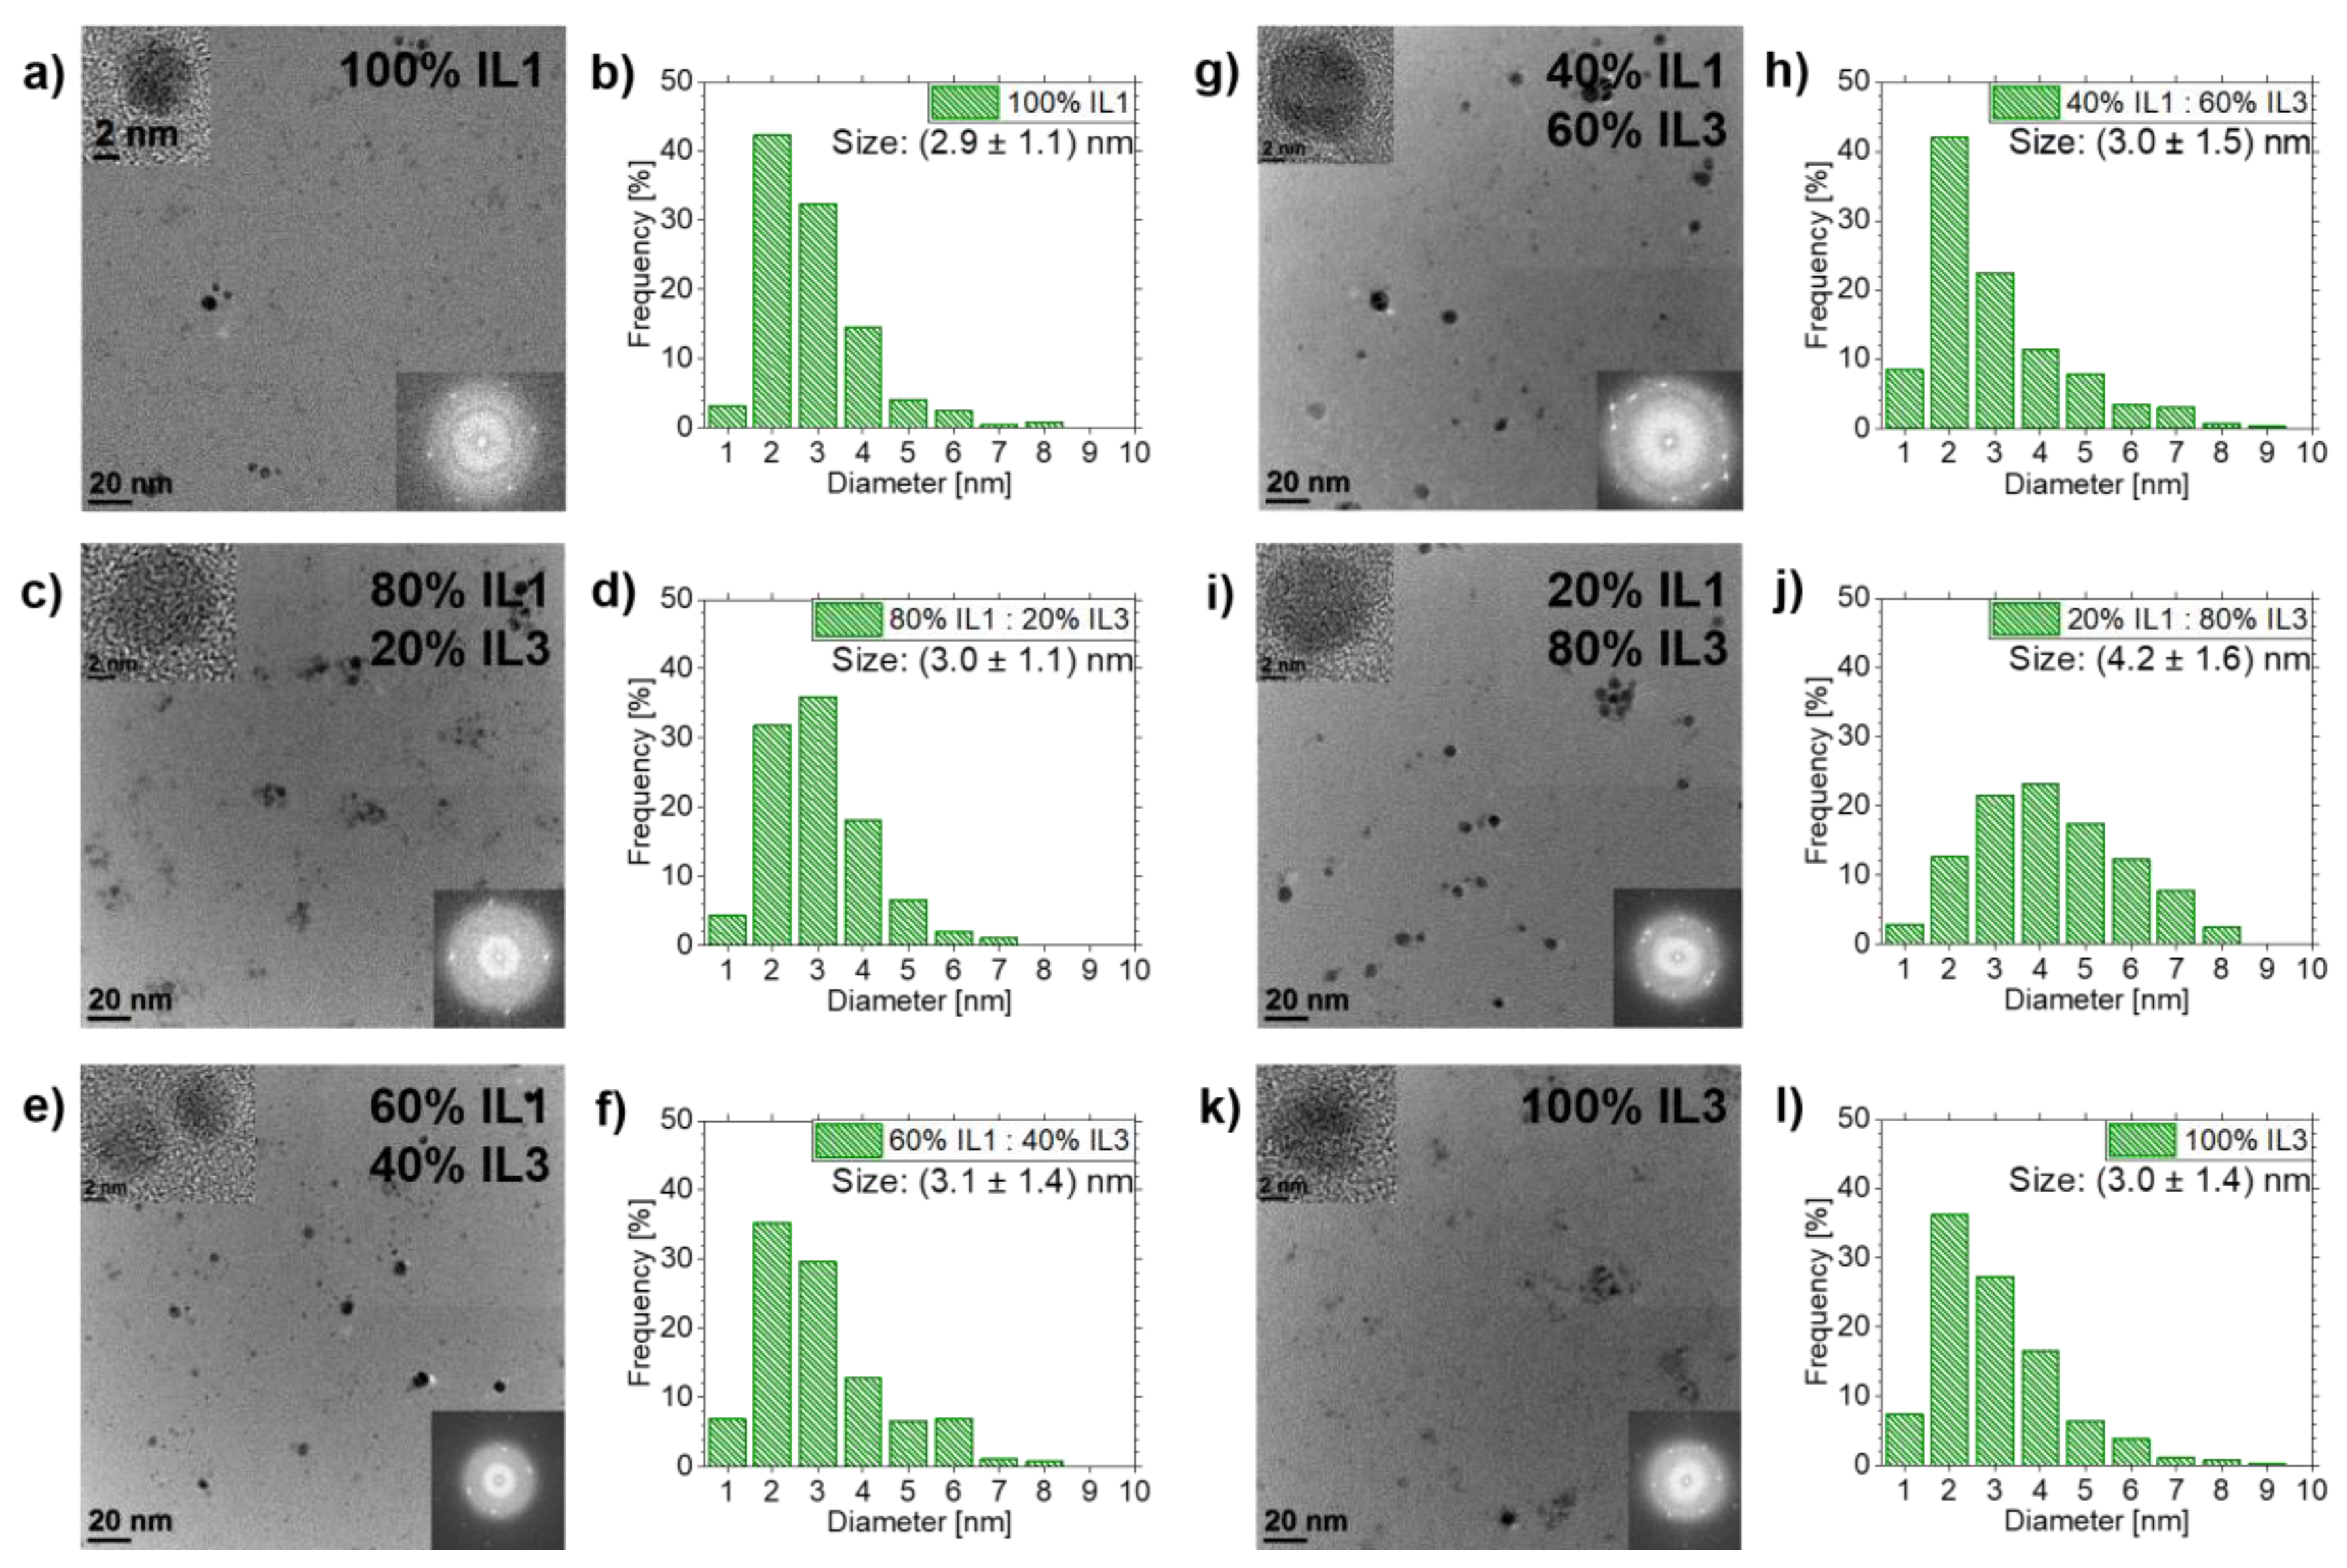
3.3. Ag NPs Sputtered in IL1/IL3-Mixtures

All mixtures showed stable NPs, but the stabilization effect was different compared to IL1/IL2-mixtures, see Figure 4. The fcc structure of the Ag NPs was determined by analyses of FFT data from HRTEM images of all samples in this mixture row. Whereas Ag NPs in IL1 have a mean diameter of ( 5.4 ± 2.1 ) nm, NP diameters in the mixtures change to ( 8.9 ± 4.9 ) nm for 80 vol.% IL1/20 vol.% IL3, ( 7.9 ± 7.3 ) nm for 60 vol.% IL1/40 vol.% IL3, ( 8.8 ± 4.3 ) nm for 40 vol.% IL1/60 vol.% IL3, ( 6.6 ± 4.9 ) nm for 20 vol.% IL1/80 vol.% IL3 and ( 8.0 ± 3.3 ) nm for pure IL3. The NP size distributions are different for mixtures and pure ILs (see Figure 4). For pure ILs, the size distributions are much narrower compared to IL mixtures. Pure IL1 leads to the smallest maximum NP diameter of 10 nm. For pure IL3, the maximum NP diameter of 19 nm is nearly twice the maximum diameter of IL1. However, all IL1/IL3-mixtures show much bigger maximum NP diameters with respect to pure ILs, starting with 34 nm for 20 vol.% IL1/80 vol.% IL3 ranging up to 54 nm for 80 vol.% IL1/20 vol.% IL3. The most NPs above 20 nm diameter are present in the mixture 60 vol.% IL1/40 vol.% IL3.

3.4. Au NPs Sputtered in IL1/IL3-Mixtures

The findings of Ag NPs sputtered in IL1/IL3-mixtures were compared with the results of sputtering Au in the same IL1/IL3-mixtures, as the influence of this IL mixture was more pronounced than in IL1/IL2-mixtures. Figure 5 shows the results: Au NPs have fcc structures, as determined by analyses of FFT data from HRTEM images of all samples in this mixture row. The Au NP mean diameters show a similar trend to the Ag NPs in IL1/IL3-mixtures, however with notable differences. IL1 stabilizes Au NPs with a mean diameter of ( 2.2 ± 0.8 ) nm. For IL mixtures, the NP diameters differ: ( 3.2 ± 1.2 ) nm for 80 vol.% IL1/20 vol.% IL3, ( 3.0 ± 1.3 ) nm for 60 vol.% IL1/40 vol.% IL3, ( 1.9 ± 0.7 ) nm for 40 vol.% IL1/60 vol.% IL3 and ( 2.2 ± 0.9 ) nm for 20 vol.% IL1/80 vol.% IL3. IL3 stabilizes Au NPs with a mean diameter of ( 2.2 ± 0.8 ) nm. The difference in the size distributions and maximum NP sizes is not as pronounced as for Ag NPs but shows again that the IL1/IL3-mixtures tend to have a broader size distribution than pure ILs, stated by the mixtures 80 vol.% IL1/20 vol.% IL3 and 60 vol.% IL1/40 vol.% IL3 (see Figure 5). Both mixtures have a bigger mean NP diameter than both pure ILs. The NP frequencies for each diameter are distributed over seven sizes instead of five for the pure ILs. Additionally, those two mixtures lead to the biggest maximum NP size of 7 nm, whereas pure ILs only have 5 nm maximum NP size. For Ag NPs in IL1/IL3-mixtues, the same behavior concerning maximum NP size was determined for those particular mixtures.

3.5. Cu NPs Sputtered in IL1/IL3-Mixtures

The results of Cu NPs sputtered in IL1/IL3-mixtures, Figure 6, show a different trend compared to the results for Ag and Au. Cu NPs show as well fcc structure, as determined by analyses of FFT data from HRTEM images. However, the mean NP diameters do not vary much for different IL mixtures. Cu NPs in IL1 have a mean diameter of ( 2.9 ± 1.1 ) nm. NPs in IL mixtures show mean diameters of ( 3.0 ± 1.1 ) nm for 80 vol.% IL1/20 vol.% IL3, ( 3.1 ± 1.4 ) nm for 60 vol.% IL1/40 vol.% IL3, ( 3.0 ± 1.5 ) nm for 40 vol.% IL1/60 vol.% IL3 and ( 4.2 ± 1.6 ) nm for 20 vol.% IL1/80 vol.% IL3. The mean diameter of Cu NPs in pure IL3 is ( 3.0 ± 1.4 ) nm. Only the mean diameter of the 20 vol.% IL1/80 vol.% IL3 mixture is more than 1 nm bigger than that of the other samples. Additionally, all samples show basically comparable size distributions except 20 vol.% IL1/80 vol.% IL3, whose size distribution is shifted to bigger NP diameters (see Figure 6).

4. Discussion

4.1. NP Stabilization in IL Mixed with Organic Solvent

The aim of this experiment was to weaken the NP stabilization in a controlled manner by adding the organic solvent anisole, in order to enable NP growth above the size limit for a pure IL. Since the reduction in NP size and amount is obvious for increasing anisole content in the mixture, the effect of the anisole concerning NP stabilization in the IL surpasses the aimed controlled weakening of the stabilization, which should result in bigger NPs. The NP stabilization can be described by a protective double layer of IL ions around the NP generating electrostatic repulsion of “caged NPs” and by steric stabilization due to alkyl chains of the IL cation dangling away from the NP surface [42,43]. Anisole is well solvable in ILs due to its methoxy group [53]. Therefore, anisole molecules should be present everywhere in the IL, also in the vicinity around the “caged NPs”, probably in direct contact with the metal surface. Thus, they reduce the IL anion concentration in the first protective layer. This affects the strength of the electrostatic stabilization of the NPs since anisole has no partial charge in contrast to IL ions. Additionally, anisole molecules take the place of cations in the second protective layer and thus reduce the steric stabilization, since they have no long alkyl chain (see Figure 1). Therefore, we assume that the stabilization by the protective cages around the metal NPs is impeded by anisole molecules being present among the IL ions. With increasing anisole content, the IL ions are more and more suppressed by anisole and the stabilization cage becomes weaker with increasing anisole overtaking IL ion places there. Thus, the NP ability to agglomerate and fall out of the IL stabilization matrix increases. Due to this, we assume that the Ag in the IL is more and more present in agglomerations instead of being stabilized in NPs, explaining the continuous reduction in NP amount and size with increasing anisole content.

4.2. Effects of IL Mixtures on NPs Sizes

A control of NP sizes was reached by mixtures of IL1 with IL2 and IL3, in contrast to the destabilization of IL1 with anisole. The size characteristics for each NP/IL-mixture combination reported above are comprehensively visualized in Figure 7. As stated in the introduction, the effects concerning NP diameters differ between the different IL mixtures. The results shown in Figure 7 are discussed below.

4.3. NP Stabilization in IL1/IL2-Mixtures

NPs were stabilized in IL1/IL2-mixtures, with the NP size depending on the IL mixture. Both ILs have the same cation [Bmim] but differ in the anion, which is [(Tf)2N] for IL1 and [(Pf)2N] for IL2. We assume that the differences in NP sizes for the IL1/IL2-mixtures only depend on the differences in the anion sizes of the used ILs. Although the NP nucleation process is expected to occur mainly at the IL surface [19,49], the surface conditions for IL1 and IL2 should be comparable, since the anions are expected to be mainly present in the “bulk” IL phase, leaving the surface population to the cation (if it has a comparably long alkyl chain) [49]. For IL1 and IL2 (both [Bmim]), the alkyl chain length is identical. Thus, the process responsible for the NP size differences is assumed to also take place in the IL “bulk” after the previous NP formation on the IL surface. As depicted in Figure 1 and noted in Table 1, the [(Pf)2N] anion is bigger concerning volume than [(Tf)2N], but both have a comparable structure. Both ions have the same charge, but in the case of [(Pf)2N] the charge is distributed over a volume approximately 25% bigger than the volume of [(Tf)2N], decreasing the interaction energy and cation-anion cohesion energy, as reported by Fernandes et al. for increasing anion radii [50]. Thus, the charge density of the [(Pf)2N] anion is lower compared to [(Tf)2N]. Additionally, due to the bigger [(Pf)2N] volume, the number of [(Pf)2N] anions in the first stabilizing layer of the NP cage is less compared to [(Tf)2N] for the lack of space. Both characteristics of the [(Pf)2N] lead to a lower coordinative ability and thus a weaker NP stabilization with respect to [(Tf)2N]. This means that, with increasing IL2 and thus increasing [(Pf)2N] portion in the IL mixture, the NP size should also increase due to more likely physical interactions between the caged NPs which then can grow together. Figure 3 and Figure 7a indicate that a linear increase in the mean NP size and broadening of the size distribution towards bigger NPs occurs with increasing IL2 portion, which supports these assumptions. Additionally, several other studies found an identical behavior of stabilized NPs, however they did not compare IL mixtures of different compositions, but pure ILs with the same cations but different anions and thus different anion volumes [46,47]. In these cases, the NP sizes differ by several nm up to tens of nm. In contrast, our approach shows only a slight size increase of 1.2 nm (the biggest increase). Thus, our approach gives the opportunity for a much finer tuning of the desired NP sizes by adjusting the appropriate IL mixture and confirms the dependency of NP size on anion volume. The maximum NP diameter is not as strongly influenced by the IL1/IL2-mixture compared to the IL1/IL3-mixture. All IL1/IL2-mixtures show comparable maximum NP diameters with respect to IL2, except the mixture 20 vol.% IL1/80 vol.% IL2, where only one NP had a large size. However, this single incident is not statistically significant.

4.4. NP Stabilization in IL1/IL3-Mixtures

NPs could be stabilized with controlled sizes in IL1/IL3-mixtures. However, the results are different to the IL1/IL2-mixtures, as depicted in Figure 4 and Figure 7b for Ag NPs. The ILs of the IL1/IL3-mixture have the same anion [(Tf)2N] but differ in the cation ([Bmim] for IL1, [BmPyr] for IL3). By investigating these mixtures, the effect of the cation on NP formation and stabilization was revealed. The cations have slightly different volumes, with [BmPyr] being bigger than [Bmim] (see Table 1) and both show a different structure (see Figure 1). [Bmim] and [BmPyr] have comparable alkyl chain lengths, but the central ring structures show two disparities. For [BmPyr], there is only one nitrogen atom in the pyrrolidinium ring, whereas [Bmim] has two nitrogen atoms in the imidazolium ring. Additionally, [BmPyr] has no covalent double bonds in the ring, whereas [Bmim] has two and thus an aromatic character. The delocalization of charges in aromatic rings (like the imidazolium ring) leads to weaker electrostatic strengths with respect to fixed localized charges in saturated rings (e.g., the pyrrolidinium ring) and thus ILs based on imidazolium rings with aromatic character have a lower relative interaction strength than ILs with saturated rings [50]. Since it is expected that the NP formation predominantly occurs on the IL surface [19,49] and anions tend to be more present in the IL “bulk” if the cation has at least a butyl chain [19], the cations dominate the surfaces of IL1/IL3-mixtures. Since the [BmPyr] cation of IL3 has no aromatic character in contrast to [Bmim] of IL1, it is expected that the organization strength of the cation-dominated IL surface and the binding of the single cations to each other will be higher for IL3. Thus, incoming sputtered metal atoms should be impeded more effectively of getting into the IL “bulk” by IL3 with respect to IL1. This means that the nucleation of small metal clusters starts to be intensified on the IL3 surface with respect to IL1 since more and more atoms land on the surface. Incoming atoms merge with already-landed atoms/clusters until they are big enough to overcome the IL surface organization and to immerse into the IL “bulk”. So, the IL surface structure already contributes to different NP sizes, which should develop in pure IL1 and IL3, with the bigger NPs being present in IL3 due to its stronger surface organization. As depicted in Figure 4 and Figure 7b, NPs in IL3 are bigger [ ( 8.0 ± 3.3 ) nm] than in IL1 [ ( 5.4 ± 2.1 ) nm], supporting these assumptions. After immersion of NPs in the IL “bulk”, another modification of the stabilization effect occurs independent from surface aggregation, since all IL1/IL3-mixtures result in bigger maximum NP sizes than pure ILs. It can be assumed that NP stabilization in the IL “bulk” is also influenced by the presence of both IL cations in the mixtures and thus in the outer shell of the stabilizing NP cages. Since [Bmim] has an aromatic character and thus is less coordinative due to its reduced electrostatic strength, it could displace [BmPyr] in the outer cage shell. With the increasing portion of IL1 in the mixtures and thus the destabilization of the outer shell of the cage, the NP size should increase. This development is not clearly visible in Figure 4 since the mean diameter of the Ag NPs in the mixture 60 vol.% IL1/40 vol.% IL3 is smaller than for the surrounding mixtures 80 vol.% IL1/20 vol.% IL3 and 40 vol.% IL1/60 vol.% IL3. However, the biggest NP diameters were found in the mixtures with the highest and second highest IL1 portion. This indicates that above-mentioned effects play a role in IL1/IL3-mixtures. Indeed, the smaller mean diameter of NPs in some mixtures contradicts the above-mentioned assumptions, since it would be expected that bigger NPs would also lead to an increased mean diameter. One explanation for this observation is the volume of the NPs. The volume of a sphere increases with its diameter to the power of three, so bigger spheres (or NPs) require more material and thus the remaining material in the ILs could limit the growth of the other NPs to smaller sizes than expected. The fact that NPs in IL1 are smaller than in IL3, although [Bmim] should be less coordinative than the [BmPyr] cation of IL3, can be seen as confirmation that the NP formation process on the IL surface is determining the NP size and its further development.
For Au sputtered in IL1/IL3-mixtures, the trend for bigger maximum NP sizes is also visible in TEM images, see Figure 5 and Figure 7c. Both IL mixtures with the highest and second highest IL1 portion show a higher maximum NP size and a bigger mean diameter than all other ILs (mixtures) with Au NPs. However, the stabilization effect of the different surface compositions cannot be identified with the clearness of the Ag NPs. Both pure ILs lead to NPs with the same mean diameter and same standard deviation [ ( 2.2 ± 0.8 ) nm], but IL3 shows a higher frequency of NPs with sizes of 3 nm and 5 nm and less NPs with sizes of 1 nm. Thus, the slight difference in mean diameter could be hidden in the rounding of the mean diameter value.
For Cu sputtered in IL1/IL3-mixtures, the above-described size development trends for IL1/IL3-mixtures could not be fully confirmed, see Figure 6 and Figure 7d. All samples have nearly the same mean NP diameter and comparable size distributions, except the 20 vol.% IL1/80 vol.% IL3 sample. IL3 and all IL1/IL3-mixtures show a tendency to bigger NP diameters with respect to IL1. IL1 has the highest frequency of NPs with diameters of 2 nm and the lowest frequency of NPs with 5 nm and bigger diameters, except for the 80 vol.% IL1/20 vol.% IL3 sample. Here, the frequency of NPs with 3 nm diameters is dominant and the number of NPs with diameters of 4 nm and bigger is comparable to IL1. Therefore, it is challenging to clearly identify the trend of IL1/IL3-mixtures for enabling bigger maximum NP sizes in the case of Cu NPs, but a weak tendency could be found in the size distribution. In general, the identification of the IL1/IL3-mixture effects are challenging for Au and Cu NPs. With respect to Ag NPs in IL1/IL3-mixtures, Au and Cu NPs in IL1/IL3-mixtures are much smaller in mean diameter and maximum NP sizes and have a narrower size distribution, which hinders identifying a clear trend. Nevertheless, the general trend for bigger maximum NP sizes in the IL1/IL3-mixtures with respect to pure IL1 and IL3 was detectable for Au and Ag NPs, as depicted in Figure 7.

5. Conclusions

A new approach for tuning the stabilization abilities of ILs concerning size distribution of the sputtered NPs was presented. By mixing selected ILs, differing only by either the cation or the anion, two tuning effects have been accomplished: First, the size of the NPs could be influenced in the nanometer regime by mixing two ILs with slightly different anion sizes and thus much finer than using pure but different ILs. Second, the stabilization limits of the pure ILs could be exceeded by mixing two ILs with different cation size and structures due to one cation being based on an imidazolium and the other on a pyrrolidinium ring. Thus, bigger maximum NP sizes could be realized in these IL mixtures. These results show that applying the literature knowledge about the stabilization effect of the different IL ions can be beneficially used for the controlled synthesis of NPs and also confirm the literature knowledge on the formation and stabilization of NPs on and within ILs. Since all mixture samples for the respective element have been synthesized in the same deposition, only the different IL portions are responsible for the observed size effects and thus underline the expressiveness of this new, thus far unconducted NP stabilization process.

Author Contributions

M.M. conducted the sample synthesis, performed the TEM measurements, analyzed the TEM investigation results and wrote the manuscript. M.F. assisted sample preparations and analysis of the TEM images. A.L. provided funding, scientific supervision and discussion, validation and manuscript review and editing. All co-authors contributed with data interpretation. All authors have read and agreed to the published version of the manuscript.

Funding

This work was funded by the German Research Foundation (DFG), project LU1175/23-1.

Acknowledgments

We want to thank Tobias Löffler from the Center of Electrochemical Sciences (CES) at Ruhr University Bochum for discussions on the structural characteristics of IL ions.

Conflicts of Interest

The authors declare no conflict of interest.

References

  1. Migowski, P.; Dupont, J. Catalytic applications of metal nanoparticles in imidazolium ionic liquids. Chemistry 2007, 13, 32–39. [Google Scholar] [CrossRef] [PubMed]
  2. Löffler, T.; Meyer, H.; Savan, A.; Wilde, P.; Garzón Manjón, A.; Chen, Y.-T.; Ventosa, E.; Scheu, C.; Ludwig, A.; Schuhmann, W. Discovery of a Multinary Noble Metal-Free Oxygen Reduction Catalyst. Adv. Energy Mater. 2018, 8, 1802269. [Google Scholar] [CrossRef]
  3. Löffler, T.; Savan, A.; Garzón-Manjón, A.; Meischein, M.; Scheu, C.; Ludwig, A.; Schuhmann, W. Toward a Paradigm Shift in Electrocatalysis Using Complex Solid Solution Nanoparticles. ACS Energy Lett. 2019, 4, 1206–1214. [Google Scholar] [CrossRef]
  4. Astruc, D. Transition-metal Nanoparticles in Catalysis: From Historical Background to the State-of-the Art. In Nanoparticles and Catalysis; Astruc, D., Ed.; Wiley-VCH: Weinheim, Germany, 2008; pp. 1–48. ISBN 9783527621323. [Google Scholar]
  5. Conde, J.; Doria, G.; Baptista, P. Noble metal nanoparticles applications in cancer. J. Drug Deliv. 2012, 2012, 751075. [Google Scholar] [CrossRef] [PubMed]
  6. Pankhurst, Q.A.; Connolly, J.; Jones, S.K.; Dobson, J. Applications of magnetic nanoparticles in biomedicine. J. Phys. D Appl. Phys. 2003, 36, R167–R181. [Google Scholar] [CrossRef] [Green Version]
  7. Jain, K.K. Applications of nanobiotechnology in clinical diagnostics. Clin. Chem. 2007, 53, 2002–2009. [Google Scholar] [CrossRef] [Green Version]
  8. Boroumand Moghaddam, A.; Namvar, F.; Moniri, M.; Md Tahir, P.; Azizi, S.; Mohamad, R. Nanoparticles Biosynthesized by Fungi and Yeast: A Review of Their Preparation, Properties, and Medical Applications. Molecules 2015, 20, 16540–16565. [Google Scholar] [CrossRef]
  9. Ito, S.; Unemoto, A.; Ogawa, H.; Tomai, T.; Honma, I. Application of quasi-solid-state silica nanoparticles–ionic liquid composite electrolytes to all-solid-state lithium secondary battery. J. Power Sources 2012, 208, 271–275. [Google Scholar] [CrossRef]
  10. Lu, Y.; Das, S.K.; Moganty, S.S.; Archer, L.A. Ionic liquid-nanoparticle hybrid electrolytes and their application in secondary lithium-metal batteries. Adv. Mater. Weinheim. 2012, 24, 4430–4435. [Google Scholar] [CrossRef]
  11. Lu, Y.; Korf, K.; Kambe, Y.; Tu, Z.; Archer, L.A. Ionic-liquid-nanoparticle hybrid electrolytes: Applications in lithium metal batteries. Angew. Chem. Int. Ed Engl. 2014, 53, 488–492. [Google Scholar] [CrossRef]
  12. Garzón-Manjón, A.; Aranda-Ramos, A.; Melara-Benítez, B.; Bensarghin, I.; Ros, J.; Ricart, S.; Nogués, C. Simple Synthesis of Biocompatible Stable CeO2 Nanoparticles as Antioxidant Agents. Bioconjug. Chem. 2018, 29, 2325–2331. [Google Scholar] [CrossRef]
  13. Garzón-Manjón, A.; Solano, E.; de La Mata, M.; Guzmán, R.; Arbiol, J.; Puig, T.; Obradors, X.; Yáñez, R.; Ricart, S.; Ros, J. Induced shape controllability by tailored precursor design in thermal and microwave-assisted synthesis of Fe3O4 nanoparticles. J. Nanopart. Res. 2015, 17, 329. [Google Scholar] [CrossRef]
  14. Dorjnamjin, D.; Ariunaa, M.; Shim, Y.K. Synthesis of silver nanoparticles using hydroxyl functionalized ionic liquids and their antimicrobial activity. Int. J. Mol. Sci. 2008, 9, 807–820. [Google Scholar] [CrossRef] [PubMed]
  15. Schaak, R.E.; Sra, A.K.; Leonard, B.M.; Cable, R.E.; Bauer, J.C.; Han, Y.-F.; Means, J.; Teizer, W.; Vasquez, Y.; Funck, E.S. Metallurgy in a beaker: Nanoparticle toolkit for the rapid low-temperature solution synthesis of functional multimetallic solid-state materials. J. Am. Chem. Soc. 2005, 127, 3506–3515. [Google Scholar] [CrossRef] [PubMed]
  16. Nikam, A.V.; Prasad, B.L.V.; Kulkarni, A.A. Wet chemical synthesis of metal oxide nanoparticles: A review. CrystEngComm 2018, 20, 5091–5107. [Google Scholar] [CrossRef]
  17. Lazarus, L.L.; Riche, C.T.; Malmstadt, N.; Brutchey, R.L. Effect of ionic liquid impurities on the synthesis of silver nanoparticles. Langmuir 2012, 28, 15987–15993. [Google Scholar] [CrossRef] [PubMed]
  18. Torimoto, T.; Okazaki, K.-I.; Kiyama, T.; Hirahara, K.; Tanaka, N.; Kuwabata, S. Sputter deposition onto ionic liquids: Simple and clean synthesis of highly dispersed ultrafine metal nanoparticles. Appl. Phys. Lett. 2006, 89, 243117. [Google Scholar] [CrossRef]
  19. Hatakeyama, Y.; Okamoto, M.; Torimoto, T.; Kuwabata, S.; Nishikawa, K. Small-Angle X-ray Scattering Study of Au Nanoparticles Dispersed in the Ionic Liquids 1-Alkyl-3-methylimidazolium Tetrafluoroborate. J. Phys. Chem. C 2009, 113, 3917–3922. [Google Scholar] [CrossRef]
  20. Richter, K.; Birkner, A.; Mudring, A.-V. Stabilizer-free metal nanoparticles and metal-metal oxide nanocomposites with long-term stability prepared by physical vapor deposition into ionic liquids. Angew. Chem. Int. Ed Engl. 2010, 49, 2431–2435. [Google Scholar] [CrossRef]
  21. Richter, K.; Birkner, A.; Mudring, A.-V. Stability and growth behavior of transition metal nanoparticles in ionic liquids prepared by thermal evaporation: How stable are they really? Phys. Chem. Chem. Phys. PCCP 2011, 13, 7136–7141. [Google Scholar] [CrossRef]
  22. Helgadottir, I.S.; Arquillière, P.P.; Bréa, P.; Santini, C.C.; Haumesser, P.-H.; Richter, K.; Mudring, A.-V.; Aouine, M. Synthesis of bimetallic nanoparticles in ionic liquids: Chemical routes vs physical vapor deposition. Microelectron. Eng. 2013, 107, 229–232. [Google Scholar] [CrossRef]
  23. Meyer, H.; Meischein, M.; Ludwig, A. Rapid Assessment of Sputtered Nanoparticle Ionic Liquid Combinations. ACS Comb. Sci. 2018, 20, 243–250. [Google Scholar] [CrossRef]
  24. König, D.; Richter, K.; Siegel, A.; Mudring, A.-V.; Ludwig, A. High-Throughput Fabrication of Au-Cu Nanoparticle Libraries by Combinatorial Sputtering in Ionic Liquids. Adv. Funct. Mater. 2014, 24, 2049–2056. [Google Scholar] [CrossRef]
  25. Meischein, M.; Garzón-Manjón, A.; Frohn, T.; Meyer, H.; Salomon, S.; Scheu, C.; Ludwig, A. Combinatorial Synthesis of Binary Nanoparticles in Ionic Liquids by Cosputtering and Mixing of Elemental Nanoparticles. ACS Comb. Sci. 2019. [CrossRef] [PubMed]
  26. Kokorin, A.I. Ionic Liquids. Theory, Properties, New Approaches; InTech: Rijeka, Croatia, 2011; ISBN 9533073497. [Google Scholar]
  27. Kadokawa, J.I. (Ed.) Ionic Liquids—New Aspects for the Future; InTech: Rijeka, Croatia, 2014; ISBN 978-953-51-0937-2. [Google Scholar]
  28. Welton, T. Room-Temperature Ionic Liquids. Solvents for Synthesis and Catalysis. Chem. Rev. 1999, 99, 2071–2084. [Google Scholar] [CrossRef]
  29. Holbrey, J.D.; Seddon, K.R. Ionic Liquids. Clean Technol. Environ. Policy 1999, 1, 223–236. [Google Scholar] [CrossRef]
  30. Wasserscheid, P.; Keim, W. Ionic Liquids—New “Solutions” for Transition Metal Catalysis. Angew. Chem. Int. Ed. 2000, 39, 3772–3789. [Google Scholar] [CrossRef]
  31. Kuwabata, S.; Torimoto, T.; Imanishi, A.; Tsu, T. Use of Ionic Liquid Under Vacuum Conditions. In Ionic Liquids—New Aspects for the Future; Kadokawa, J.-I., Ed.; InTech: Rijeka, Croatia, 2014; ISBN 978-953-51-0937-2. [Google Scholar]
  32. Vekariya, R.L. A review of ionic liquids: Applications towards catalytic organic transformations. J. Mol. Liq. 2017, 227, 44–60. [Google Scholar] [CrossRef]
  33. Luska, K.L.; Migowski, P.; Leitner, W. Ionic liquid-stabilized nanoparticles as catalysts for the conversion of biomass. Green Chem. 2015, 17, 3195–3206. [Google Scholar] [CrossRef] [Green Version]
  34. Plechkova, N.V.; Seddon, K.R. Applications of ionic liquids in the chemical industry. Chem. Soc. Rev. 2008, 37, 123–150. [Google Scholar] [CrossRef]
  35. Garzón-Manjón, A.; Meyer, H.; Grochla, D.; Löffler, T.; Schuhmann, W.; Ludwig, A.; Scheu, C. Controlling the Amorphous and Crystalline State of Multinary Alloy Nanoparticles in An Ionic Liquid. Nanomaterials 2018, 8, 903. [Google Scholar] [CrossRef] [PubMed] [Green Version]
  36. Suzuki, S.; Suzuki, T.; Tomita, Y.; Hirano, M.; Okazaki, K.-I.; Kuwabata, S.; Torimoto, T. Compositional control of AuPt nanoparticles synthesized in ionic liquids by the sputter deposition technique. CrystEngComm 2012, 14, 4922. [Google Scholar] [CrossRef]
  37. Hirano, M.; Enokida, K.; Okazaki, K.-I.; Kuwabata, S.; Yoshida, H.; Torimoto, T. Composition-dependent electrocatalytic activity of AuPd alloy nanoparticles prepared via simultaneous sputter deposition into an ionic liquid. Phys. Chem. Chem. Phys. PCCP 2013, 15, 7286–7294. [Google Scholar] [CrossRef] [PubMed]
  38. Schwartzkopf, M.; Hinz, A.; Polonskyi, O.; Strunskus, T.; Löhrer, F.C.; Körstgens, V.; Müller-Buschbaum, P.; Faupel, F.; Roth, S.V. Role of Sputter Deposition Rate in Tailoring Nanogranular Gold Structures on Polymer Surfaces. ACS Appl. Mater. Interfaces 2017, 9, 5629–5637. [Google Scholar] [CrossRef]
  39. Schwartzkopf, M.; Santoro, G.; Brett, C.J.; Rothkirch, A.; Polonskyi, O.; Hinz, A.; Metwalli, E.; Yao, Y.; Strunskus, T.; Faupel, F.; et al. Real-Time Monitoring of Morphology and Optical Properties during Sputter Deposition for Tailoring Metal-Polymer Interfaces. ACS Appl. Mater. Interfaces 2015, 7, 13547–13556. [Google Scholar] [CrossRef] [Green Version]
  40. Scheeren, C.W.; Machado, G.; Teixeira, S.R.; Morais, J.; Domingos, J.B.; Dupont, J. Synthesis and characterization of Pt0 nanoparticles in imidazolium ionic liquids. J. Phys. Chem. B 2006, 110, 13011–13020. [Google Scholar] [CrossRef]
  41. Ozkar, S.; Finke, R.G. Nanocluster formation and stabilization fundamental studies: Ranking commonly employed anionic stabilizers via the development, then application, of five comparative criteria. J. Am. Chem. Soc. 2002, 124, 5796–5810. [Google Scholar] [CrossRef]
  42. He, Z.; Alexandridis, P. Nanoparticles in ionic liquids: Interactions and organization. Phys. Chem. Chem. Phys. PCCP 2015, 17, 18238–18261. [Google Scholar] [CrossRef]
  43. Liang, Y.; Hilal, N.; Langston, P.; Starov, V. Interaction forces between colloidal particles in liquid: Theory and experiment. Adv. Colloid Interface Sci. 2007, 134–135, 151–166. [Google Scholar] [CrossRef]
  44. Dupont, J. On the solid, liquid and solution structural organization of imidazolium ionic liquids. J. Braz. Chem. Soc. 2004, 15, 341–350. [Google Scholar] [CrossRef] [Green Version]
  45. Migowski, P.; Machado, G.; Texeira, S.R.; Alves, M.C.M.; Morais, J.; Traverse, A.; Dupont, J. Synthesis and characterization of nickel nanoparticles dispersed in imidazolium ionic liquids. Phys. Chem. Chem. Phys. PCCP 2007, 9, 4814–4821. [Google Scholar] [CrossRef] [PubMed]
  46. Redel, E.; Thomann, R.; Janiak, C. Use of ionic liquids (ILs) for the IL-anion size-dependent formation of Cr, Mo and W nanoparticles from metal carbonyl M(CO)6 precursors. Chem. Commun. (Camb.) 2008, 1789–1791. [Google Scholar] [CrossRef] [PubMed]
  47. Redel, E.; Thomann, R.; Janiak, C. First correlation of nanoparticle size-dependent formation with the ionic liquid anion molecular volume. Inorg. Chem. 2008, 47, 14–16. [Google Scholar] [CrossRef] [PubMed]
  48. Fonseca, G.S.; Machado, G.; Teixeira, S.R.; Fecher, G.H.; Morais, J.; Alves, M.C.M.; Dupont, J. Synthesis and characterization of catalytic iridium nanoparticles in imidazolium ionic liquids. J. Colloid Interface Sci. 2006, 301, 193–204. [Google Scholar] [CrossRef]
  49. Wender, H.; de Oliveira, L.F.; Migowski, P.; Feil, A.F.; Lissner, E.; Prechtl, M.H.G.; Teixeira, S.R.; Dupont, J. Ionic Liquid Surface Composition Controls the Size of Gold Nanoparticles Prepared by Sputtering Deposition. J. Phys. Chem. C 2010, 114, 11764–11768. [Google Scholar] [CrossRef] [Green Version]
  50. Fernandes, A.M.; Rocha, M.A.A.; Freire, M.G.; Marrucho, I.M.; Coutinho, J.A.P.; Santos, L.M.N.B.F. Evaluation of cation-anion interaction strength in ionic liquids. J. Phys. Chem. B 2011, 115, 4033–4041. [Google Scholar] [CrossRef]
  51. Dupont, J.; Scholten, J.D. On the structural and surface properties of transition-metal nanoparticles in ionic liquids. Chem. Soc. Rev. 2010, 39, 1780–1804. [Google Scholar] [CrossRef]
  52. Nguyen, M.T.; Yonezawa, T. Sputtering onto a liquid: Interesting physical preparation method for multi-metallic nanoparticles. Sci. Technol. Adv. Mater. 2018, 19, 883–898. [Google Scholar] [CrossRef] [Green Version]
  53. Mellah, M.; Zeitouny, J.; Gmouh, S.; Vaultier, M.; Jouikov, V. Oxidative self-coupling of aromatic compounds in ionic liquids. Electrochem. Commun. 2005, 7, 869–874. [Google Scholar] [CrossRef]
  54. Jarosik, A.; Krajewski, S.R.; Lewandowski, A.; Radzimski, P. Conductivity of ionic liquids in mixtures. J. Mol. Liq. 2006, 123, 43–50. [Google Scholar] [CrossRef]
  55. Baltazar, Q.Q.; Leininger, S.K.; Anderson, J.L. Binary ionic liquid mixtures as gas chromatography stationary phases for improving the separation selectivity of alcohols and aromatic compounds. J. Chromatogr. A 2008, 1182, 119–127. [Google Scholar] [CrossRef] [PubMed]
  56. Finotello, A.; Bara, J.E.; Narayan, S.; Camper, D.; Noble, R.D. Ideal gas solubilities and solubility selectivities in a binary mixture of room-temperature ionic liquids. J. Phys. Chem. B 2008, 112, 2335–2339. [Google Scholar] [CrossRef] [PubMed]
  57. Xiao, D.; Rajian, J.R.; Hines, L.G.; Li, S.; Bartsch, R.A.; Quitevis, E.L. Nanostructural organization and anion effects in the optical Kerr effect spectra of binary ionic liquid mixtures. J. Phys. Chem. B 2008, 112, 13316–13325. [Google Scholar] [CrossRef] [PubMed]
  58. Wang, P.; Zakeeruddin, S.M.; Humphry-Baker, R.; Grätzel, M. A Binary Ionic Liquid Electrolyte to Achieve ≥7% Power Conversion Efficiencies in Dye-Sensitized Solar Cells. Chem. Mater. 2004, 16, 2694–2696. [Google Scholar] [CrossRef]
  59. Shi, G.; Wang, Z.; Xia, J.; Bi, S.; Li, Y.; Zhang, F.; Xia, L.; Li, Y.; Xia, Y.; Xia, L. Mixed ionic liquids/graphene-supported platinum nanoparticles as an electrocatalyst for methanol oxidation. Electrochim. Acta 2014, 142, 167–172. [Google Scholar] [CrossRef]
  60. Cui, Y.; Biondi, I.; Chaubey, M.; Yang, X.; Fei, Z.; Scopelliti, R.; Hartinger, C.G.; Li, Y.; Chiappe, C.; Dyson, P.J. Nitrile-functionalized pyrrolidinium ionic liquids as solvents for cross-coupling reactions involving in situ generated nanoparticle catalyst reservoirs. Phys. Chem. Chem. Phys. PCCP 2010, 12, 1834–1841. [Google Scholar] [CrossRef]
  61. Zhao, M.; Gao, Y.; Zheng, L. Lyotropic liquid crystalline phases formed in binary mixture of 1-tetradecyl-3-methylimidazolium chloride/ethylammonium nitrate and its application in the dispersion of multi-walled carbon nanotubes. Colloids Surf. A Physicochem. Eng. Asp. 2010, 369, 95–100. [Google Scholar] [CrossRef]
  62. Morgan, D.; Ferguson, L.; Scovazzo, P. Diffusivities of Gases in Room-Temperature Ionic Liquids: Data and Correlations Obtained Using a Lag-Time Technique. Ind. Eng. Chem. Res. 2005, 44, 4815–4823. [Google Scholar] [CrossRef]
  63. Krossing, I.; Slattery, J.M.; Daguenet, C.; Dyson, P.J.; Oleinikova, A.; Weingärtner, H. Why are ionic liquids liquid? A simple explanation based on lattice and solvation energies. J. Am. Chem. Soc. 2006, 128, 13427–13434. [Google Scholar] [CrossRef]
  64. Nazet, A.; Sokolov, S.; Sonnleitner, T.; Makino, T.; Kanakubo, M.; Buchner, R. Densities, Viscosities, and Conductivities of the Imidazolium Ionic Liquids [Emim][Ac], [Emim][FAP], [Bmim][BETI], [Bmim][FSI], [Hmim][TFSI], and [Omim][TFSI]. J. Chem. Eng. Data 2015, 60, 2400–2411. [Google Scholar] [CrossRef]
Figure 1. (a) Photo of the 20-cavity plate (100 mm diameter). The applied arrangement of ionic liquid (IL) (mixtures) is indicated. IL1 was mixed with IL2 or IL3 respectively in steps of 20 vol.% from pure IL2/IL3 to a mixture of 20 vol.% IL2/IL3 with 80 vol.% IL1 before deposition. Anisole was added in the same volumetric steps to already-sputtered pure Ag in IL1. The chemical structures of the IL ions and anisole are shown in (b). IL2 and IL3 differ only by the anion and cation, respectively, with respect to IL1. The drawings of the chemical structures are not depicted in the same size format (drawn with “ChemDraw Professional” from PerkinElmer).
Nanomaterials 10 00525 g001
Figure 2. Overview of TEM results of Ag NPs in IL1 diluted with anisole in 20 vol.% steps. Ag NPs in pure IL1 are shown in (a,b). Ag NPs in IL/anisole mixtures of 80 vol.% IL1 and 20 vol.% anisole are shown in (c,d), 60 vol.% IL1 and 40 vol.% anisole in (e,f), 40 vol.% IL1 and 60 vol.% anisole in (g,h), and 20 vol.% IL1 and 80 vol.% anisole are shown in (i,j). Fast Fourier Transformation (FFT) and corresponding high-resolution TEM (HRTEM) images of the NPs are displayed as insets in the small overview images.
Nanomaterials 10 00525 g002
Figure 3. Overview of TEM results of Ag NPs sputtered in IL1/IL2-mixtures and pure ILs as references. TEM images and the corresponding NP size distribution are depicted in (a,b) for IL1. Overview images and NP size distributions for the IL1/IL2-mixtures are shown in (c,d) for 80 vol.% IL1/20 vol.% IL2, in (e,f) for 60 vol.% IL1/40 vol.% IL2, in (g,h) for 40 vol.% IL1/60 vol.% IL2 and in (i,j) for 20 vol.% IL1/80 vol.% IL2. Results of pure IL2 are illustrated in (k,l). HRTEM images of NPs from the investigated IL (mixtures) and corresponding FFT images are depicted as insets in the overview images, confirming the NP crystallinity due to visible lattice fringes and the corresponding spots in the FFTs.
Nanomaterials 10 00525 g003
Figure 4. Overview of TEM results of Ag NPs sputtered in IL1/IL3-mixtures and pure ILs as references. TEM images and the corresponding NP size distribution are depicted in (a,b) for pure IL1. Overview images and NP size distributions for the IL1/IL3-mixtures are shown in (c,d) for 80 vol.% IL1/20 vol.% IL3, in (e,f) for 60 vol.% IL1/40 vol.% IL3, in (g,h) for 40 vol.% IL1/60 vol.% IL3 and in (i,j) for 20 vol.% IL1/80 vol.% IL3. Results of pure IL3 are illustrated in (k,l). HRTEM images of NPs from the particular investigated IL (mixtures) and corresponding FFT images are depicted as insets in the overview images, confirming the NP crystallinity due to the visible lattice fringes and the corresponding spots in the FFTs.
Nanomaterials 10 00525 g004
Figure 5. Overview of TEM results of Au NPs sputtered in IL1/IL3-mixtures and pure ILs as references. TEM images and the corresponding NP size distribution are depicted in (a,b) for pure IL1. Overview images and NP size distributions for IL1/IL3-mixtures are shown in (c,d) for 80 vol.% IL1/20 vol.% IL3, in (e,f) for 60 vol.% IL1/40 vol.% IL3, in (g,h) for 40 vol.% IL1/60 vol.% IL3 and in (i,j) for 20 vol.% IL1/80 vol.% IL3. Results of pure IL3 are illustrated in (k,l). HRTEM images of NPs from the particular investigated IL (mixtures) and corresponding FFT images are depicted as insets in the overview images, confirming NP crystallinity due to visible lattice fringes and corresponding spots in the FFTs.
Nanomaterials 10 00525 g005
Figure 6. Overview of TEM results of Cu NPs sputtered in IL1/IL3-mixtures and pure ILs as references. TEM overview images and the corresponding NP size distribution are depicted in (a,b) for IL1. Overview images and NP size distributions for IL1/IL3-mixtures are shown in (c,d) for 80 vol.% IL1/20 vol.% IL3, in (e,f) for 60 vol.% IL1/40 vol.% IL3, in (g,h) for 40 vol.% IL1/60 vol.% IL3 and in (i,j) for 20 vol.% IL1/80 vol.% IL3. Results of IL3 are illustrated in (k,l). HRTEM images of NPs from the investigated IL (mixtures) and corresponding FFT images are depicted as insets in the overview images, confirming the NP crystallinity due to the visible lattice fringes and the corresponding spots in FFTs.
Nanomaterials 10 00525 g006
Figure 7. Overview of the different size parameters of all NP/IL-mixture combinations. Minimum and maximum NP diameter as well as the mean diameter of the NPs with error are depicted in (a) for Ag in IL1/IL2-mixtures, in (b) for Ag in IL1/IL3-mixtures, in (c) for Au in IL1/IL3-mixtures and in (d) for Cu in IL1/IL3-mixtures.
Nanomaterials 10 00525 g007
Table 1. Characteristics of the used chemicals for IL mixtures. Values were provided by the delivering companies, if not noted differently by the addition of the literature sources at the specific values. A Value estimated by calculating the single particle volume from the total molar volume given by Morgan et al. [62]. B Value calculated by subtracting known cation volume from total molecule volume. C Value estimated using density and molar mass of anisole.
ChemicalPurity (%)Halide Content (ppm)Water Content (ppm)Viscosity (mPa s)Cation Volume (nm3)Anion Volume (nm3)Total Molecule Volume (nm3)
IL1 [Bmim][(Tf)2N]>99<1005149.00 (25 °C)0.196 ± 0.021 [63]0.232 ± 0.015 [63]0.428 ± 0.036 [63]
IL2 [Bmim][(Pf)2N]>98<2506059.50 (40 °C)
115.90 (25 °C) [64]
153.30 (20 °C) [64]
0.196 ± 0.021 [63]0.292 ± 0.021 B0.488 A
IL3 [BmPyr][(Tf)2N]>99<1008094.00 (20 °C)0.221 ± 0.015 [63]0.232 ± 0.015 [63]0.453 ± 0.030 [63]
Anisole99-<10001.52 (15 °C)--0.181 C
Table 2. Sputter deposition parameters. For parameters of Ag deposition in IL2 and IL3, see Meyer et al. [23]. For parameters of Au and Cu deposition in IL1, see Meischein et al. [25].
Element in IL SubstrateStart Pressure (Pa)Ignition Pressure (Pa)Ignition Power (W)Pre-Clean Duration (s)Deposition Pressure (Pa)Deposition Power (W)Deposition Duration (min)Deposition Rate (nm/s)Film Thickness (nm)
Ag in pure IL1 8.93 × 10 5 1.33201200.530400.2216 530
Ag in IL1/IL2 mixture 6.67 × 10 5 1.33201200.530400.2216 530
Ag in IL1/IL3 mixture 9.60 × 10 5 1.33201200.530400.2216 530
Au in IL1/IL3 mixture 1.11 × 10 4 1.33201200.530300.2275 410
Cu in IL1/IL3 mixture 1.13 × 10 4 1.33202400.5301200.080 550

