Article

Graphene Quantum Dots with High Yield and High Quality Synthesized from Low Cost Precursor of Aphanitic Graphite

School of Materials Science and Engineering, University of Shanghai for Science and Technology, Shanghai 200093, China
*
Authors to whom correspondence should be addressed.
Nanomaterials 2020, 10(2), 375; https://doi.org/10.3390/nano10020375
Submission received: 22 January 2020 / Revised: 16 February 2020 / Accepted: 18 February 2020 / Published: 21 February 2020

Abstract

:
It is difficult to keep the balance of high quality and high yield for graphene quantum dots (GQDs). Because the quality is uncontrollable during cutting large 2D nanosheets to small 0D nanodots by top-down methods and the yield is low for GQDs with high quality obtained from bottom-up strategy. Here, aphanitic graphite (AG), a low-cost graphite contains a large amount of small graphite nanocrystals with size of about 10 nm is used as the precursor of graphene oxide quantum dots (GO-QDs) for the first time. GO-QDs with high yield and high quality were successfully obtained directly by liquid phase exfoliating AG without high strength cutting. The yield of these GO-QDs can reach up to 40 wt. %, much higher than that obtained from flake graphite (FG) precursor (less than 10 wt. %). The size of GO-QDs can be controlled in 2–10 nm. The average thickness of GO-QDs is about 3 nm, less than 3 layer of graphene sheet. Graphene quantum dots (GQDs) with different surface properties can be easily obtained by simple hydrothermal treatment of GO-QDs, which can be used as highly efficient fluorescent probe. Developing AG as precursor for GQDs offers a way to produce GQDs in a low-cost, highly effective and scalable manner.

1. Introduction

Graphene, with unique thermal, mechanical, and electronic properties, as well as its excellent chemical stability, has attracted increasingly attention in recent years [1,2,3]. These superior properties of graphene have advanced applications in energy, catalysis, and biomaterial fields [4,5,6,7,8,9]. However, large graphene nanosheet has zero bandgap which limits its electronic and opto-electronic application [10,11]. According to quantum confinement and edge effect, the bandgap of graphene can be designed by varying its size. GQDs with zero-dimensional structure, higher photo stability, lower toxicity, and easily changeable functional groups have attracted considerable attention for applying in sensors, bioimaging, and solar cell [12,13,14,15,16,17,18].
Over the past few years, GQDs have been widely studied and various synthesis methods have been developed [19,20,21]. These methods can be divided into two types: bottom-up strategy and top-down strategy. As for bottom-up approach, solution-based chemical routes were demonstrated as useful methods to synthesize large polycyclic aromatic hydrocarbons from dendritic arene precursors [22,23,24]. Li group employed 2′,4′,6′-triakyl phenyl groups as the precursor to form the edge of graphene moieties [25]. Through this approach, the size and colloidal stability could be controlled. But bottom-up approaches usually contain many complicated steps and the yield of GQDs is low. Furthermore, during the synthesis process, large amount of organic solvents is usually used. The purification of obtained GQDs is difficult and the purified GQDs cannot be dispersed in water easily, which limit their applications. Comparing with bottom-up strategy, top-down approach is a relatively simple process. The crucial point of this approach is how to cut large 2D nanosheets to small 0D nanodots. Many researchers are committed to developing simple and efficient methods for cutting large sheets into nanodots. Various synthesis routes have been developed, such as oxidation cutting [26], hydrothermal (solvothermal) [27,28], electrochemistry [29,30,31], photo-Fenton reaction [32], and oxygen plasma etching [33]. Various precursors were adopted, such as graphene oxide (GO) [34], C60 [35], carbon nano-onions [36], carbon fibers [37], coal [38,39], graphite nanoparticle [40], and rice husk [41]. However, there are also many problems that limit the practical application of GQDs, such as complex pretreatments, high energy-consumption, special instruments or high precursor costs, and so on. It is still a challenge to synthesize GQDs or GO-QDs at a large scale with uniform size in a high yield and low-cost way.
Different from coal, AG is a kind of graphite ore that is composed of carbonaceous material by thermal decomposition of deep metamorphic products (such as from coal deterioration). Its conductivity, thermal conductivity, lubricity, and oxidation resistance are lower than full crystalline graphite. Therefore, it has not been taken seriously and its price is much lower than flake graphite. AG with particle size of ~5 μm has been used to synthesize small size graphene sheets [42,43]. But it is ignored that AG contains a large amount of small graphite nanocrystals with size of about 10 nm. Here, reserve thinking of how to cut 2D graphene sheets into 0D nanodots efficiently, we report for the first time the large-scale synthesis of GO-QDs with uniform size by simply exfoliating AG precursor through a chemical exfoliation process without high-strength cutting. The yield of GO-QDs can reach up to 40%, much higher than that by using FG as precursor (less than 10%). GQDs with different surface properties can be easily obtained by simply hydrothermal treating of GO-QDs in the presence of different functional molecules. These modified GQDs can be used as highly efficient fluorescent probe.

2. Materials and Methods

2.1. Synthesis of GO-QDs by Exfoliating of AG

The exfoliating of AG (Chenzhou Botai Graphite Co., Ltd., Hunan, China) was carried out by a conventional intercalation process, which was generally used for preparing large GO sheets. In a typical procedure, 5 g of AG, 2.5 g of NaNO3, and 115 mL of concentrated H2SO4 were ultrasonically mixed in a beaker at room temperature for 30 min. Then the beaker was removed into an ice bath under mild agitation and 15 g of KMnO4 was added slowly at a temperature under 10 °C. Then the mixture was heated to 35 °C and kept for 40 min. After adding 250 mL of deionized (DI) water, the solution was kept at 98 °C for another 45 min. Then the mixture was diluted to 700 mL and 30 mL of H2O2 (30%) was added. After that, the solution was centrifuged and washed by DI water for several times until the pH value of the system reached to about 7. Then the as-prepared sample was first centrifuged at 3000 rpm for 15 min, dividing into supernatant and precipitates. The precipitates mainly composed of un-exfoliated AG were removed. The obtained GO-QDs were dispersed in water for further study. To make a comparison, FG (CP, Aladdin Reagent Database Inc., Shanghai, China) was exfoliated via the same procedure. For investigating the exfoliating mechanism of AG, the exfoliating process was stopped at intercalation and oxidation steps, respectively. The corresponding intermediate products were isolated, characterized, and stored under appropriate conditions. The products obtained after intercalation by H2SO4 are defined as AG-I and FG-I, respectively, and the products obtained after oxidation by KMnO4 are defined as AG-O and FG-O, respectively.

2.2. Preparation of GQDs with Different Functional Groups

For obtaining GQDs, 1 mg of the prepared GO-QDs was added into 10 mL of deionized water, and the mixture was placed into a sonic bath for 30 min to obtain a homogeneous solution. The solution was sealed in a Teflon-line autoclave at 90 °C–200 °C for 12 h. After cooling to room temperature, GQDs were obtained. For obtaining GQDs modified with functional groups, different functional molecules can be added during the hydrothermal process. For example, modified GQDs of GQDs-NH3·H2O, GQDs-NaBH4, and GQDs-H3BO3 were simply prepared by adding ammonia, NaBH4, and H3BO3 as modifier during hydrothermal treatment, respectively.

2.3. Characterization

The crystalline phases of the samples were identified by using X-ray powder diffraction (XRD) techniques (Bruker D8 Advance diffractometer, Karlsruhe, Germany) operating with Cu Kα radiation (λ = 0.15418 nm) at a scan rate (2θ) of 3 o·min−1. The scan range is from 10° to 70°. The morphologies of the samples were characterized by using a field emission scanning electron microscope (SEM, Hitachi S4800, Tokyo, Japan), and a Tecnai G2 F30 S-Twin transmission electron microscope (TEM, FEI company, Hillsboro, OR, USA). The morphology and thickness of GO-QDs were obtained by an atomic force microscope (AFM, Cypher ES, Asylum Research, Oxford Instrument, Oxford, UK). Samples used for AFM characterization were prepared by dipping the piranha-cleaned silicon wafer substrate into their ethanolic suspensions. Raman spectra were recorded using a Raman microscopy (Horiba, LabRAM HR Evolution, Villeneuve-d’Ascq, France). Thermogravimetric analyses (TG) of samples were conducted using a thermal analyzer (NETZSCH, Selb, Germany). Samples were analyzed in the temperature range of 25–790 °C under a flow of nitrogen. X-ray photoelectron spectroscopy (XPS) was carried out on a PHI-5000 Versa Probe instrument (ULVAC-PHI, Chigasaki, Japan) with Al Kα X-ray source. The Fourier transform infrared spectra (FI-IR) of the samples were obtained with a PerkinElmer spectrum 100 (PerkinElmer, Waltham, MA, USA), in which KBr was used as diluents. PL lifetimes and quantum yield were investigated by LSP920 (Edinburgh Instruments, Corston, UK) using Xenon lamps (450 W).

2.4. Detection of Metal Ions in Water

Cu2+ solution was prepared in advance with CuCl2, and then mixed with the above-mentioned GQDs-NH3·H2O in a certain proportion. Finally, a series of solution were obtained with a concentration of Cu2+ in the range of 0–100 μM. The resulting solution was shaken well to ensure the complete reaction, and then its fluorescence emission is measured at the optimal excitation wavelength of 323 nm to detect the change of fluorescence intensity because of Cu2+. For detecting other metal ions, CuCl2 was replaced by FeCl3, MnCl2, AgNO3, KCl, CuCl2, CaCl2, BaCl2, MgCl2, CdCl2, and ZnCl2, respectively.

3. Results and Discussion

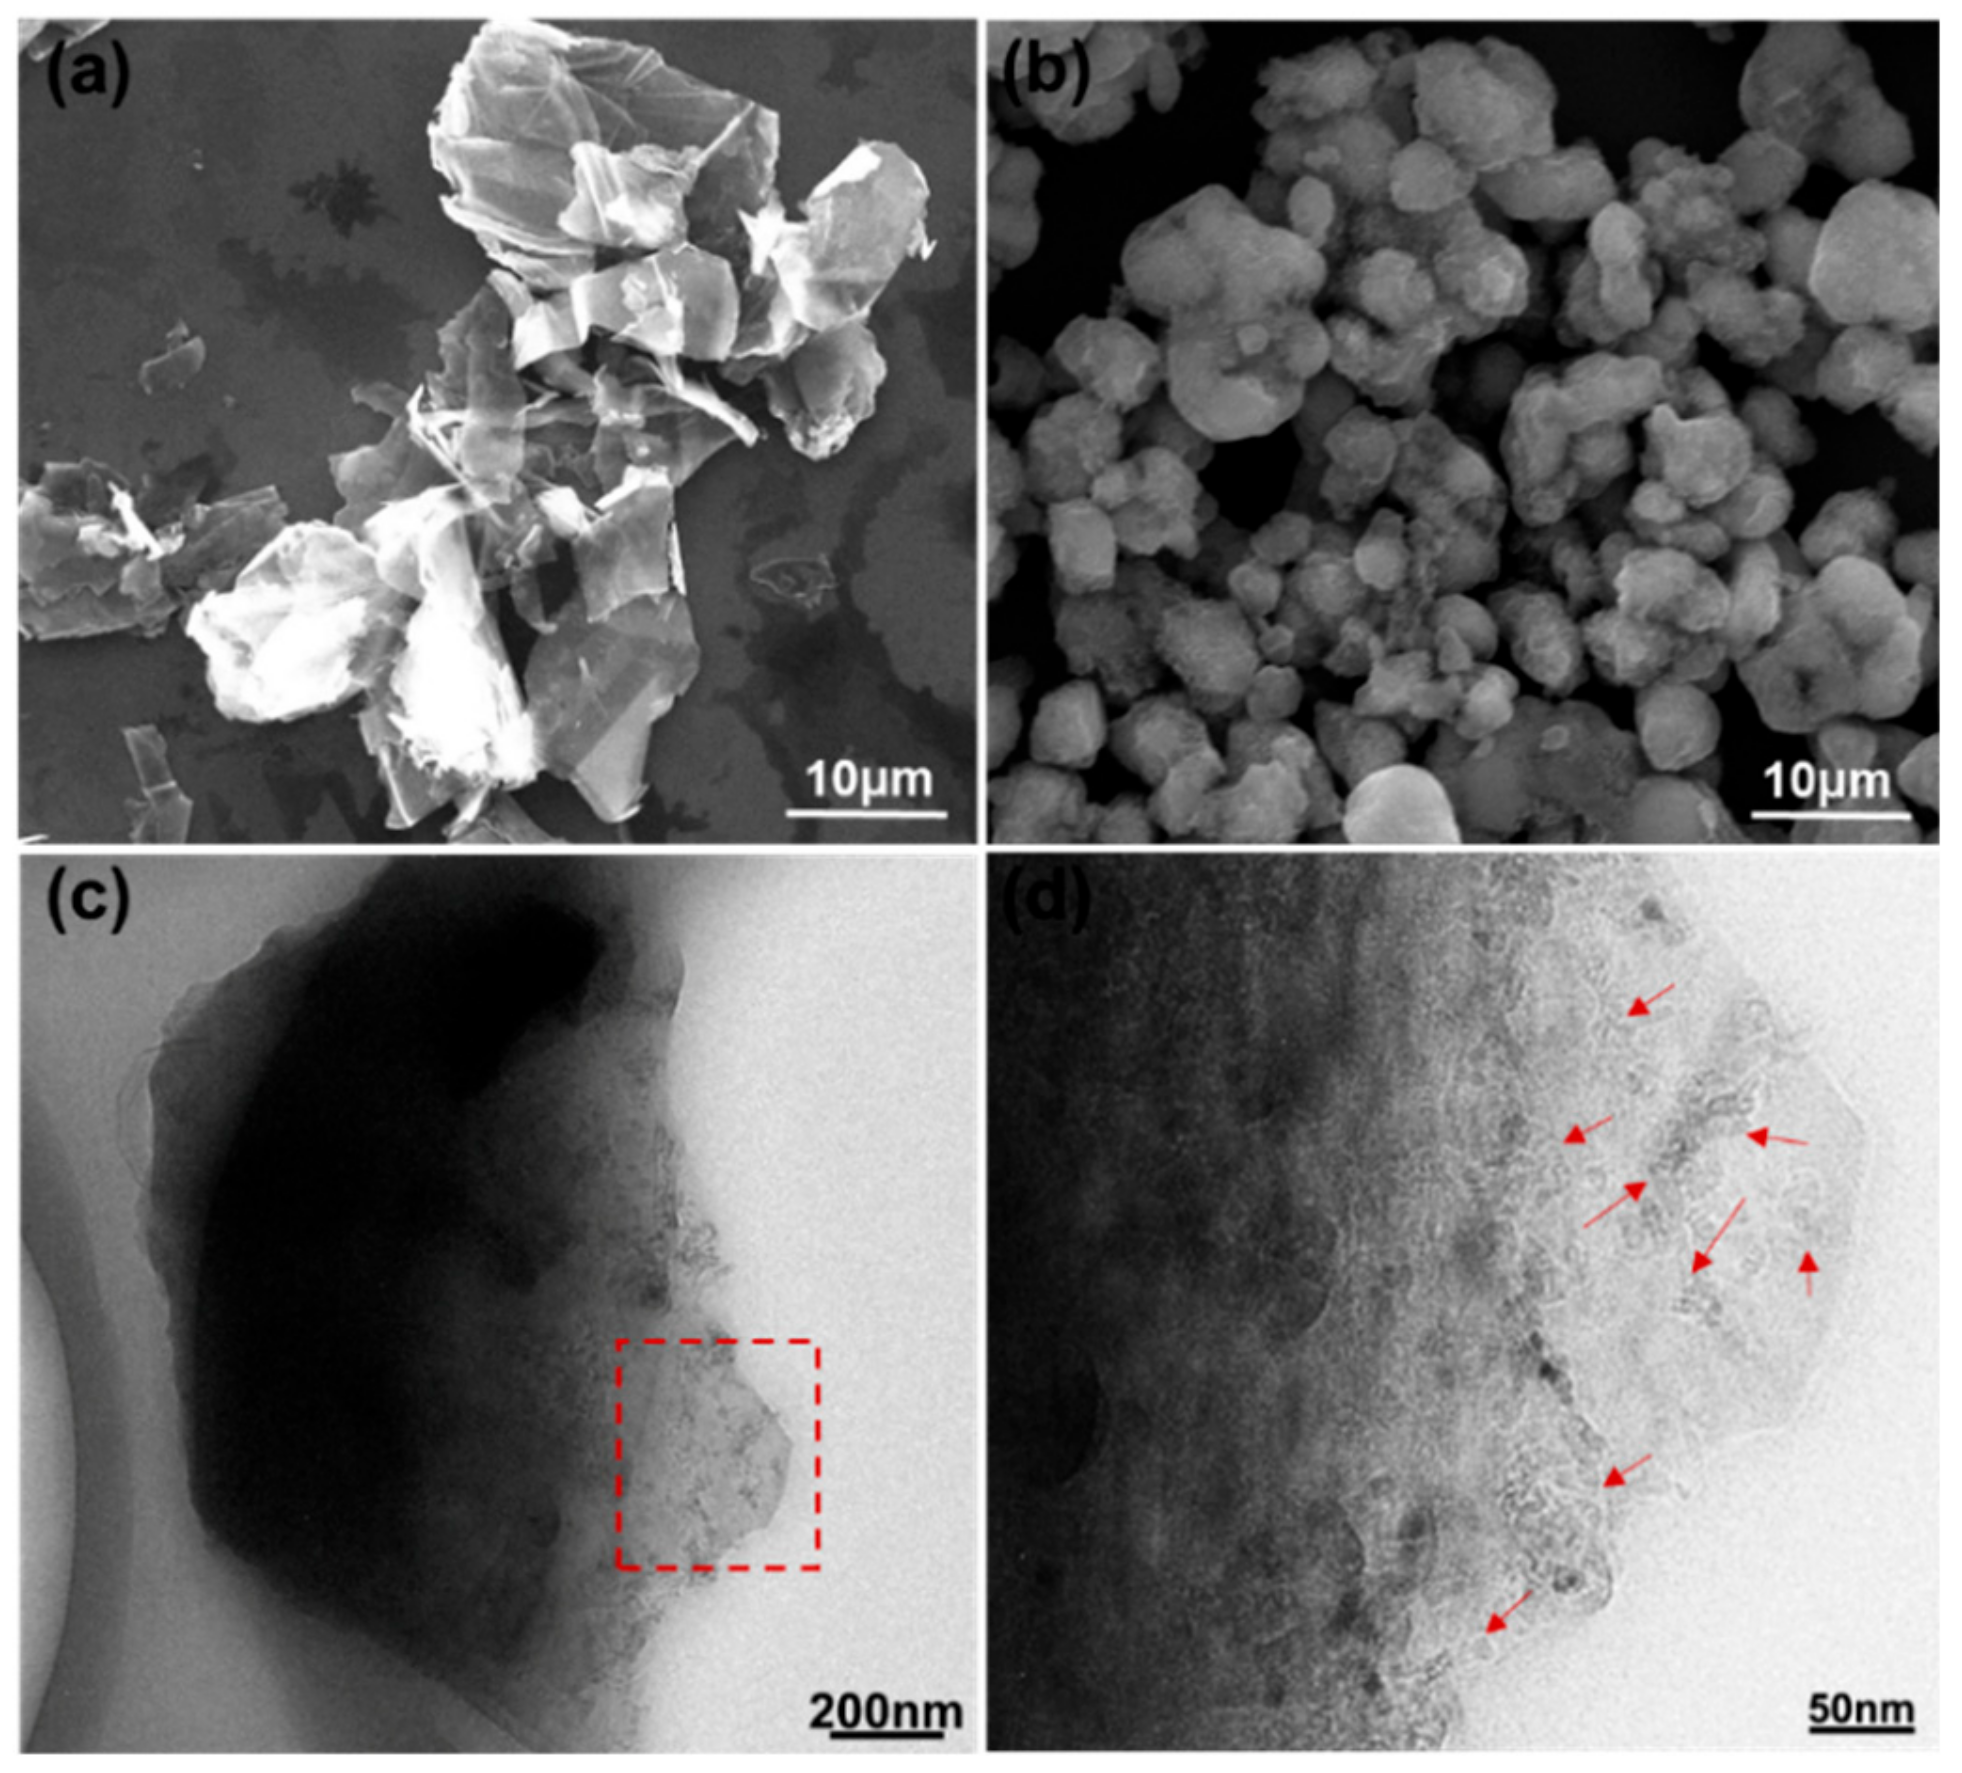
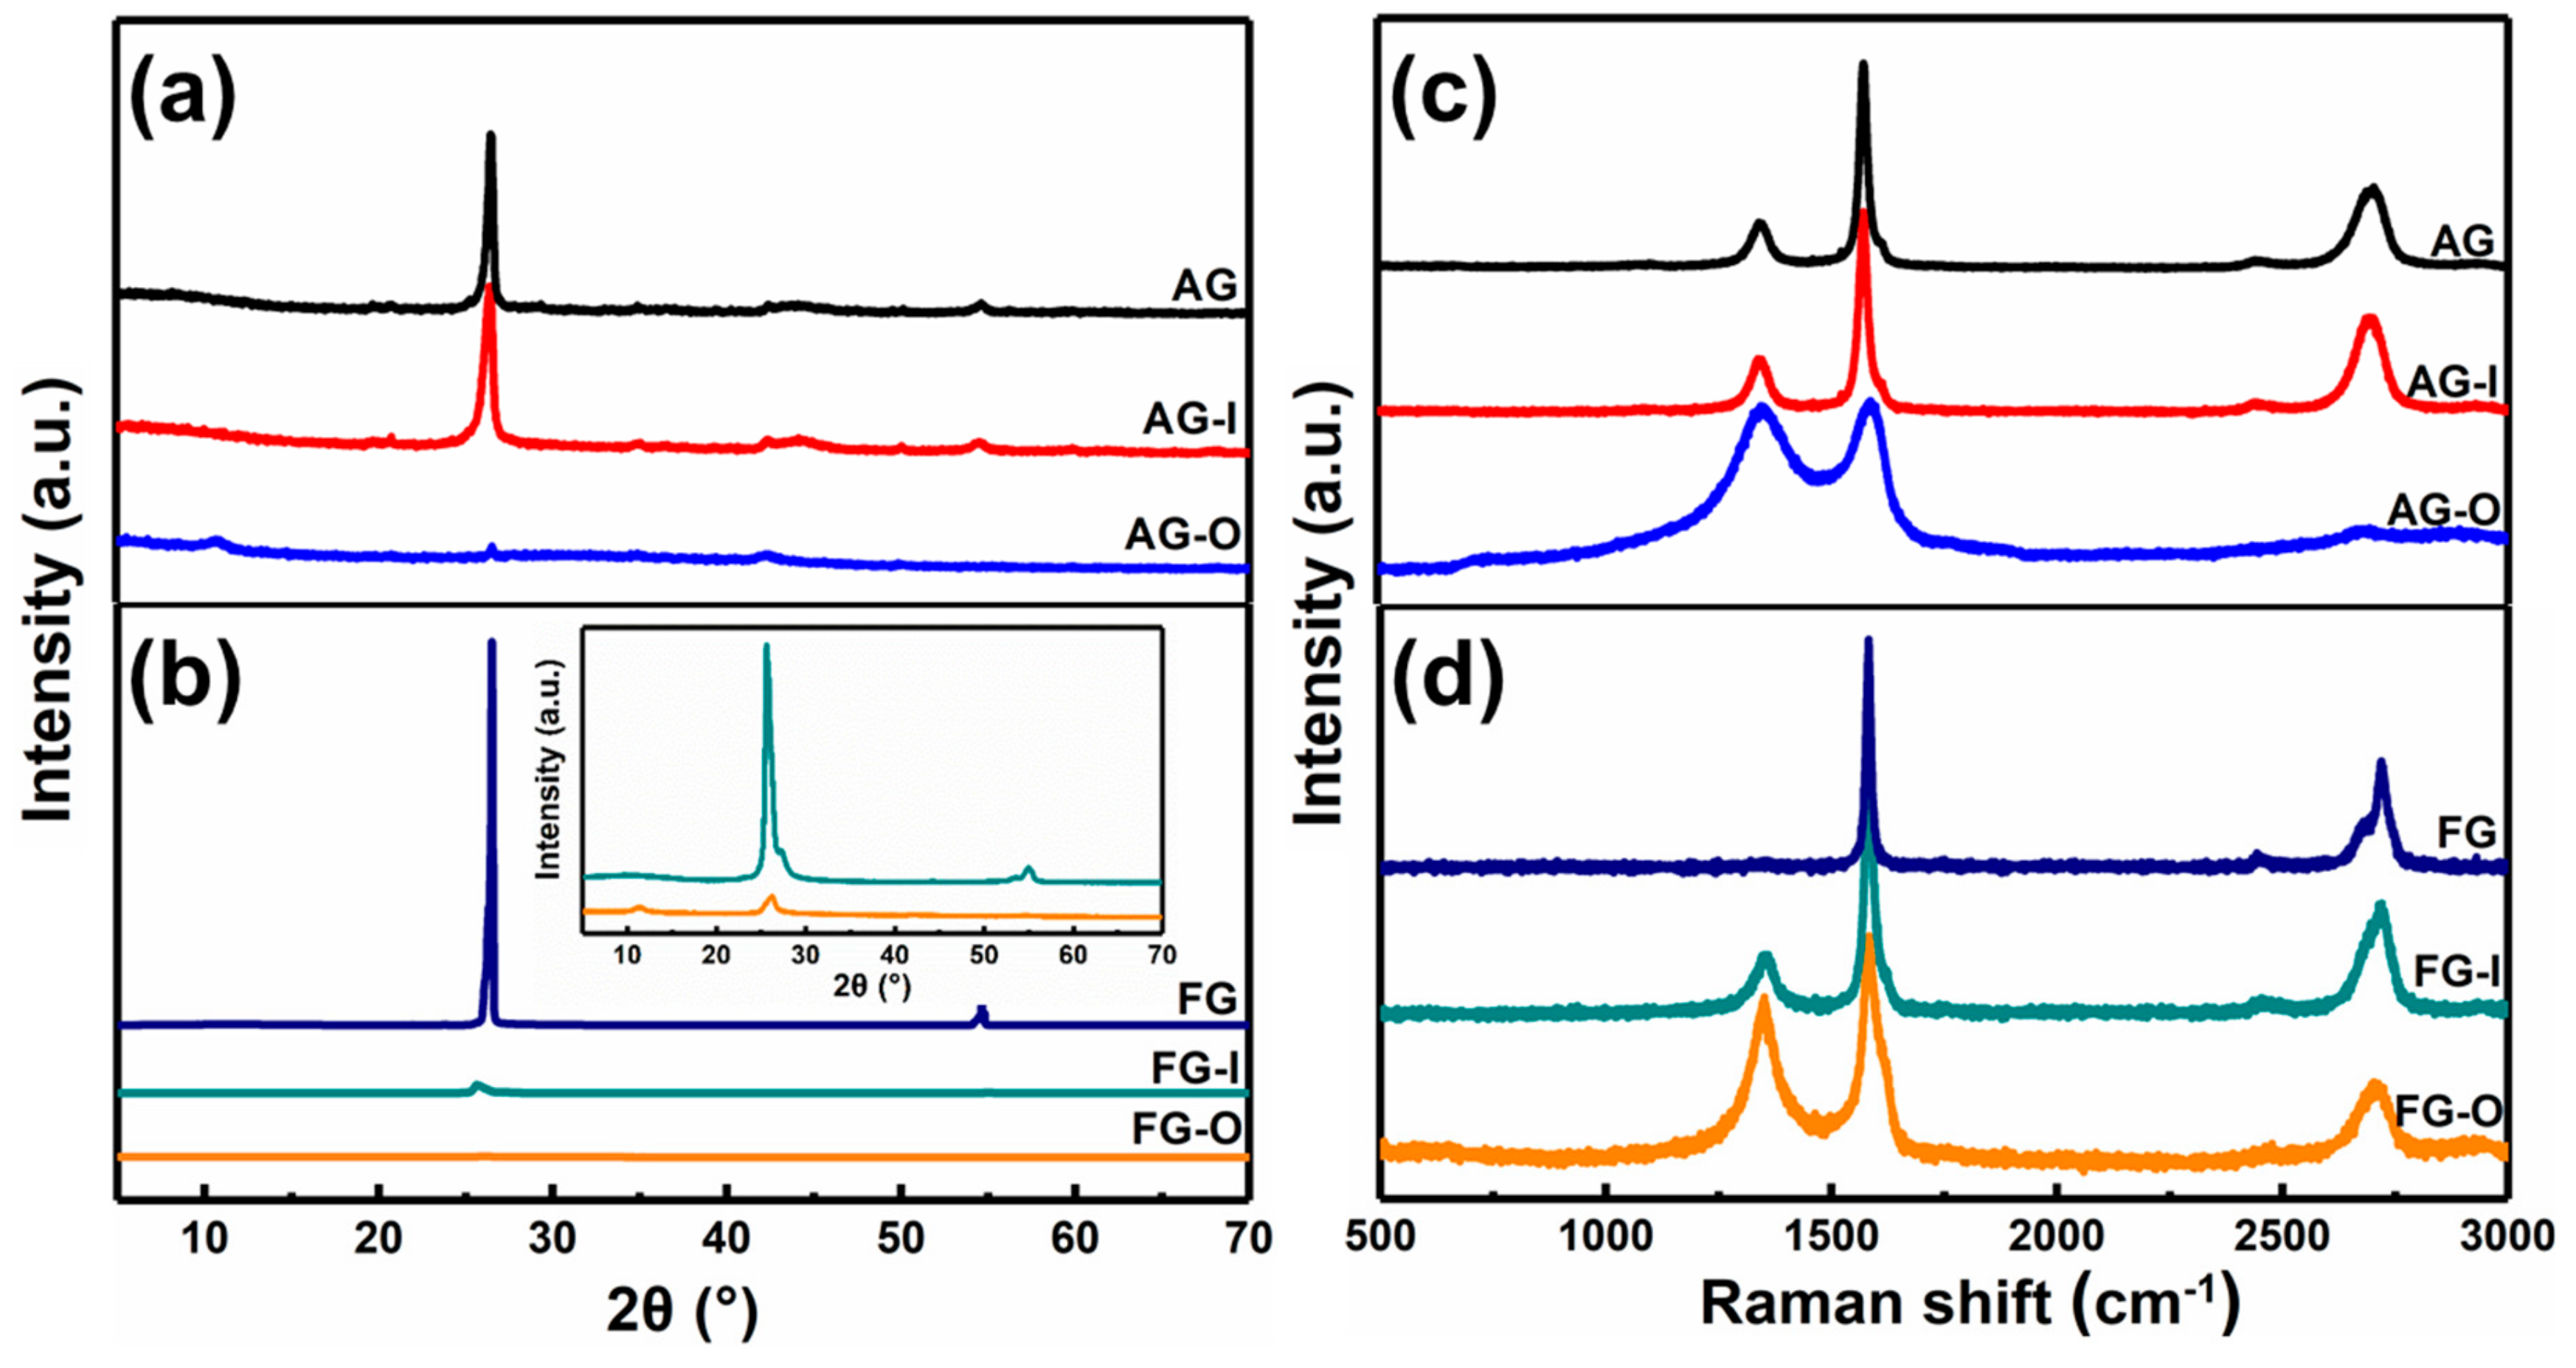
3.1. Synthesis and Characterization of GO-QDs from AG

The exfoliating of AG was carried out by a modified Hummers’ method, which is the most commonly used for the preparation of graphene oxide (GO) sheets [44]. TEM and AFM images in Figure 1a,b indicate that product synthesized from AG is composed of quantum dots with narrow size distribution. The average size of these GO-QDs is about 4.5 nm as calculated by counting 100 nanoparticles (Figure 1c). GO-QDs have an average thickness of ~3 nm, which corresponds to only 2–3 layers of graphene sheets (Figure 1c). The yield of these GO-QDs is about 40 wt. % of raw AG. So, a large amount of GO-QDs can be obtained with AG precursor, and the concentration of GO-QDs aqueous solution can reach up to 5 mg·mL−1 (Figure 1d). For comparison, FG were also adopted as precursors for preparing GO-QDs under the same conditions. Figure 1e shows that at low resolution the product synthesized from FG looks like a crumpled membrane with large size, which should be GO sheets. Small size quantum dots cannot be observed on this large crumpled membrane. If this product is further separated under 15,000 rpm for 30 min, large GO nanosheets are removed and small size GO nanosheets can be observed (Figure 1f). The size of these small GO nanosheets is mostly larger than 30 nm and not uniform, as well as the yield of these small GO sheets is less than 10 wt. % of raw FG. Above results demonstrate that GO-QDs with high yield and high quality can be synthesized by using low cost AG.

3.2. Synthesis Mechanism of GO-QDs from AG

To understand the synthesis mechanism of GO-QDs from AG, the difference between AG and FG were compared first. The morphology difference between AG and FG can be obviously observed from their SEM images. Figure 2a indicates that FG has a large layered structure. The average length of these layers is about 35 μm. Completely different from FG, AG has a particle structure (Figure 2b). The average diameter of AG particles is about 5 μm (Figure 2c). It is noteworthy that each AG particle contains a large amount of small graphite nanocrystals with size of less than 10 nm as pointed in Figure 2d. These graphite nanocrystals are not fully developed graphite crystals during the formation period. If these small graphite nanocrystals are exfoliated, GQDs will be obtained directly without needing high-intensity or repeated cutting.
To further investigate the structural difference, XRD and Raman spectroscopy of AG and FG were characterized. Figure S1a shows XRD patterns of AG and FG. It can be observed that there are two strong peaks at 26.5° and 54.6° in the XRD pattern of FG, which is characteristic peaks of (002) and (004) of graphite materials [45]. In the XRD pattern of AG, the intensity of these peaks is quite weaker than that of FG, which suggests the low c-axis order and poor crystallinity of AG. The positions of characteristic peaks of AG are the same as that of FG and no other impurities are detected in AG, suggesting the graphite nature of AG but not amorphous coal. The Raman spectrum of FG in Figure S1b reveals their defect-free graphite nature due to the absence of D bond signal. In AG, D band (1341 cm−1) is strong and ID/IG ratio is 0.48 attributing to smaller average size of sp2 domains in AG. The smaller the sp2 domain, the higher the edge concentration in AG is and the stronger the D band. These results are in accordance with the TEM and SEM results.
Tour and co-workers showed that the formation of GO from bulk graphite by modified Hummers’ method is a diffusive-controlled process [46]. Smaller-size flakes and lower crystalline graphite are oxidized significantly faster and more fully than the large and high crystalline flakes at same usage of oxidant. For investigating the mechanism in depth, the chemical and structural changes, which occurred during exfoliating of AG and FG, were monitored by XRD, Raman, FTIR, and TG analyses. The products obtained after intercalation by H2SO4 are defined as AG-I and FG-I, respectively, and the products obtained after oxidation by KMnO4 are defined as AG-O and FG-O, respectively. Figure 3 show XRD patterns and Raman spectra of AG, AG-I, AG-O, FG, FG-I, and FG-O. The corresponding data are listed in Table 1.
It can be observed that intercalation process has less effect on the structure of AG. However, for FG, after intercalation of H2SO4, the intensity of characteristic peak of (002) is dramatically decreased and ID/IG ratio increases to 0.71, indicating an increase of degree of disorders. The less effect of intercalation on AG is related to the more disorders of AG than FG. After oxidation, the characteristic peaks at 26.5° in AG and FG almost disappear and new peaks appear at 10.71° and 11.34°, respectively (Figure 3a,b). From Figure 3c,d and Table 1 it can be found that after oxidation ID/IG ratios of AG-O and FG-O all significantly increase compared with that of the corresponding precursors, indicating the destruction of conjugated sp2 networks. The ID/IG ratio of AG-O is much higher than that of FG-O, suggesting more oxygen-containing functional groups in AG-O than FG-O. The higher-degree oxidation of AG is also confirmed by FTIR and TG analyses in Figure 4. FG-O exhibits many vibration peaks of O−H stretch and bending at 3422 cm−1 and 1382 cm−1, respectively, attributed to hydroxyl and phenolic groups, C=C stretch of unoxidized sp2 carbon domain at 1622 cm−1, C–O stretch at 1235 cm−1 ascribed to phenols, ethers, and epoxy groups, and C–O stretch at 1048 and 1111 cm−1 attributed to hydroxyl groups (Figure 4a). All these mentioned peaks can be observed in AG-O, and they are stronger than those in FG-O. Additionally, C=O stretch at 1723 cm−1 attributed to carboxyl and carbonyl groups is detected in AG-O. TG analysis indicates that both FG-O and AG-O show two significant weight losses (∼10 and ∼17%) near 100 °C and (∼20 and ∼29%) in the range of 150–300 °C, owing to the evaporation of the trapped water molecules and thermal decomposition of oxygen-containing functional groups in the samples, respectively (Figure 4b). All above results demonstrate that AG has a higher degree oxidation. The oxidation is complete and homogeneous due to shorter diffusion path for oxidant between AG layers, which is difficult to achieve for FG at the same condition because of the diffusion resistance between large layers. A large amount of GO-QDs can be obtained by exfoliation of fully oxidized AG-O without further high-strength cutting (Figure 5).

3.3. Modification of GO-QDs and Their Applications

The obtained large amount of GO-QDs from AG can be used as precursor for GQDs with different properties. If GO-QDs are treated in pure water by hydrothermal method, brown GO-QDs turn into black GQDs. These GQDs can keep in good dispersion in water even after standing for 6 months (Figure 6a). TEM image in Figure 6b further confirms the monodispersing of GQDs. The concentration of the obtained GQDs dispersion can reach to 1 mg/ml. HRTEM image of GQDs was measured as shown in Figure 6b inset. The lattice distance of 0.24 nm is observed, suggesting the crystalline nature of GQDs. Controlled experiment was carried out by treating the product synthesized from FG at the same condition. The picture in Figure 6c indicates that after hydrothermal treatment the black agglomerate deposits at the bottom. During hydrothermal treatment, the large GO sheets (Figure 1e) with rich -OH and -COOH groups in the plane are very easy to connect with each other and form a 3D structure by the interaction of hydrogen bond [47] (Figure 6d).
XPS test further confirm the reduction of GO-QDs during hydrothermal treatment. Comparing with GO-QDs (Figure S2a), the binding energy peaks of GQDs do not shift, but their intensities drastically change. The intensities of oxygen-containing functional groups such as -C-O, -C=O, and -O-C=O significantly decrease. The peak intensity of C-C increases (Figure S2b). These results suggest the reduction of GO-QDs during hydrothermal treatment. GO-QDs has an orange-emission at 595 nm (Figure 7). After the removal of oxygen-containing functional groups, GQDs almost have no fluorescence emission. While a series of GQDs with different fluorescence properties can be easily synthesized from GO-QDs by adding modifiers during hydrothermal treatment. For example, three kinds of soluble fluorescent GQDs could be obtained by adding ammonia, NaBH4, and H3BO3 as modifier during hydrothermal treatment, respectively. These fluorescent GQDs are defined as GQDs-NH3·H2O, GQDs-NaBH4 and GQDs-H3BO3, respectively. These modified GQDs exhibit fluorescence emission at 425 nm, 435 nm, and 539 nm, respectively (Figure 7). Therefore, GQDs with different fluorescence properties for specific application requirements can be synthesized by AG in a large scale and its quality and quantity can be guaranteed by the special precursor. For example, the lifetime of GO-QDs is 1.07 ns and that of GQDs-NH3·H2O is 5.98 ns. Meanwhile, the quantum yield of GQDs-NH3·H2O (9.7%) is about twenty-five times as much as that of GO-QDS (0.4%) (Figure 8a and Table 2). After modification, the size of GQDs-NH3·H2O is almost the same as that of GO-QDs (Figure S3a). FTIR spectrum of GQDs-NH3·H2O demonstrates obvious N–H stretching vibration peaks in the range of 3300–3600 cm−1, N-H bending peak at 1655 cm−1 and C–H stretching vibration peak at 1412 cm−1 (Figure S3b). These results indicate the successful modification of GO-QDs by NH3·H2O. GQDs-NH3·H2O with higher quantum yield can be used as fluorescence probe for detecting metal ions in water. The results indicate that GQDs-NH3·H2O has a high selectivity for copper ions (Cu2+) (Figure 8b). Figure 8c displays the PL intensity spectra of GQDs-NH3·H2O with different concentration of Cu2+ at 323 nm excitation. It can be clearly observed that the fluorescence quenching of GQDs-NH3·H2O is naturally increasing with the increasing of Cu2+ concentration. The modified plot in Figure 8d shows the relationship of F/F0 and Cu2+ concentration. There is a distinct linear relationship between quenched PL intensity (ΔF/F0) and Cu2+ concentration in the range of 5 μM to 25 μM (Inset in Figure 8d). The limitation of detection can reach up to 0.4 μM, which is enough to satisfy the demand in detection for Cu2+ in wastewater.

4. Conclusions

In conclusion, AG was used for the synthesis of GQDs for the first time. Comparing with FG, the merits of AG as precursor for GQDs is as follows: (i) AG is low cost, (ii) the synthesis process does not need high-strength cutting step, (iii) the size of obtained GQDs is uniform, high yielding (~40%), and of good quality, (iv) can be easily modified according to the request of applications. It is believed that these GQDs synthesized by AG as precursor can be a candidate for graphene-based tunable luminescent material in many potential fields.

Supplementary Materials

The following are available online at https://www.mdpi.com/2079-4991/10/2/375/s1. Figure S1: (a) XRD patterns and (b) Raman spectra of AG and FG. Figure S2: XPS patterns of GO-QDs (a) and GQDs (b). Figure S3: (a) TEM image of GQDs-NH3·H2O.and (b) FTIR spectra of GQDs-NH3·H2O and GO-QDs.

Author Contributions

S.S. and J.Y. conceived the idea of experiment; J.W., Z.W., and Z.D. performed the experiments; S.S., J.W., Z.W., Z.D., and Z.T. discussed the results; S.S. and Z.W. wrote the original draft; S.S. and J.W. wrote, reviewed, and edited the manuscript. All authors have read and agreed to the published version of the manuscript.

Funding

This research was funded by Shanghai Scientific and Technological Innovation Project (19JC1410402), Shanghai Nature Science Foundation (16ZR1423400, 18ZR1426400), Shanghai Municipal Science and Technology Commission (16JC402200, 16060502300 and 18511110600) and the Innovation Program of Shanghai Municipal Education Commission (2019-01-07-00-07-E00015).

Conflicts of Interest

The authors declare no conflict of interest.

References

  1. Stankovich, S.; Dikin, D.A.; Piner, R.D.; Kohlhaas, K.A.; Kleinhammes, A.; Jia, Y.; Wu, Y.; Nguyen, S.T.; Ruoff, R.S. Synthesis of graphene-based nanosheets via chemical reduction of exfoliated graphite oxide. Carbon 2007, 45, 1558–1565. [Google Scholar] [CrossRef]
  2. Geim, A.K.; Novoselov, K.S. The rise of graphene. Nat. Mater. 2007, 6, 183–191. [Google Scholar] [CrossRef] [PubMed]
  3. Lee, C.; Wei, X.D.; Kysar, J.W.; Hone, J. Measurement of the elastic properties and intrinsic strength of monolayer graphene. Science 2008, 321, 385–388. [Google Scholar] [CrossRef] [PubMed]
  4. Liu, Y.; Dong, X.; Chen, P. Biological and chemical sensors based on graphene materials. Chem. Soc. Rev. 2012, 41, 2283–2307. [Google Scholar] [CrossRef] [PubMed]
  5. Perreault, F.; Fonseca de Faria, A.; Elimelech, M. Environmental applications of graphene-based nanomaterials. Chem. Soc. Rev. 2015, 44, 5861–5896. [Google Scholar] [CrossRef] [PubMed]
  6. Raccichini, R.; Varzi, A.; Passerini, S.; Scrosati, B. The role of graphene for electrochemical energy storage. Nat. Mater. 2015, 14, 271–279. [Google Scholar] [CrossRef]
  7. Abraham, J.; Vasu, K.S.; Williams, C.D.; Gopinadhan, K.; Su, Y.; Cherian, C.T.; Dix, J.; Prestat, E.; Haigh, S.J.; Grigorieva, I.V.; et al. Tunable sieving of ions using graphene oxide membranes. Nat. Nanotechnol. 2017, 12, 546–550. [Google Scholar] [CrossRef]
  8. Sun, J.; Lee, H.W.; Pasta, M.; Yuan, H.; Zheng, G.; Sun, Y.; Li, Y.; Cui, Y. A phosphorene-graphene hybrid material as a high-capacity anode for sodium-ion batteries. Nat. Nanotechnol. 2015, 10, 980–985. [Google Scholar] [CrossRef]
  9. Suvarnaphaet, P.; Pechprasarn, S. Graphene-Based Materials for Biosensors: A Review. Sensors 2017, 17, 2161. [Google Scholar] [CrossRef] [Green Version]
  10. Liao, L.; Peng, H.; Liu, Z. Chemistry makes graphene beyond graphene. J. Am. Chem. Soc. 2014, 136, 12194–12200. [Google Scholar] [CrossRef]
  11. Bartolomeo, A.D.; Luongo, G.; Iemmo, L.; Urban, F.; Giubileo, F. Graphene-Silicon Schottky diodes for photodetection. IEEE Trans. Nanotechnol. 2018, 17, 1133–1137. [Google Scholar] [CrossRef] [Green Version]
  12. Huang, Y.; Cheng, H.; Shi, G.; Qu, L. Highly Efficient Moisture-Triggered Nanogenerator Based on Graphene Quantum Dots. ACS Appl. Mater. Interfaces 2017, 9, 38170–38175. [Google Scholar] [CrossRef] [PubMed]
  13. Li, X.; Rui, M.; Song, J.; Shen, Z.; Zeng, H. Carbon and Graphene Quantum Dots for Optoelectronic and Energy Devices: A Review. Adv. Funct. Mater. 2015, 25, 4929–4947. [Google Scholar] [CrossRef]
  14. Zhu, S.; Zhang, J.; Qiao, C.; Tang, S.; Li, Y.; Yuan, W.; Li, B.; Tian, L.; Liu, F.; Hu, R.; et al. Strongly green-photoluminescent graphene quantum dots for bioimaging applications. Chem. Commun. 2011, 47, 6858–6860. [Google Scholar] [CrossRef]
  15. Zheng, P.; Wu, N. Fluorescence and Sensing Applications of Graphene Oxide and Graphene Quantum Dots: A Review. Chem. Asian J. 2017, 12, 2343–2353. [Google Scholar] [CrossRef]
  16. Kelarakis, A. Graphene quantum dots: In the crossroad of graphene, quantum dots and carbogenic nanoparticles. Curr. Opin. Colloid Interface Sci. 2015, 20, 354–361. [Google Scholar] [CrossRef]
  17. Xu, H.; Zhang, L.; Ding, Z.; Hu, J.; Liu, J.; Liu, Y. Edge-functionalized graphene quantum dots as a thickness-insensitive cathode interlayer for polymer solar cells. Nano Res. 2018, 11, 4293–4301. [Google Scholar] [CrossRef]
  18. Wang, Z.; Zeng, H.; Sun, L. Graphene quantum dots: versatile photoluminescence for energy, biomedical, and environmental applications. J. Mater. Chem. C 2015, 3, 1157–1165. [Google Scholar] [CrossRef]
  19. Li, K.; Liu, W.; Ni, Y.; Li, D.; Lin, D.; Su, Z.; Wei, G. Technical synthesis and biomedical applications of graphene quantum dots. J. Mater. Chem. B 2017, 5, 4811–4826. [Google Scholar] [CrossRef]
  20. Zhou, S.; Xu, H.; Gan, W.; Yuan, Q. Graphene quantum dots: recent progress in preparation and fluorescence sensing applications. RSC Adv. 2016, 6, 110775–110788. [Google Scholar] [CrossRef]
  21. Zheng, X.T.; Ananthanarayanan, A.; Luo, K.Q.; Chen, P. Glowing graphene quantum dots and carbon dots: properties, syntheses, and biological applications. Small 2015, 11, 1620–1636. [Google Scholar] [CrossRef] [PubMed]
  22. Tang, L.B.; Ji, R.B.; Cao, X.K.; Lin, J.Y.; Jiang, H.X.; Li, X.M.; Teng, K.S.; Luk, C.M.; Zeng, S.J.; Hao, J.H.; et al. Deep Ultraviolet Photoluminescence of Water-Soluble Self-Passivated Graphene Quantum Dots. ACS Nano 2012, 6, 5102–5110. [Google Scholar] [CrossRef] [PubMed]
  23. Dong, Y.; Shao, J.; Chen, C.; Li, H.; Wang, R.; Chi, Y.; Lin, X.; Chen, G. Blue luminescent graphene quantum dots and graphene oxide prepared by tuning the carbonization degree of citric acid. Carbon 2012, 50, 4738–4743. [Google Scholar] [CrossRef]
  24. Liu, R.; Wu, D.; Feng, X.; Mullen, K. Bottom-up fabrication of photoluminescent graphene quantum dots with uniform morphology. J. Am. Chem. Soc. 2011, 133, 15221–15223. [Google Scholar] [CrossRef] [PubMed]
  25. Yan, X.; Li, B.S.; Li, L.S. Colloidal Graphene Quantum Dots with Well-Defined Structures. Acc. Chem. Res. 2013, 46, 2254–2262. [Google Scholar] [CrossRef]
  26. Yang, S.; Sun, J.; Li, X.; Zhou, W.; Wang, Z.; He, P.; Ding, G.; Xie, X.; Kang, Z.; Jiang, M. Large-scale fabrication of heavy doped carbon quantum dots with tunable-photoluminescence and sensitive fluorescence detection. J. Mater. Chem. A 2014, 2, 8660. [Google Scholar] [CrossRef]
  27. Pan, D.; Zhang, J.; Li, Z.; Wu, M. Hydrothermal route for cutting graphene sheets into blue-luminescent graphene quantum dots. Adv. Mater. 2010, 22, 734–738. [Google Scholar] [CrossRef]
  28. Shin, Y.; Park, J.; Hyun, D.; Yang, J.; Lee, J.H.; Kim, J.H.; Lee, H. Acid-free and oxone oxidant-assisted solvothermal synthesis of graphene quantum dots using various natural carbon materials as resources. Nanoscale 2015, 7, 5633–5637. [Google Scholar] [CrossRef]
  29. Ahirwar, S.; Mallick, S.; Bahadur, D. Electrochemical method to prepare graphene quantum dots and graphene oxide quantum dots. ACS Omega 2017, 2, 8343–8353. [Google Scholar] [CrossRef] [Green Version]
  30. Li, Y.; Hu, Y.; Zhao, Y.; Shi, G.; Deng, L.; Hou, Y.; Qu, L. An electrochemical avenue to green-luminescent graphene quantum dots as potential electron-acceptors for photovoltaics. Adv. Mater. 2011, 23, 776–780. [Google Scholar] [CrossRef]
  31. Ananthanarayanan, A.; Wang, X.; Routh, P.; Sana, B.; Lim, S.; Kim, D.-H.; Lim, K.-H.; Li, J.; Chen, P. Facile Synthesis of Graphene Quantum Dots from 3D Graphene and their Application for Fe3+ Sensing. Adv. Funct. Mater. 2014, 24, 3021–3026. [Google Scholar] [CrossRef]
  32. Zhou, X.J.; Zhang, Y.; Wang, C.; Wu, X.C.; Yang, Y.Q.; Zheng, B.; Wu, H.X.; Guo, S.W.; Zhang, J.Y. Photo-Fenton Reaction of Graphene Oxide: A new strategy to prepare graphene quantum dots for DNA cleavage. ACS Nano 2012, 6, 6592–6599. [Google Scholar] [CrossRef] [PubMed]
  33. Li, Z.; Li, Z.; Wu, Y.; Nan, J.; Wang, H.; Zhang, X.; Zhang, J.; Yang, B. Tuning the bandgap of graphene quantum dots by gold nanoparticle-assisted O2 plasma etching. RSC Adv. 2016, 6, 97853–97860. [Google Scholar] [CrossRef]
  34. El-Hnayn, R.; Canabady-Rochelle, L.; Desmarets, C.; Balan, L.; Rinnert, H.; Joubert, O.; Medjahdi, G.; Ouada, H.B.; Schneider, R. One-step synthesis of diamine-functionalized graphene quantum dots from graphene oxide and their chelating and antioxidant activities. Nanomaterials 2020, 10, 104. [Google Scholar] [CrossRef] [Green Version]
  35. Chen, G.; Zhuo, Z.; Ni, K.; Kim, N.Y.; Zhao, Y.; Chen, Z.; Xiang, B.; Yang, L.; Zhang, Q.; Lee, Z.; et al. Rupturing C60 molecules into graphene-oxide-like quantum dots: structure, photoluminescence, and catalytic application. Small 2015, 11, 5296–5304. [Google Scholar] [CrossRef]
  36. Zhang, C.; Li, J.; Zeng, X.; Yuan, Z.; Zhao, N. Graphene quantum dots derived from hollow carbon nano-onions. Nano Res. 2018, 11, 174–184. [Google Scholar] [CrossRef]
  37. Peng, J.; Gao, W.; Gupta, B.K.; Liu, Z.; Romero-Aburto, R.; Ge, L.; Song, L.; Alemany, L.B.; Zhan, X.; Gao, G.; et al. Graphene quantum dots derived from carbon fibers. Nano Lett. 2012, 12, 844–849. [Google Scholar] [CrossRef]
  38. Ye, R.; Xiang, C.; Lin, J.; Peng, Z.; Huang, K.; Yan, Z.; Cook, N.P.; Samuel, E.L.; Hwang, C.C.; Ruan, G.; et al. Coal as an abundant source of graphene quantum dots. Nat. Commun. 2013, 4, 2943–2948. [Google Scholar] [CrossRef]
  39. Dong, Y.; Lin, J.; Chen, Y.; Fu, F.; Chi, Y.; Chen, G. Graphene quantum dots, graphene oxide, carbon quantum dots and graphite nanocrystals in coals. Nanoscale 2014, 6, 7410–7415. [Google Scholar] [CrossRef]
  40. Liu, F.; Jang, M.H.; Ha, H.D.; Kim, J.H.; Cho, Y.H.; Seo, T.S. Facile synthetic method for pristine graphene quantum dots and graphene oxide quantum dots: origin of blue and green luminescence. Adv. Mater. 2013, 25, 3657–3662. [Google Scholar] [CrossRef]
  41. Wang, Z.; Yu, J.; Zhang, X.; Li, N.; Liu, B.; Li, Y.; Wang, Y.; Wang, W.; Li, Y.; Zhang, L.; et al. Large-scale and controllable synthesis of graphene quantum dots from rice husk biomass: a comprehensive utilization strategy. ACS Appl. Mater. Interfaces 2016, 8, 1434–1439. [Google Scholar] [CrossRef] [PubMed]
  42. Lin, S.F.; Liu, F.X.; Chen, G.H. Effective production of nano-sized graphene via straight-forward exfoliation of microcrystalline graphite. RSC Adv. 2014, 4, 45885–45889. [Google Scholar] [CrossRef]
  43. Wang, J.; Huang, J.; Yan, R.; Wang, F.; Cheng, W.; Guo, Q.; Wang, J. Graphene microsheets from natural microcrystalline graphite minerals: scalable synthesis and unusual energy storage. J. Mater. Chem. A 2015, 3, 3144–3150. [Google Scholar] [CrossRef]
  44. Han, Z.; Tang, Z.; Li, P.; Yang, G.; Zheng, Q.; Yang, J. Ammonia solution strengthened three-dimensional macro-porous graphene aerogel. Nanoscale 2013, 5, 5462–5467. [Google Scholar] [CrossRef]
  45. Li, Z.Q.; Lu, C.J.; Xia, Z.P.; Zhou, Y.; Luo, Z. X-ray diffraction patterns of graphite and turbostratic carbon. Carbon 2007, 45, 1686–1695. [Google Scholar] [CrossRef]
  46. Dimiev, A.M.; Tour, J.M. Mechanism of graphene oxide formation. ACS Nano 2014, 8, 3060–3068. [Google Scholar] [CrossRef]
  47. Wasalathilake, K.C.; Galpaya, D.G.D.; Ayoko, G.A.; Yan, C. Understanding the structure-property relationships in hydrothermally reduced graphene oxide hydrogels. Carbon 2018, 137, 282–290. [Google Scholar] [CrossRef]
Figure 1. (a) Transmission electron microscope (TEM) and atomic force microscope (AFM). (b) Images of graphene oxide quantum dots (GO-QDs) synthesized from aphanitic graphite (AG). (c) Lateral size and height distribution. (d) Mass produced GO-QDs aqueous solution. (e) TEM image of GO synthesized from flake graphite (FG). (f) GO nanosheets synthesized from FG. (Separated at 15,000 rpm for 30 min).
Nanomaterials 10 00375 g001
Figure 2. (a) SEM image of FG, (bd) SEM and TEM images of aphanitic graphite (AG). The red arrows in Figure 2d point the small graphite nanocrystals.
Nanomaterials 10 00375 g002
Figure 3. (a) XRD patterns and (c) Raman spectra of AG, AG-I, AG-O. (b) XRD patterns and (d) Raman spectra of FG, FG-I, and FG-O.
Nanomaterials 10 00375 g003
Figure 4. (a) FTIR spectra and (b) TG curves of FG-O and AG-O.
Nanomaterials 10 00375 g004
Figure 5. Schematic of the exfoliating of (a) AG and (b) FG with the same amount of intercalator and oxidizer.
Nanomaterials 10 00375 g005
Figure 6. (a) Picture and (b) TEM and HRTEM (inset) images of GQDs by hydrothermal treatment of GO-QDs. (c) Picture and (d) SEM image of product after hydrothermal treatment of GO.
Nanomaterials 10 00375 g006
Figure 7. PL spectra of GO-QDs, GQDs-NH3·H2O, GQDs-NaBH4 and GQDs-H3BO3 excited at 323 nm. The insets are their corresponding digital photographs (λex = 365 nm).
Nanomaterials 10 00375 g007
Figure 8. (a) Time resolved PL decay curves of GO-QDs and GQDs-NH3·H2O. (b) The effect of different metal ions on the PL intensity of GQDs-NH3·H2O, (c) PL quenching of GQDs-NH3·H2O with different concentration of Cu2+, and (d) the relationship of F/F0 and Cu2+ concentration.
Nanomaterials 10 00375 g008
Table 1. Comparation of XRD and Raman data of AG and FG during exfoliating.
MeasurementsPristineAfter IntercalationAfter Oxidation
2θ(°)AG26.526.410.7
FG26.525.711.3
ID/IGAG0.480.602.65
FG00.711.31
Table 2. Exponential fitting results for time resolved PL decay curves of GO-QDs and GQDs-NH3·H2O.
Samplesτ1(ns)A1(%)τ2(ns)A2(%)Lifetime(ns)
GO-QDs0.605675.952.534624.051.07 ns
GQDs-NH3·H2O2.134936.598.198963.415.98 ns

