Article

A SnO2/CeO2 Nano-Composite Catalyst for Alizarin Dye Removal from Aqueous Solutions

by
Saad S. M. Hassan
1,*,
Ayman H. Kamel
1,*,
Amr A. Hassan
1,2,
Abd El-Galil E. Amr
3,4,*,
Heba Abd El-Naby
1 and
Elsayed A. Elsayed
5,6
1
Chemistry Department, Faculty of Science, Ain Shams University, Abbasia 11566, Cairo, Egypt
2
Department of Chemistry, Virginia Commonwealth University, Richmond, VA 23284, USA
3
Pharmaceutical Chemistry Department, Drug Exploration & Development Chair (DEDC), College of Pharmacy, King Saud University, Riyadh 11451, Saudi Arabia
4
Applied Organic Chemistry Department, National Research Center, Dokki 12622, Giza, Egypt
5
Bioproducts Research Department, Zoology Department, Faculty of Science, King Saud University, Riyadh 11451, Saudi Arabia
6
Chemistry of Natural and Microbial Products Department, National Research Centre, Dokki 12622, Cairo, Egypt
*
Authors to whom correspondence should be addressed.
Nanomaterials 2020, 10(2), 254; https://doi.org/10.3390/nano10020254
Submission received: 10 January 2020 / Revised: 25 January 2020 / Accepted: 27 January 2020 / Published: 1 February 2020

Abstract

:
A new SnO2/CeO2 nano-composite catalyst was synthesized, characterized and used for the removal of alizarin dyes from aqueous solutions. The composite material was prepared using a precipitation method. X-ray powder diffractometry (XRD), high resolution transmission electron microscopy (HR-TEM), Brunauer–Emmett–Teller methodology (BET) and Fourier Transform Infrared Spectrometry (ATR-FTIR) were utilized for the characterization of the prepared composite. The prepared nano-composite revealed high affinity for the adsorption and decomposition of alizarin dyes. The adsorption capacity under different experimental conditions (adsorbate concentration, contact time, adsorbent dose and pH) was examined. Under optimized experimental conditions, the removal of alizarin yellow, alizarin red and alizarin-3-methylimino-diacetic acid dyes from aqueous solutions was about 96.4%,87.8% and 97.3%, respectively. The adsorption isotherms agreed with the models of Langmuir, Freundlich and Temkin isotherms.

Graphical Abstract

1. Introduction

The lack of water resources requires humanity to save each drop of it, but unfortunately there are plenty of pollutants that may affect the quality of the water resources. The contamination of water resources with dyes is an important source of pollution. Many industries use dyes during processing of their products such as textiles, dyestuff, distilleries, tanneries, paper, rubber, plastics, leather, cosmetics, food and pharmaceuticals for the coloration of their products. Hence, effluents from these industries commonly contain dye residue. Millions of tons of dye effluent are dumped into water bodies and cause environmental problems [1].
Alizarin dye (1,2-dihydroxy-9,10 anthraquinone sulfonic acid sodium salt) is a pollutant, released chiefly by textile industries. Suspected carcinogenic effects of this dye make it important to remove it from water [2,3,4]. Membrane separation, ion-exchange methods [5,6], photocatalysis [7,8,9,10], the electro-Fenton process [11] and adsorption methods [12,13,14,15,16,17,18,19,20,21] are commonly used techniques for the removal of this group of dyes.
Nano-technology offers an opportunity to develop adsorbents with large surface area [22], high adsorption capacity, high removal rate and large number of active surface sites [23]. In recent years, metal oxide nano-composites have attracted considerable attention for energy and environmental applications because of their ease of fabrication, low processing cost and, particularly, that the presence of nano-grains with various sizes and various kinds of nano-composite materials have been investigated for efficient removal of different organic pollutants. For example, either SnO2or CeO2nano-particles (NPs) coupled with some metal oxides such as TiO2 [24], ZnO [25], CeO2 [26], MnO2 [27] and Fe3O4 [28] are used as for the removal of dyes.
In the present work, SnO2 doped with CeO2nano-particles was prepared using a simple and cost effective co-precipitation method at room temperature and utilized for the removal of some alizarin dyes. The composite was characterized by different spectrochemical techniques. Physical parameters affecting maximum dye removal were examined.

2. Materials and Methods

2.1. Materials

All chemicals used were of analytical reagent grade. Alizarin red S was purchased from Riedel-Dehaën (Delhi, India), and alizarin-3-methylimino-diacetic acid was from Fluka (Ronkonoma, NY, USA). Ceric ammonium nitrate (NH4)2Ce(NO3)6 was from SDFCL (Delhi, India). Ammonium hydroxide and tin (IV) chloride pentahydrate SnCl4.5H2O were from ADWIC (Cairo, Egypt). Polyethylene glycol 6000 was from Merck (St. Lois, MO, USA). All chemicals were used as received without any further purification.

2.2. Preparation of SnO2/CeO2 Nano-Composite Catalyst

Three and one-half grams of SnCl4·5H2O and 0.274 g of (NH4)2Ce (NO3)6 were dissolved in 100 mL distilled water followed by addition of 1.0 g polyethylene glycol (PEG) as a stabilizing agent. The mixture was kept under magnetic stirring for one hour. To the above mixture, ammonia solution (35.04 v/v%) was added drop-wise with vigorous stirring until the solution reached pH 9. The mixture was kept under magnetic stirring for another two hours and then left overnight. The precipitate was filtered off and washed with distilled water until the washings were free from chloride ion. The obtained yellowish precipitate was then dried at 70 °C for two hours and calcined at 900 °C in air for three hours.

2.3. Characterization of Nano-Composite Catalyst

The prepared composite was characterized using high-resolution transmission electron microscopy (HR-TEM) using Jeol 2100 (Osaka, Japan), X-ray powder diffractometry (XRD) using X’Pert PRO, PANalytical (Amsterdam, The Netherlands) with CuKα radiation (λ = 0.154060 nm) in the angular region of 2θ = 4–80° operated at 40 KV and 40 mA. The spectra were recorded at a scanning speed of 8° min−1. A Nicolet™ iS50 (ATR-FTIR) spectrometer was used in a spectral range of 4000–500 cm−1. The Brunauer–Emmett–Teller (BET) surface area measurements were carried out by nitrogen adsorption–desorption at 77 K using NOVA 3200s (Florida, CA, USA), at the relative pressure (P/Po) of 0.95104.

2.4. Dye Uptake Study

Fifteen milligrams of the adsorbent (SnO2/CeO2 nano-composite) was added to 30 mL aliquots of alizarin dye solutions (25, 30, 40, 50, 60, 70, 80 and 90 µg/mL). The solutions were stirred for 30 min at room temperature and filtered. Dye concentrations, before and after the treatment, were measured spectrophotometrically at λmax (422 or 515 nm) in an acidic and alkaline medium, respectively. The removal percentage of the dye was calculated using the following equation:
Removal % = [(C0Ct)/C0] × 100
where C0 and Ct are the dye concentration in mg/L at initial and after time t, respectively.

2.5. Adsorption Studies

Aliquots (30 mL) of varying concentrations (25–90 mg/L) of the dye solution were treated with different adsorbent doses (0.01–0.2 gm), under different pH values (2–9) for varying contact times (5–180 min). The dye solutions were stirred and filtered, and the dye concentration was spectrophotometrically measured at either λmax 422 or 515 nm in the pH range 2–5 and pH range 6–9, respectively.

3. Results and Discussions

3.1. Characterization of the Nano-Composite Catalyst

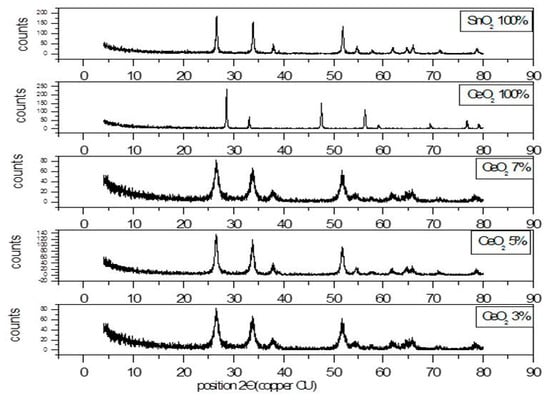
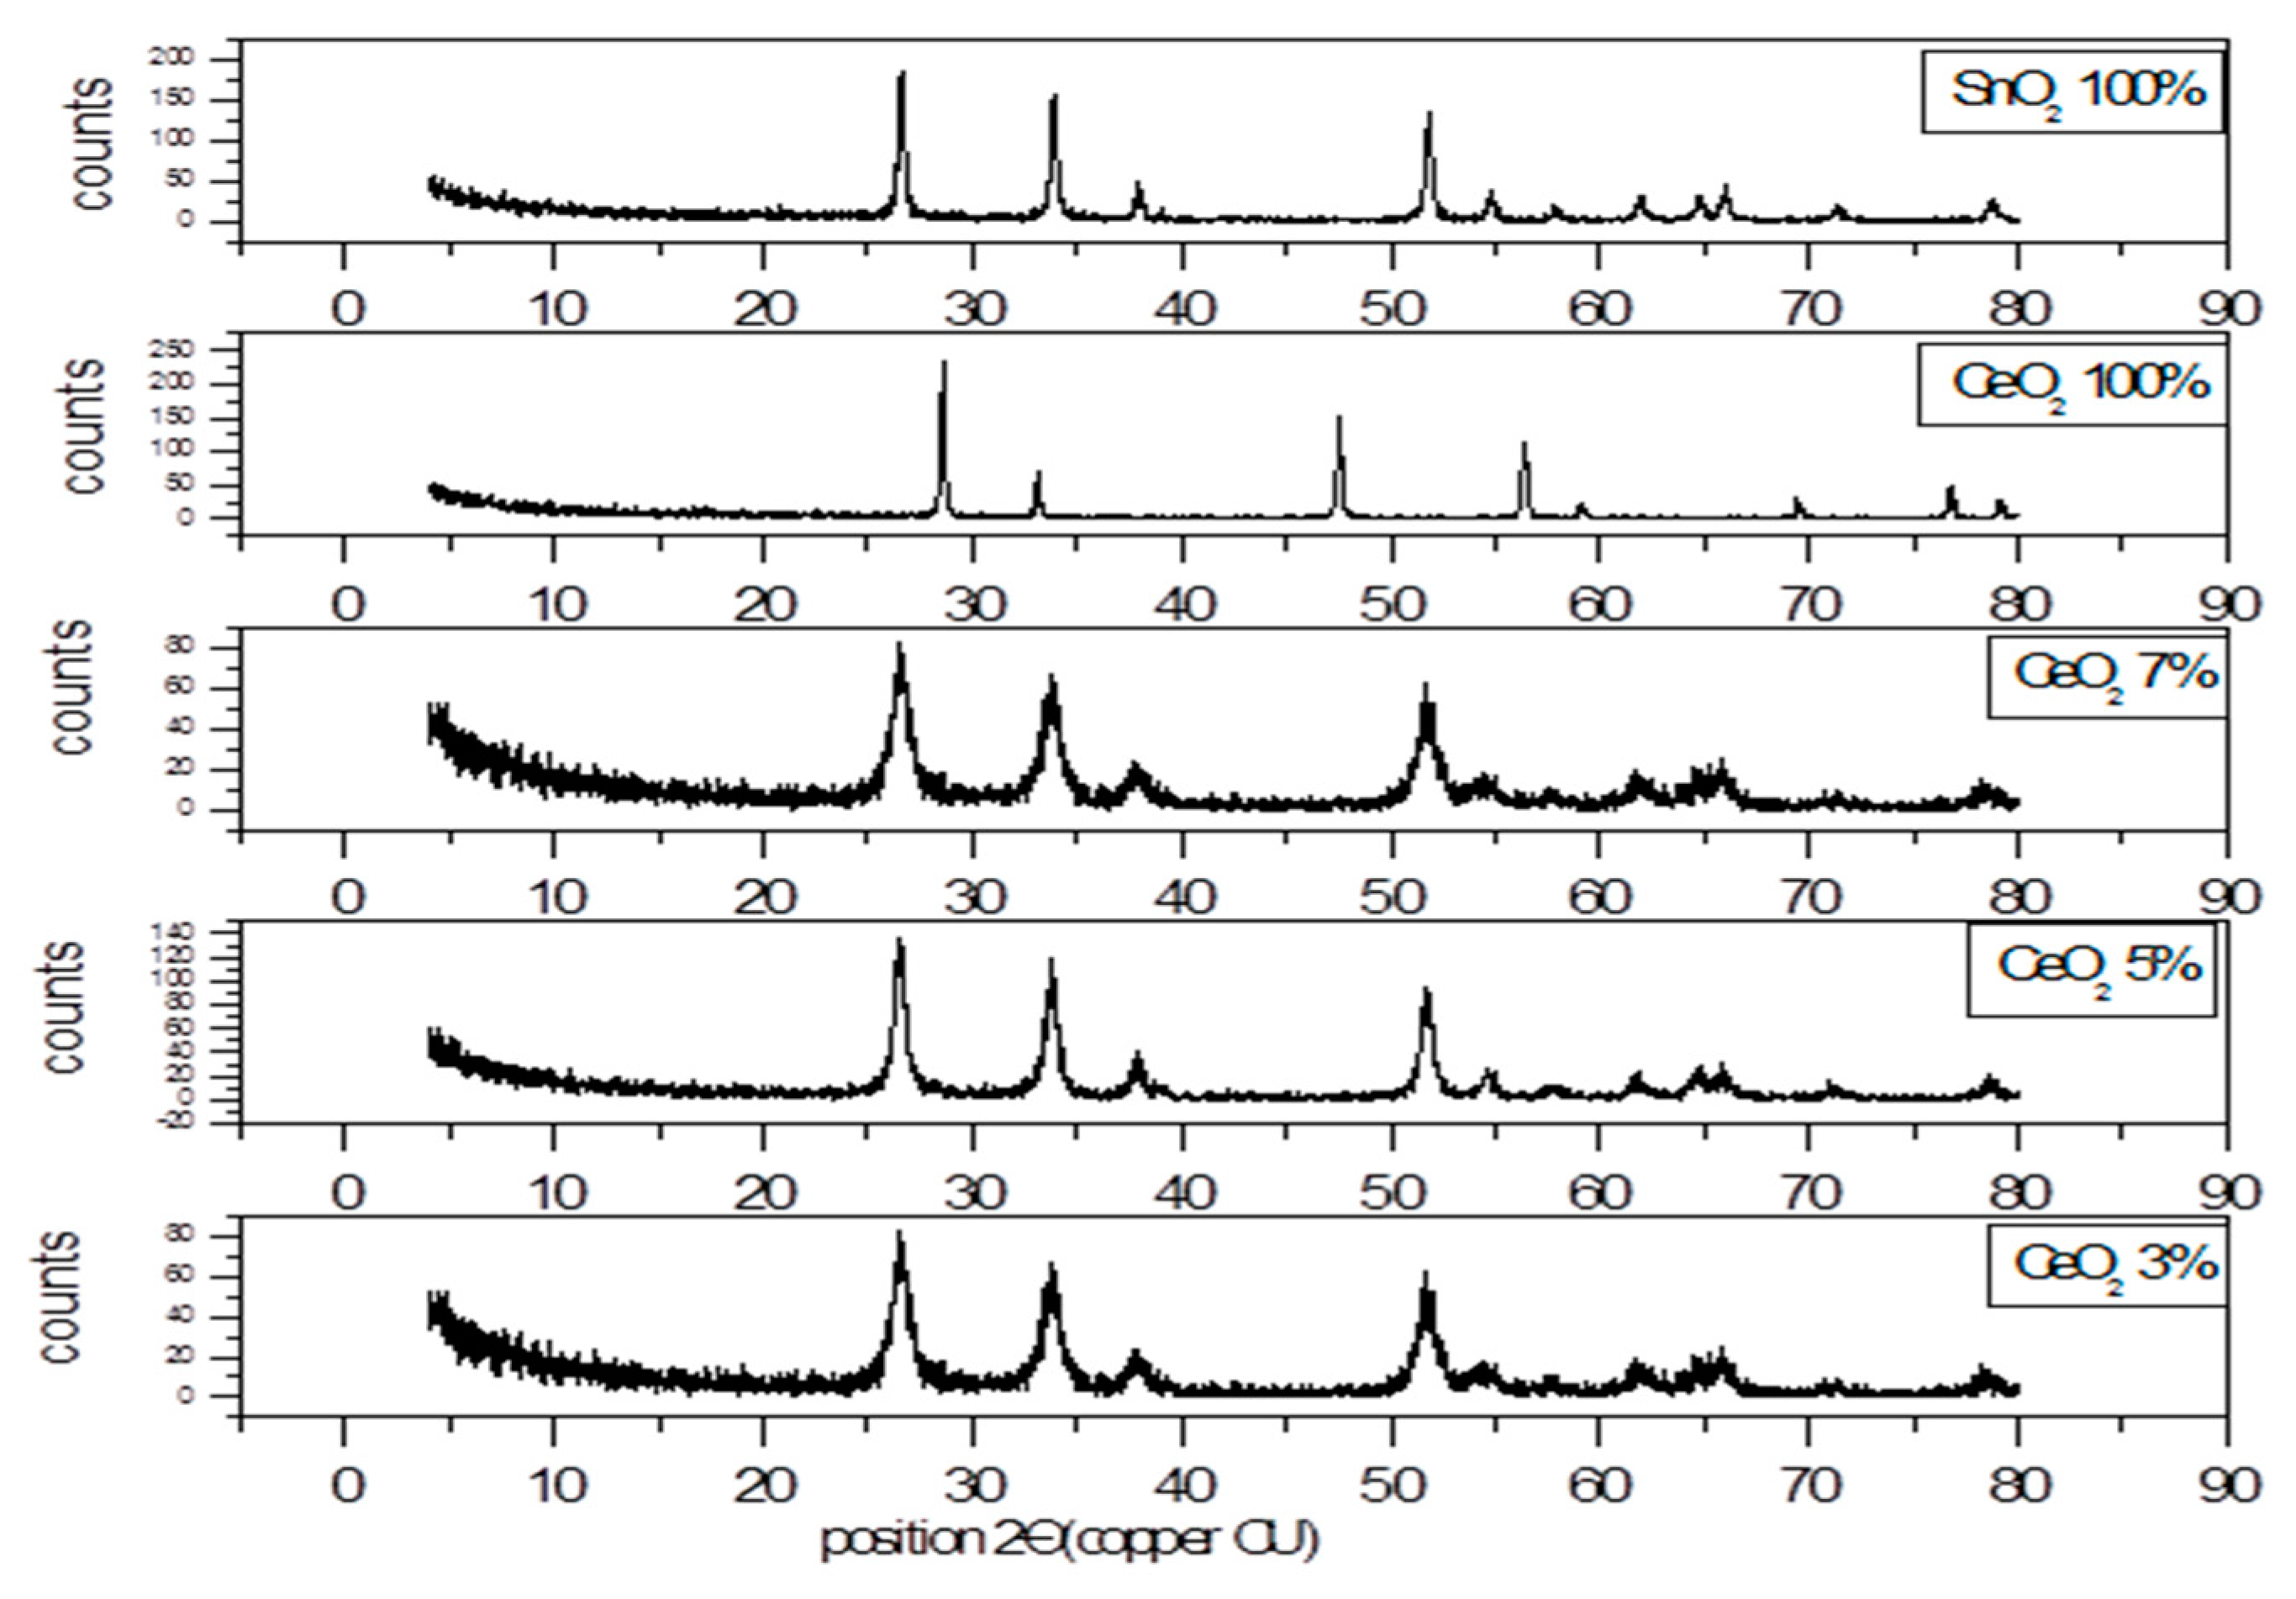
3.1.1. X-ray Diffraction Pattern of SnO2/CeO2 Nano-Composite

Tin oxide/cerium oxide (SnO2/CeO2) nano-composite materials consisting of 93–97% SnO2 and 7–3% CeO2 were prepared and characterized. The XRD pattern (Figure 1) of the pure SnO2 and CeO2 showed peaks matched with the diffraction data of the tetragonal structure of tin oxide (JCPDS 04-008-8131) and of the cubic structure of CeO2 (JCPDS 00-033–0334). On the other hand, the composites showed main diffraction patterns at 26.4°, 34.3° and 52.4° corresponding to (110), (101) and (211) of SnO2. No characteristic peaks of the CeO2 composite appeared in the XRD spectrum due to the small amount of this oxide in the composite. The mean crystallite size (D) of the nano-particles was calculated using the Debye–Scherrer formula [29] (Equation (2)).
D = /βcosθ
where K and λ are the Scherrer constant and the X-ray wavelength of radiation used ( − Cu = 0.154060 nm), respectively. The constants β and θ are the full width at half maximum (FWHM) of diffraction peak and the Bragg diffraction angle, respectively. Since the position of the main peak is (2θ = 26.42) and the width of the peak is 0.3149 nm, the crystallite size (D) is about 27 nm SnO2 doped with 5% CeO2. The mean crystallite size (D) of SnO2 doped with 3% and 7% CeO2 nano-particles was estimated to be 18.06 nm.

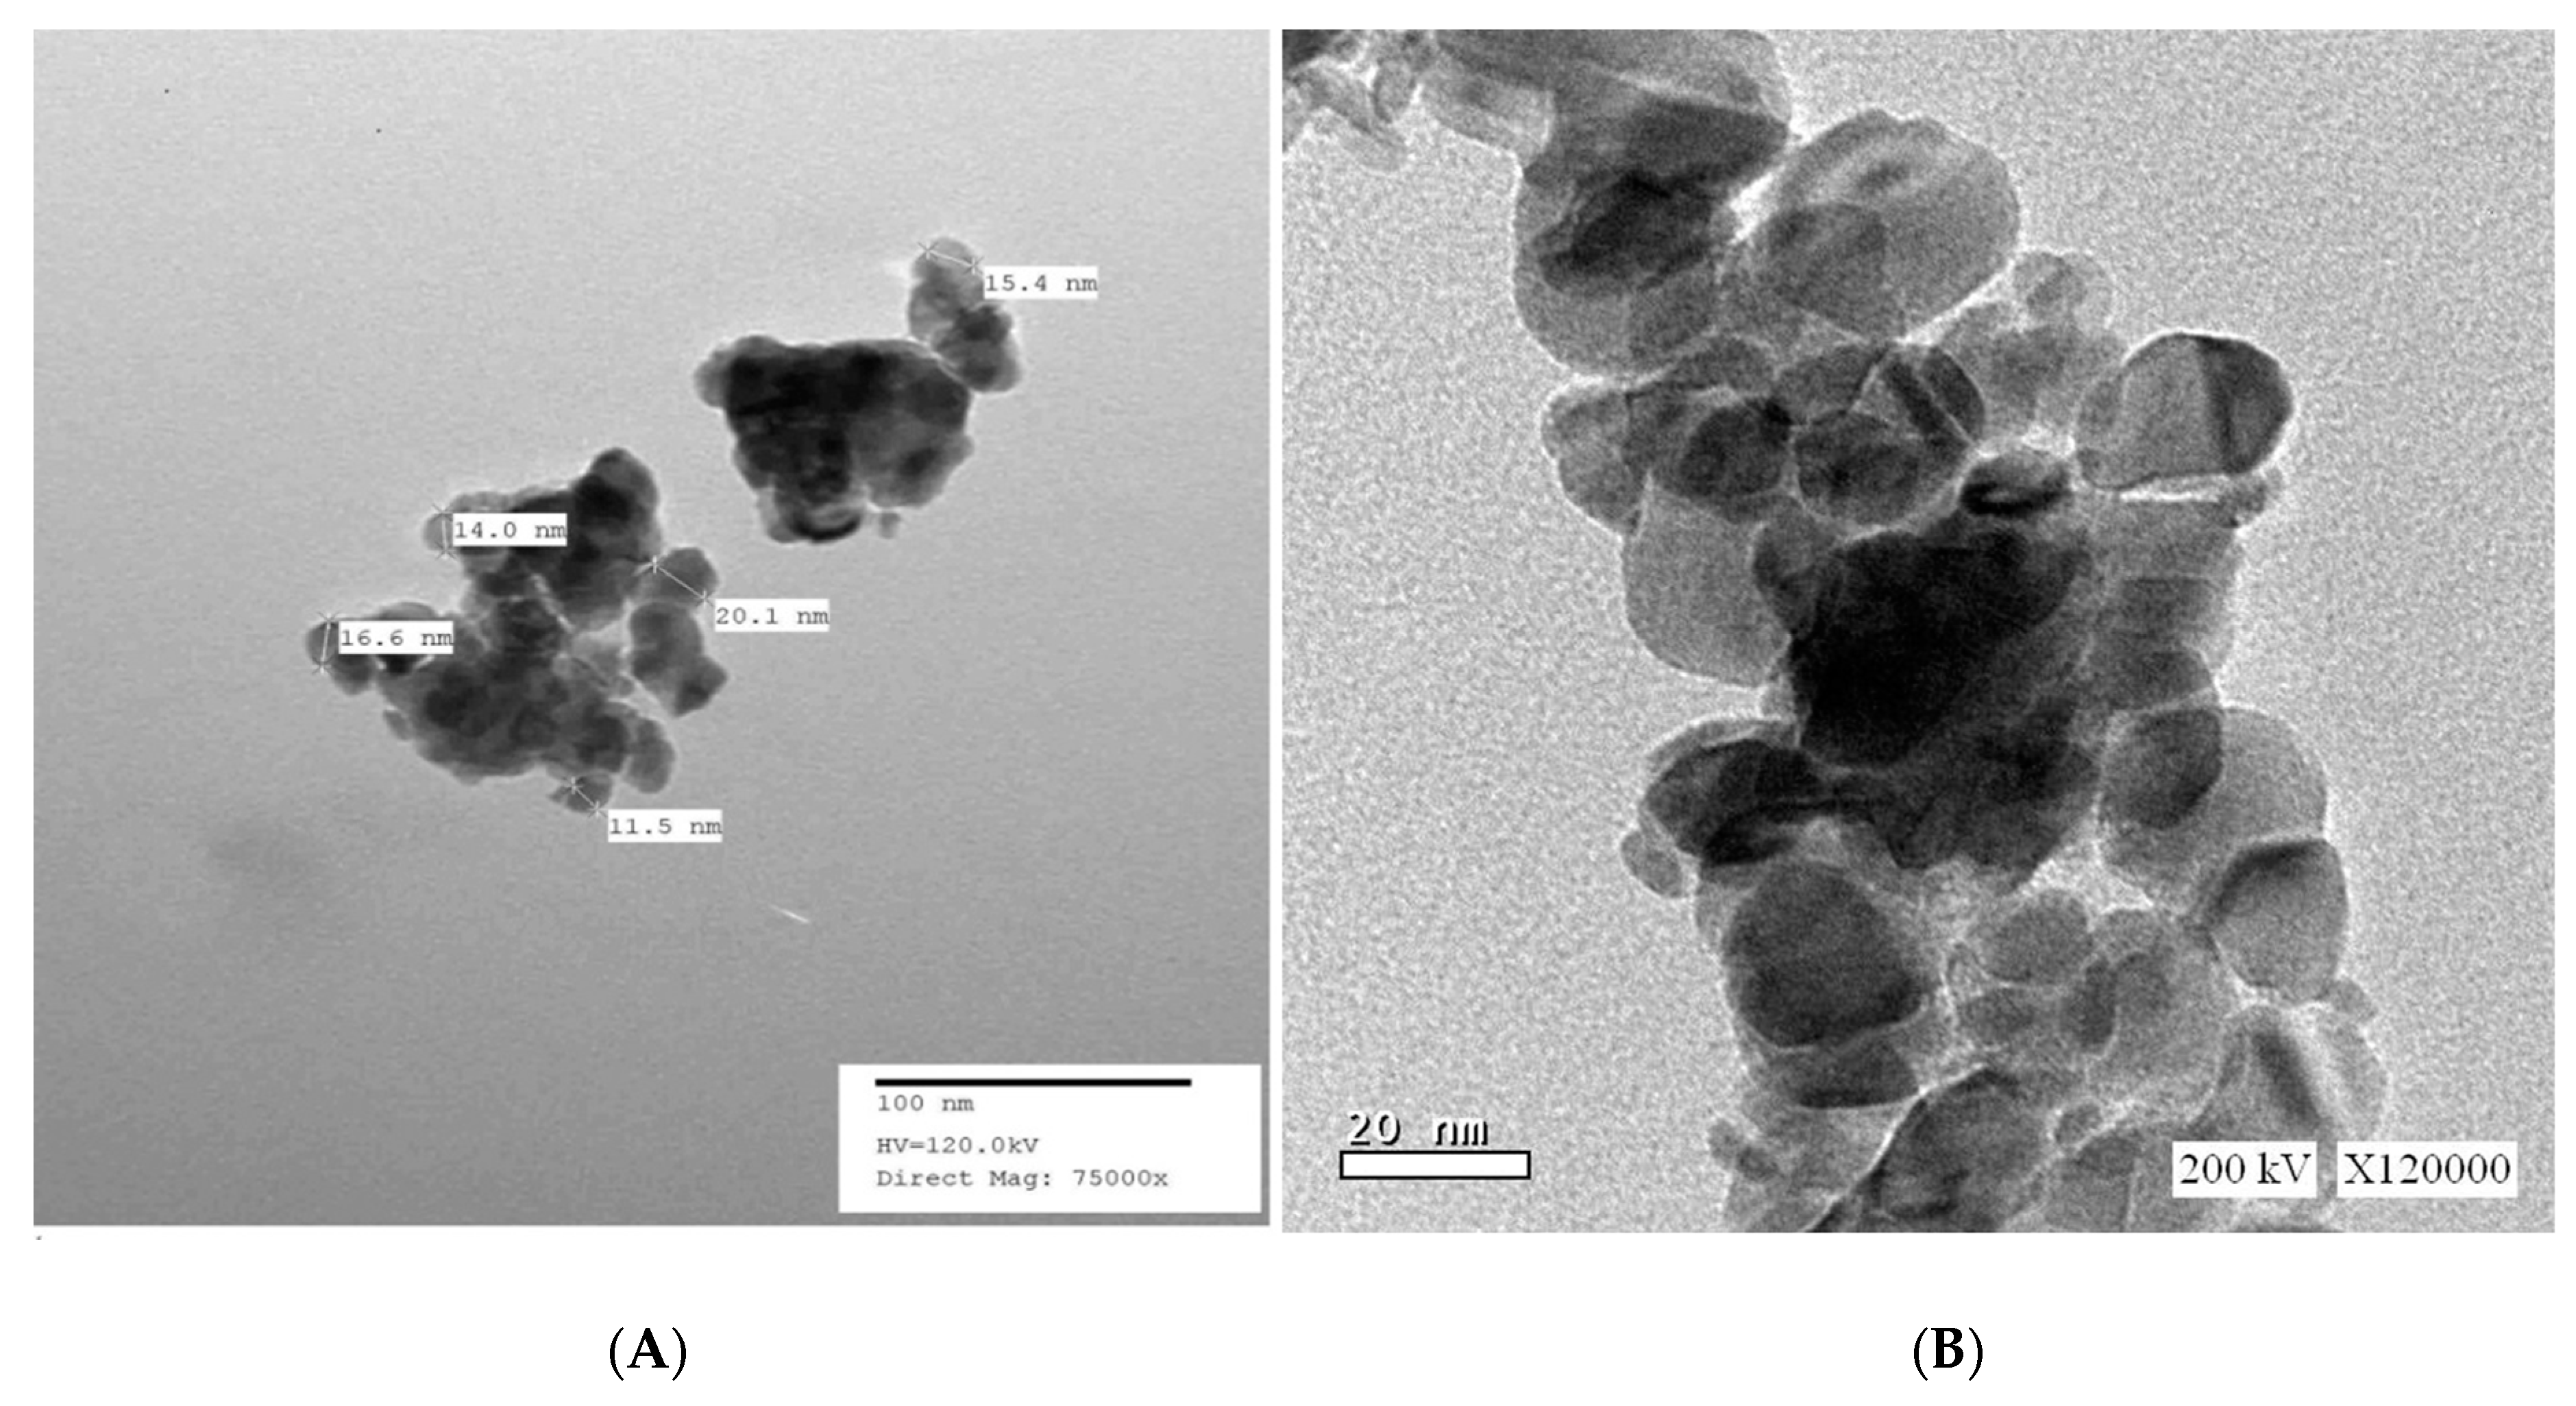
3.1.2. High-Resolution Transmission Electron Microscopy (HR-TEM) of SnO2/CeO2 Nano-Composite

The morphology and average particle size of the prepared SnO2/CeO2 (95%:5%) nano-composites were examined by high-resolution transmission electron microscopy (HR-TEM). As shown in Figure 2, it indicates that SnO2/CeO2 NPs have spherical morphologies with particle sizes varying from 11.5 to 30 nm, which is in agreement with the crystallite size obtained from XRD data.

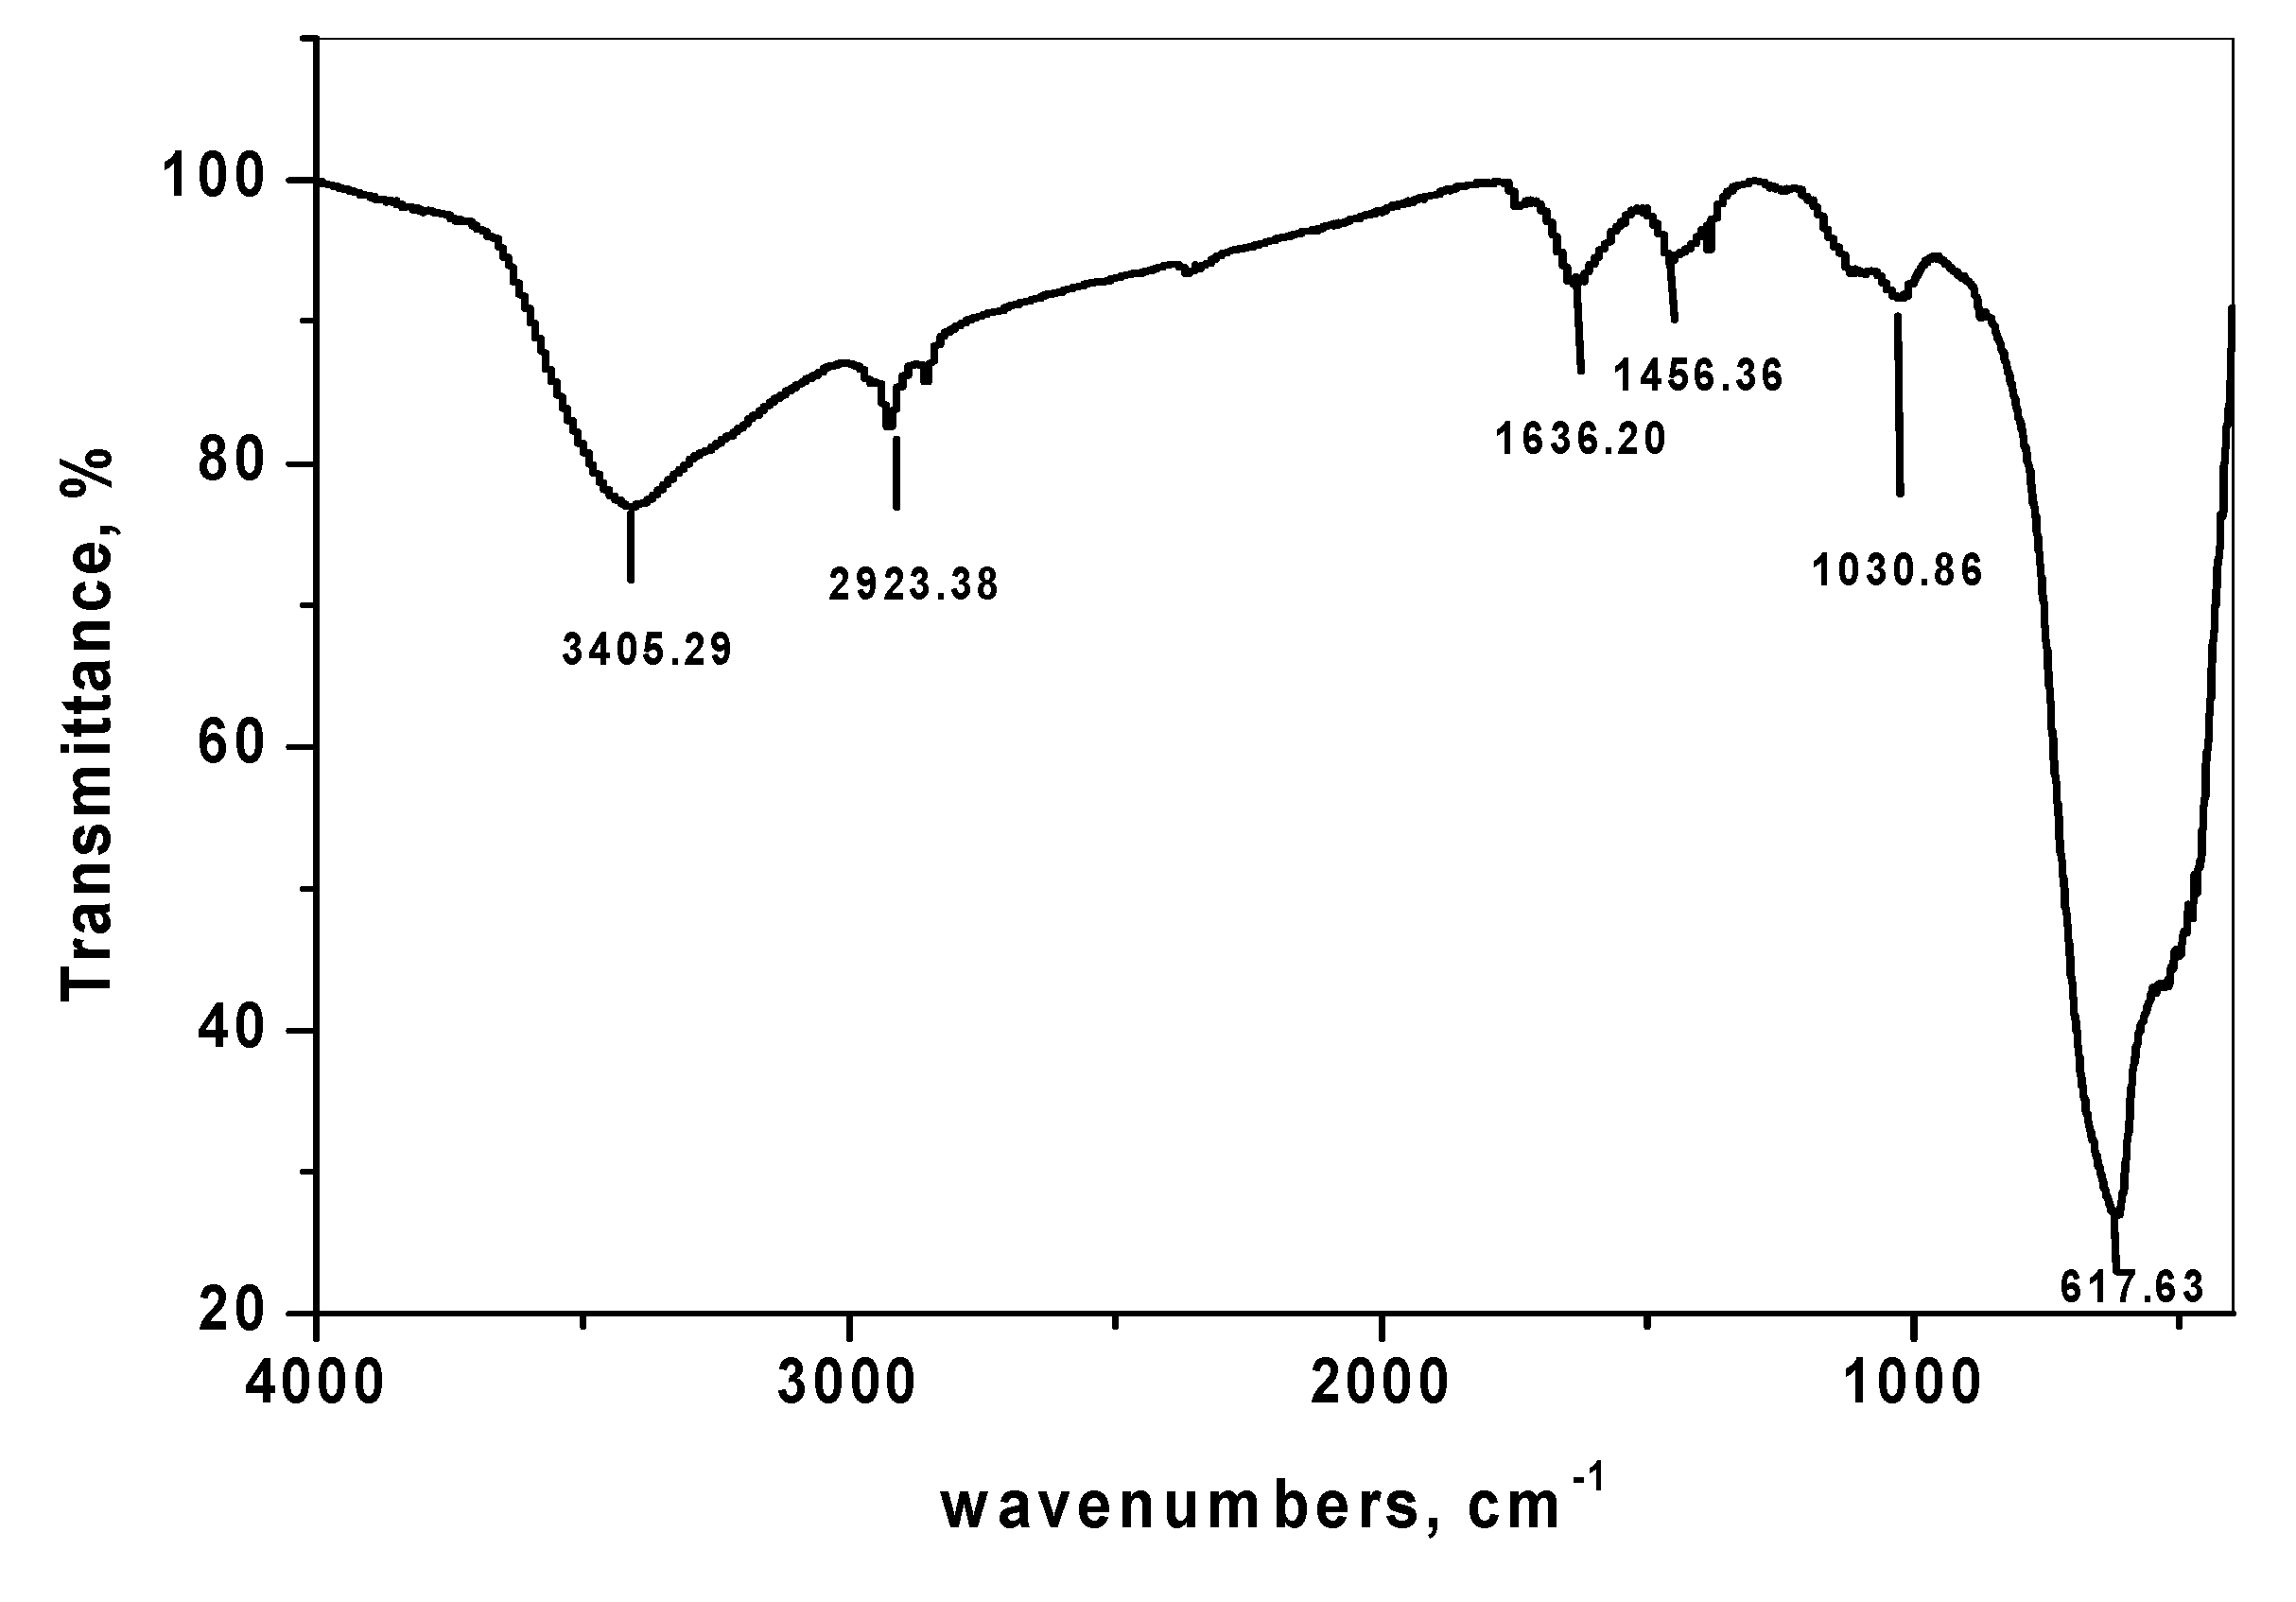
3.1.3. Fourier Transform Infrared Spectroscopy of SnO2/CeO2 Nano-Composite

The FTIR spectrum of SnO2/CeO2 nano-particles is shown in Figure 3. The characteristic peak at 3405.29 cm−1 was due to the stretching vibration of the O–H bond of the physically adsorbed water molecule on the SnO2/CeO2 surface [24]. The peak appearing presented at 1636.20 cm−1 was due to the bending vibration of the adsorbed water molecule, and the displayed peak at 617.63 cm−1 was due to the stretching modes of the M–O bond.

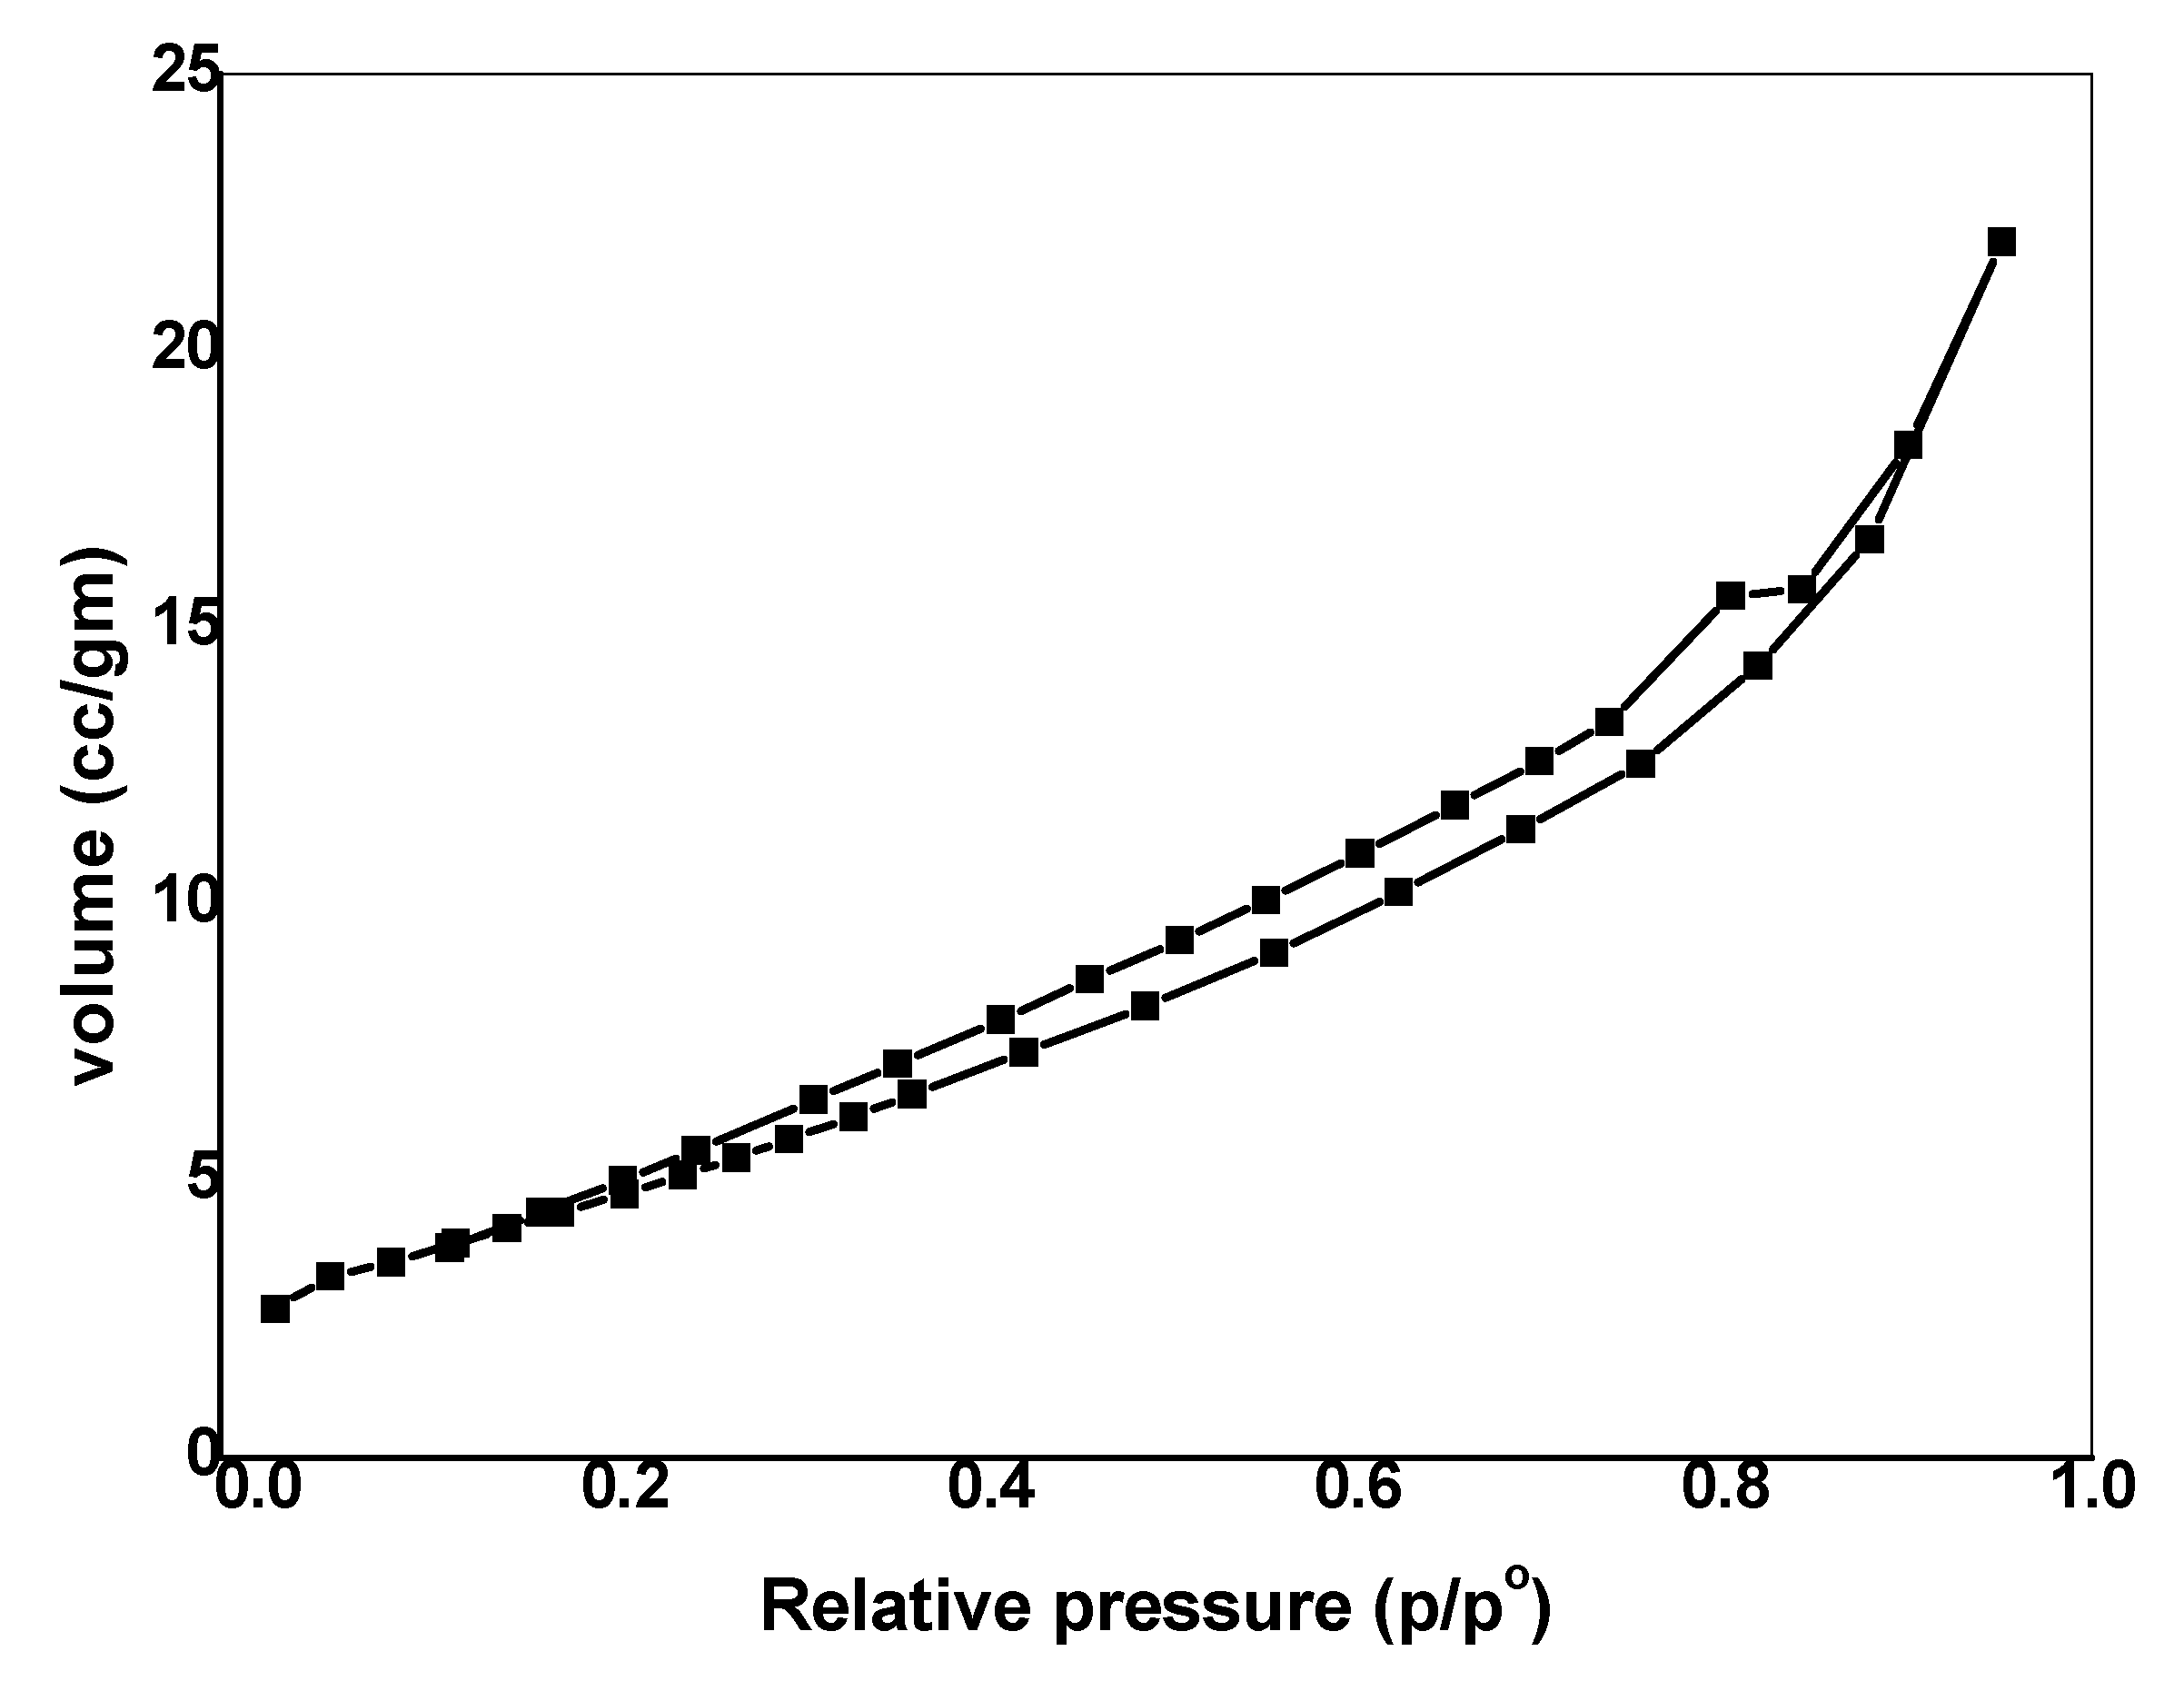
3.1.4. Porous Structure

The Brunauer–Emmett–Teller (BET) method was used for investigating the pore structure of the prepared nano-composite material. The nitrogen adsorption–desorption experiment of SnO2/CeO2 nano-composite gives the isotherms depicted in Figure 4, which is of the type IV [30] with mesoporous structure. The BET surface area and pore volume of the nano-composite are shown in Table 1.

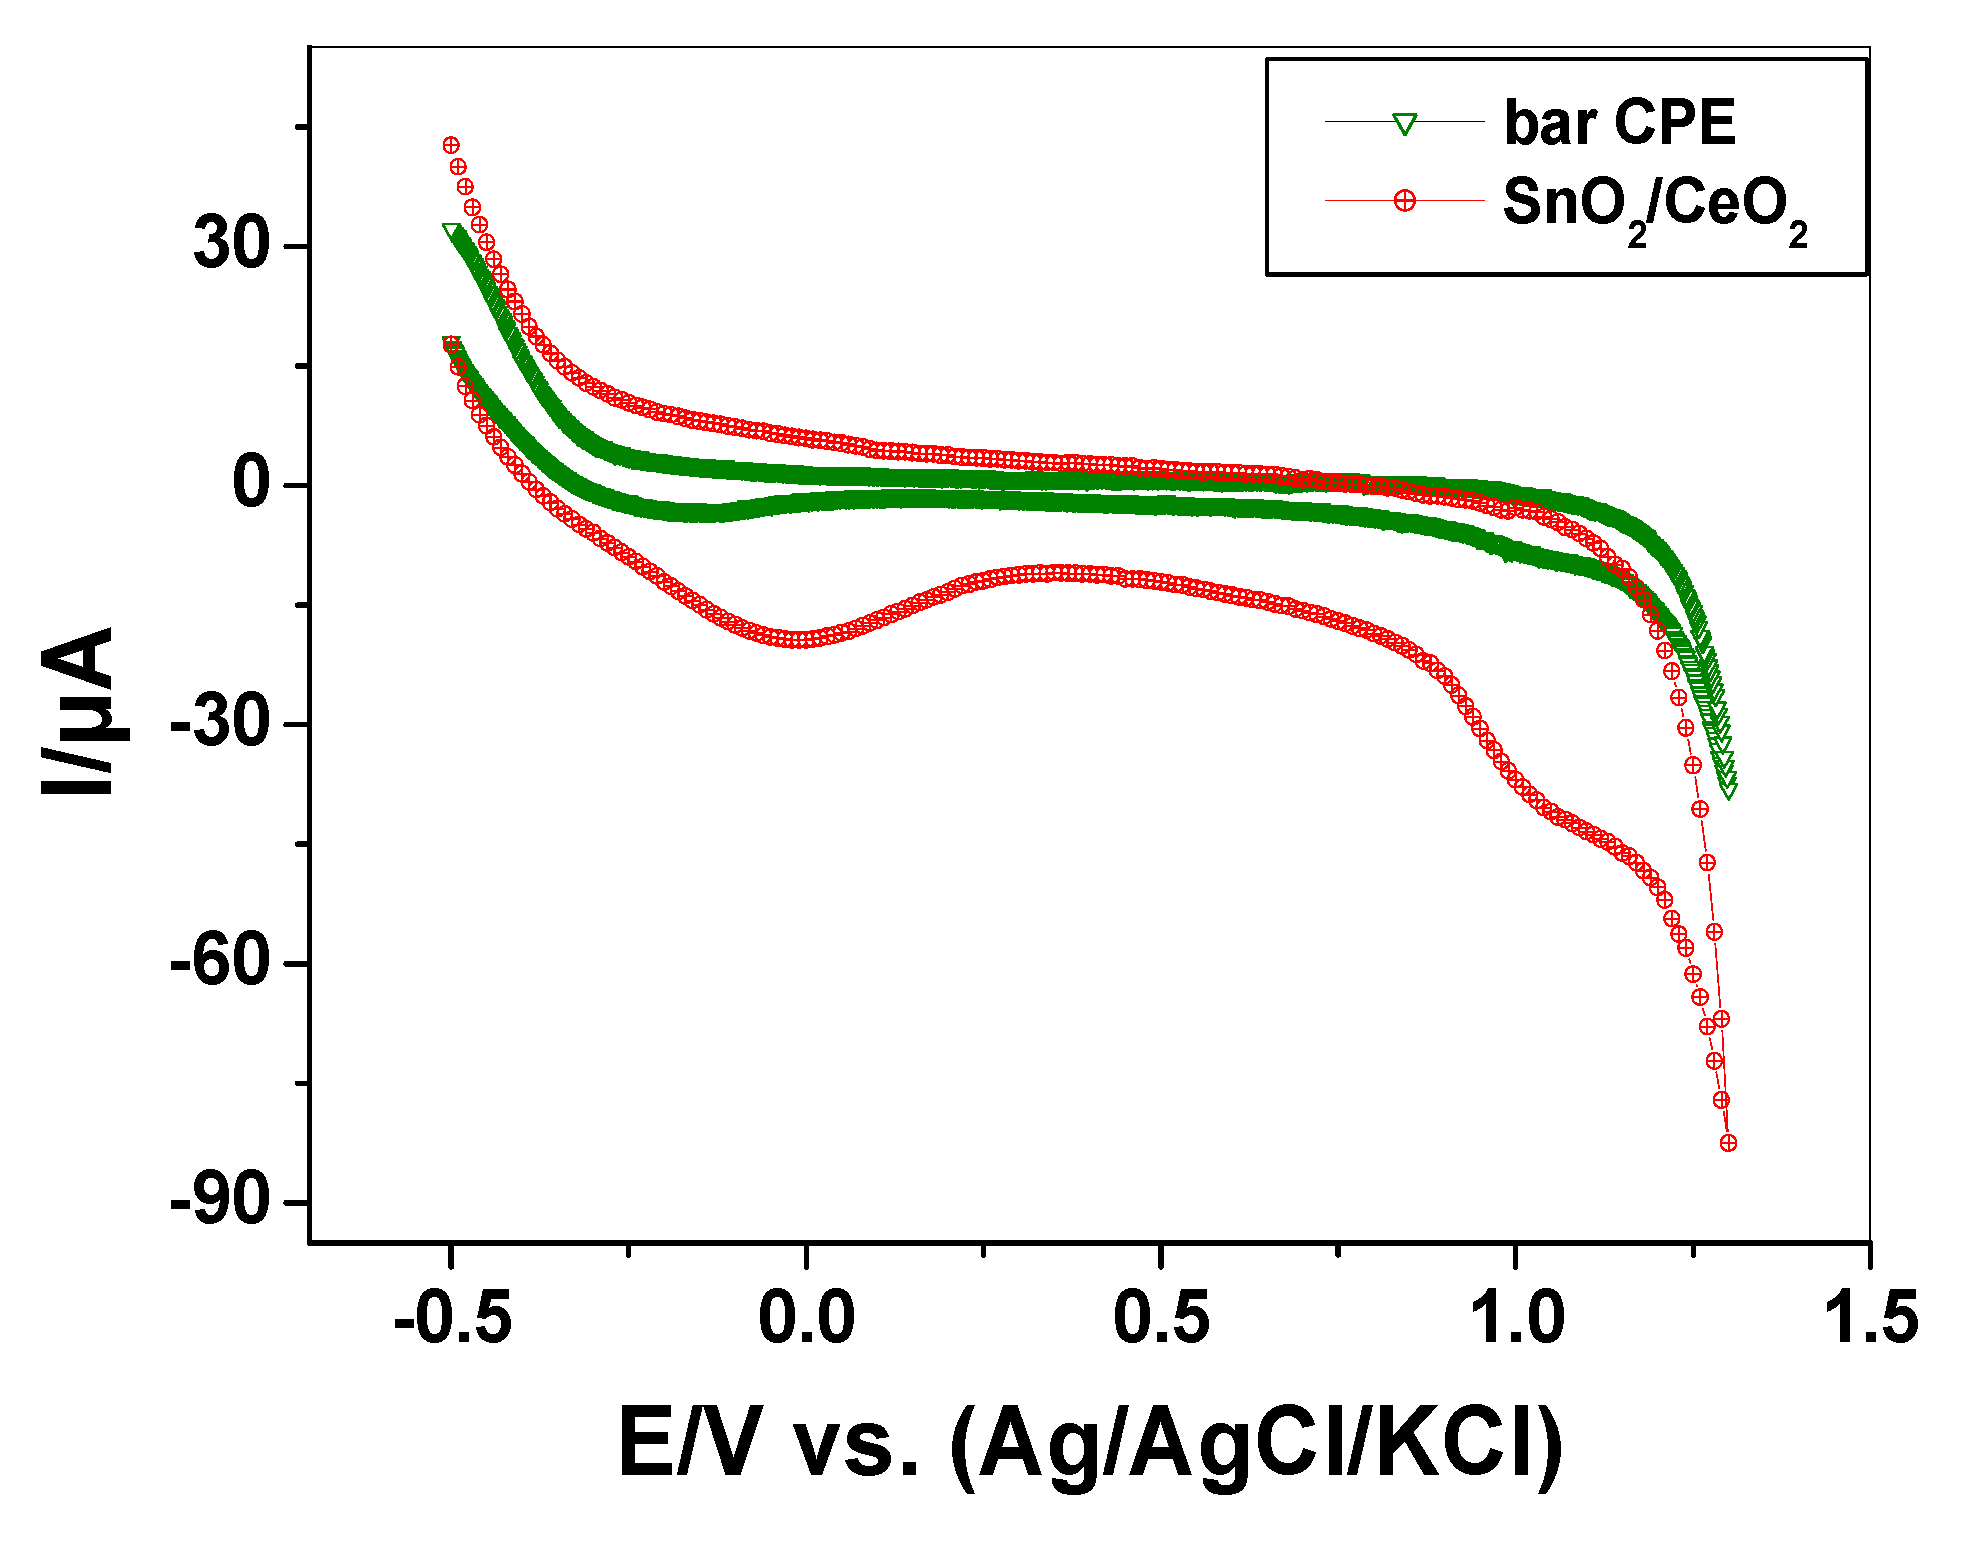
3.1.5. Electrocatalytic Behavior of SnO2/CeO2 Nano-Composite

Voltammetric measurements were performed to prove the electrocatalytic effect of the nano-composite SnO2/CeO2 using a potentiostat (Model 273A Princeton Applied Research (PAR), Princeton, Oak Ridge, TN, USA). Three electrode cell was used for voltammetric measurements containing an Ag/AgCl/KCl(s) reference electrode (BAS Model MF-2063, BASi, West Lafayette, OH, USA), and a platinum wire (BAS Model MW-1032) was used as a counter electrode. The working electrode was a Teflon rod with an end cavity (3 mm diameter and 5 mm deep) bored at one end for paste filling (BASi-MF-2010, West Lafayette, OH, USA) and connected with a copper wire through the center of the rod [31]. The carbon paste (CP) was prepared by thoroughly hand mixing 0.05 g SnO2/CeO2 nano-composite and 0.95 g of graphite powder with 360 µL of nujol oil in an agate mortar with pestle to give a homogenous 5% (w/w) SnO2/CeO2/CP. The cyclic voltammograms of SnO2/CeO2/CP electrode is shown in Figure 5 in a scan range of −0.5 to 1.5 V at a scanning rate of 300 mV/s. The peaks obtained correspond to the surface reactions, where Sn4+ and Ce4+ were reduced to Sn2+ and Ce3+, respectively. Table 2 shows the redox potentials (E) of cerium, tin and alizarin. As shown in Figure 5, the reduction peaks that appeared at Esn = −0.03 V and Ece = 1.0 V reflect the electrocatalytic effect of the catalyst and its capability to oxidize alizarin dye in aqueous solutions (EALZ = −0.59).

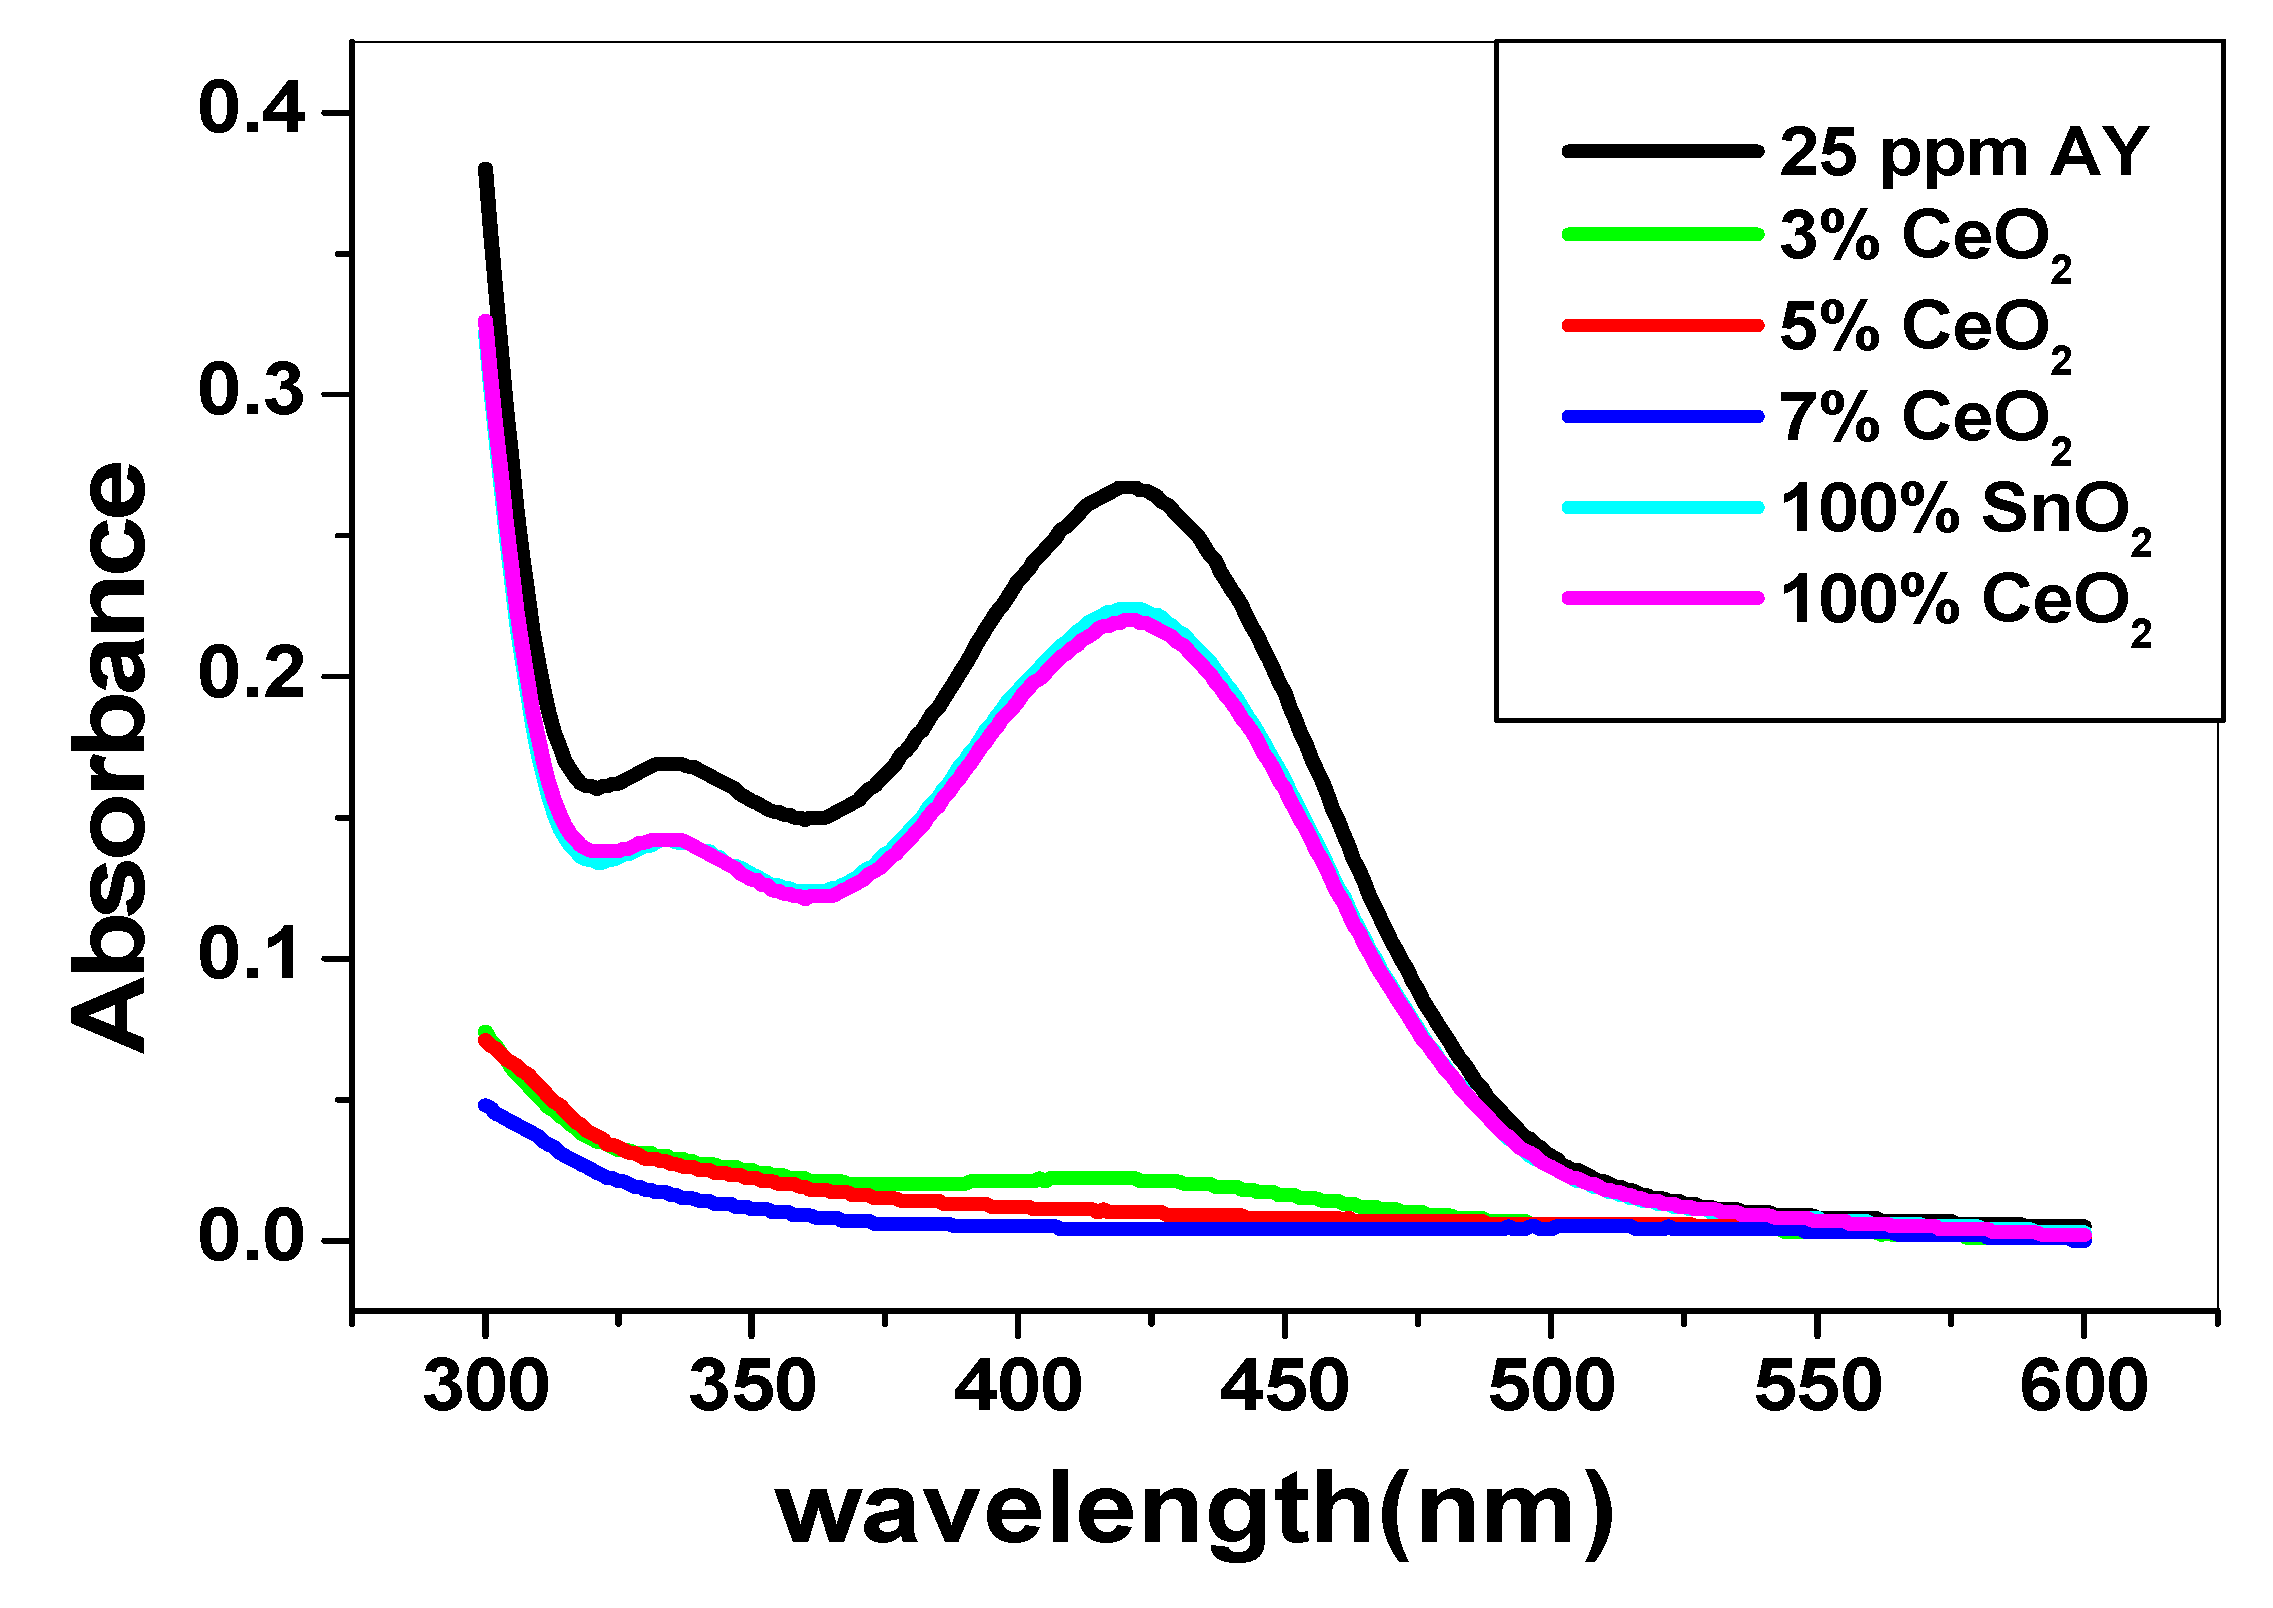
3.2. Use of SnO2/CeO2 Nano-Composite for Alizarin Dye Removal

The effect of CeO2 amount doped with SnO2 on the removal efficiency was tested. Three different nano-composites with a percentage amount of CeO2of 3%, 5% and 7% (w/w) were chosen for alizarin removal. It was found that as the amount of CeO2 doped increased in the composite, the removal percentage increased to be 91.3%, 96.4% and 98.3% for 3%, 5% and 7% CeO2, doped with SnO2, respectively. This implies that CeO2 enhanced the adsorption and electrocatalytic powers of the synthesized nano-composite. As seen in Figure 6, pure SnO2 and CeO2 had no catalytic degradation on alizarin dyes. This reflects the enhanced catalytic power of the synthesized nano-composites.

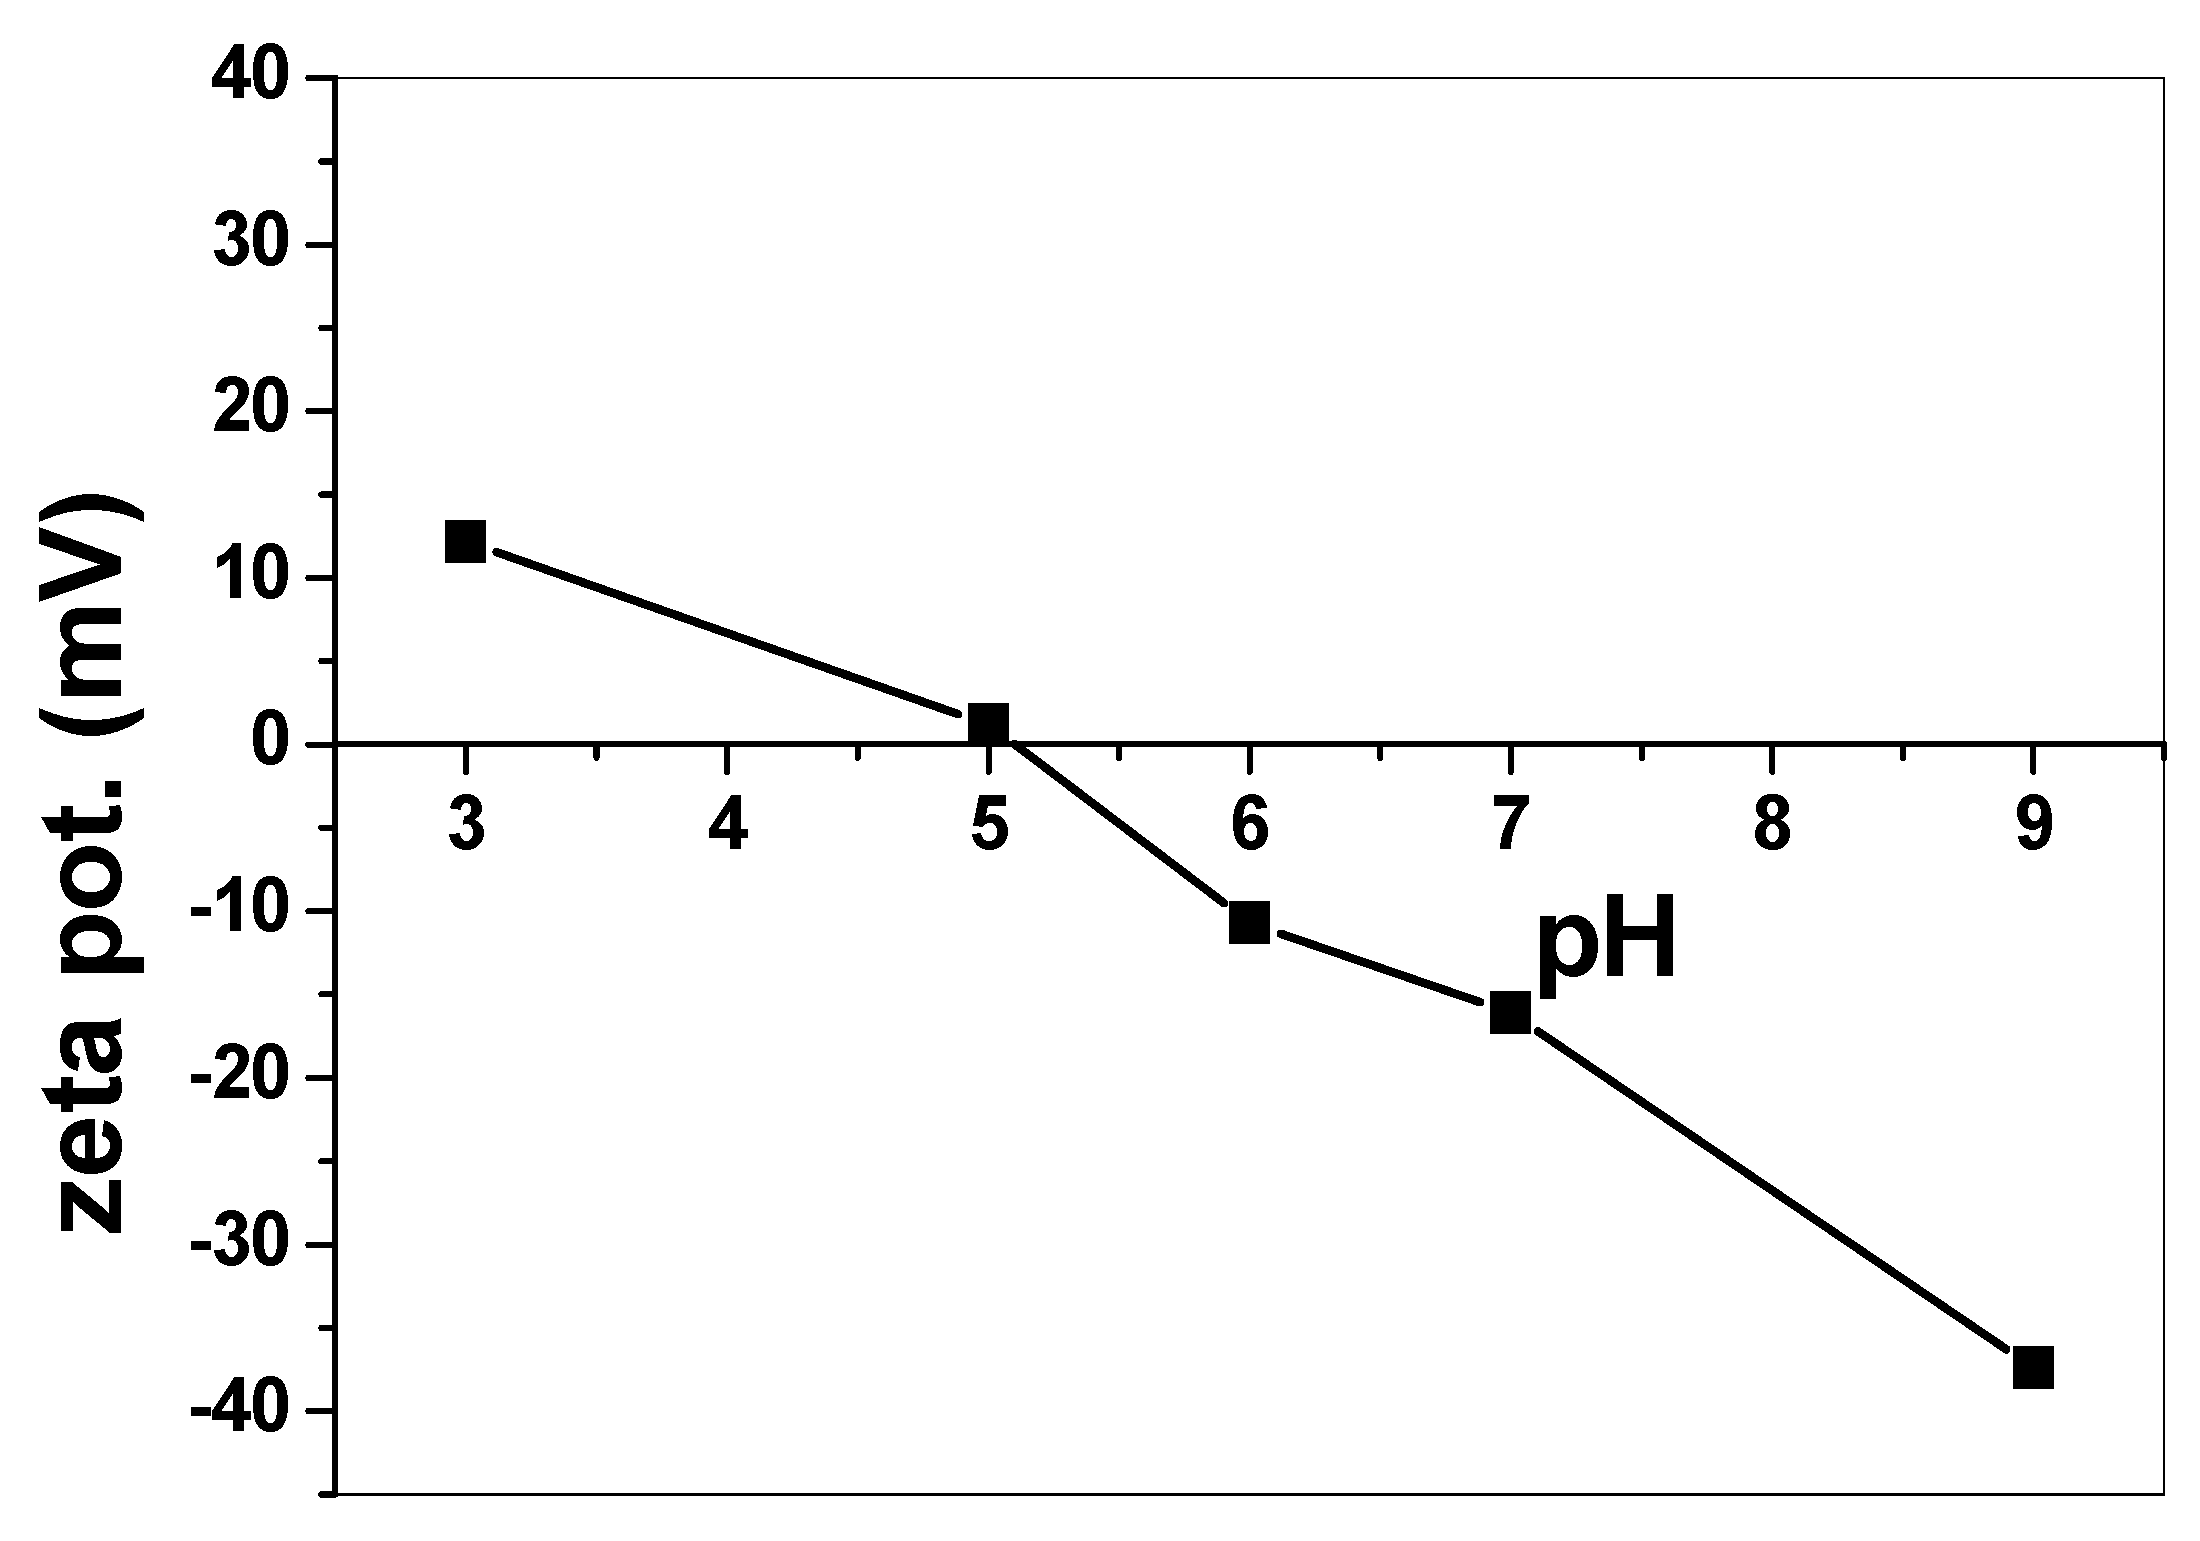
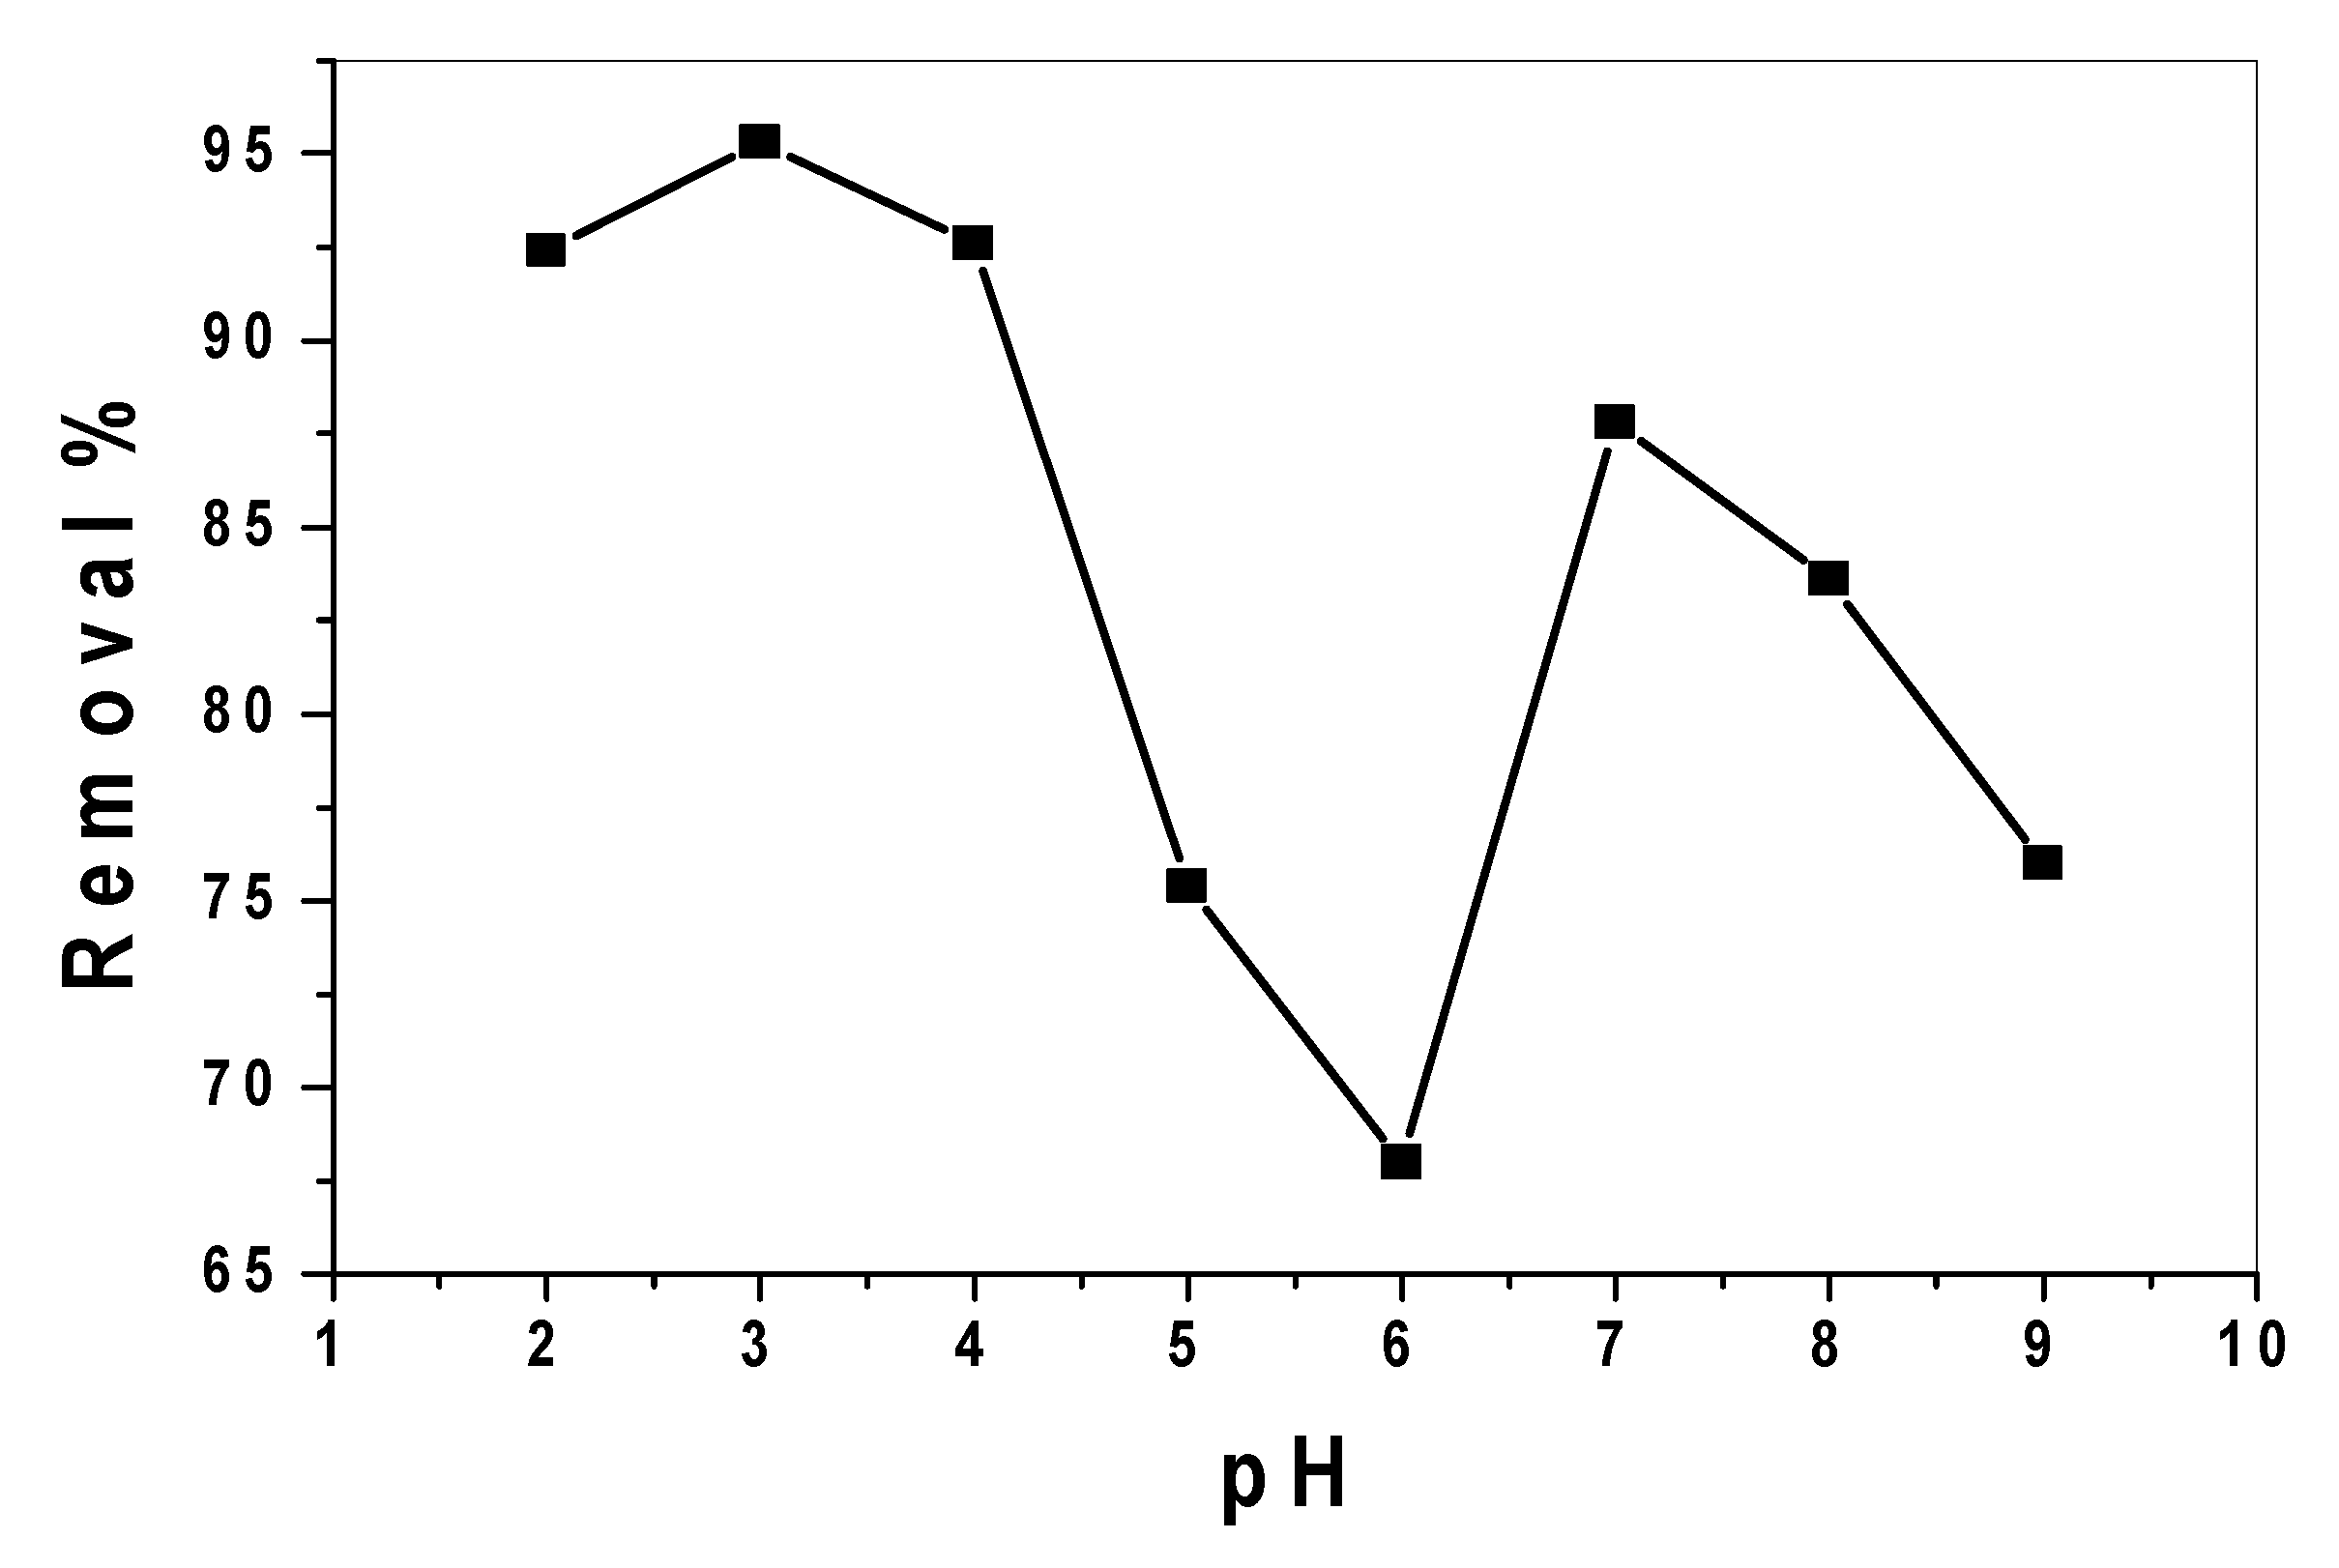
3.2.1. Effect of pH and Catalytic Activity of SnO2/CeO2 Nano-Composite

Zeta potential was measured to interpret the behavior of SnO2/CeO2 nano-composite at different pH values. Figure 7 shows that in an acidic medium (below pH 5), the catalyst surface became positively charged. This could enhance the adsorption via electrostatic attraction between alizarin dye and the catalyst. The zero point charge of the catalyst at pH 5–6 led to no or very slight alizarin removal. In alkaline media, the catalyst surface became negatively charged, and a gradual decrease in alizarin removal was noticed.
To optimize the pH under which maximum removal of alizarin took place, a 30 mL aliquot of alizarin dye solution containing 25mg L−1 was treated with 0.15 g of the adsorbent at pH values ranging from 2 to 9 and was stirred for 30 min. A maximum removal of alizarin with the value 95.3% was detected at pH 3.0 and then decreased to 68.0% at pH 6.0. A further increase in the removal efficiency 87.8% was detected at pH 6.5–7.5, and then it began to decline after further increase in the pH values (Figure 8). It has been reported that tin (IV) oxide is predominately a Lewis acid, with weak Bronsted acidity evolving in the presence of water vapor. Strong Bronsted-acid sites can be produced by protonation in acidic media. Additionally, more adsorption at acidic pH indicates that the lower pH results in an increase in H+ ions on the adsorbent surface that result in significantly strong electrostatic attraction between alizarin molecules and the adsorbent surface.
In addition, when the catalyst was irradiated by the solar light, electrons from the conduction band and holes from the valance band were formed [25], generating the primary oxidant, hydroxyl radicals (OH), due to the reaction between hydroxide ions and positive holes. The hydroxyl radicals are considered the major oxidation species in an alkaline pH medium. At pH levels greater than 7.0, there was a decrease in alizarin removal due to the electrostatic repulsion of the negatively charged surface of the nano-composite and hydroxide ions, which in turn prevented the formation of OH radicals (primary oxidant). So, it can be concluded that the high removal percentage implies the occurrence of physical and chemical adsorption in acidic solutions and chemical degradation in alkaline solutions.

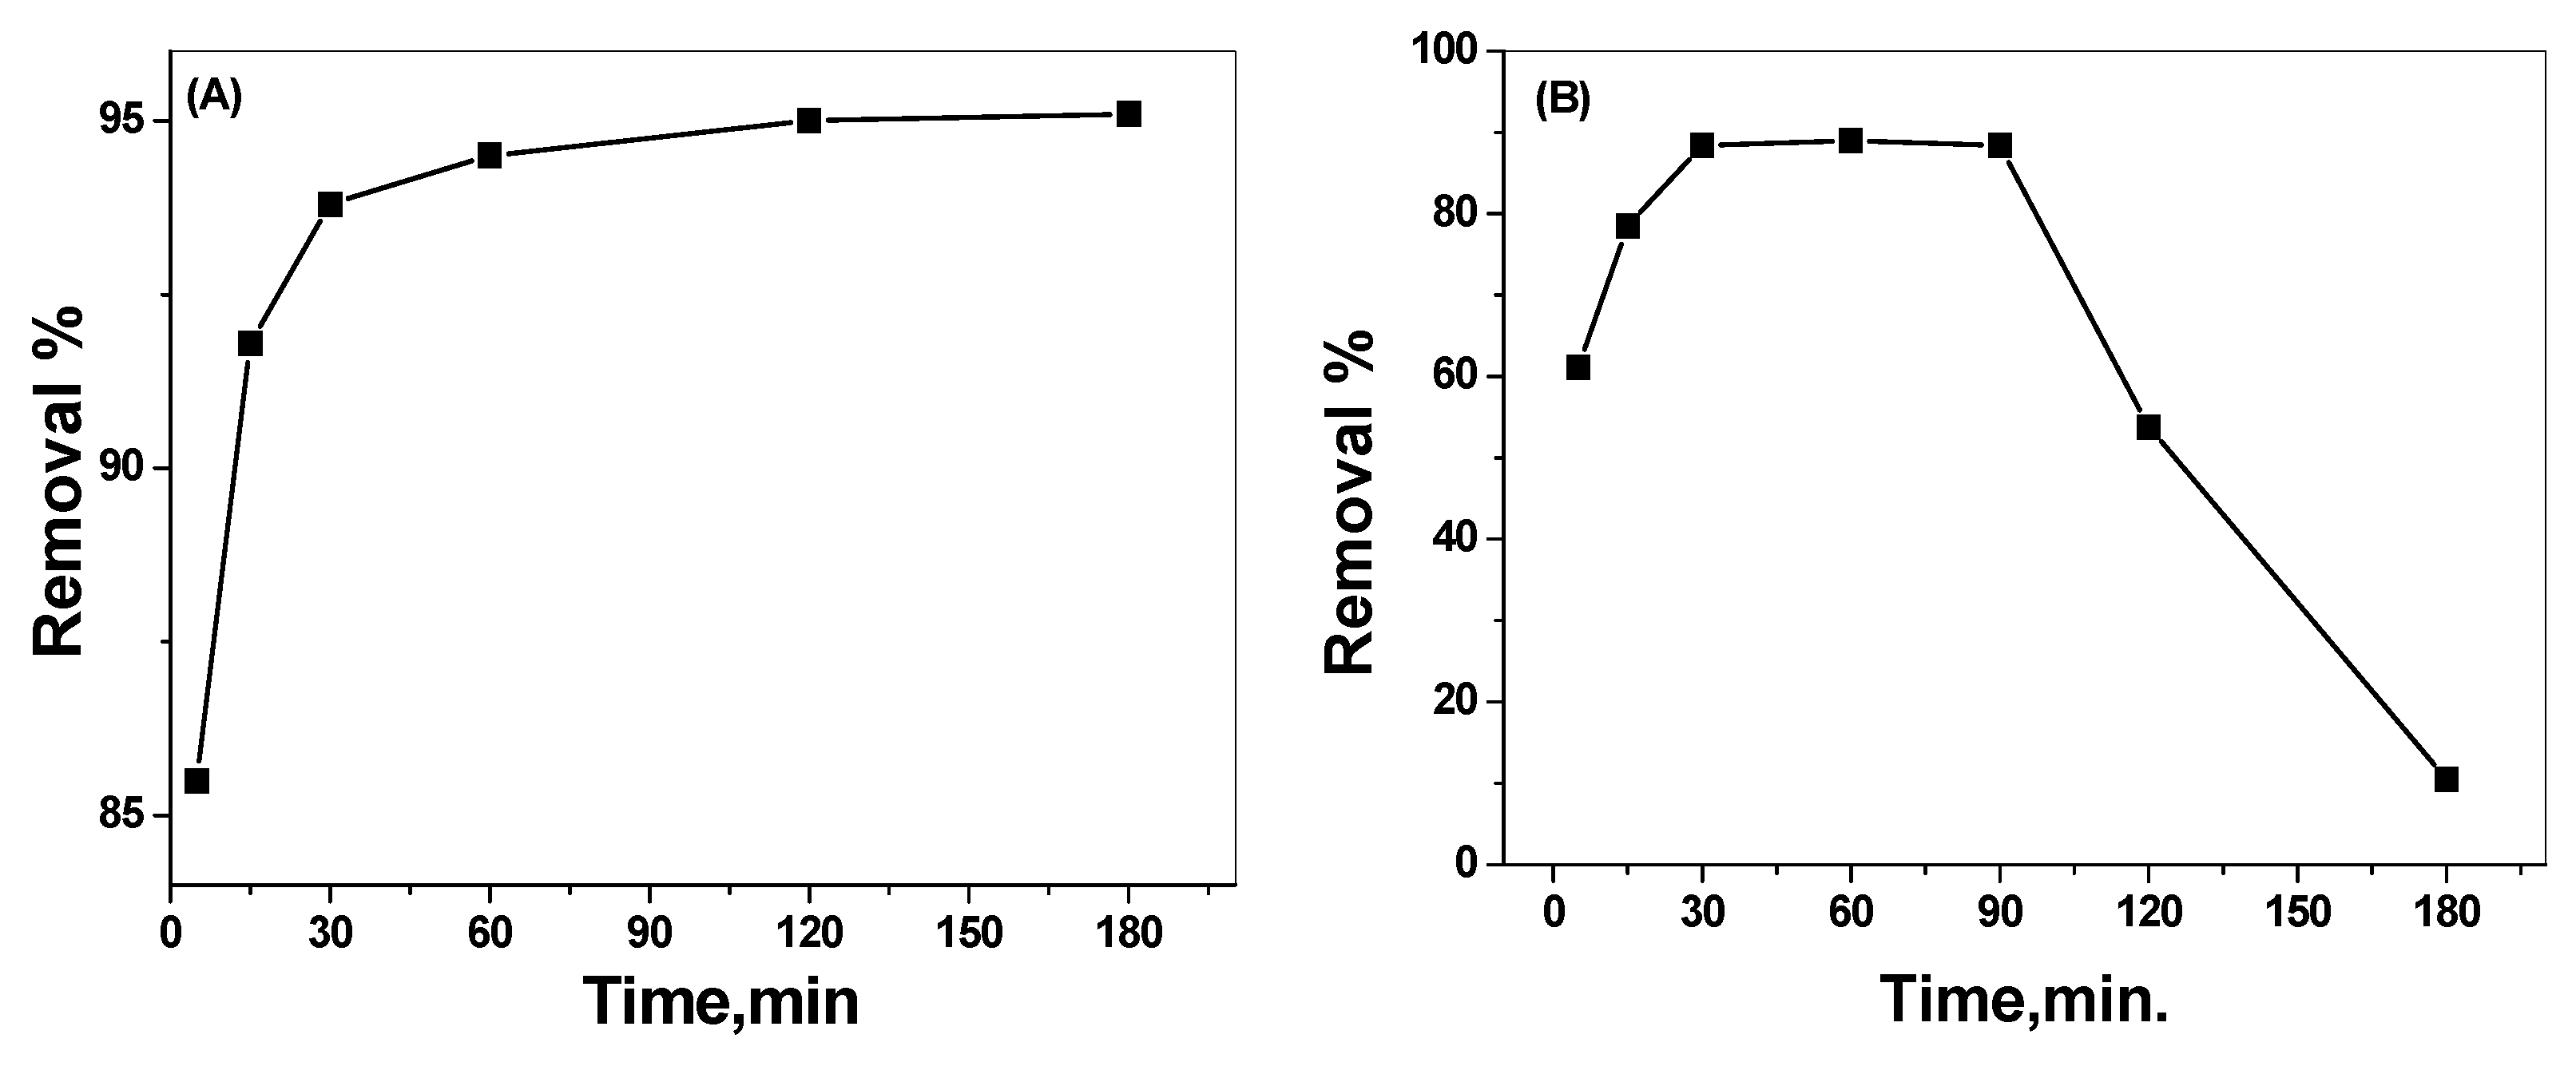
3.2.2. Effect of Contact Time

The optimal time required for maximum dye removal was tested by fixing all other parameters (30 mL of 25 mg/L alizarin dye (AY), pH 3, 7 and 0.15 g of the nano-composite) and varying the contact time from 5 to 180 min. At pH 3, the dye removal increased from 85.5% after a 5 min contact time to 94% after 30 min (Figure 9A). Further increase of the contact time over 30 min had no noticeable effect for the removal of more dye concentration. At pH 7, the removal of the dye increased from 60% to 91.1% for the above mentioned contact time (Figure 9B). Further increase of the contact time over 30 min led to a rapid decrease in the removal efficiency. This can be attributed to the electrostatic repulsion between the negatively charged surface present on the adsorpant at this pH and alizarin molecules. A contact time of 30 min was chosen for all subsequent measurements.

3.2.3. Effect of the Catalyst Dose

Different quantities of NP material (0.01 to 0.2 g) were mixed with 30 mL (25 mg/L) alizarin dye solution at pH 3.0 and stirred for 30 min. Figure 10A shows that the removal of the dye increased from 28% with 0.01 g adsorbent to 94.8% for 0.15 g of adsorbent. Under similar conditions, but at pH 7, 46.2% and 88.8% removal efficiency were obtained (Figure 10B). An adsorbent quantity of 0.15 g was used for further study.

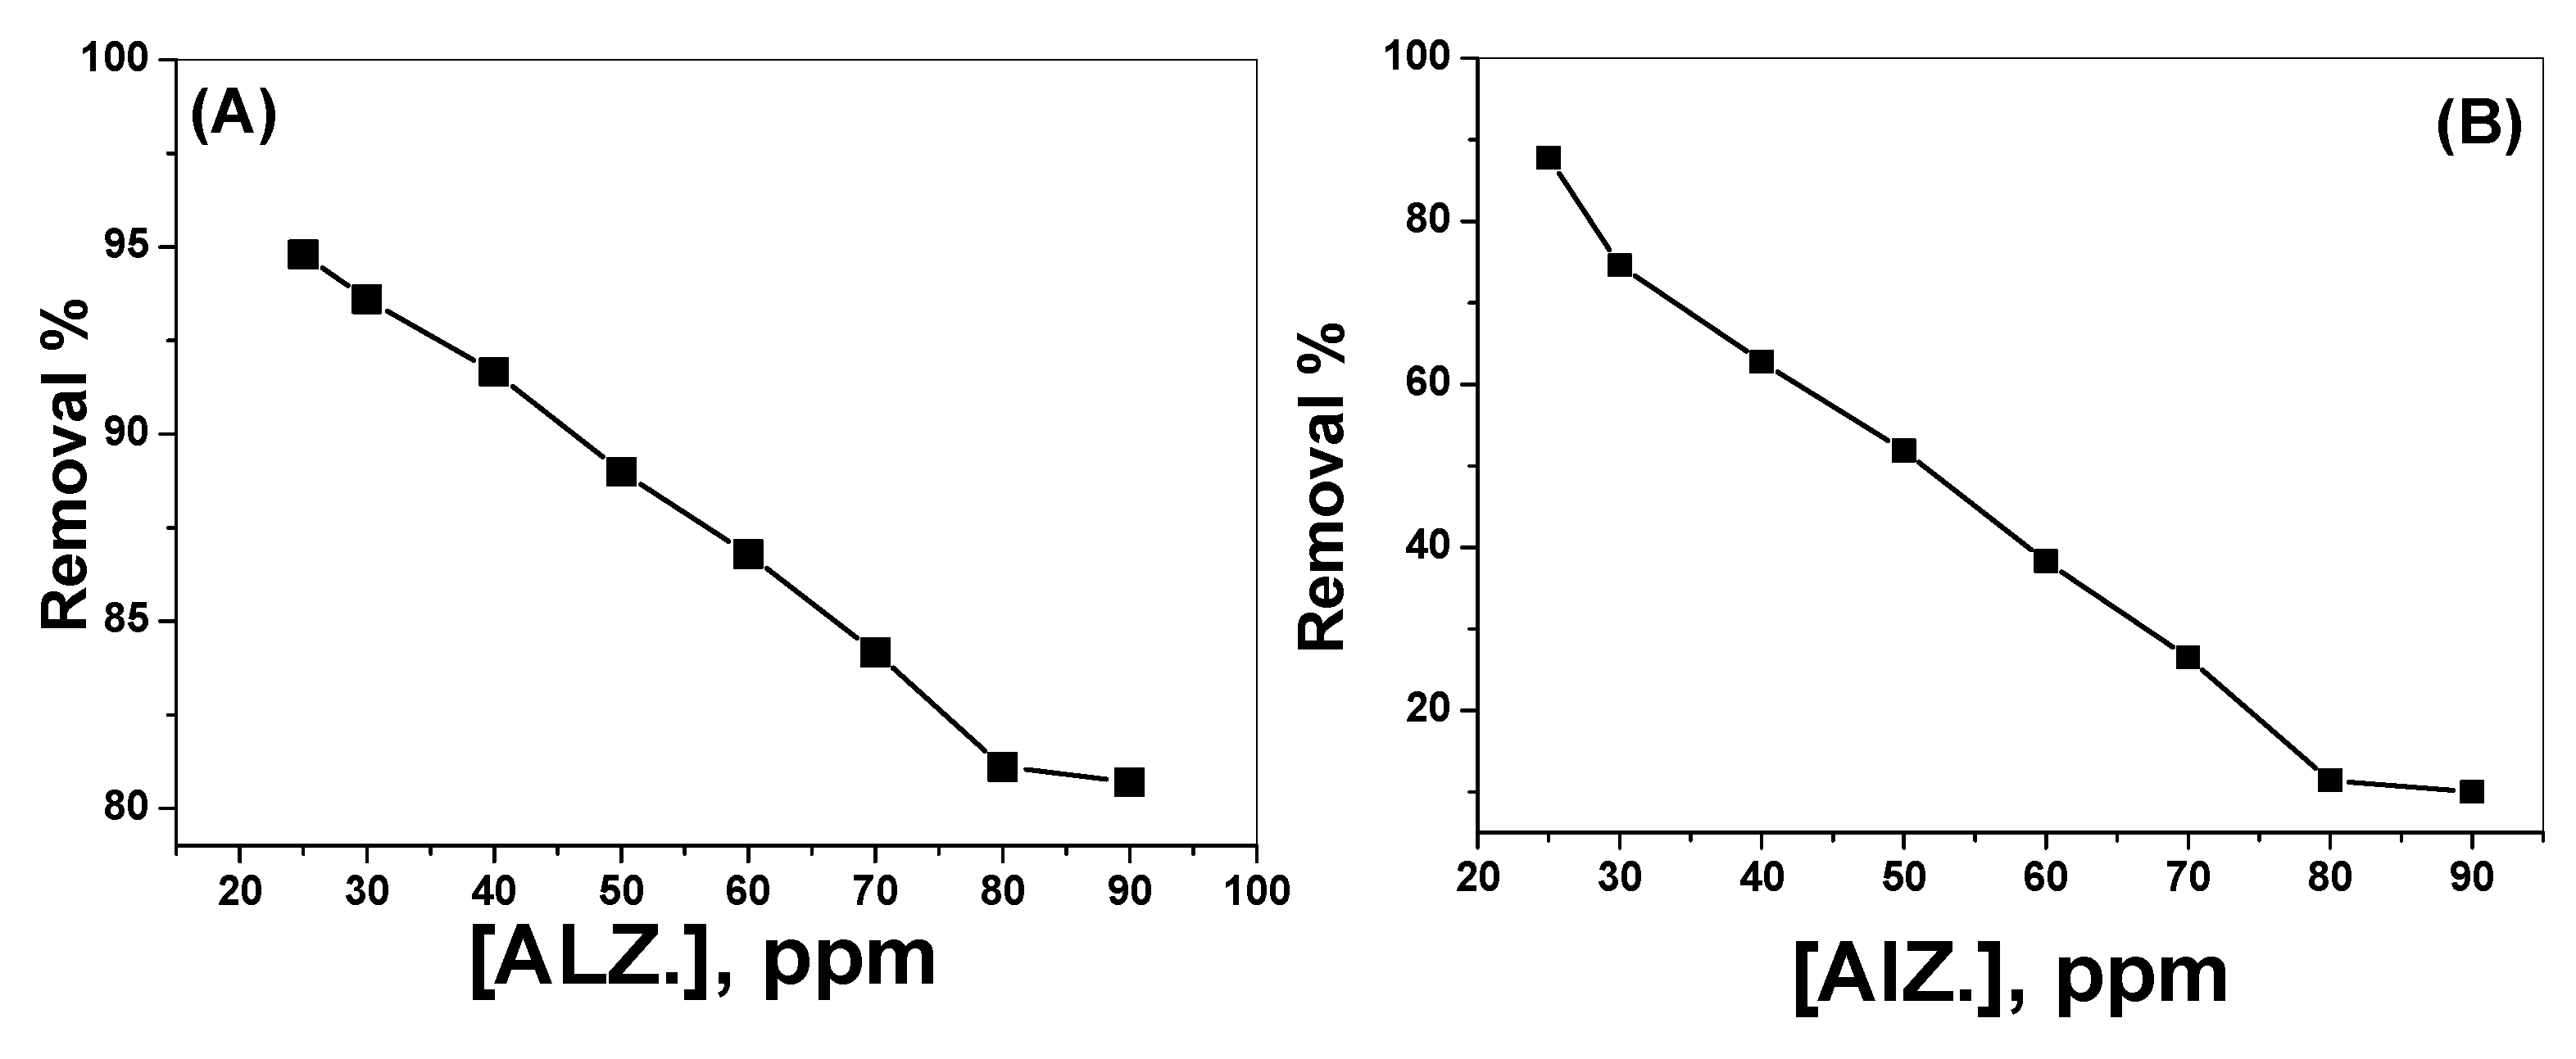
3.2.4. Effect of Alizarin Dye Concentration

The effect of dye concentration in the range from 25 to 90 mg/L at pH 3 and 7 was investigated under the optimized experimental parameters. Thirty milliliter aliquots of alizarin yellow dye solution at both pH 3.0 and 7.0 were allowed to interact with 0.15 gm SnO2/CeO2 nano-composite for 30 min. It was noticed that the removal percentage decreased as the concentration of the dye increased from 25 to 90 mg/L. At pH 3, 94.8% and 81% alizarin removal was obtained with 25 mg/L and 80 mg/L alizarin concentration, respectively (Figure 11A). At pH 7, the removal efficiency decreased from 87.8% to 11.4% when the concentration of the dye increased from 25 mg/L to 80 mg/L, respectively (Figure 11B).

3.3. Removal of Alizarin-3-Methylimino-Diacetic Acid (AMA)

Under the previously optimal experimental conditions, 95.0% of alizarin-3-methylimino-diacetic acid dye was removed, confirming the efficiency of SnO2/CeO2 nano-composite for the removal of different alizarin group dyes.

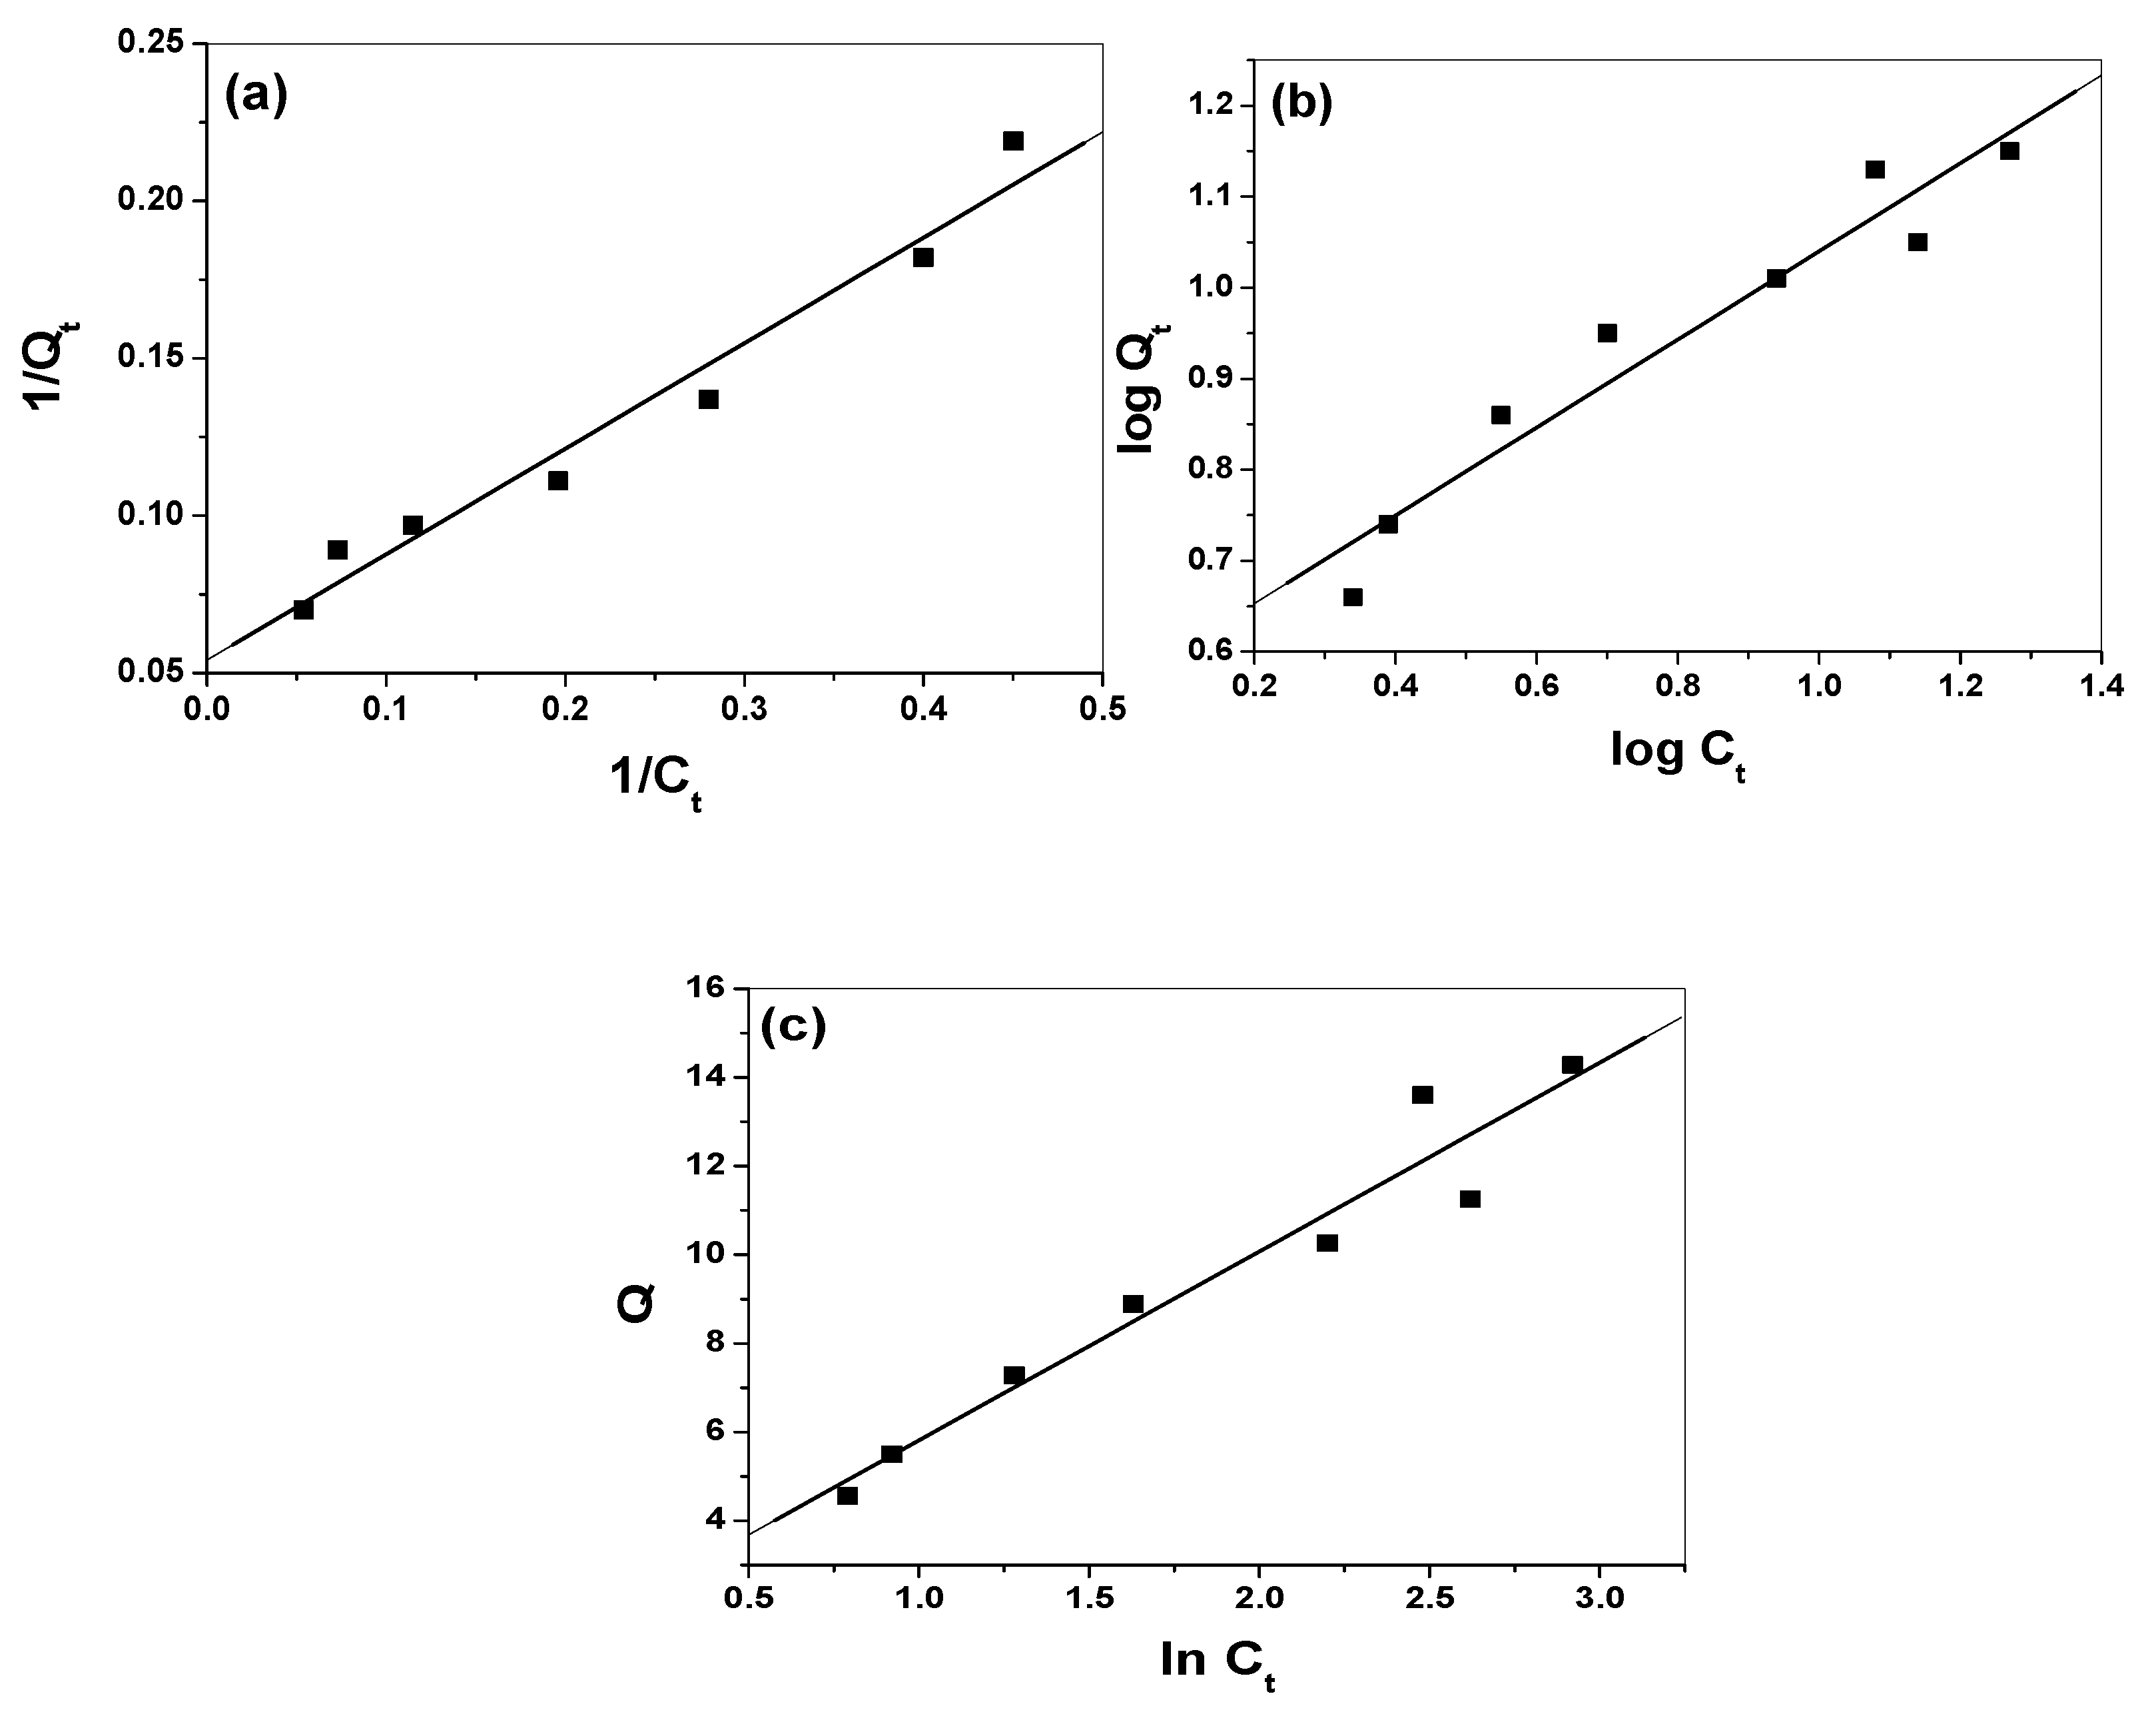
3.4. Modeling of Adsorption

Langmuir (Equation (3)), Freundlich (Equation (4)) and Temkin (Equation (5)) models were applied to calculate the sorption of alizarin dye.
1/Qt = 1/XmbCt + 1/Xm
LogQt = (1/n) log Ct + log kF
Qt = (RT/BT) ln Ct + (RT/BT) lnKT
where Qt is the adsorption capacity at equilibrium (mg/g); Ct is the equilibrium concentration of the AY solution (mg/L); t (min) is the contact time; Xm (mg/g) is the maximum monolayer adsorption capacity and b (L/mg) is the adsorption equilibrium constant. A linear relationship was obtained by plotting 1/Qtversus1/Ct (Figure 12a). The slope (Xm) and the intercept (b) values were 18.52 and 0.16, respectively, suggesting monolayer adsorption with correlation coefficient (R2 = 0.983).
From the Freundlich model, the relative adsorption capacities (n) and sorption intensities (Kf) (mg/gm) were calculated from the slope and intercept of plotting logQt vs. log Ct (Figure 12b). The values were n = 2.08, indicating a favorable sorption process as n > 1 [34], and Kf = 3.55 mg/g with a correlation coefficient (R2 = 0.966). Temkin constants, BT (k J/mol) and KT (L/mg), which are constants of heat of sorption and the equilibrium binding constant corresponding to maximum binding energy, were estimated from the slope and intercept of Qt vs. ln Ct (Figure 12c). Values of 0.533 and 1.44 were obtained, respectively. This refers to the heat of sorption and confirms the physical adsorption process with a correlation coefficient (R2 = 0.970). All of these values confirmed a reasonable adsorption capacity and suggested the occurrence of both physical (multilayer) and chemical (monolayer) adsorption [35] between the prepared nano-composite and alizarin dye that confirms the results obtained from the pH effect.

3.5. Regeneration of SnO2/CeO2 Nano-Composite

The adsorbent was regenerated after each adsorption cycle of alizarin by heating at 600 °C for 60 min. After five cycles of regeneration, the efficiency of the nano-composite for the removal of alizarin dye became 77.8%.

3.6. Comparison with Other Sorbents for Removal of Alizarin

Table 3 represents a comparison of the performance of the present suggested sorbent with some of those previously described nano-materials for the removal of alizarin veiled. It can be seen from Table 3 that high maximum adsorption capacity [7], reasonable contact time [7,13,14,18,19,36,37,38,39,40,41], high removal percentage [7,8,10,14,15,18,36,38,39,41] and low amount of adsorbent dosage [7,8,10,15,38] were offered by the present suggested nano-composite material in this work.

4. Conclusions

A facile method was presented for the removal of alizarin dyes from aqueous industrial effluents. The method was based on the use of SnO2/CeO2 nano-composite catalyst. The catalyst was synthesized by the so-called “co-precipitation method” and characterized by X-ray powder diffractometry (XRD), high-resolution transmission electron microscopy (HR-TEM), Brunauer–Emmett–Teller methodology (BET) and Fourier transform infrared spectrometry (ATR-FTIR). Polycrystalline and spherical structure were confirmed with a mean average grain size of 27 nm. The prepared nano-composite revealed a high affinity for the adsorption and decomposition of alizarin dyes. Alizarin-3-methylimino-diacetic acid, alizarin yellow and alizarin red S dyes showed removal efficiencies of 95.0%, 95.3% and 87.8%, respectively. The optimal conditions for the adsorption capacity were pH 3.0, 25 mg/L dye, 30 min contact time and 0.15 gm catalyst. The adsorption isotherms agreed with Langmuir, Freundlich and Temkin isotherms. A comparison of the performance of the present suggested sorbent with some of those previously described nano-materials for the removal of alizarin is shownin Table 3. The presented method offered high maximum adsorption capacity, reasonable contact time, high removal percentage and low amount of adsorbent dosage compared to those presented by the previously reported methods.

Author Contributions

The listed authors contributed to this work as described in the following: H.A.E.-N., A.A.H., S.S.M.H. and A.H.K. gave the concepts of the work, interpretation of the results, the experimental part and prepared the manuscript, A.H.K., S.S.M.H. and A.E.-G.E.A. cooperated in the preparation of the manuscript and A.H.K. and S.S.M.H. performed the revision before submission. A.E.-G.E.A. and E.A.E. revealed the financial support for the work. All authors have read and agreed to the published version of the manuscript.

Funding

King Saud University, Project (Project No. RSP-2019/66).

Acknowledgments

Authors are grateful to King Saud University for funding the work through Researchers Supporting Project (Project No. RSP-2019/66).

Conflicts of Interest

The authors declare no conflict of interest.

References

  1. Namasivayam, C.; Kavitha, D. Removal of congo red from water by adsorption onto activated carbon prepared from coir pith an agricultural solid waste. Dyes Pigm. 2002, 54, 47–58. [Google Scholar] [CrossRef]
  2. Parra, S.; Stanca, S.E.; Guasaquillo, I.; Thampi, K.R. Photo-catalytic degradation of atrazine using suspended and supported TiO2. Appl. Catal. B-Environ. 2004, 51, 107–116. [Google Scholar] [CrossRef]
  3. Zucca, P.; Vinci, C.; Sollai, F.; Rescigno, A.; Sanjust, E. Degradation of Alizarin Red S under mild experimental conditions by immobilized 5,10,15,20-tetrakis (4-sulfonatophenyl) porphine-Mn(III) as a biomimetic peroxidase like catalyst. J. Mol. Catal. A-Chem. 2008, 288, 97–102. [Google Scholar] [CrossRef]
  4. Riu, J.; Schönsee, I.; Barceló, D.; Ràfols, C. Determination of sulphonated azo dyes in water and wastewater. TrAC Tr. Anal. Chem. 1997, 16, 405–419. [Google Scholar] [CrossRef]
  5. Gadd, G.M. Biosorption: critical review of scientific rationale, environmental importance and significance for pollution treatment. J. Chem. Technol. Biotechnol. 2009, 84, 13–28. [Google Scholar] [CrossRef]
  6. Mittal, A.; Mittal, J.; Kurup, L.; Singh, A.K. Process development for the removal and recovery of hazardous dye erythrosine from wastewater by waste materials bottom ash and de-oiled soya as adsorbents. J. Hazard. Mater. 2006, 138, 95–105. [Google Scholar] [CrossRef]
  7. Joshi, K.M.; Shrivastava, V.S. Degradation of Alizarin Red-S (A Textiles Dye) by Photocatalysis using ZnO and TiO2 as Photocatalyst. Int. J. Environ. Sci. 2011, 2, 8–21. [Google Scholar]
  8. Seddigi, Z.S. Removal of Alizarin Yellow Dye from Water Using Zinc Doped WO3 Catalyst. Bull. Environ. Contam. Toxicol. 2010, 84, 564–567. [Google Scholar] [CrossRef]
  9. Xiong, Z.; Xu, A.; Li, H.; Ruan, X.; Xia, D.; Zeng, Q. Highly Efficient Photodegradation of Alizarin Green in TiO2 Suspensions Using a Microwave Powered Electrodeless Discharged Lamp. Ind. Eng. Chem. Res. 2013, 52, 362–369. [Google Scholar]
  10. Roopaei, H.; Zohdi, A.R.; Abbasi, Z.; Bazrafkan, M. Preparation of New Photocatalyst for Removal of Alizarin Red-S from Aqueous Solution. Ind. J. Sci. Tech. 2014, 7, 1882–1887. [Google Scholar]
  11. Panizza, M.; Oturan, M.A. Degradation of Alizarin Red by Electro-Fenton Process Using A Graphite-Felt Cathode. Electrochim. Acta 2011, 56, 7084–7087. [Google Scholar] [CrossRef]
  12. Hasan, M.; Kumar, R.; Barakat, M.A.; Lee, M. Synthesis of PVC/CNT nanocomposite fibers using a simple deposition technique for the application of Alizarin Red S (ARS) removal. RSC Adv. 2015, 5, 14393–14399. [Google Scholar] [CrossRef]
  13. Fayazi, M.; Motlagh, M.G.; Taher, M.A. The adsorption of basic dye (Alizarin red S) from aqueous solution onto activated carbon/γ-Fe2O3nano-composite: Kinetic and equilibrium studies. Mat. Sci. Semicond. Proc. 2015, 40, 35–43. [Google Scholar] [CrossRef]
  14. Hanif, S.; Shahzad, A. Removal of chromium(VI) and dye Alizarin Red S (ARS) using polymer-coated iron oxide (Fe3O4) magnetic nanoparticles by co-precipitation method. J. Nanopart. Res. 2014, 16, 2429–2444. [Google Scholar] [CrossRef]
  15. Jadhava, H.V.; Khetre, S.M.; Bamane, S.R. Removal of alizarin red-S from aqueous solution by adsorption on nanocrystalline Cu0.5Zn0.5Ce3O5. Der Chem. Sin. 2011, 2, 68–75. [Google Scholar]
  16. Ahmad, R.; Kumar, R. Comparative adsorption study for the removal of Alizarin Red S and patent Blue VF by using mentha waste. Curr. World Environ. 2008, 3, 261–268. [Google Scholar] [CrossRef] [Green Version]
  17. Ghaedia, M.; Najibia, A.; Hossainiana, H.; Shokrollahia, A.; Soylakbc, M. Kinetic and equilibrium study of Alizarin Red S removal by activated carbon. Toxicol. Environ. Chem. 2012, 94, 40–48. [Google Scholar] [CrossRef]
  18. Gholivand, M.B.; Yamini, Y.; Dayeni, M.; Seidi, S.; Tahmasebi, E. Adsorptive removal of alizarin red-S and alizarin yellow GG from 2 aqueous solutions using polypyrrole-coated magnetic nanoparticles. J. Environ. Chem. Eng. 2015, 3, 529–540. [Google Scholar] [CrossRef]
  19. Fan, L.; Zhang, Y.; Li, X.; Luo, C.; Lu, F.; Qiu, H. Removal of alizarin red from water environment using magnetic chitosan with Alizarin Red as imprinted molecules. Colloid. Surf. B 2012, 91, 250–257. [Google Scholar] [CrossRef]
  20. Salam, N.A.; Buhari, M. Adsorption of Alizarin and Fluorescein Dyes on Adsorbent prepared from Mango Seed. Pac. J. Sci. Technol. 2014, 15, 232–244. [Google Scholar]
  21. Shakeel, F.; Haq, N.; Alanazi, F.K.; Alsarra, I.A. Removal of alizarin red from aqueous solution by ethyl acetate green nanoemulsions. Water Sci. Technol. 2014, 70, 1569–1574. [Google Scholar] [CrossRef] [PubMed]
  22. Crt, T.; Maz, A. Biosorption of heavy metals using rice milling byproducts: characterization and application for removal of metals from aqueous effluents. Chemosphere 2004, 54, 987–995. [Google Scholar]
  23. Mayo, J.T.; Yavuz, C.; Yean, S.; Cong, L.; Shipley, H.; Yu, W.; Falkner, J.; Kan, A.; Tomson, M.; Colvin, V.L. The effect of nanocrystalline magnetite size on arsenic removal. Sci. Technol. Adv. Mater. 2007, 8, 71–75. [Google Scholar] [CrossRef] [Green Version]
  24. Abdel-Messih, M.F.; Ahmed, M.A.; El-Sayed, A.S. Photocatalytic decolorization of Rhodamine B dye using novel mesoporous SnO2–TiO2 nano mixed oxides prepared by sol–gel method. J. Photochem. Photobiol. A-Chem. 2013, 260, 1–8. [Google Scholar] [CrossRef]
  25. Lamba, R.; Umar, A.; Mehta, S.K.; Kansal, S.K. CeO2-ZnO hexagonal nanodisks: Efficient material for the degradation of direct blue 15 dye and its simulated dye bath effluent under solar ligh. J. Alloy. Compd. 2015, 620, 67–73. [Google Scholar] [CrossRef]
  26. Tomić, N.M.; Dohčević-Mitrović, Z.D.; Paunović, N.M.; Mijin, D.Z.; Radić, N.D.; Grbić, B.V.; Aškrabić, S.M.; Babić, B.M.; Bajuk-Bogdanović, D.V. Nanocrystalline CeO2−δ as Effective Adsorbent of Azo Dyes. Langmuir 2014, 30, 11582–11590. [Google Scholar] [CrossRef] [Green Version]
  27. Zhao, H.; Zhang, G.; Zhang, Q. MnO2/CeO2 for catalytic ultrasonic degradation of methyl orange. Ultrason. Sonochem. 2014, 21, 991–996. [Google Scholar] [CrossRef]
  28. Pradhan, G.K.; Parida, K.M. Fabrication of iron-cerium mixed oxide: an efficient photocatalyst for dye degradation. Int. J. Eng. Sci. Technol. 2010, 2, 53–65. [Google Scholar] [CrossRef] [Green Version]
  29. Zhou, G.; Guo, K. Diffraction of Crystal and Pseudo Crystal; Beijing University Publishing House: Beijing, China, 1999. [Google Scholar]
  30. Gregg, S.J.; Sing, K.S.W. Adsorption, Surface Area and Porosity, 2nd ed.; Academic Press: London, UK, 1982. [Google Scholar]
  31. El-Desoky, H.S.; Ghoneim, M.M.; El-badawy, F.M. Carbon Nanotubes Modified Electrode for Enhanced Voltammetric Sensing of Mebeverine Hydrochloride in Formulations and Human Serum Samples. J. Electrochem. Soc. 2017, 164, B212–B222. [Google Scholar] [CrossRef]
  32. Lurie, J. Handbook of Analytical Chemistry; Mir Publishers: Moscow, Russia, 1975. [Google Scholar]
  33. Takahashi, S.; Suzuki, I.; Sugawara, T.; Seno, M.; Minaki, D.; Anzai, J. Alizarin Red S-Confined Layer-By-Layer Films as Redox-Active Coatings on Electrodes for the Voltammetric Determination of L-Dop. Materials 2017, 10, 581. [Google Scholar] [CrossRef] [Green Version]
  34. Balarak, D.; Mostafapour, F.K.; Azarpira, H.; Joghataei, A. Langmuir, Freundlich, Temkin and Dubinin–radushkevich Isotherms Studies of Equilibrium Sorption of Ampicilin unto Montmorillonite Nanoparticles. J. Pharm. Res. Int. 2017, 20, 1–9. [Google Scholar] [CrossRef]
  35. Esmat, M.; Farghali, A.A.; Khedr, M.H.; El-Sherbiny, I.M. Alginate-based nanocomposites for efficient removal of heavy metal ions. Int. J. Biol. Macromol. 2017, 102, 272–283. [Google Scholar] [CrossRef] [PubMed]
  36. Al-Rubayee, W.T.; Abdul-Rasheed, O.F.; Ali, N.M. Preparation of a Modified Nanoalumina Sorbent for the Removal of Alizarin Yellow R and Methylene Blue Dyes from Aqueous Solutions. J. Chem. 2016, 2016, 1–12. [Google Scholar] [CrossRef]
  37. Wu, K.; Yu, J.; Jiang, X. Multi-walled carbon nanotubes modified by polyaniline for the removal of alizarin yellow R fromaqueous solutions. Adsorp. Sci. Technol. 2018, 36, 198–214. [Google Scholar] [CrossRef] [Green Version]
  38. Hashemian, S.; Rahimi, M.; Kerdegari, A.A. CuFe2O4@graphene nanocomposite as a sorbent for removal of alizarine yellow azo dye from aqueous solutions. Desalin. Water Treat. 2015, 57, 1–12. [Google Scholar] [CrossRef]
  39. Ali, O.; Mohamed, S. Adsorption of copper ions and alizarin red S from aqueous solutions onto a polymeric nanocomposite in single and binary systems. Turkish J. Chem. 2017, 41, 967–986. [Google Scholar] [CrossRef]
  40. Gautam, P.K.; Gautam, R.K.; Banerjee, S.; Chattopadhyaya, M.C.; Pandey, J.D. Adsorptive Removal of Alizarin Red S by a Novel Biosorbent of an Invasive Weed Mikania micrantha. Natl. Acad. Sci. Lett. 2017, 40, 113–116. [Google Scholar] [CrossRef]
  41. Liang, Y.; He, Y.; Yu-hang Zhang, Y.; Zhu, Q. Adsorption Property of Alizarin Red S by NiFe2O4/Polyaniline Magnetic Composite. J. Environ. Chem. Eng. 2018, 6, 416–425. [Google Scholar] [CrossRef]
  42. Absalan, G.; Bananejad, A.; Ghaemi, M. Removal of Alizarin Red and Purpurin from Aqueous Solutions Using Fe3O4 Magnetic Nanoparticles. Anal. Bioanal. Chem. Res. 2017, 4, 65–77. [Google Scholar]
  43. Adlnasab, L.; Ezoddin, M.; Karimi, M.A.; Hatamikia, N. MCM-41@Cu–Fe–LDH magnetic nanoparticles modified with cationic surfactant for removal of Alizarin Yellow from water samples and its determination with HPLC. Res. Chem. Intermed. 2018, 44, 3249–3265. [Google Scholar] [CrossRef]
  44. Wanassi, B.; Hariz, I.B.; Ghimbeu, C.M.; Vaulot, C.; Jeguirim, M. Green Carbon Composite-Derived Polymer Resin and Waste Cotton Fibers for the Removal of Alizarin Red S Dye. Energies 2017, 10, 1321. [Google Scholar] [CrossRef] [Green Version]
Figure 1. XRD pattern of SnO2/CeO2 nano-particles (NPs).
Nanomaterials 10 00254 g001
Figure 2. TEM images of SnO2/CeO2 nano-composite (A): magnification of ×75,000 and (B): magnification of ×120,000.
Nanomaterials 10 00254 g002
Figure 3. FTIR spectrum of SnO2/CeO2 NPs.
Nanomaterials 10 00254 g003
Figure 4. N2 adsorption–desorption isotherms of coupled SnO2/CeO2 NPs.
Nanomaterials 10 00254 g004
Figure 5. Cyclic voltammograms of carbon past electrode (CPE) and SnO2/CeO2/CP electrode at a scanning rate of 300 mV/s.
Nanomaterials 10 00254 g005
Figure 6. UV spectra of alizarin dye subjected to removal with different CeO2 % at λmax = 422 nm.
Nanomaterials 10 00254 g006
Figure 7. Zeta potential of SnO2/CeO2 nano-catalyst at different pHs.
Nanomaterials 10 00254 g007
Figure 8. Effect of pH on alizarin removal (V = 30 mL, AY conc. = 25 µg/mL, contact time = 30 min and catalyst amount = 0.15 g).
Nanomaterials 10 00254 g008
Figure 9. Effect of contact time on alizarin removal at (A) pH 3.0, (B) pH 7.0 (V = 30 mL, AY conc. = 25 µg/mL and catalyst amount = 0.15 g).
Nanomaterials 10 00254 g009
Figure 10. Effect of adsorbent amount on alizarin removal at (A) pH 3.0, (B) pH 7.0 (V = 30 mL, AY conc. = 25 µg/mL and contact time = 30 min).
Nanomaterials 10 00254 g010
Figure 11. Effect of alizarin dye concentration on the removal of the dye at (A) pH 3.0, (B) pH 7.0 (V = 30 mL, contact time = 30 min and catalyst amount = 0.15g).
Nanomaterials 10 00254 g011
Figure 12. (a) Langmuir, (b) Freundlich and (c) Temkin isotherms for alizarin removal.
Nanomaterials 10 00254 g012
Table 1. General surface characteristics of SnO2/CeO2 nano-composite obtained byN2 adsorption at 77 K.
SampleSurface Area (m2 g−1)Average Pore Volume, (cm3 g−1)Average Pore Diameter (nm)
SnO2/CeO2 NPs18.9703.399 × 10−27.164
Table 2. Redox potentials (E) of cerium, tin and alizarin.
SystemStandard Redox Potential, (V)Ref.
Ce4+(aq) + e Nanomaterials 10 00254 i001 Ce3+(aq)+1.61[32]
Sn4+(aq) + 2 e Nanomaterials 10 00254 i001 Sn2+(aq)+0.15
Sn2+(aq) + 2 e Nanomaterials 10 00254 i001 Sn(s)−0.14
Alizarin Nanomaterials 10 00254 i001Alizarin oxidation product−0.59[33]
Table 3. Comparison of various nano-adsorbents for alizarin dyes removal.
Adsorbent TypeMaximum Adsorption Capacity, mg/gContact TimeOptimum pHBest Fit IsothermAdsorbent Dosage, gmRemoval, %Ref.
ZnO/TiO212.5120 min8Langmuir5.084.4–92.9[7]
Zinc doped WO3 catalystNR10 minNRNR0.480[8]
α-Fe2O3/NiSNRNR5NR1.088.3[10]
Activated carbon/γ-Fe2O3 nano-composite108.660 min2Langmuir0.0199.4[13]
Poly METAC/Fe3O4 magnetic nanoparticlesNR2 daysNRNRNR80–96[14]
Nanocrystalline Cu0.5Zn0.5Ce3O5NR5 minNRFreundlich0.283%[15]
PPy-coated Fe3O4 nanoparticles116.360 min4–5.4Langmuir0.1–0.1278.7[18]
Chitosan-coated Fe3O4 nanoparticles40.1250 min3Langmuir0.1NR[19]
2,4-dinitrophenyl hydrazine/Nano 𝛾-Alumina47.860 min4Langmuir0.0595.6[36]
MWCNTs/PANI884.850 min8.5Langmuir0.02N.R[37]
Fe3O4 nanoparticles45.85 min5Langmuir0.0299[42]
CuFe2O4@graphene nanocomposite14540 min3Langmuir0.595[38]
Chitosan/ZnO nanorod composite 36.427 h2Freundlich0.185[39]
Fe3O4@MCM@Cu–Fe–LDH121.910 min9Langmuir0.03N.R[43]
Biosorbent from Mikaniamicrantha46.5N.R2Freundlich0.1N.R[40]
Green carbon composite-derived polymer resin and waste cotton fibers1041day3FreundlichNRN.R[44]
NiFe2O4/Polyaniline Magnetic Composite18690 min4-8.6Langmuir0.0396[41]
SnO2/CeO2 nano-composite18.530 min3Freundlich and Langmuir0.1596.4This work
* NR (not reported), (METAC) (methacryloyloxy)ethyl trimethyl-ammonium chloride, DNPH (2,4-dinitrophenyl hydrazine), MCM (Mobil composition of matter), LDH (layered double hydroxides), multi-walled carbon nanotubes (MWCNTs), polyaniline (PANI), poly pyrrol (PPy).

