Article

Comprehensive Density Functional Theory Studies of Vibrational Spectra of Carbonates

by
Yurii N. Zhuravlev
1 and
Victor V. Atuchin
2,3,4,*
1
Institute of Basic Sciences, Kemerovo State University, 650000 Kemerovo, Russia
2
Research and Development Department, Kemerovo State University, 650000 Kemerovo, Russia
3
Laboratory of Optical Materials and Structures, Institute of Semiconductor Physics, SB RAS, 630090 Novosibirsk, Russia
4
Laboratory of Semiconductor and Dielectric Materials, Novosibirsk State University, 630090 Novosibirsk, Russia
*
Author to whom correspondence should be addressed.
Nanomaterials 2020, 10(11), 2275; https://doi.org/10.3390/nano10112275
Submission received: 22 October 2020 / Revised: 6 November 2020 / Accepted: 8 November 2020 / Published: 17 November 2020

Abstract

:
Within the framework of the density functional theory (DFT) and the hybrid functional B3LYP by means of the CRYSTAL17 program code, the wavenumbers and intensities of normal oscillations of MgCO3, CaCO3, ZnCO3, CdCO3 in the structure of calcite; CaMg(CO3)2, CdMg(CO3)2, CaMn(CO3)2, CaZn(CO3)2 in the structure of dolomite; BaMg(CO3)2 in the structure of the norsethite type; and CaCO3, SrCO3, BaCO3, and PbCO3 in the structure of aragonite were calculated. Infrared absorption and Raman spectra were compared with the known experimental data of synthetic and natural crystals. For lattice and intramolecular modes, linear dependences on the radius and mass of the metal cation are established. The obtained dependences have predictive power and can be used to study solid carbonate solutions. For trigonal and orthorhombic carbonates, the linear dependence of wavenumbers on the cation radius RM (or M–O distance) is established for the infrared in-plane bending mode: 786.2–65.88·RM and Raman in-plane stretching mode: 768.5–53.24·RM, with a correlation coefficient of 0.87.

1. Introduction

Carbonates form an extensive class of chemical compounds containing the carbonate ion CO 3 2 as the main structural element [1,2]. In nature, carbonates are found in many minerals and play a crucial role in the carbon exchange of our planet [2,3,4,5,6,7,8]. Carbonate compounds are widely used in the construction industry, optics, and nanotechnology [9,10,11,12,13,14,15]. Appearance of the carbonate species due to chemical interaction with the atmosphere agents was detected at the surface of many oxide materials widely used in optical and electronic technologies [16,17,18,19,20]. In recent years, many artificial crystals of complex carbonates that have no analogues in nature were created [1]. Due to the specific features of the crystal structure, such materials, in many cases, are characterized by high birefringence, nonlinear optical properties, and transparency in the ultraviolet spectral range, which makes them perspective materials for use in optical devices in the UV range [21,22,23,24,25,26,27]. In this aspect, it is of particular importance to study the physicochemical properties of carbonates—in particular, the relationship between their structural and spectroscopic characteristics. According to this approach, this work is aimed at a systematic study of the relationship between the crystal structure and vibrational characteristics of a set of crystals of simple and binary anhydrous carbonates known in nature. Such minerals form several crystal-chemical families, which makes it possible to study the effects of cation substitution on the wavenumbers of vibrational modes within the framework of a single structural type. In the near future, with the accumulation of experimental data of complex carbonates, this algorithm can be extended to new families of complex artificial crystals.
Natural carbonates are composed of over 60 minerals [2]. Simple and double rock-forming carbonates can be divided into three main groups based on the similarity of structures: calcite, dolomite, and aragonite. The structures of these crystals are shown in Figure 1. Calcite is the most abundant of all carbonate minerals [28]. The triangular geometry CO 3 2 dominates in the structure of calcite, which leads to rhombohedral symmetry of the crystal lattice with the space group R-3c. A primitive cell contains two formula units (Z = 2). Divalent cations are octahedrally coordinated by oxygen atoms (Figure 1a). The calcite group includes anhydrous carbonates with the general formula MCO3 (M: Ca2+, Mg2+, Fe2+, Zn2+, Mn2+, Co2+, Ni2+ and Cd2+): calcite (CaCO3) [29], magnesite (MgCO3) [30], siderite (FeCO3) [31], smithsonite (ZnCO3) [32], hodochrosite (MnCO3) [33], spherocobaltite (CoCO3) [34], gaspeite (NiCO3) [35], and otavite (CdCO3) [36]. The ability to form isomorphic mixtures is widespread among the minerals of the calcite series [37].
One of the most common minerals is a double carbonate—dolomite (CaMg(CO3)2) [38]. Dolomite is structured by natural minerals: minocordite (CaZn(CO3)2) [39], ankerite (CaFe(CO3)2) [40], and kutnohorite CaMn(CO3)2) [41]. Several crystals from the dolomite family were synthesized, including CdMg(CO3)2, CdMn(CO3)2, and CdZn(CO3)2 [42], and the structures were identified in [43]. Under ambient conditions, dolomite crystallizes in a rhombohedral structure with the space group R-3 (Z = 2). Its layered structure consists of alternating [CaO6] and [MgO6] octahedra separated by nearly flat and parallel carbonate groups. The structure differs from calcite by the absence of a slip plane.
Double carbonates are also known in the structure of norsethite (BaMg(CO3)2) [44] (Figure 1c). BaMn(CO3)2 does not exist in nature, but it was synthesized in [45]. The norsethite structure is described in c-space group R-3c symmetry with doubled c-axis, which corresponds to different rotations of carbonate groups [46]. As the temperature rises in BaMg(CO3)2, a phase transition is observed from a phase stable under ambient conditions to a high-temperature structure, which is accompanied by a change in the symmetry R-3cR-3m. In the R-3m symmetry, the unit cell of BaMg(CO3)2 consists of the [MgO6] octahedron, [BaO12] polyhedron, and anions. Octahedra and polyhedra are in alternating layers, they are located exactly one above the other, parallel to the [001] direction and are separated by triangular groups CO 3 2 . Natural isostructural orthorhombic carbonates are aragonite (CaCO3) (Figure 1d), strontianite (SrCO3), cerussite (PbCO3), and witherite (BaCO3) [47,48], listed in the order of increasing the size of the cation. In a crystal structure with the space group Pmcn (Z = 4), layers of 9-coordinated cations M2+ (M: Ca2+, Sr2+, Pb2+, Ba2+) in an approximately hexagonal close packing alternate with layers of planar CO 3 2 groups arranged perpendicular to the c-axis. Like calcites, aragonites form solid solutions [49]. Studies of isostructural orthorhombic carbonates are important for understanding phase transition sequences under pressure and temperature and, therefore, can provide insight into a carbon behavior in the Earth mantle [50,51,52,53].
The optical properties of natural carbonates were extensively explored since these widespread and cheap natural minerals can be used as raw resources for infrared technology materials [54]. In this regard, their infrared spectra (IRS) [55] and Raman spectra (RS) [56,57] were previously studied experimentally and then theoretically [58,59]. Single crystals of iron-free magnesite were studied by Raman spectroscopy [30]; calcite and dolomite crystals were studied in [60] and all crystal were studied in [61]. In [62], they were evaluated with the methods of laser Raman spectroscopy and density functional theory (DFT) calculations using the plane wave basis (PW) and pseudopotentials of the Troullier–Martins type (TM PP). Otavite vibrational spectra were measured in experiment [63]. Eight natural carbonate minerals with a calcite structure were studied using Raman spectroscopy [64]. It was shown that changes in the wavenumber of phonon modes of the Eg(T) symmetry correlate with the distances between the nearest metal and oxygen atoms M–O and the cation ionic radii. Using a graphical approach, the authors developed the spectroscopic Raman model to calculate the ionic radius of a divalent metal cation present in a mineral.
In [65], studies of the infrared spectra of natural iron-free dolomite were carried out. A combined study of infrared absorption and Raman scattering on a natural dolomite sample CaMg0.98Fe0.02(CO3)2 was performed [66]. DFT using exchange correlation potentials in the local density approximation (LDA) and generalized gradient approximation (GGA) in the PW basis with TM PP were used here to interpret the obtained results. The Raman and infrared spectra of cerussite were measured and compared with the spectral characteristics of other minerals of the aragonite family [67]. RS and IRS at high temperature in situ were measured for aragonite, strontianite, cerussite, and witherite at atmospheric pressure [68]. Studies for high and medium temperature infrared absorption and Raman spectroscopy on a synthetic strontianite sample led to the construction of a pressure-temperature phase diagram [69]. In addition, here for the first time, the absorption spectra in the far infrared range were measured for the entire family of aragonite-type carbonates.
The works in which experimental and theoretical spectroscopic studies were performed for a group of carbonates with different structures are of particular interest. Thus, the purpose of the study [70] was to establish the influence of the M2+ cation type on the shift of positions of the absorption bands of various anhydrous carbonate minerals from the calcite and dolomite families. In this contribution, it is shown that the position of the minima of absorption bands is unique for each chemical composition of carbonates and can be a diagnostic indicator in mineralogy. A selection of the frequencies of intramolecular modes for a large number of carbonates is also found in [71]. In [72], infrared spectra in the wavenumber range of 70–650 cm−1 were presented for 18 common and rare minerals which are quite pure in composition and have a known crystal structure. It is shown that the spectra in the far infrared range of different carbonates from the same structural group have a pronounced similarity, and the observed shifts demonstrate the effect of changing the mass of cations. The vibrational modes of natural minerals—aragonite, calcite, dolomite, magnesite, rhodochrosite, and siderite—that are active in the Raman spectrum were observed, and their pressure and temperature inducing frequency shifts were determined [73].
Thus, there are comparatively numerous experimental and individual theoretical studies of the vibrational spectra of carbonates in which the patterns of their changes during the substitution of cations were established for certain types of structures. However, systematic theoretical studies from a unified standpoint, carried out for all types of carbonate structures and having a predictive power in early works, are absent. The aim of this work is to theoretically study the dependences of the characteristics of the infrared and Raman spectra of carbonates crystallizing in the structures of calcite, dolomite, and aragonite on the radii and masses of metal cations. The parameters of vibrational spectra of carbonates were calculated within the framework of a unified approach based on the known experimental data of crystal structure. Furthermore, the results of our calculations were compared with the available experimental and theoretical parameters of the infrared and Raman spectra of carbonates and, on this basis, the general regularities of changes in the vibrational spectra were determined upon substitution of metal cations. Then, the information can be used as an instrument in the analysis of vibrational spectra of new crystalline compounds and solid solutions. The calculated quantitative dependences can also be used in noncontact nondestructive diagnostics of carbonates by spectroscopic techniques.

2. Calculation Method

The research of the ordinary optical properties dependences of metal carbonates were carried out within ab initio principles using the Hartree–Fock theory (HF) methods and density functional theory, which are well combined in the CRYSTAL17 program code [74,75]. The hybrid functional B3LYP, which includes the 20% HF exchange with the Becke exchange functional [76] and the LYP correlation functional [77], was used. The basic functions were chosen in the form of a linear combination of localized atomic orbitals of the Gaussian type. We used full-electronic basis sets for carbon, oxygen, magnesium, and calcium atoms from [78] and the gaussian basis sets of double-zeta valence with polarization quality basis set for zinc and cadmium atoms [79,80]. We used pseudopotential basis sets from [81] for strontium and barium, those of [82] for manganese, and those of [83] for lead.
The reciprocal space was sampled using a Monkhorst–Pack [84] grid with 216 independent k-points in the irreducible Brillouin zone for trigonal crystals, and 64 points for orthorhombic crystals. The accuracy of the self-matching procedure was no less than 10−9 a.u. (1 a.u. = 27.21 eV). The vibrational frequencies of the lattice atoms were calculated using the FREQCALC procedure [85,86]. The phonon harmonic frequencies ωp at the point Г (k = 0, the center of the first Brillouin zone) were obtained from the diagonalization of the mass-weighted Hessian matrix of the second derivatives of energy with respect to atomic displacements u [87,88]:
W a i , b j Г = H a i , b j 0 M a M b , H a i , b j 0 = ( 2 E u a i 0 u b j 0 )  
where atoms a and b with masses Ma and Mb are displaced in the unit cell (index 0) from equilibrium positions along the i- and j-Cartesian directions, respectively. The first order derivatives were calculated analytically, whereas the second order derivatives were obtained numerically. The intensity of IR absorption for the ν-vibration was calculated using the Born effective charge tensor Z*, which characterizes the change in dynamics and the electronic configuration of atom displacement. The relative intensities of the Raman peaks were calculated analytically using the extension scheme of the analytical calculation of IR intensity [89]. The proposed technique was previously used to study the ordinary properties of sulfates [90].

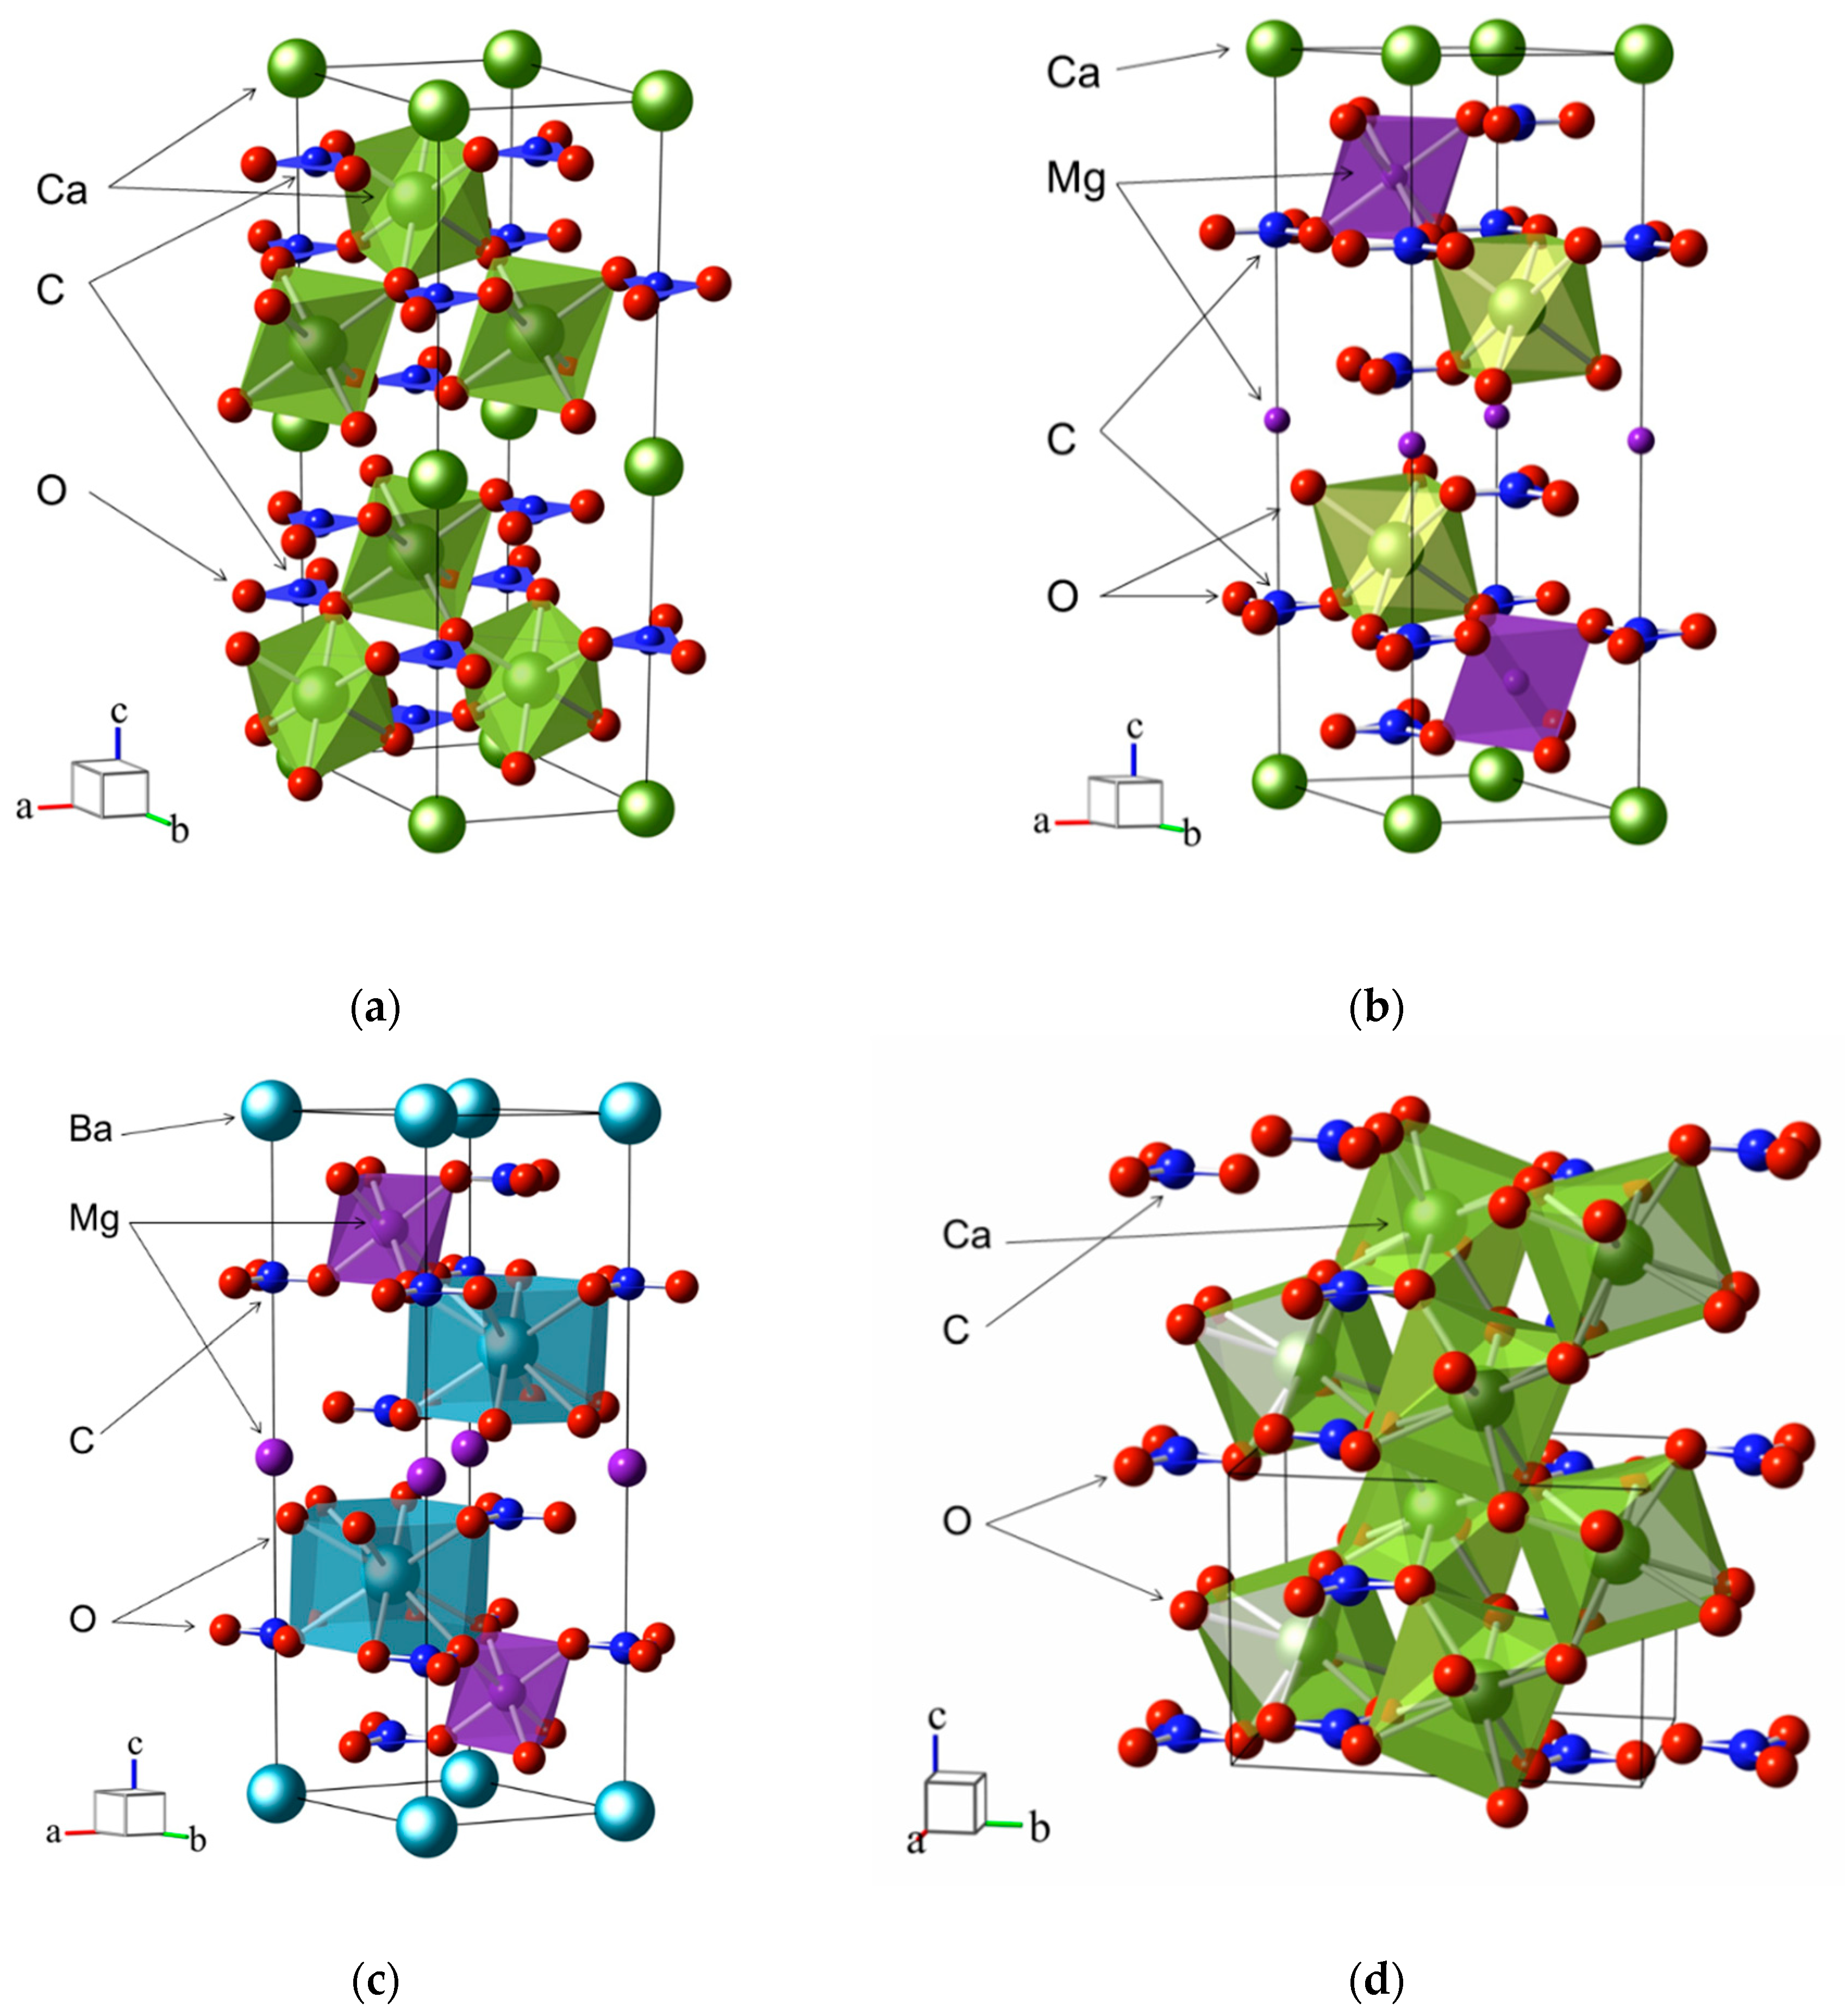
3. Crystal Structure

The crystal structure parameters of calcite, dolomite, norsethite, and aragonite types calculated in this work are shown in Table 1. There is a close agreement between the optimized and experimental parameters of the crystal lattice. Thus, the standard deviation Δ = 1 N i = 1 N ( e x p i t h e o r i e x p i ) 2 for N = 5 theoretical values from Table 1 and the experimental (exp) value for synthetic magnesite [30] is 1.6%, for natural calcite [29]—1.9%, for smithsonite [32]—1.5%, for synthetic otavite [36]—2.4%, for dolomite [38]—1.5%, and for norsethite [46]—3.6%. For four crystals with aragonite structure, the deviation of three lattice constants and two interatomic distances from experimental data for natural minerals [48] is 2.7%.
As the physical quantities to describe the regularities of changes in the vibrational properties of carbonates from cationic substitution in the lattice, we used the mass of metal atoms (a.m.u.; Mg—23.985, Ca—39.963, Mn—54.938, Zn—63.929, Sr—87.906, Cd—113.904, Ba—137.905, and Pb—207.977) and the effective Shannon ionic radii [91]. The cationic radii of metals are determined by their electronic structure and depend on the coordination environment. The last filled electron shell of the magnesium ion is 2p6, and the radius of Mg2+ surrounded by six nearest neighbors is 0.72 Å. Similarly, for calcium: 3p6, 1.00 Å. In zinc and cadmium, the filled shells are 3d10 and 4d10, and the radii are 0.74 and 0.95 Å, respectively. In aragonite, each Ca2+ ion is already surrounded by nine oxygen atoms and, therefore, its effective radius is 1.18 Å. In the case of strontium and barium, the radii for the 9-fold environment are 1.31 and 1.47 Å, and for 12—1.44, 1.61 Å. The electronic configuration of lead [Xe] 4f14 5d10 6s26p2 distinguishes it from other elements; therefore, the radius of 9-coordinated Pb2+ is 1.35 Å, which is larger than that of strontium, but smaller than that of barium. Transition metals have partially filled 3d shells with the number of electrons from 5 to 8, and decreasing radii for Mn2+ (0.83 Å), Fe2+ (0.78 Å), and Co2+ (0.745 Å). Following [33], we write the chemical formula of an arbitrary solid solution as M1X1M2X2M3X3CO3, X1 + X2 + X3 = 1. Then, the average radius of the cation is determined as <RM> = XRM1 + XRM2 + XRM3, where RM1, RM2, RM3 are radii of divalent ions M12+, M22+, M32+. For dolomite, the cation radius is 0.86 Å, and for norsethite—1.165 Å. The average atomic mass of metals is calculated in a similar way.
It is convenient to describe the change in crystal cell parameters or frequencies (intensities) of the vibrational spectra y on the radii of cations or their masses (r) using the linear dependence y(r) = y0 + y1·r, where y0 is the value of the function at r = 0, y1—derivative of the function y, characterizing the rate of change of the corresponding value. The obtained calculated data y(ri), I = 1, N are approximated by a linear dependence (fit), and the accuracy of this procedure is controlled by the relation: K = i = 1 N ( y i f i t y f i t ¯ ) 2 / i = 1 N ( y i d a t a y d a t a ¯ ) 2 , where the average value y ¯ = 1 N i = 1 N y i .
The change in the calculated unit cell volume of carbonates by one formula unit V/Z from the cation radii RM obeys the linear dependence V/Z3) = 25.22 + 31.54·RM with a correlation coefficient of 0.936. The large slope of this dependence of 31.54 Å2 indicates that the replacement of the cation is of great importance for carbonates. The indicated dependence with the experimental values of volumes has the form V/Z3) = 22.48 + 36.2482·RM3) with the coefficient K = 0.945. For each individual lattice type, the correlation coefficient is much better: for calcite and aragonite, 0.995, and for dolomite, 0.969. The linear dependence is explained by the fact that the cell volume is weakly related to the structure symmetry but is determined by the stacking of layers of polyhedrons, which depends on the ionic radii of the substitutional atoms. According to Vegard’s law, the unit cell parameters change linearly depending on the composition, and for trigonal crystals, it can be written as: a(Å) = 4.008 + 0.959·RM (0.941), c(Å) = 11.772 + 4.917·RM (0.88). Hereinafter, the coefficient K is indicated in brackets. The linear dependence for all carbonates is fulfilled for the average distance between metal M and oxygen O: RM–O(Å) = 1.374 + 1.02·RM (0.985) with high accuracy.

4. Vibrational Spectra

The rhombohedral cell of calcite contains ten atoms, and 30 possible vibrational modes can be classified for it, according to irreducible representations of the point group as: Гtot = A1g(R) + 3A1u + 3A2g + 3A2u(IR) + 4Eg(R) + 6Eu(IR). A1g and 4Eg modes are active in Raman spectra (R), 3A2u and 5Eu modes are active in infrared (IR), A1u and 3A2g modes are spectroscopically inactive, and 1A2u and 1Eu modes are acoustic. Nine translational modes will refer to the symmetry A2g + A1u + A2u + Eg + 2Eu, six librational modes to A2g + A2u + Eg + Eu, and twelve internal vibrations to A1g + A2g + A1u + A2u + 2Eg + 2Eu. Modes of the A2u symmetry have polarization E||z and modes of Eu symmetry have Ez polarization. Internal vibrations of Eu symmetry are of the ν4 type (in-plane bending), A2u modes are of the ν2 type (out-of plane bending), and Eu symmetry are of the ν3 type of symmetric stretching. In the Raman spectrum, the ν4 (in-plane asymmetric stretching) mode has Eg symmetry, the ν1 symmetric stretch mode has A1g symmetry, and a ν3 asymmetric stretch type has Eg symmetry.
For dolomite structure, the expansion of the vibrational representation according to irreducible representations is Гtot = 4Ag(R) + 6Au(IR) + 4Eg(R) + 6Eu(IR). Nine translational modes refer to symmetry Ag + 2Au + Eg + 2Eu, six rotational modes refer to Ag + Au + Eg + Eu, and 12 internal modes refer to 2Ag + 2Au + 2Eg + 2Eu. For the norsethite type structure with the space group R-3m, the expansion of the vibrational representation is: Гtot = 3A1g(R) + 2A1u +A2g + 5A2u(IR) + 4Eg(R) + 6Eu(IR). For the aragonite orthorhombic structure, the symmetry of the carbonate group decreases to Cs. There will be 60 vibrational modes in total, where 1B1u + 1B2u + 1B3u are acoustic. The vibrational representation is decomposed into irreducible representations as Γtot = 9Ag + 6B1g(R) + 9B2g(R) + 6B3g(R) + 6Au + 9B1u(IR) + 6B2u(IR) + 9B3u(IR). The B2u symmetry modes have polarizations E||x(a), B3uE||y(b), B1uE||z(c). There will be 24 internal modes, eight of the ν4 and ν3 types, and four of the ν2 and ν1 types. The available experimental and theoretical data on vibration spectra of the carbonates under consideration are summarized in Supplementary Materials [92,93,94,95,96,97,98,99,100,101,102,103,104,105,106,107,108,109,110].

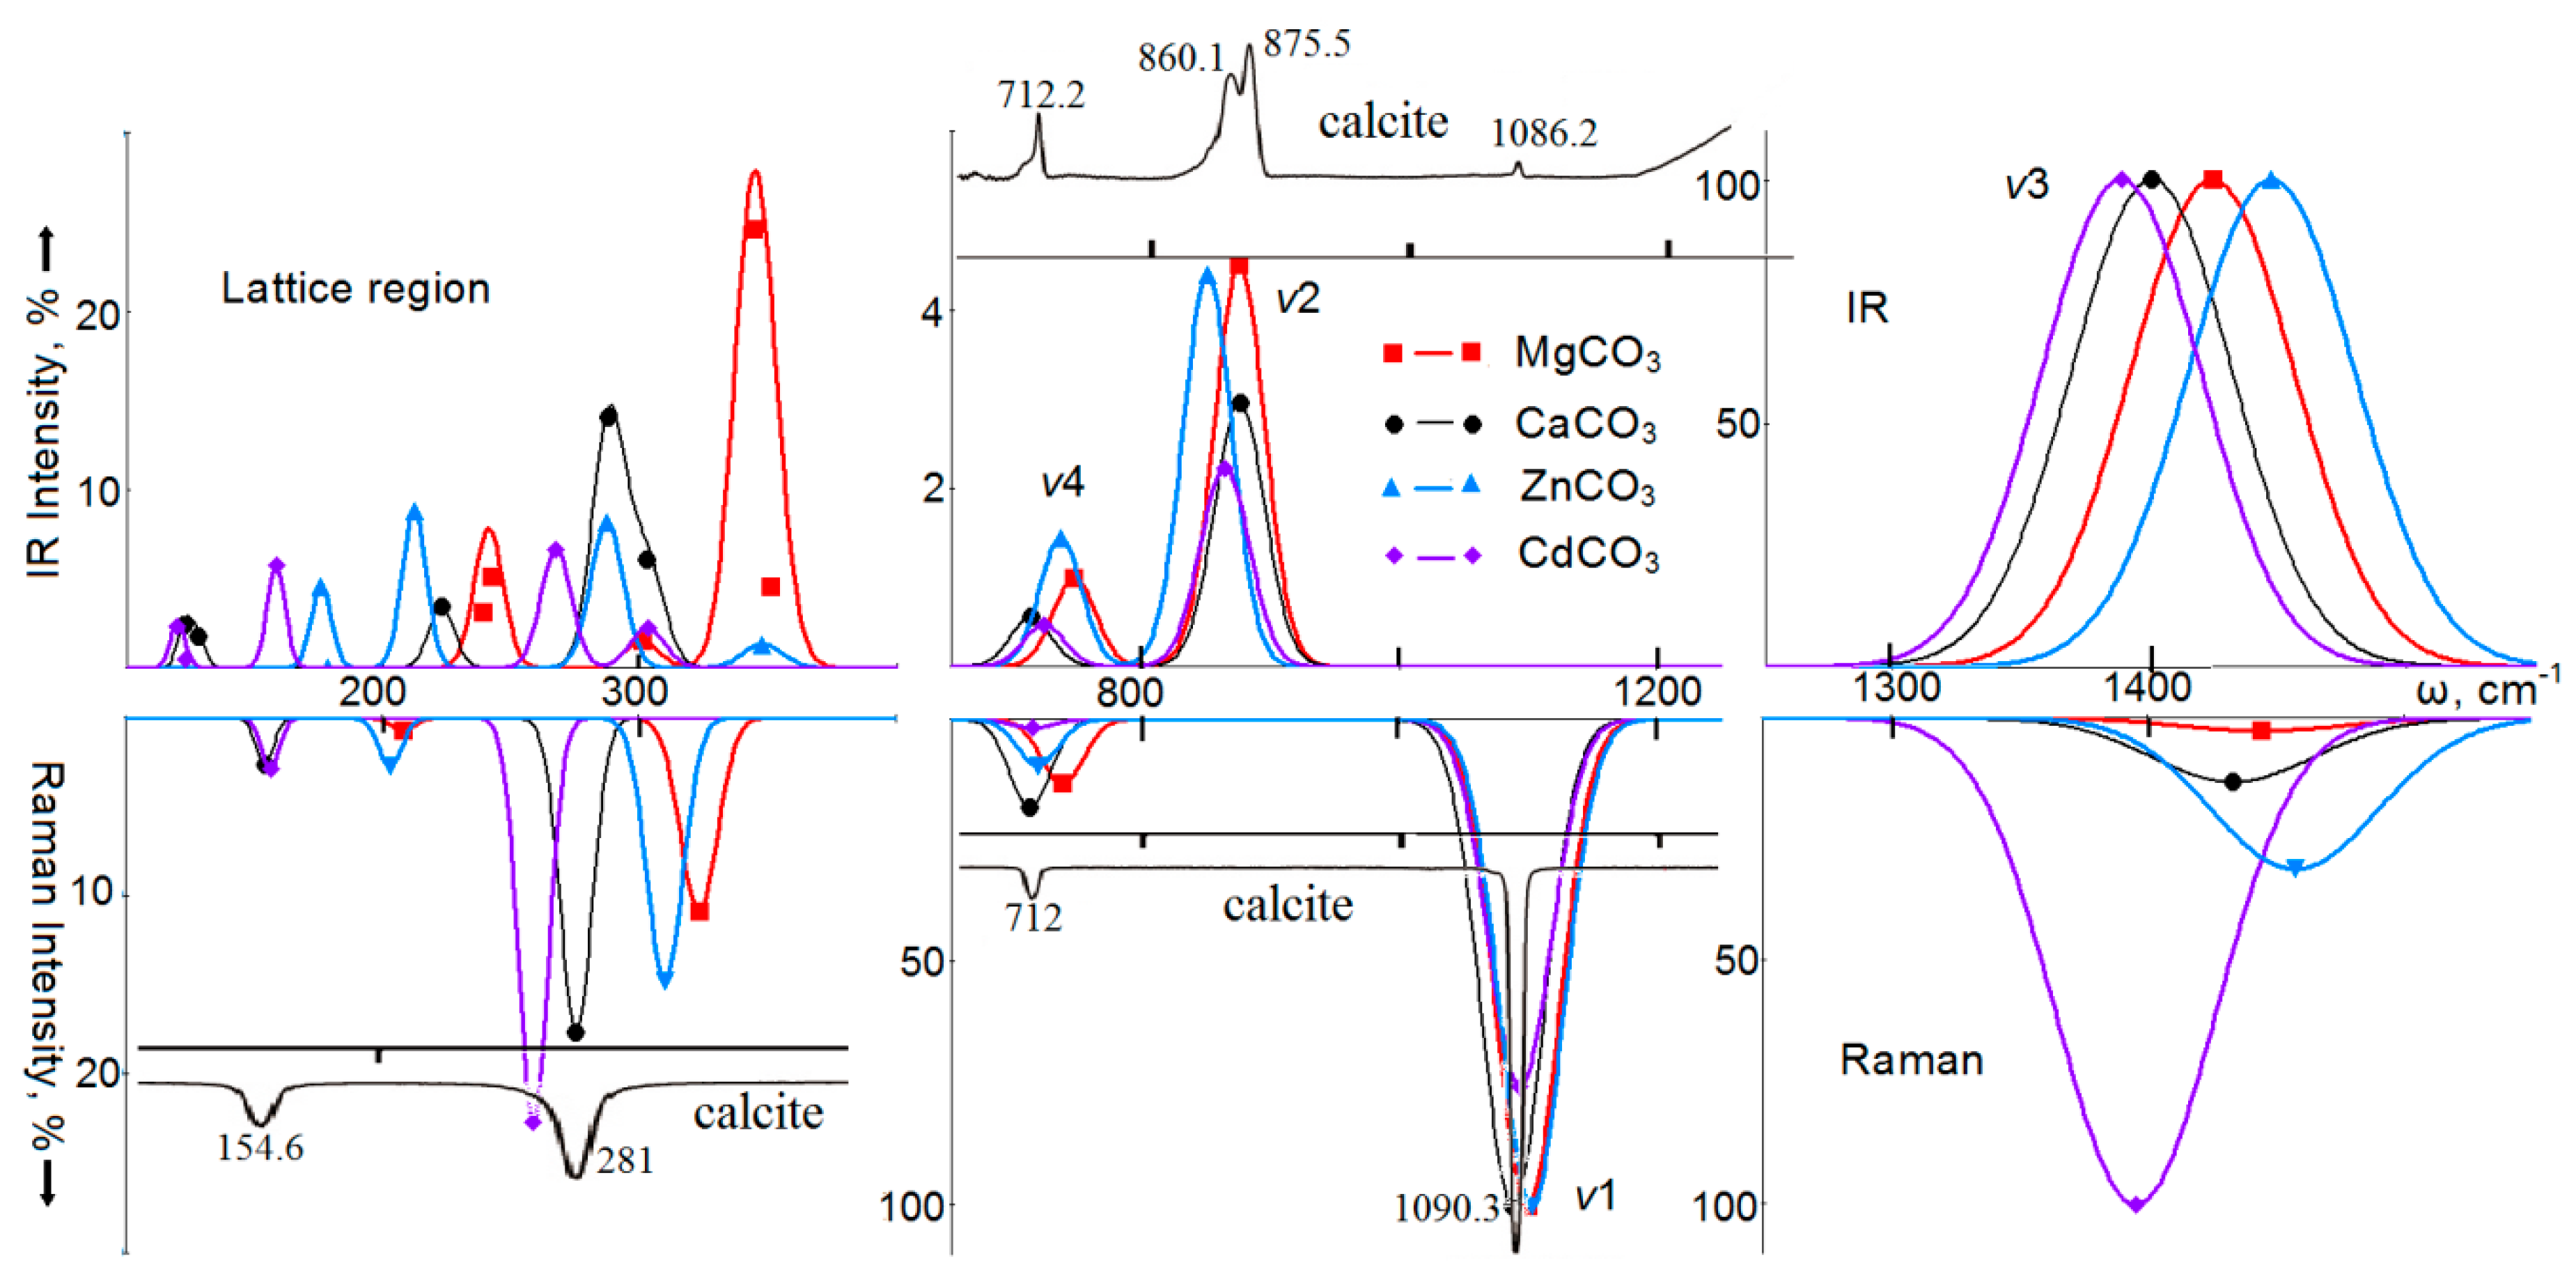
5. Optical Spectra of Crystals with a Calcite Structure

The infrared absorption spectra (IRS) and Raman scattering spectra (RS) of calcite-structured carbonates calculated in this work, obtained by Gaussian broadening of normal long-wavelength vibrations, are shown in Figure 2. The obtained wavenumbers of vibrations active in the IRS of calcites, together with the available experimental data, are given in Table S1; for the vibrations active in RS, they are given in Table S2 in the Supplementary materials. A good agreement was observed between the calculated vibration wavenumbers and the experimentally measured values. Thus, the average root-square deviations for eight IRS-active wavenumbers obtained by the B3LYP method for magnesite and determined experimentally in [92] and [58] do not exceed 4.0% and 3.3%, respectively. There is also a good agreement with the calculated data of the authors of [93] (4.7%) and [94] (3.5%). The root-mean-square deviations for the wavenumbers of five vibrations active in RS, obtained by the B3LYP method in this work, are 1.3% (1.0%) in the experiment in [95] for magnesite (calcite), 1.5% (1.4%) for the experiment in [58], 1.6% (1.1%) for the experiment in [61], and 1.6% (1.7%) for the experiment in [73]. For four studied carbonates with five vibrations active in RS, in a matrix of 20 values, the deviation of the B3LYP calculation results from the experimental values [64] is 2.4%.
In MgCO3, the most intense mode (5132 km/mol) in IRS corresponds to the internal vibration ν3 of Eu symmetry with the wavenumber of 1424 cm−1. Taking its intensity as 100%, for the ν2 vibration with a wavenumber of 874 cm−1, we obtained 4%, and for the ν4 (746 cm−1) mode, even less—0.9%. In calcite, the wavenumbers corresponding to the vibrations ν3, ν2, and ν4 are 1400, 875, and 712 cm−1, and their intensities are 5447 km/mol (100%), 3%, and 0.5%, which practically do not differ from magnesite. For ZnCO3 and CdCO3, the structures of the spectra in the high-frequency region remain similar to magnesite. Thus, for internal modes, there is a linear correlation between the change in the wavenumber and the radius of the cation RM. For ν4, it can be written in the form: ωEu(cm−1) = 812.9 − 98.7·RM (0.958), and with a smaller K coefficient for ν3: ωEu(cm−1) = 1546.9 − 154.8·RM (0.854). A good correlation (K = 0.96) for the calculated intensity is observed for the ν3 vibrations, where it increases with rise of atomic mass as: I(km/mol) = 4948 + 14 M, and, for the ν2 mode, it decreases with increasing radius: I(km/mol) = 478 − 326 RM.
For lattice vibrations of MgCO3, the most intense ones are the Eu symmetry modes with wavenumbers of 344 cm−1 (25%), 301 cm−1 (2%), and A2u symmetry modes at 351 cm−1 (4%), 242 cm−1 (5%). For CaCO3, the lattice modes are shifted to the low-wavenumber region, and their intensities decrease. In the region of lattice vibrations of ZnCO3, the most intense modes will be Eu symmetry with wavenumbers of 287 cm−1, 212 cm−1, and only then with A2u symmetry: 348 cm−1, 176 cm−1. In CdCO3, this trend continues. Thus, for translation modes of Eu symmetry, a dependence on the cation mass is observed: ω(cm−1) = 306.0 − 1.37·M (0.915). For the rest of the lattice modes, the best linear dependence was established for the cation radius: for rotational ones: ωEu(cm−1) = 466.5 − 353.1·RM (0.91), ωA2u(cm−1) = 463.2 − 348.5·RM (0.884, and for translational modes: ωA2u(cm−1) = 484.7 − 186.3·RM (0.991).
In RS, the intense line (taken as 100%) in Figure 2 is due to vibrations of the ν1 type, and falls on 1099 cm−1 in MgCO3, and 1087 cm−1 in calcite. This mode has a significant polarization dependence [89]: the xx and yy components are ten times larger than the zz component. Internal vibrations of ν4 type also have a noticeable intensity: for magnesite—with a wavenumber of 737 cm−1, for calcite—711 cm−1, and also for ν3 type: 1444 cm−1 and 1433 cm−1, respectively. In carbonates of relatively heavy metals zinc and cadmium, the positions of the maxima of the ν4 and ν1 bands are practically preserved (ωEg(cm−1) = 783.3 − 72.9·RM (0.906), ωA1g(cm−1) = 1138.0 − 49.2·RM (0.906)), whereas for the ν3 region the changes are significant. This is due to the fact that the intensity of this mode increases linearly with an increase in the atomic mass of the metal cation: Iν3(%) = −29.9 + 1.1·M (0.987). For CdCO3, the ν3 vibration becomes the most intense in RS and has pronounced xz and yz polarizations.
For lattice vibrations, the most intense vibration in the RS spectrum has the Eg symmetry, and its wavenumbers in MgCO3 are 323 cm−1 (intensity 11%), ZnCO3 310 cm−1 (15%), CdCO3 258 cm−1 (23%), and CaCO3 275 cm−1 (18%). Thus, for the lattice translational vibration, there is a linear dependence of the form ω(cm−1) = 361.0 − 210.6·RM (0.992), and for rotational, ω(cm−1) = 449.0 − 185.5·RM (0.912). Since there is a good linear relationship between RM–O and the radius of the RM cation, the above formulas can easily be rewritten for distances as well. The above formulas allow predicting the wavenumber values for other carbonates; thus, for the lattice modes Eg(T), Eg(L), internal ν4 and ν1, the wavenumbers predicted by the formulas for MnCO3 are 186, 296, 723, and 1097 cm−1, and for CoCO3, they are 204, 311, 729, and 1101 cm−1. The experimental values for rhodochrosite are 184, 290, 719, and 1086 cm−1 [62]; for spherocobaltite, they are 194, 302, 725, and 1090 cm−1 [34].

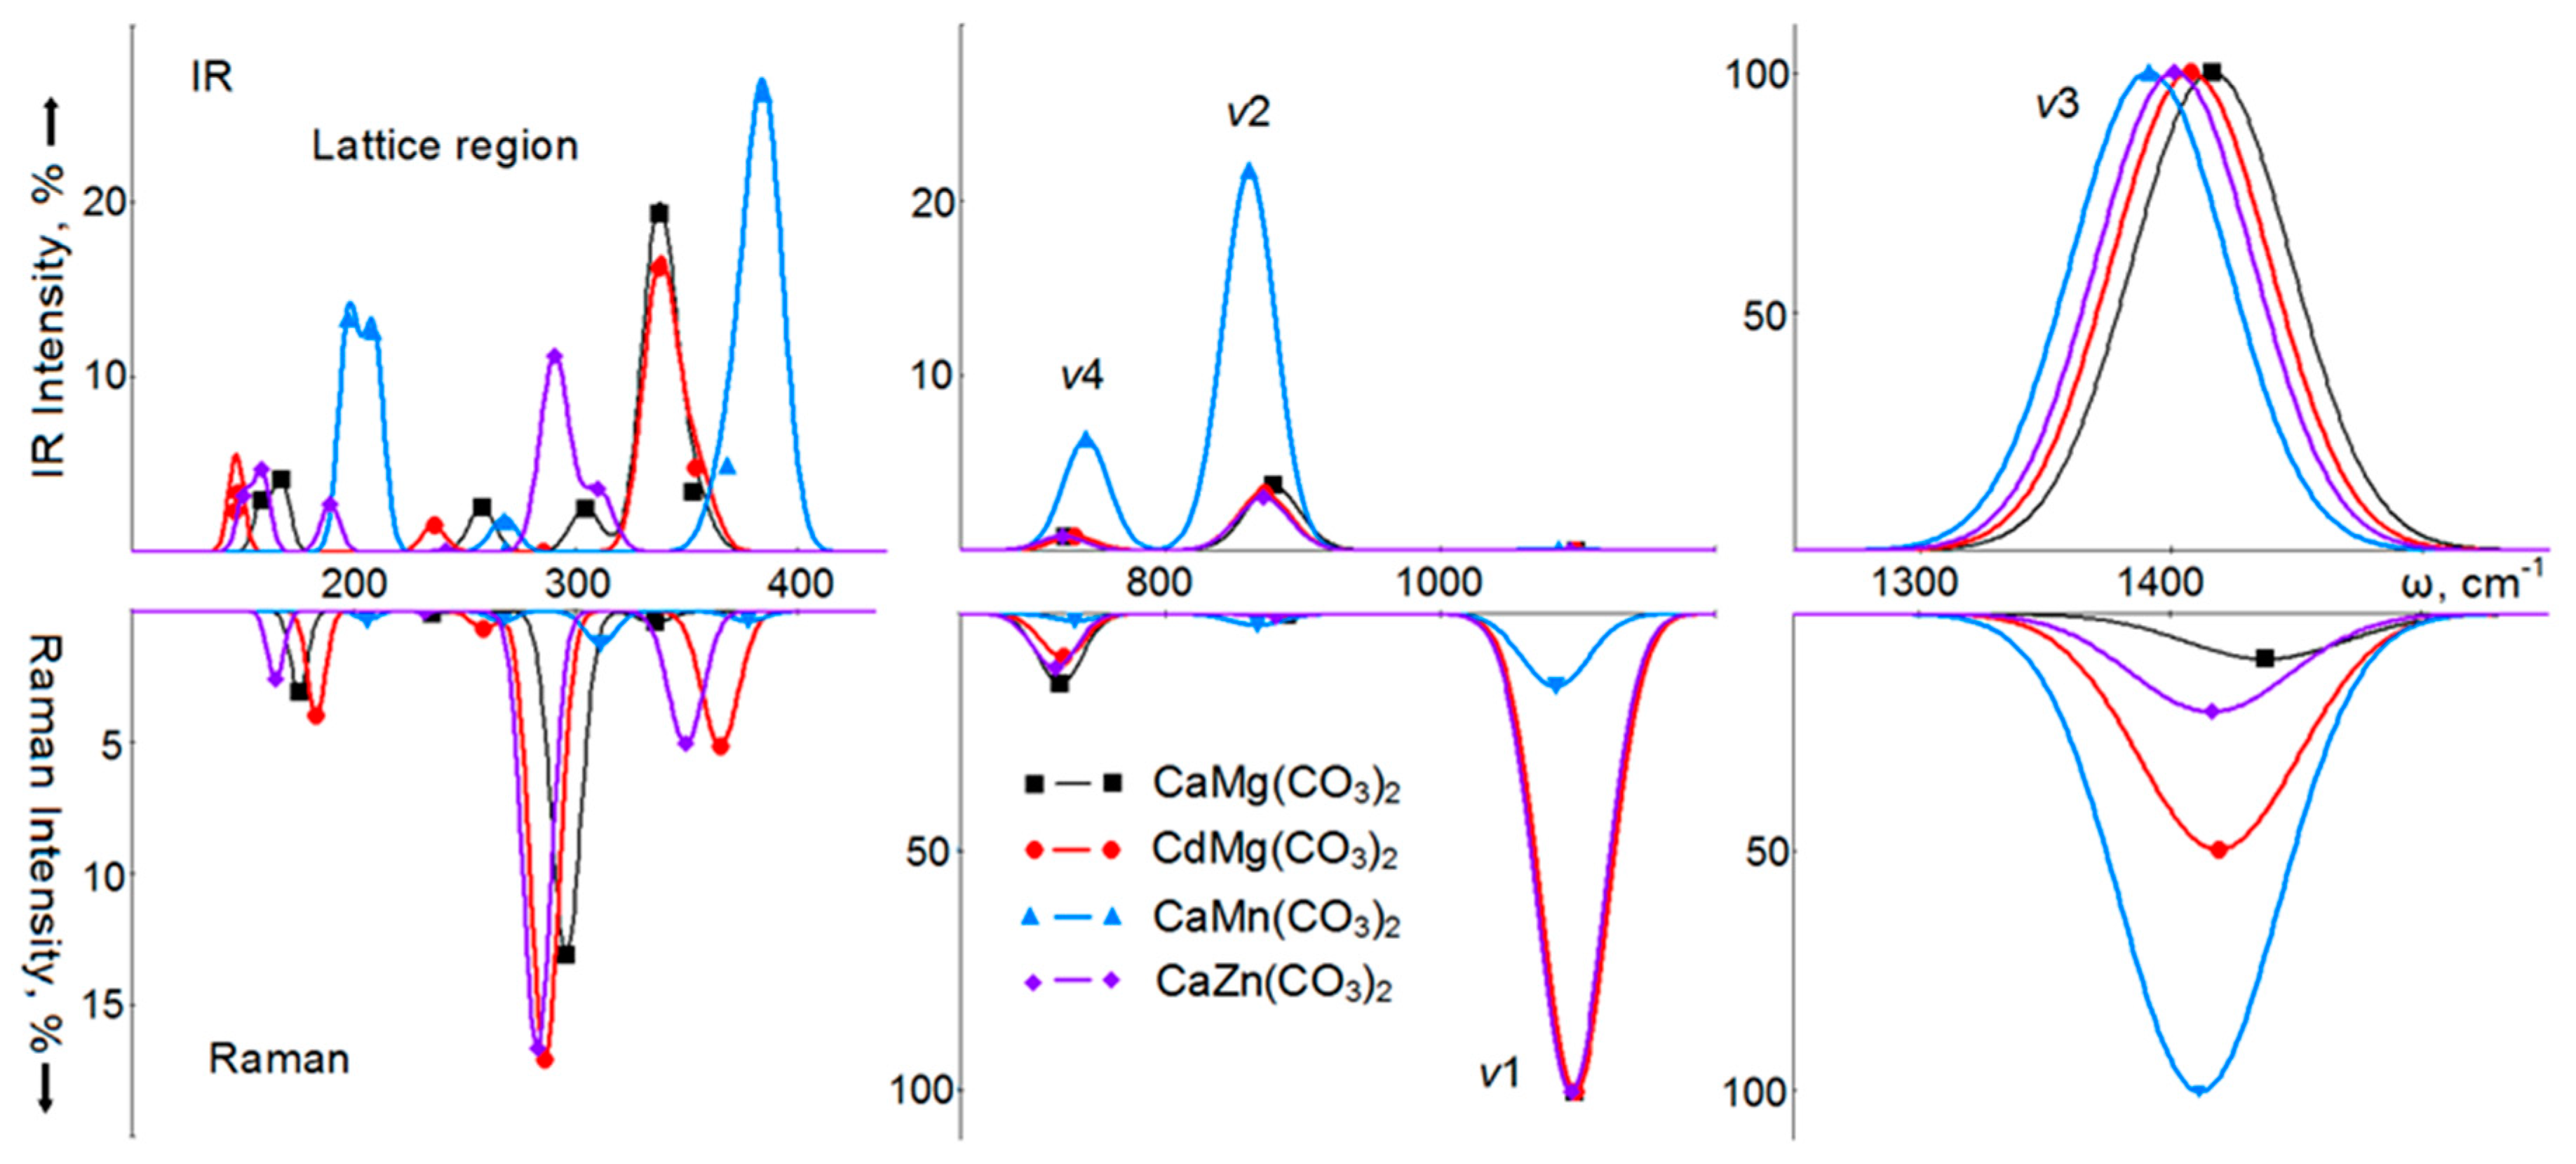
6. Vibrational Spectra of Crystals with a Dolomite Structure

The IRS and RS of carbonates with the dolomite structure are given in Figure 3, and Tables S3 and S4 of the accompanying materials show the wavenumbers of normal long-wave vibrations of crystals with the dolomite and norsethite structures, calculated by the B3LYP method and measured experimentally. The examination of these tables shows that there is a satisfactory agreement between the wavenumbers of lattice [69] and internal [61] vibrations of natural dolomite calculated and measured in IRS. The root-mean-square deviation is 8.7 and 1.0%, respectively. For the wavenumbers of vibrations active in RS, the root-mean-square deviation of the results of this calculation from the experimental values is 1.4%. In crystals with a dolomite structure, the picture of theoretical spectra does not differ significantly from the calcite spectra. In IRS CaMg(CO3)2, the most intense mode (5318 km/mol, 100%) is the ν3 mode at 1416 cm−1. The internal vibration ν2 with a wavenumber of 877 cm−1 has an intensity of 3.5%, and for vibration ν4 at 727 cm−1, the intensity is close to 1%. Unlike calcite, the vibration ν1 of the Au symmetry is allowed by symmetry; however, its intensity is practically zero. The most intense (19%) in the region of lattice vibrations is the Eu symmetry mode with a wavenumber of 337 cm−1. Modes of the same symmetry, but with a much lower intensity, appear at 257 (2.5%) and 167 cm−1 (4%).
In CdMg(CO3)2, the most intense (5788 km/mol, 100%) vibration will be ν3 with a wavenumber of 1407 cm−1, and for lattice vibration with a wavenumber of 338 cm−1, the intensity is 16%. A similar picture is observed in CaZn(CO3)2, where the intensity of the ν3 vibration is 5928 km/mol (100%), and the intensities of two lattice vibrations with wavenumbers of 290 and 310 cm−1 are 11% and 3.5%, respectively. The situation is different in CaMn(CO3)2, where the intensity of the ν3 mode is much lower—1121 km/mol (100%), and against its background, the relative intensities of other ν2 and ν4 vibrations increased to 22 and 6%, respectively.
The RS of dolomite will be dominated by a fully ν1 symmetric vibration with a wavenumber of 1097 cm−1. Its full intensity is taken as 100%. Then, the intensities of the ν4, ν2, and ν3 modes will be 15%, 0.2% and 9%, respectively. In the region of lattice vibrations, the most intense are the Eg symmetry modes with wavenumbers of 296 cm−1 (13%) and 175 cm−1 (3%). In CdMg(CO3)2, the ν1 mode does not change in wavenumber and remains most intense. The wavenumber of the ν3 mode decreases, but its intensity sharply increases to 49%. In CaMn(CO3)2, the intensity of the ν3 mode becomes maximum (taken as 100%), while for the ν1 vibration it is only 15%. Thus, as for IRS, the binary carbonate CaMn(CO3)2 differs from other crystalline dolomites in the parameters of its vibrational spectra.
In IRS of the BaMg(CO3)2 crystal (Figure 4) in the region of intramolecular vibrations, the most intense (5194 km/mol) vibration will be ν3 with a wavenumber of 1439 cm−1. Against this background, the ν2 vibration with a wavenumber of 878 cm−1 and the intensity of 3% is almost imperceptible, moreover, the ν4 vibrations (694 cm−1, 0.5%) and ν1 allowed here (1125 cm−1, 0.2%) practically do not appear. In the region of lattice vibrations, vibrations of Eu symmetry with wavenumbers of 315, 200, and 106 cm−1 stand out in intensity, while less intense vibrations of A2u symmetry have wavenumbers of 347 and 115 cm−1. The first of these less intense vibrations corresponds to the displacements of magnesium atoms in antiphase with the anions, and the second corresponds to the displacements of barium atoms. Magnesium atoms are also involved in the formation of this mode, and they shift synchronously with the anion. In RS of BaMg(CO3)2, vibrations of anion atoms will also dominate: ν1 with a wavenumber of 1126 cm−1 (its intensity is taken as 100%), ν2 of the same symmetry and intensity of 3%, as well as doubly degenerated ν4 (697 cm−1) and ν3 (1444 cm−1) with intensities of 21% and 3%, respectively. For lattice vibrations, the A1g symmetry mode with a wavenumber of 284 cm−1 and Eg symmetry modes with wavenumbers of 108 and 254 cm−1 will be noticeable, of which the first is rotational, and the second is translational vibration.
Let us establish ordinary dependences for the entire class of trigonal crystals. For the lowest- wavenumber lattice translational vibration in IRS ωEu(cm−1) = 379.0 − 244.3·RM (0.794); for RS, ωEg(cm−1) = 367.3 − 216.2·RM (0.896), and ωEg(cm−1) = 413.1 − 39.6·RM (0.813). Using the first formula, we obtain for ankerite (CaFe(CO3)2) 164 cm−1 (in experiment, 166 cm−1 [72]), kutnogorite Ca0.78Mn1.13(CO3)2 159 cm1 (153 cm1). For lattice vibrations active in RS, the formulas give estimated values for rhodochrosite (MnCO3) 188, 297 cm1. The experimental values are 185 and 290 cm1 [73].

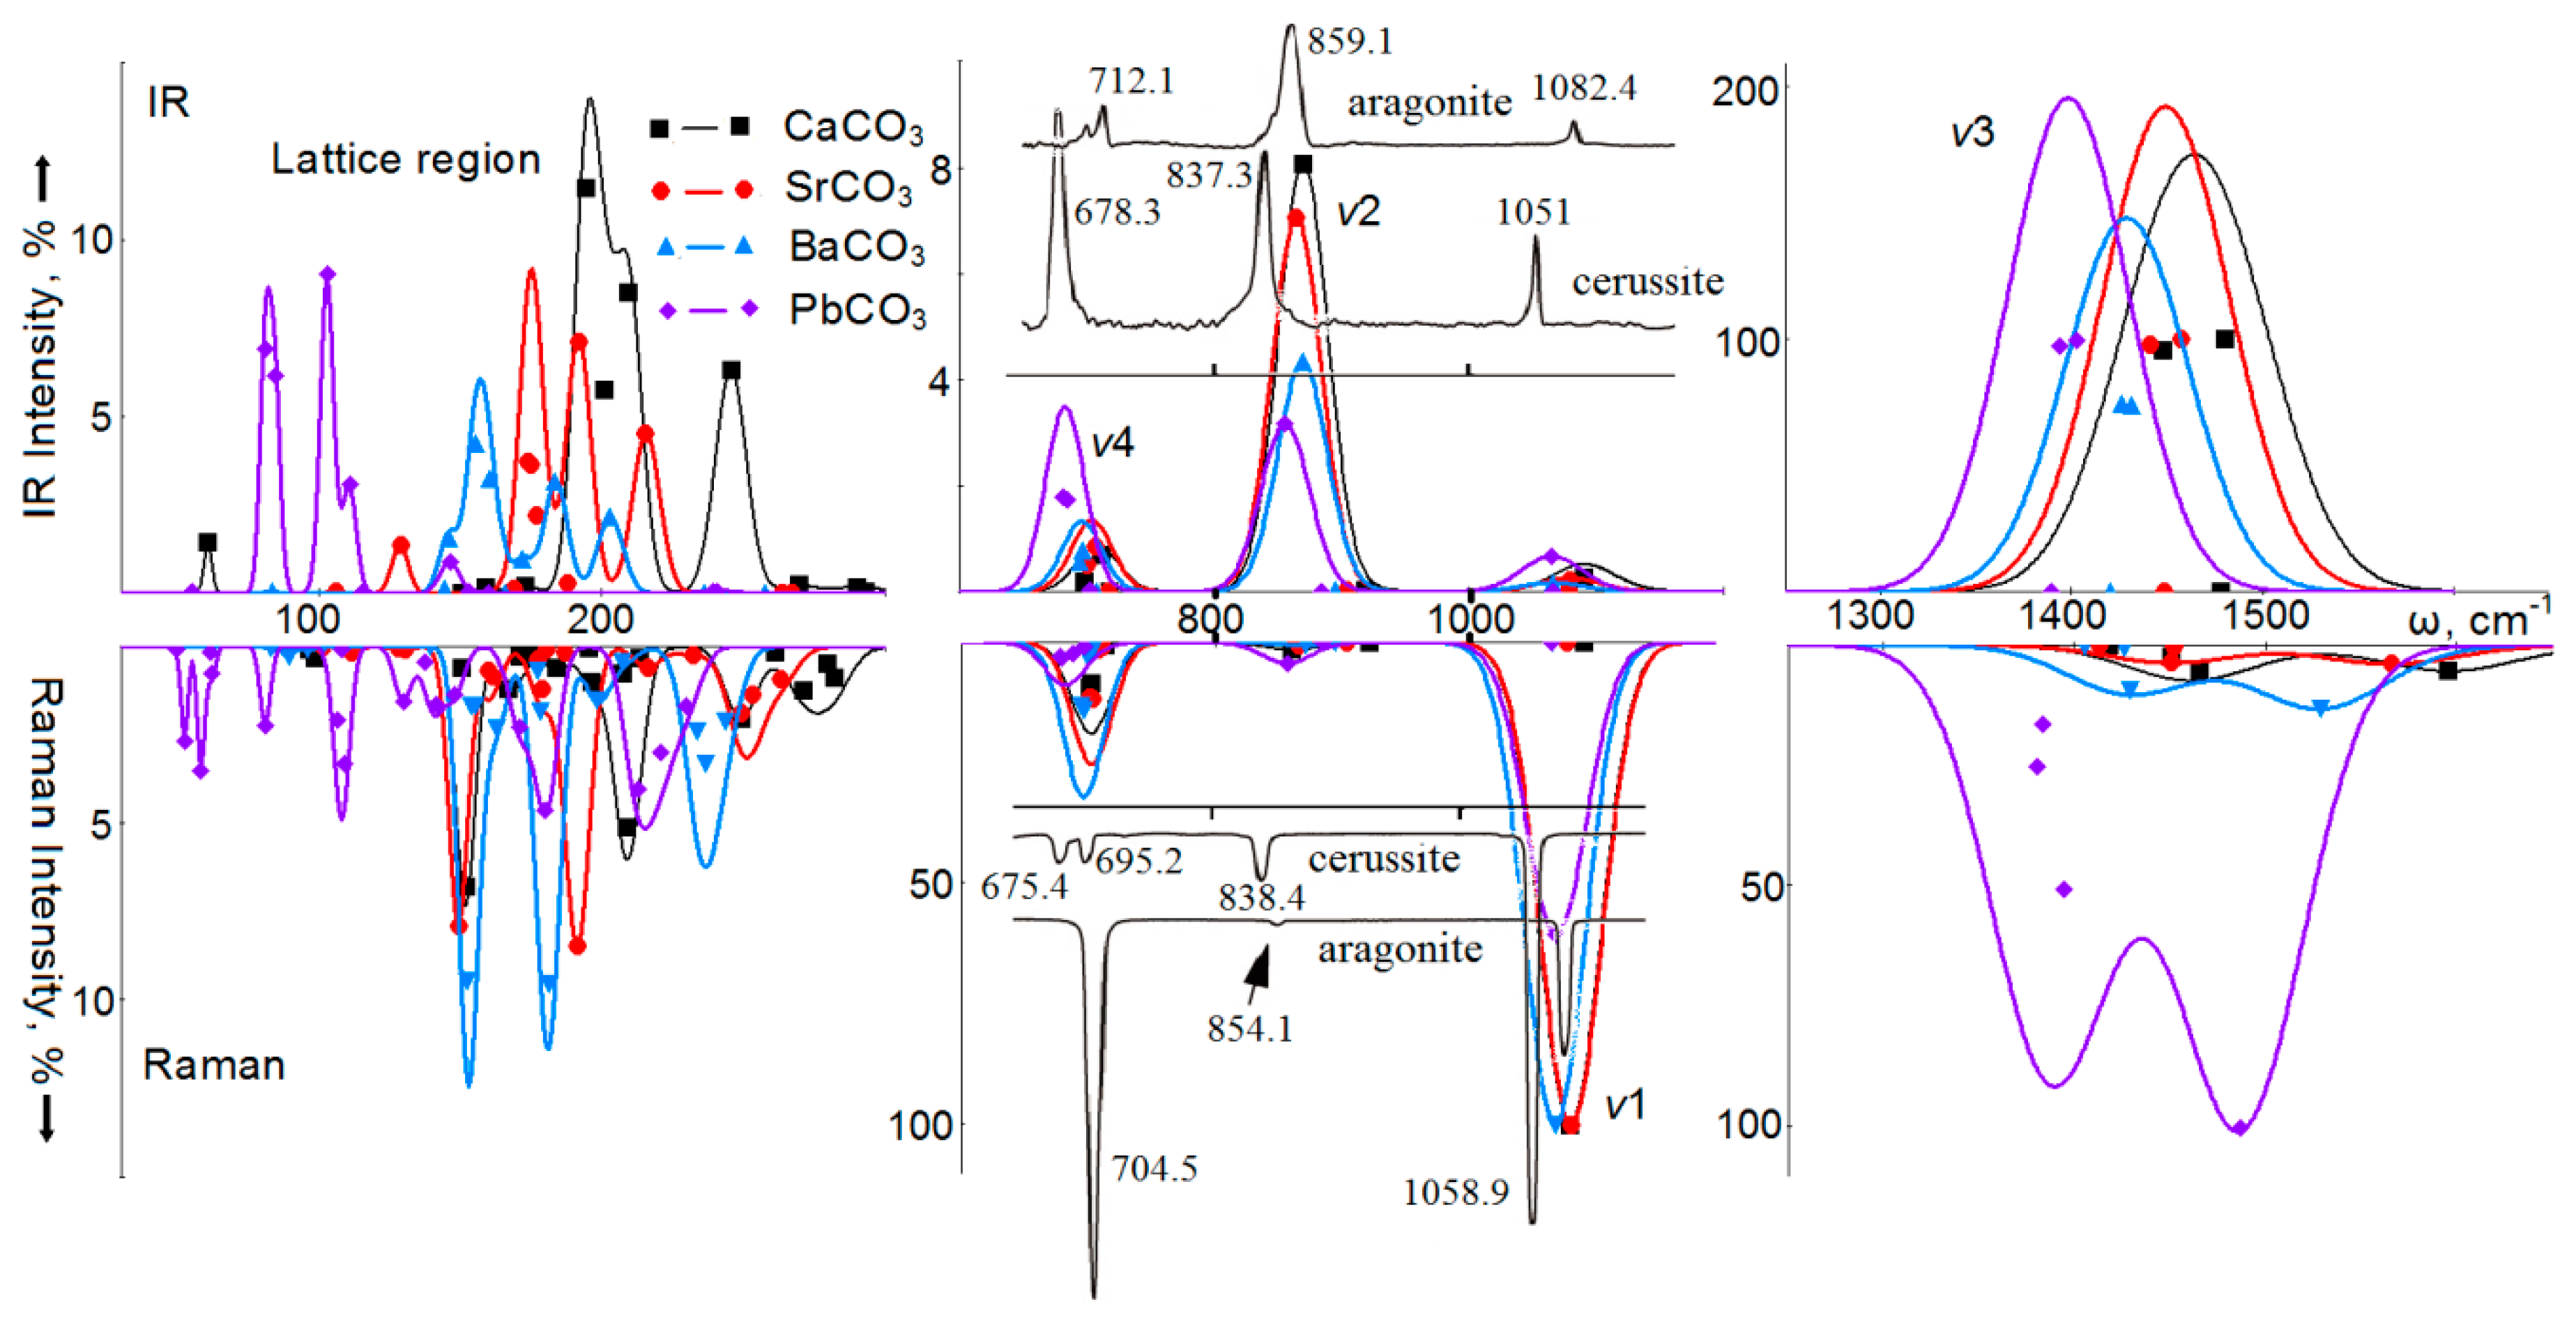
7. Vibrational Spectra of Crystals with Aragonite Structure

The calculated spectra of infrared absorption and Raman light scattering of calcium, strontium, lead, and barium carbonates with aragonite structure are shown in Figure 5. The wavenumbers of normal long-wave vibrations of crystals with the aragonite structure calculated by the B3LYP method, together with the available experimental and theoretical data, are summarized in Tables S5–S8 of the Supplementary Materials. The comparison of wavenumbers calculated by the B3LYP method with the experimental values shows that the root-mean-square deviation for four ν1–ν4 wavenumbers in four carbonates is, according to [68], 1.5% for IRS; 0.8% for RS; for IRS [55]—2.0%, and for RS [57]—0.9%.
In the IRS of aragonite, the most intense vibrations are of the ν3 type with the B2u, B3u symmetry, wavenumbers of 1448 and 1480 cm−1 and intensities of 4523 and 4727 km/mol. In Figure 4, they correspond to a broad intense band with the maximum at 1462 cm−1 (1461 cm−1 in [68]). For convenience of comparison, the intensity of vibration of B3u symmetry is taken as 100%. In SrCO3, the maximum intensity of the B3u mode at 4757 km/mol is taken as 100%, in BaCO3, the B2u symmetry modes at 4953 km/mol, and in PbCO3: 6241 km/mol. Thus, the intensity ν3 increases with the atomic mass of the metal, and the position of the maximum in the series changes according to the law: ω(cm−1) = 1480.2 − 0.365·M (cm−1) with a correlation coefficient of 0.991.
Unlike calcite, in the infrared spectra of aragonite, the vibration of the ν1 type will be active due to the modes of symmetry B3u, B1u. In the spectrum shown in Figure 4, they correspond to a weak (0.2%) band with a maximum at 1090 cm−1, the wavenumber of which shifts towards lower values with increasing atomic mass: ω(cm−1) = 1090.6 − 0.127·M. The intensity of vibrations of the ν2 type of B1u symmetry is much higher than that of ν1 vibrations, it decreases with an increase in the atomic mass of the metal, and its wavenumber practically does not change: ω(cm−1) = 893.3 − 0.065·M. In the experimental spectra, this dependence has the form: ω(cm−1) = 866.2 − 0.123·M. Vibrations of the ν4 type in CaCO3 and SrCO3 correspond to the modes of symmetries B3u, B2u with distances between wavenumbers of 13 and 6 cm−1. In BaCO3 and PbCO3, the distances between wavenumbers decrease to 2 and 3 cm−1. This behavior of vibrational modes of the ν4 type is consistent with experimental data [68], where it was found that two peaks are observed in aragonite (CaCO3) and strontianite (SrCO3), and only one for cerussite (PbCO3) and witherite (BaCO3). There is a good ordinary dependence of the peak position on the atomic mass of the metal: in the experiment it is ω(cm−1) = 707.5 − 0.128·M, and in the calculation: ω(cm−1) = 715.4 − 0.119·M, with the correlation coefficients 0.944 and 0.977, respectively.
In the Raman spectrum of aragonite (CaCO3), ν1 vibration of Ag symmetry with a wavenumber of 1078 cm−1 is the most intense (taken as 100%). Vibrations ν4 of the Ag and B1g symmetries with intensities of 9% each are also noticeable, which form the maximum in the spectrum shown in Figure 5 at 702 cm−1. In BaCO3, the ν1 vibration maximum shifts to 696 cm−1, and its intensity increases. In addition, the width of this peak increases. Oscillations of the ν3 type in CaCO3 have B3g (1465 cm−1) and B2g (1595 cm−1) symmetries, and an intensity of 5%. In SrCO3, these are vibrations at wavenumbers of 1450 and 1565 cm−1 with intensities of 4%. In BaCO3, they shift to lower values of 1429 and 1528 cm−1, and the intensities increase to 9 and 13%. Oscillations of the B2g symmetry correspond to the displacements of atoms to the C–O bonds along the b axis, whereas B3g—along the a axis, perpendicular to the layers of anions and cations.
The Raman spectrum of PbCO3 differs from the spectra of other carbonates with the aragonite structure. Here, the most intense (taken as 100%) is the vibration of the ν3 type of B2g symmetry with a wavenumber of 1486 cm−1 [68]. Three other vibrations of this type have B3g, Ag, B1g symmetries, similar wavenumbers of 1394, 1383 and 1380 cm−1 and intensities of 50%, 16%, and 25%, respectively. They form a second maximum in RS at 1388 cm−1. The ν1-type vibration with a wavenumber of 1067 cm−1 has an intensity of 61%. Modes of the same Ag symmetry are also dominant in the formation of the ν2 band, the position of which in aragonites obeys the law: ω(cm−1) = 895.6 − 0.117·M with a high correlation coefficient of 0.977.
In the IRS of aragonite, in the region of lattice vibrations, there is a maximum at 245 cm−1, formed by the B3u symmetry mode with an intensity of 13%, and the main maximum with an intensity of 23% at 194 cm−1 (B2u symmetry). For SrCO3, four peaks are observed at 129, 175, 192 and 215 cm−1 with intensities of 3, 18, 15 and 9%, while in BaCO3 the intense band is at 157 cm−1 (B1u and B3u) with a low-wavenumber band at 146 cm−1, and high-wavenumber at 171 cm−1 shoulders. In PbCO3, the main features of the spectrum are shifted to the low-wavenumber region. There are two main peaks at 82 cm1 with an intensity of 17%, and a peak at 103 cm1 and an intensity of 18%. This structure of the IRS in the lattice region is consistent with the results of measurements [72], where it was found that the broad band at 263 cm1 in the structure of aragonite shifts to longer wavelengths with an increase in the atomic number of the metal: up to 227 cm1 in strontianite, then up to 205 cm1 in witherite, and, finally, up to 136 cm1 in cerussite.
For lattice vibrations of aragonite in RS, there will be three main bands with maxima at 152 cm−1, 209 cm−1 and 250, 276 cm−1. There is a good agreement between the calculated and experimental data [68]. In SrCO3, there are two intense bands with maxima at 150 and 191 cm−1, formed by the modes of symmetries B3g, B2g, and a weak band at 252 cm−1. In the BaCO3 spectrum, the maximum of the first band is at 153 cm−1, the second at 181 cm−1 with a shoulder at 198 cm−1, and the third at 237 cm−1. The second maximum is formed by modes with B2g symmetry with pronounced yz polarization. The spectrum of PbCO3 contains a large number of bands of low intensity, not exceeding 6%.
In [68], it was found that RS and IRS confirm the general trend that each of the internal modes is shifted to lower wavenumbers in the following order: aragonite → strontianite → witherite → cerussite. The coefficients of linear interpolation of the wavenumbers of intramolecular (ν4, ν1, ν3) vibrations active in RS for carbonates with the aragonite structure, obtained from experimental data [68] and theoretical calculations using the B3LYP method are summarized in Table 2. In the calculations, each type of vibration was determined as the average of the individual modes, which are shown in Table S9. For lattice vibrations, similar linear dependences are also obtained, as recorded in Table S10.
As a check of the obtained formulas, we will use the available data [49], where the Raman spectra of (CaCO3) X1 (SrCO3) X2 (BaCO3) X3 solid solutions were measured. Thus, in the spectrum of the composition 0.34:0.33:0.33, wavenumbers of 1452, 1086, 711, 273, 192, 155 cm−1 were observed. Calculation according to the formulas of Tables S8 and S9 gives: 1466, 1077, 703, 262, 183, and 158 cm−1, that is, the root mean square deviation of the calculated and experimentally determined wavenumbers is about 2.7%.

8. Conclusions

In this work, the Hartree–Fock theory and the electron density functional in the form of a hybrid B3LYP functional in the basis of a linear combination of atomic orbitals by means of the CRYSTAL17 program code are used to calculate the structure and normal long-wavelength vibrations of MgCO3, CaCO3, ZnCO3, CdCO3 in the structure of calcite, CaMg(CO3)2, CdMg(CO3)2, CaMn(CO3)2, CaZn(CO3)2—in the structure of dolomite, BaMg(CO3)2—in the structure of the norsethite type, CaCO3, SrCO3, BaCO3, PbCO3—in the structure of aragonite. The analysis of the calculated results and their comparison with the available experimental data shows that the wavenumbers and intensities of individual vibrational modes obey the ordinary laws. For the calcite family, the intramolecular modes of the ν2 and ν3 types that are active in IRS correlate with the cation radius ω(cm−1) = 812.9 − 98.7·RM, and ω(cm−1) = 1546.9 − 154.8·RM with correlation coefficients of 0.958 and 0.854. Vibration of the ν4 type is active in RS, where the dependence of its wavenumber on the radius of the metal cation has the form ω(cm−1) = 783.3 − 72.9·RM, and for the most intense ν1: ω(cm−1) = 1138.0 −42.9·RM, with coefficients of correlation 0.906. For the entire class of trigonal crystals (calcite, dolomite, norsethite), the dependence of low- wavenumber lattice vibrations has the form for Eu symmetry: Eu: ω(cm−1) =379.0 − 243.3·RM, and Eg: ω(cm−1) = 367.3 − 216.2·RM, ω(cm−1) = 413.1 − 139.6·RM. For carbonates with aragonite structure for the calculated wavenumbers ν4, ν2, ν1, ν3, linear dependences with high correlation coefficients are obtained for the atomic mass: ω(cm−1) = 714.3 − 0.128·M; ω(cm−1) = 895.6 − 0.117·M; ω(cm−1) = 1087.1 − 0.116·M; ω(cm−1) = 1619.0 − 0.638·M, and for IRS: ω(cm−1) = 715.4 −−0.119·M’; ω(cm−1) = 893.3 − 0.065·M; ω(cm−1) = 1090.6 − 0.127·M; ω(cm−1) = 1480.2 − 0.365·M. For trigonal and orthorhombic carbonates, linear dependences of metal substitution were established for the radius of the RM cation (the distance between the metal and oxygen RM–O) only for the infrared in-plane bending mode ν4: ω(cm−1) = 786.2 − 65.88·RM (ω(cm−1) = 881.0 − 67.13·RM–O), and Raman in-plane asymmetric stretching mode ν4: ω(cm−1) = 768.5 − 53.24·RM (ω(cm−1) = 844.2 − 53.83·RM–O), with a correlation coefficient of 0.87 (0.91). For the rest of the modes, it was not possible to obtain linear dependences with high correlation coefficients.
Thus, ab initio predictions, with a relatively low computational capacity, can reproduce the full vibrational spectra of crystalline compounds of material science interest, and, on the basis of ordinary spectral dependences, predict their features for solid crystalline solutions. The obtained quantitative dependences of the characteristics of vibrational modes can be used in non-contact non-destructive diagnostics of carbonates by optical methods.

Supplementary Materials

The following are available online at https://www.mdpi.com/2079-4991/10/11/2275/s1, Table S1: Wavenumbers (cm−1) of lattice, translational (T), rotational (L) and internal mode vibrations active in IR spectra (IR), obtained in this work by the B3LYP method, measured experimentally (Exp.) and calculated (Theor.) for carbonates with calcite structure, Table S2: Wavenumbers (cm−1) of lattice, translational (T), rotational (L), and internal modes vibrations active in the Raman spectra, obtained in this work by the B3LYP method, measured experimentally [Exp] and calculated [Theor] in the works of other authors for carbonates with calcite structure, Table S3: Wavenumbers (cm−1) of lattice and internal modes vibrations active in the IR spectra, obtained in this work by the B3LYP method, measured experimentally [Exp.] and calculated [Theor.] in the works of other authors for carbonates with dolomite and norsethite structure, Table S4: Wavenumbers (cm−1) of lattice and internal modes vibrations active in Raman spectra, obtained in this work by the B3LYP method, measured experimentally [Exp.] and calculated [Theor.] in the works of other authors for carbonates with dolomite and norsethite structure, Table S5: Wavenumbers (cm−1) of internal modes v1, v2, v3, v4 vibrations active in infrared spectra (IRS) calculated by the B3LYP method, measured experimentally [Exp.] and calculated [Theor.] in the works of other authors for crystals with aragonite structure, Table S6: Wavenumbers (cm−1) of internal modes v1, v2, v3, v4 vibrations active in the Raman spectra, calculated by the B3LYP method, measured experimentally [Exp.] and calculated [Theor.] in the works of other authors for crystals with aragonite structure, Table S7: Wavenumbers (cm−1) of lattice vibrations, active in infrared (IR) spectra, calculated by the B3LYP method, measured experimentally [Exp.] and calculated [Theor.] in the works of other authors for crystals with aragonite structure, Table S8: Wavanumbers (cm−1) of lattice vibrations active in the Raman spectra, calculated by the B3LYP method, experimentally measured [Exp.] and calculated [Theor.] in the works of other authors for crystals with aragonite structure, Table S9: Values of the coefficients ω0 (сm−1), ω1(сm−1/a.m.u.) of linear interpolation of frequencies ω = ω0 + ω1·М (сm−1) by the atomic mass of the metal M intramolecular (ν4, ν2, ν1, ν3) modes, active in the Raman and infrared spectra absorption (IR) of carbonates with aragonite structure, obtained from theoretical calculations by the B3LYP method. The correlation coefficient K is shown in parentheses. Table S10: Values of the coefficients ω0 (сm−1), ω1(сm−1/a.m.u.) of linear interpolation of wavenumbers ω = ω0 + ω1·М (сm−1) by the atomic mass of the metal M of lattice vibrations active in the Raman spectra of carbonates with aragonite structure obtained from theoretical calculations by the B3LYP method. The correlation coefficient K is shown in parentheses.

Author Contributions

Y.N.Z.: Conceptualization, data curation, paper writing; V.V.A.: Conceptualization, paper writing. Both authors have read and agreed to the published version of the manuscript.

Funding

This work was supported by the Russian Science Foundation (project 19-42-02003, in the part of conceptualization), Ministry of Science and Higher Education of Russia (project 075-15-2020-797 (13.1902.21.0024)) and Kemerovo State University.

Conflicts of Interest

The authors declare no conflict of interest.

References

  1. Liu, Y.; Shen, Y.; Zhao, S.; Luo, J. Structure-property relationship in nonlinear optical materials with p-conjugated CO3 triangles. Coord. Chem. Rev. 2020, 407, 213152. [Google Scholar] [CrossRef]
  2. Hazen, R.M.; Downs, R.T.; Jones, A.P.; Kah, L. Carbon Mineralogy and Crystal Chemistry. Rev. Mineral. Geochem. 2013, 75, 7–46. [Google Scholar] [CrossRef]
  3. Miller, K.G.; Kominz, M.A.; Browning, J.V.; Wright, J.D.; Mountain, G.S.; Katz, M.E.; Sugarman, P.J.; Cramer, B.S.; Christie-Blick, N.; Pekar, S.F. The Phanerozoic Record of Global Sea-Level Change. Science 2005, 310, 1293–1298. [Google Scholar] [CrossRef] [Green Version]
  4. Dupraz, C.; Reid, R.P.; Braissant, O.; Decho, A.W.; Norman, R.S.; Visscher, P.T. Processes of carbonate precipitation in modern microbial mats. Earth-Sci. Rev. 2009, 96, 141–162. [Google Scholar] [CrossRef]
  5. Litasov, K.D.; Goncharov, A.F.; Hemley, R.J. Crossover from melting to dissociation of CO2 under pressure: Implications for the lower mantle. Earth Planet. Sci. Lett. 2011, 309, 318–323. [Google Scholar] [CrossRef]
  6. Litasov, K.D.; Shatskiy, A.; Ohtani, E.; Yaxley, G.M. Solidus of alkaline carbonatite in the deep mantie. Geology 2013, 41, 79–82. [Google Scholar] [CrossRef]
  7. Montañez, I.P.; McElwain, J.C.; Poulsen, C.J.; White, J.D.; DiMichele, W.A.; Wilson, J.P.; Griggs, G.; Hren, M.T. Climate, pCO2 and terrestrial carbon cycle linkages during late Palaeozoic glacial–interglacial cycles. Nat. Geosci. 2016, 9, 824–828. [Google Scholar] [CrossRef]
  8. Sieber, M.J.; Wilke, F.; Koch-Müller, M. Partition coefficients of trace elements between carbonates and melt and suprasolidus phase relation of Ca-Mg-carbonates at 6 GPa. Am. Mineral. 2020, 105, 922–931. [Google Scholar] [CrossRef]
  9. Xie, M.; Yang, L.; Ji, Y.; Wang, Z.; Ren, X.; Liu, Z.; Asiri, A.M.; Xiong, X.; Sun, X. An amorphous Co-carbonate-hydroxide nanowire array for efficient and durable oxygen evolution reaction in carbonate electrolytes. Nanoscale 2017, 9, 16612–16615. [Google Scholar] [CrossRef]
  10. Sobhani-Nasab, A.; Pourmohamadian, H.; Rahimi-Nasrabadi, M.; Sheikhzadeh, G.A.; Tabrizi, H.B. Evaluation of the thermal properties of SrCO3-microencapsulated palmitic acid composites as thermal energy storage materials. J. Therm. Anal. Calorim. 2020, 140, 2123–2130. [Google Scholar] [CrossRef]
  11. De Beauvoir, T.H.; Sangregorio, A.; Cornu, I.; Josse, M. Synthesis, sintering by Cool-SPS and characterization of A2Cu(CO3)2 (A = K, Na): Evidence for multiferroic and magnetoelectric cupricarbonates. Dalton Trans. 2020, 49, 7820–7828. [Google Scholar] [CrossRef] [PubMed]
  12. Lee, J.; Ryu, K.H.; Ha, H.Y.; Jung, K.-D.; Lee, J.H. Techno-economic and environmental evaluation of nano calcium carbonate production utilizing the steel slag. J. CO2 Util. 2020, 37, 113–121. [Google Scholar] [CrossRef]
  13. Mazhar, S.F.B.; Meyer, H.J.; Samuels, T.; Sharonov, M.; Shi, L.; Alfano, R.R. Exploration of the competition between O- and E-wave induced stimulated Raman and supercontinuum in calcite under ultrafast laser excitation. Appl. Opt. 2020, 59, 5252–5257. [Google Scholar] [CrossRef] [PubMed]
  14. Karuppaiah, M.; Akilan, R.; Sakthivel, P.; Asaithambi, S.; Shankar, R.; Yuvakkumar, R.; Hayakawa, Y.; Ravi, G. Synthesis of self-essembled micro/nano structured manganese carbonate for high performance, long lifespan asymmetric supercapacitors and investigation of atomic-level intercalation properties of OH ions via first principle calculation. J. Energy Storage 2020, 27, 101138. [Google Scholar] [CrossRef]
  15. Assaedi, H.; Alomayri, T.; Kaze, C.R.; Jindal, B.B.; Subaer, S.; Shaikh, F.; Alraddadi, S. Characterization and properties of geopolymer nanocomposites with different contents of nano-CaCO3. Constr. Build. Mater. 2020, 252, 119137. [Google Scholar] [CrossRef]
  16. Atuchin, V.V.; Kesler, V.G.; Kokh, A.E.; Pokrovsky, L.D. X-ray photoelectron spectroscopy study of b-BaB2O4 optical surface. Appl. Surf. Sci. 2004, 223, 352–360. [Google Scholar] [CrossRef]
  17. Ramana, C.V.; Vemuri, R.S.; Kaichev, V.V.; Kochubey, V.A.; Saraev, A.A.; Atuchin, V.V. X-ray photoelectron spectroscopy depth profiling of La2O3/Si thin films deposited by reactive magnetron sputtering. ACS Appl. Mater. Interfaces 2011, 3, 4370–4373. [Google Scholar] [CrossRef]
  18. Atuchin, V.V.; Molokeev, M.S.; Yurkin, G.Y.; Gavrilova, T.A.; Kesler, V.G.; Laptash, N.M.; Flerov, I.N.; Patrin, G.S. Synthesis, Structural, Magnetic, and Electronic Properties of Cubic CsMnMoO3F3 Oxyfluoride. J. Phys. Chem. C 2012, 116, 10162–10170. [Google Scholar] [CrossRef]
  19. Rubio, E.J.; Atuchin, V.V.; Kruchinin, V.N.; Pokrovsky, L.D.; Prosvirin, I.P.; Ramana, C.V. Electronic Structure and Optical Quality of Nanocrystalline Y2O3 Film Surfaces and Interfaces on Silicon. J. Phys. Chem. C 2014, 118, 13644–13651. [Google Scholar] [CrossRef]
  20. Atuchin, V.V.; Vinnik, D.; Gavrilova, T.A.; Gudkova, S.; Isaenko, L.I.; Jiang, X.; Pokrovsky, L.D.; Prosvirin, I.P.; Mashkovtseva, L.S.; Lin, Z. Flux Crystal Growth and the Electronic Structure of BaFe12O19 Hexaferrite. J. Phys. Chem. C 2016, 120, 5114–5123. [Google Scholar] [CrossRef]
  21. Kang, L.; Lin, Z.; Qin, J.; Chen, C. Two novel nonlinear optical carbonates in the dee-ultraviolet region: KBeCO3F and RbAlCO3F2. Sci. Rep. 2013, 3, 1366. [Google Scholar] [CrossRef] [PubMed] [Green Version]
  22. Than, T.T.; Young, J.; Rondinelli, J.M.; Halasyamani, P.S. Mixed-metal carbonate fluorides as deep-ultraviolet non-linear optical materials. J. Am. Chem. Soc. 2017, 139, 1285–1295. [Google Scholar]
  23. Zhang, X.; Wu, H.; Cheng, S.; Han, G.; Yang, Z.; Pan, S. K9[B4O5(OH)4]3(CO3)X×7H2O (X = Cl, Br): Synthesis, characterizations, and theoretical studies of noncentrosymmetric halogen borate-carbonates with short UV cutoff edges. Inorg. Chem. 2019, 58, 6974–6982. [Google Scholar] [CrossRef] [PubMed]
  24. Peng, G.; Lin, C.S.; Yang, Y.; Zhao, D.; Lin, Z.; Ye, N.; Huang, J.S. Y2(CO3)3×H2O and (NH4)2Ca2Y4(CO3)9×H2O: Partial aviovalent cation substitution enabling evolution from centrosymmetry to noncentrosymmetry for nonlinear optical response. Chem. Mater. 2019, 31, 52–56. [Google Scholar] [CrossRef]
  25. Chen, K.; Peng, G.; Lin, C.; Luo, M.; Fan, H.; Yang, S.; Ye, N. NaPb2(CO3)2F2(OH)1−x(0 < x ≤ 1): A new member of alkali-lead carbonate fluoride system with large birefringence. J. Solid State Chem. 2020, 288, 121407. [Google Scholar] [CrossRef]
  26. Zou, G.; Ok, K.M. Novel ultraviolet (UV) nonlinear optical (NLO) materials discovered by chemical substitution-oriented design. Chem. Sci. 2020, 11, 5404–5409. [Google Scholar] [CrossRef]
  27. Gong, P.; Liu, X.; Kang, L.; Lin, Z. Inorganic planar p-conjugated groups in nonlinear optical crystals: Review and outlook. Inorg. Chem. Front. 2020, 7, 839–952. [Google Scholar] [CrossRef]
  28. Dorfman, S.M.; Badro, J.; Nabiei, F.; Prakapenka, V.B.; Cantoni, M.; Gillet, P. Carbonate stability in the reduced lower mantle. Earth Planet. Sci. Lett. 2018, 489, 84–91. [Google Scholar] [CrossRef]
  29. Zolotoyabko, E.; Caspi, E.N.; Fieramosca, J.S.; Von Dreele, R.B.; Marin, F.; Mor, G.; Addadi, L.; Weiner, S.; Politi, Y. Differences between Bond Lengths in Biogenic and Geological Calcite. Cryst. Growth Des. 2010, 10, 1207–1214. [Google Scholar] [CrossRef]
  30. Liang, W.; Li, Z.; Yin, Y.; Li, R.; Chen, L.; He, Y.; Dong, H.; Dai, L.; Li, H. Single crystal growth, characterization and high-pressure Raman spectroscopy of impurity-free magnesite (MgCO3). Phys. Chem. Miner. 2018, 45, 423–434. [Google Scholar] [CrossRef]
  31. Liang, W.; Yin, Y.; Li, Z.; Li, R.; Li, L.; He, Y.; Dong, H.; Li, Z.; Yan, S.; Zhai, S.; et al. Single crystal growth, crystalline structure investigation and high-pressure behavior of impurity-free siderite (FeCO3). Phys. Chem. Miner. 2018, 45, 831–842. [Google Scholar] [CrossRef]
  32. Gao, J.; Zhu, F.; Lai, X.-J.; Huang, R.; Qin, S.; Chen, D.; Liu, J.; Zheng, L.-R.; Wu, X. Compressibility of a natural smithsonite ZnCO3 up to 50 GPa. High Press. Res. 2014, 34, 89–99. [Google Scholar] [CrossRef]
  33. Liang, W.; Li, L.; Li, R.; Yin, Y.; Li, Z.; Liu, X.; Shan, S.; He, Y.; Meng, Y.; Li, Z.; et al. Crystal structure of impurity-free rhodochrosite (MnCO3) and thermal expansion properties. Phys. Chem. Miner. 2020, 47, 1–11. [Google Scholar] [CrossRef]
  34. Chariton, S.; Cerantola, V.; Ismailova, L.; Bykova, E.; Bykov, M.; Kupenko, I.; McCammon, C.; Dubrovinsky, L.S. The high-pressure behavior of spherocobaltite (CoCO3): A single crystal Raman spectroscopy and XRD study. Phys. Chem. Miner. 2018, 45, 59–68. [Google Scholar] [CrossRef]
  35. Reddy, B.J.; Frost, R.L. Electronic and vibrational spectra of gaspeite. Neues Jahrb. Mineral. Mon. 2004, 525–536. [Google Scholar] [CrossRef]
  36. Liu, L.G.; Lin, C.C. A Calcite → aragonite-type phase transition in CdCO3. Am. Mineral. 1997, 82, 643–646. [Google Scholar] [CrossRef]
  37. Liu, Z.T.Y.; Burton, B.P.; Khare, S.V.; Sarin, P. First-principles phase diagram calculations for the carbonate quasibinary systems CaCO3-ZnCO3, CdCO3-ZnCO3, CaCO3-CdCO3 and MgCO3-ZnCO3. Chem. Geol. 2016, 443, 137–145. [Google Scholar] [CrossRef] [Green Version]
  38. Zucchini, A.; Comodi, P.; Nazzareni, S.; Hanfland, M. The effect of cation ordering and temperature on the high-pressure behaviour of dolomite. Phys. Chem. Miner. 2014, 41, 783–793. [Google Scholar] [CrossRef]
  39. Garavelli, C.G.; Vurro, F.; Fioravanti, G.C. Minrecordite, a new mineral from Tsumeb. Mineral. Rec. 1982, 13, 131–136. [Google Scholar]
  40. Chai, L.; Navrotsky, A. Synthesis, characterization, and energetics of solid solution along the dolomite-ankerite join, and implications for the stability of ordered CaFe(CO3)2. Am. Mineral. 1996, 81, 1141–1147. [Google Scholar] [CrossRef]
  41. Frondel, C.; Bauer, C.L.H. Kutnahorite: A manganese dolomite, CaMn(CO3)2. Am. Mineral. 1955, 40, 748–760. [Google Scholar]
  42. Tareen, J.A.K.; Fazeli, A.R.; Basavalingu, B.; Bhandige, G.T. Decarbonation curves and associated thermodynamic data for synthetic Cd-dolomites CdMg(CO3)2, CdMn(CO3)2 and CdZn(CO3)2. J. Therm. Anal. 1995, 44, 937–954. [Google Scholar] [CrossRef]
  43. Bromiley, F.A.; Ballaran, T.B.; Langenhorst, F.; Seifert, F. Order and miscibility in the otavite-magnesite solid solution. Am. Mineral. 2007, 92, 829–836. [Google Scholar] [CrossRef]
  44. Effenberger, H.; Zemann, J. Single crystal X-ray investigation of norsethite, BaMg(CO3)2: One more mineral with an aplanar carbonate group. Z. Krist. 1985, 171, 275–280. [Google Scholar] [CrossRef]
  45. Liang, W.; Li, L.; Yin, Y.; Li, R.; Li, Z.; Liu, X.; Zhao, C.; Yang, S.; Meng, Y.; Li, Z.; et al. Crystal structure of norsethite-type BaMn(CO3)2 and its pressure-induced transition investigated by Raman spectroscopy. Phys. Chem. Miner. 2019, 46, 771–781. [Google Scholar] [CrossRef]
  46. Pippinger, T.; Miletich, R.; Effenberger, H.; Hofer, G.; Lotti, P.; Merlini, M. High-pressure polymorphism and structural transitions of norsethite, BaMg(CO3)2. Phys. Chem. Miner. 2014, 41, 737–755. [Google Scholar] [CrossRef]
  47. Antao, S.M.; Hassan, I. The orthorhombic structure of CaCO3, SrCO3, PbCO3 and BaCO3: Linear structure trends. Can. Mineral. 2009, 47, 1245–1255. [Google Scholar] [CrossRef]
  48. Ye, Y.; Smyth, J.R.; Boni, P. Crystal structure and thermal expansion of aragonite-group carbonates by single-crystal X-ray diffraction. Am. Mineral. 2012, 97, 707–712. [Google Scholar] [CrossRef]
  49. Kaabar, W.; Bott, S.; Devonshire, R. Raman spectroscopic study of mixed carbonate materials. Spectrochim. Acta A 2011, 78, 136–141. [Google Scholar] [CrossRef]
  50. Litasov, K.; Shatskiy, A.; Gavryushkin, P.N.; Bekhtenova, A.; Dorogokupets, P.I.; Danilov, B.S.; Higo, Y.; Akilbekov, A.T.; Inerbaev, T.M. P-V-T equation of state of CaCO3 aragonite to 29 GPa and 1673 K: In situ X-ray diffraction study. Phys. Earth Planet. Inter. 2017, 265, 82–91. [Google Scholar] [CrossRef]
  51. Lobanov, S.S.; Dong, X.; Martirosyan, N.S.; Samtsevich, A.I.; Stevanovic, V.; Gavryushkin, P.N.; Litasov, K.D.; Greenberg, E.; Prakapenka, V.B.; Oganov, A.R.; et al. Raman spectroscopy and x-ray diffraction of sp3CaCO3 at lower mantle pressures. Phys. Rev. B 2017, 96, 104101. [Google Scholar] [CrossRef] [Green Version]
  52. Smith, D.; Lawler, K.V.; Martinez-Canales, M.; Daykin, A.W.; Fussell, Z.; Smith, G.A.; Childs, C.; Smith, J.S.; Pickard, C.J.; Salamat, A. Postaragonite phases of CaCO3 at lower mantle pressures. Phys. Rev. Mater. 2018, 2, 013605. [Google Scholar] [CrossRef]
  53. Zhang, Z.; Mao, Z.; Liu, X.; Zhang, Y.; Brodholt, J.P. Stability and Reactions of CaCO3 polymorphs in the Earth’s Deep Mantle. J. Geophys. Res. Solid Earth 2018, 123, 6491–6500. [Google Scholar] [CrossRef] [Green Version]
  54. Zhu, Y.; Li, Y.; Ding, H.; Lu, A.; Li, Y.; Wang, C. Infrared emission properties of a kind of natural carbonate: Interpretation from mineralogical analysis. Phys. Chem. Miner. 2020, 47, 1–15. [Google Scholar] [CrossRef]
  55. Weir, C.E.; Lippincott, E.R. Infrared studies of aragonite, calcite, and vaterite type structures in the borates, carbonates, and nitrates. J. Res. Natl. Bur. Stand. Sect. A Phys. Chem. 1961, 65, 173–180. [Google Scholar] [CrossRef]
  56. Bischoff, W.D.; Sharma, S.K.; Mackenzie, F.T. Carbonate ion disorder in synthetic and biogenic magnesian calcites—A Raman spectral study. Am. Mineral. 1985, 70, 581–589. [Google Scholar]
  57. Lin, C.-C.; Liu, L.-G. Post-aragonite phase transitions in strontianite and cerussite—A high pressure Raman spectroscopic study. J. Phys. Chem. Solids 1997, 58, 977–987. [Google Scholar] [CrossRef]
  58. Valenzano, L.; Noël, Y.; Orlando, R.; Zicovich-Wilson, C.M.; Ferrero, M.; Dovesi, R. Ab initio vibrational spectra and dielectric properties of carbonates: Magnesite, calcite and dolomite. Theor. Chem. Acc. 2007, 117, 991–1000. [Google Scholar] [CrossRef]
  59. Kalinin, N.V.; Saleev, V.A. Ab initio modeling of Raman and infrared spectra of calcite. Comput. Opt. 2018, 42, 263–266. [Google Scholar] [CrossRef]
  60. Sun, J.; Wu, Z.; Cheng, H.; Zhang, Z.; Frost, R.L. A Raman spectroscopic comparison of calcite and dolomite. Spectrochim. Acta Part A Mol. Biomol. Spectrosc. 2014, 117, 158–162. [Google Scholar] [CrossRef] [Green Version]
  61. Perrin, J.; Vielzeuf, D.; Laporte, D.; Ricolleau, A.; Rossman, G.R.; Floquet, N. Raman characterization of synthetic magnesian calcites. Am. Mineral. 2016, 101, 2525–2538. [Google Scholar] [CrossRef]
  62. Liu, J.; Caracas, R.; Fan, D.; Bobocioiu, E.; Zhang, D.; Mao, W.L. High-pressure compressibility and vibrational properties of (Ca,Mn)CO3. Am. Mineral. 2016, 101, 2723–2730. [Google Scholar] [CrossRef]
  63. Minch, R.; Seoung, D.-H.; Ehm, L.; Winkler, B.; Knorr, K.; Peters, L.; Borkowski, L.; Parise, J.B.; Lee, Y.; Dubrovinsky, L.S.; et al. High-pressure behavior of otavite (CdCO3). J. Alloy Compd. 2010, 508, 251–257. [Google Scholar] [CrossRef]
  64. Dufresne, W.J.; Rufledt, C.J.; Marshall, C.P. Raman spectroscopy of the eight natural carbonate minerals of calcite structure. J. Raman Spectrosc. 2018, 49, 1999–2007. [Google Scholar] [CrossRef]
  65. Efthimiopoulos, I.; Germer, M.; Jahn, S.; Harms, M.; Reichmann, H.J.; Speziale, S.; Schade, U.; Sieber, M.; Koch-Müller, M. Effects of hydrostaticity on the structural stability of carbonates at lower mantle pressures: The case study of dolomite. High Press. Res. 2018, 39, 36–49. [Google Scholar] [CrossRef] [Green Version]
  66. Efthimiopoulos, I.; Jahn, S.; Kuras, A.; Schade, U.; Koch-Müller, M. Combined high-pressure and high-temperature vibrational studies of dolomite: Phase diagram and evidence of a new distorted modification. Phys. Chem. Miner. 2017, 44, 465–476. [Google Scholar] [CrossRef]
  67. Martens, W.N.; Rintoul, L.; Kloprogge, J.T.; Frost, R.L. Single crystal raman spectroscopy of cerussite. Am. Mineral. 2004, 89, 352–358. [Google Scholar] [CrossRef] [Green Version]
  68. Wang, X.; Ye, Y.; Wu, X.; Smyth, J.R.; Yang, Y.; Zhang, Z.; Wang, Z. High-temperature Raman and FTIR study of aragonite-group carbonates. Phys. Chem. Miner. 2018, 46, 51–62. [Google Scholar] [CrossRef]
  69. Efthimiopoulos, I.; Müller, J.; Winkler, B.; Otzen, C.; Harms, M.; Schade, U.; Koch-Müller, M. Vibrational response of strontianite at high pressures and high temperatures and construction of P–T phase diagram. Phys. Chem. Miner. 2019, 46, 27–35. [Google Scholar] [CrossRef]
  70. Lane, M.D.; Christensen, P.R. Thermal infrared emission spectroscopy of anhydrous carbonates. J. Geophys. Res. 1997, 102, 25581–25592. [Google Scholar] [CrossRef]
  71. Deines, P. Carbon isotope effects in carbonate systems. Geochim. Cosmochim. Acta 2004, 68, 2659–2679. [Google Scholar] [CrossRef]
  72. Brusentsova, T.N.; Peale, R.E.; Maukonen, D.; Harlow, G.E.; Boesenberg, J.S.; Ebel, D.; Prêt, D.; Sammartino, S.; Beaufort, D.; Fialin, M.; et al. Far infrared spectroscopy of carbonate minerals. Am. Mineral. 2010, 95, 1515–1522. [Google Scholar] [CrossRef]
  73. Farsang, S.; Facq, S.; Redfern, S.A.T. Raman modes of carbonate minerals as pressure and temperature gauges up to 6 GPa and 500 °C. Am. Mineral. 2018, 103, 1988–1998. [Google Scholar] [CrossRef]
  74. Erba, A.; Baima, J.; Bush, I.; Orlando, R.; Dovesi, R. Large-Scale Condensed Matter DFT Simulations: Performance and Capabilities of the CRYSTAL Code. J. Chem. Theory Comput. 2017, 13, 5019–5027. [Google Scholar] [CrossRef] [PubMed]
  75. Dovesi, R.; Erba, A.; Orlando, R.; Zicovich-Wilson, C.M.; Civalleri, B.; Maschio, L.; Rérat, M.; Casassa, S.; Baima, J.; Salustro, S.; et al. Quantum-mechanical condensed matter simulations with CRYSTAL. Wiley Interdiscip. Rev. Comput. Mol. Sci. 2018, 8, e1360. [Google Scholar] [CrossRef]
  76. Becke, A.D. Density functional thermochemistry. III. The role of exact exchange. J. Chem. Phys. 1993, 98, 5648–5652. [Google Scholar] [CrossRef] [Green Version]
  77. Lee, C.; Yang, W.; Parr, R.G. Development of the Colle-Salvetti correlation-energy formula into a functional of the electron density. Phys. Rev. B 1988, 37, 785–789. [Google Scholar] [CrossRef] [Green Version]
  78. Valenzano, L.; Torres, F.J.; Doll, K.; Pascale, F.; Zicovich-Wilson, C.M.; Dovesi, R. Ab InitioStudy of the Vibrational Spectrum and Related Properties of Crystalline Compounds; the Case of CaCO3Calcite. Z. Phys. Chem. 2006, 220, 893–912. [Google Scholar] [CrossRef]
  79. Peintinger, M.F.; Oliveira, D.V.; Bredow, T. Consistent Gaussian basis sets of triple-zeta valence with polarization quality for solid-state calculations. J. Comput. Chem. 2013, 34, 451–459. [Google Scholar] [CrossRef]
  80. Laun, J.; Oliveira, D.V.; Bredow, T. Consistent gaussian basis sets of double- and triple-zeta valence with polarization quality of the fifth period for solid-state calculations. J. Comput. Chem. 2018, 39, 1285–1290. [Google Scholar] [CrossRef]
  81. Piskunov, S.; Heifets, E.; Eglitis, R.; Borstel, G. Bulk properties and electronic structure of SrTiO3, BaTiO3, PbTiO3 perovskites: An ab initio HF/DFT study. Comput. Mater. Sci. 2004, 29, 165–178. [Google Scholar] [CrossRef]
  82. Evarestov, R.; Kotomin, E.A.; Mastrikov, Y.; Gryaznov, D.; Heifets, E.; Maier, J. Comparative density-functional LCAO and plane-wave calculations ofLaMnO3surfaces. Phys. Rev. B 2005, 72, 214411. [Google Scholar] [CrossRef] [Green Version]
  83. Sophia, G.; Baranek, P.; Sarrazin, C.; Rérat, M.; Dovesi, R. First-principles study of the mechanisms of the pressure-induced dielectric anomalies in ferroelectric perovskites. Phase Transit. 2013, 86, 1069–1084. [Google Scholar] [CrossRef]
  84. Monkhorst, H.J.; Pack, J.D. Special points for Brillouin-zone integrations. Phys. Rev. B 1976, 13, 5188. [Google Scholar] [CrossRef]
  85. Pascale, F.; Zicovich-Wilson, C.M.; Gejo, F.L.; Civalleri, B.; Orlando, R.; Dovesi, R. The calculation of the vibrational frequencies of crystalline compounds and its implementation in the CRYSTAL code. J. Comput. Chem. 2004, 25, 888–897. [Google Scholar] [CrossRef] [PubMed]
  86. Zicovich-Wilson, C.M.; Pascale, F.; Roetti, C.; Saunders, V.R.; Orlando, R.; Dovesi, R. Calculation of the vibration frequencies of alpha-quartz: The effect of Hamiltonian and basis set. J. Comput. Chem. 2004, 25, 1873–1881. [Google Scholar] [CrossRef] [PubMed]
  87. Carteret, C.; De La Pierre, M.; Dossot, M.; Pascale, F.; Erba, A.; Dovesi, R. The vibrational spectrum of CaCO3 aragonite: A combined experimental and quantum-mechanical investigation. J. Chem. Phys. 2013, 138, 014201. [Google Scholar] [CrossRef] [Green Version]
  88. Baima, J.; Ferrabone, M.; Orlando, R.; Erba, A.; Dovesi, R. Thermodynamics and phonon dispersion of pyrope and grossular silicate garnets from ab initio simulations. Phys. Chem. Miner. 2016, 43, 137–149. [Google Scholar] [CrossRef] [Green Version]
  89. Maschio, L.; Kirtman, B.; Rérat, M.; Orlando, R.; Dovesi, R. Ab initio analytical Raman intensities for periodic systems through a coupled perturbed Hartree-Fock/Kohn-Sham method in an atomic orbital basis. II. Validation and comparison with experiments. J. Chem. Phys. 2013, 139, 164102. [Google Scholar] [CrossRef] [Green Version]
  90. Korabel’Nikov, D.; Zhuravlev, Y.N. Structural, elastic, electronic and vibrational properties of a series of sulfates from first principles calculations. J. Phys. Chem. Solids 2018, 119, 114–121. [Google Scholar] [CrossRef]
  91. Shannon, R.D. Revised effective ionic radii and systematic studies of interatomic distances in halides and chalcogenides. Acta Crystallogr. Sect. A 1976, 32, 751–767. [Google Scholar] [CrossRef]
  92. Grzechnik, A.; Simon, P.; Gillet, P.; McMillan, P. An infrared study of MgCO3 at high pressure. Phys. B Condens. Matter 1999, 262, 67–73. [Google Scholar] [CrossRef]
  93. Clark, S.J.; Jouanna, P.; Haines, J.; Mainprice, D. Calculation of infrared and Raman vibration modes of magnesite at high pressure by density-functional perturbation theory and comparison with experiments. Phys. Chem. Miner. 2010, 38, 193–202. [Google Scholar] [CrossRef]
  94. Yao, C.; Wu, Z.; Zou, F.; Sun, W. Thermodynamic and Elastic Properties of Magnesite at Mantle Conditions: First-Principles Calculations. Geochem. Geophys. Geosyst. 2018, 19, 2719–2731. [Google Scholar] [CrossRef]
  95. Gillet, P.; Biellmann, C.; Reynard, B.; McMillan, P. Raman spectroscopic studies of carbonates part I: High-pressure and high-temperature behaviour of calcite, magnesite, dolomite and aragonite. Phys. Chem. Miner. 1993, 20, 1–18. [Google Scholar] [CrossRef]
  96. Schauble, E.A.; Ghosh, P.; Eiler, J.M. Preferential formation of 13C–18O bonds in carbonate minerals, estimated using first-principles lattice dynamics. Geochim. Cosmochim. Acta 2006, 70, 2510–2529. [Google Scholar] [CrossRef]
  97. De La Pierre, M.; Carteret, C.; Maschio, L.; André, E.; Orlando, R.; Dovesi, R. The Raman spectrum of CaCO3polymorphs calcite and aragonite: A combined experimental and computational study. J. Chem. Phys. 2014, 140, 164509. [Google Scholar] [CrossRef] [Green Version]
  98. Spivak, A.V.; Solopova, N.; Cerantola, V.; Bykova, E.; Zakharchenko, E.; Dubrovinsky, L.S.; Litvin, Y. Raman study of MgCO3–FeCO3 carbonate solid solution at high pressures up to 55 GPa. Phys. Chem. Miner. 2014, 41, 633–638. [Google Scholar] [CrossRef]
  99. Siva, T.; Muralidharan, S.; Sathiyanarayanan, S.; Manikandan, E.; Jayachandran, M. Enhanced Polymer Induced Precipitation of Polymorphous in Calcium Carbonate: Calcite Aragonite Vaterite Phases. J. Inorg. Organomet. Polym. Mater. 2017, 27, 770–778. [Google Scholar] [CrossRef]
  100. Farfan, G.A.; Boulard, E.; Wang, S.; Mao, W.L. Bonding and electronic changes in rhodochrosite at high pressure. Am. Mineral. 2013, 98, 1817–1823. [Google Scholar] [CrossRef]
  101. Zhao, C.; Li, H.; Jiangb, J.; He, Y.; Liang, W. Phase Transition and vibration properties of MnCO3 at high pressure and high-temperature by Raman spectroscopy. High Press. Res. 2018, 38, 212–223. [Google Scholar] [CrossRef]
  102. Böttcher, M.E.; Gehlken, P.-L.; Skogby, H.; Reutel, C. The vibrational spectra of BaMg(CO3)2 (norsethite). Miner. Mag. 1997, 61, 249–256. [Google Scholar] [CrossRef]
  103. Chaney, J.; Santillán, J.D.; Knittle, E.; Williams, Q. A high-pressure infrared and Raman spectroscopic study of BaCO3: The aragonite, trigonal and Pmmn structures. Phys. Chem. Miner. 2015, 42, 83–93. [Google Scholar] [CrossRef]
  104. Brooker, M.H.; Sunder, S.; Taylor, P.; Lopata, V.J. Infrared and Raman spectra and X-ray diffraction studies of solid lead(II) carbonates. Can. J. Chem. 1982, 61, 494–502. [Google Scholar] [CrossRef]
  105. Catalli, K.; Santillán, J.; Williams, Q. A high pressure infrared spectroscopic study of PbCO3-cerussite: Constraints on the structure of the post-aragonite phase. Phys. Chem. Miner. 2005, 32, 412–417. [Google Scholar] [CrossRef]
  106. Frech, R.; Wang, E.C.; Bates, J.B. The i.r. and Raman spectra of CaCO3 (aragonite). Spectrochim. Acta Part A Mol. Spectrosc. 1980, 36, 915–919. [Google Scholar] [CrossRef]
  107. Bayarjargal, L.; Fruhner, C.-J.; Schrodt, N.; Winkler, B. CaCO3 phase diagram studied with Raman spectroscopy at pressures up to 50 GPa and high temperatures and DFT modeling. Phys. Earth Planet. Inter. 2018, 281, 31–45. [Google Scholar] [CrossRef]
  108. Biedermann, N.; Speziale, S.; Winkler, B.; Reichmann, H.J.; Koch-Müller, M.; Heide, G. High-pressure phase behavior of SrCO3: An experimental and computational Raman scattering study. Phys. Chem. Miner. 2017, 44, 335–343. [Google Scholar] [CrossRef] [Green Version]
  109. Minch, R.; Dubrovinsky, L.S.; Kurnosov, A.; Ehm, L.; Knorr, K.; Depmeier, W. Raman spectroscopic study of PbCO3 at high pressures and temperatures. Phys. Chem. Miner. 2010, 37, 45–56. [Google Scholar] [CrossRef]
  110. Alía, J.M.; de Mera, Y.D.; Edwards, H.G.M.; Martín, P.G.; Andres, S.L. FT-Raman and infrared spectroscopic study of aragonite-strontianite (CaxSr1−xCO3) solid solution. Spectrochim. Acta Part A Mol. Biomol. Spectrosc. 1997, 53, 2347–2362. [Google Scholar] [CrossRef] [Green Version]
Figure 1. Fragments of the crystal structures of (a) CaCO3 (calcite), (b) CaMg(CO3)2 (dolomite), (c) BaMg(CO3)2 (norsethite) and (d) CaCO3 (aragonite) The unit cells are outlined. Lone atoms, excepting those in the unit cells, are omitted for clarity.
Nanomaterials 10 02275 g001
Figure 2. Calculated infrared spectra (IR) (top) and spectra of Raman light scattering (bottom) of intramolecular ν1, ν2, ν3, ν4, and lattice vibrations of magnesium (red, squares), calcium (black, circles), zinc (blue, triangles), and cadmium (lilac, rhombuses) carbonates with a calcite structure. For comparison, the experimental spectra of calcite are given [68].
Nanomaterials 10 02275 g002
Figure 3. Calculated infrared spectra (IR) (top) and Raman spectra (bottom) of intramolecular ν1, ν2, ν3, ν4, and lattice vibrations of double calcium-magnesium (black, squares), cadmium-magnesium (red, circles), calcium-manganese (blue, triangles), and calcium-zinc carbonates (lilac, rhombuses) with a dolomite structure.
Nanomaterials 10 02275 g003
Figure 4. Calculated infrared spectrum (IR) (top) and Raman spectrum (bottom) of intramolecular ν1, ν2, ν3, ν4, and lattice vibrations of double barium-magnesium carbonate in a norsesite-type structure. The solid line is the Gaussian broadening of the frequencies of long-wave oscillations (squares).
Nanomaterials 10 02275 g004
Figure 5. Calculated infrared spectra (IR) (top) and Raman spectra (bottom) of intramolecular ν1, ν2, ν3, ν4, and lattice vibrations of calcium (black, squares), strontium (red, circles), barium (blue, triangles), lead carbonates (lilac, rhombuses) with aragonite structure. For comparison, the experimental spectra of aragonite and cerussite are given [68] (Reproduced with permission from [68]; Copyright Springer Nature, 2020).
Nanomaterials 10 02275 g005
Table 1. Calculated lattice constants a, b, c, unit cell volume V, and average distances between the atoms of metal M and oxygen O (RM–O) and carbon C and oxygen (RC–O).
Carbonatea, Åb, Åc, ÅV, Å3RM–O, ÅRC–O, Å
MgCO3 4.66244.662415.1891285.95272.12291.2857
CaCO3_C 5.03855.038517.3168380.71182.39051.2878
ZnCO3 4.70944.709415.1297290.59522.13441.2973
CdCO3 4.98194.981916.6163357.15292.33121.2874
CaMg(CO3)2 4.83824.838216.2563329.56052.25711.2865
CdMg(CO3)24.81404.814015.8629318.36952.22531.2862
CaMn(CO3)24.82954.829515.8159319.46862.23021.2874
CaZn(CO3)24.85584.855816.2964332.77822.26481.2866
BaMg(CO3)25.06375.063717.0662378.96832.68111.2846
CaCO3_A5.00208.01755.8581234.93232.56041.2857
SrCO35.14698.44186.1947269.15222.68381.2884
BaCO35.36658.93276.6847320.44592.85671.2910
PbCO35.24538.57236.3725286.53192.74511.2897
Table 2. Linear interpolation coefficients of the wavenumbers of intramolecular (ν4, ν1, ν3) vibrations of the M cation mass for carbonates with aragonite structure, active in RS, obtained from experimental data [68] and theoretical calculations by the B3LYP method. The correlation coefficient is shown in brackets.
Methodν4ν1ν3v3
Experiment [68]713.2 − 0.173·M (0.986)1090.1 − 0.17·M (0.919)1495.3 − 0.588·M (0.989)1597.2 − 0.582·M (0.99)
B3LYP714.3 − 0.128·M (0.933)1087.059 − 0.116·M (0.894)1486.0 − 0.426·M (0.992)1619.0 − 0.638·M (0.998)
Publisher’s Note: MDPI stays neutral with regard to jurisdictional claims in published maps and institutional affiliations.

