Article

Influence of Nanotopography on Early Bone Healing during Controlled Implant Loading

by
Renan de Barros e Lima Bueno
1,
Katia J. Ponce
1,
Ana Paula Dias
1,
Dainelys Guadarrama Bello
1,
John B. Brunski
2 and
Antonio Nanci
1,3,*
1
Laboratory for the Study of Calcified Tissues and Biomaterials, Department of Stomatology, Faculty of Dental Medicine, Université de Montréal, Montréal, QC H3C3J7, Canada
2
Department of Surgery, School of Medicine, Stanford University, Stanford, CA 94305, USA
3
Department of Biochemistry and Molecular Medicine, Faculty of Medicine, Université de Montréal, Montréal, QC H3C3J7, Canada
*
Author to whom correspondence should be addressed.
Nanomaterials 2020, 10(11), 2191; https://doi.org/10.3390/nano10112191
Submission received: 13 October 2020 / Revised: 27 October 2020 / Accepted: 28 October 2020 / Published: 3 November 2020
(This article belongs to the Special Issue Nanostructured Materials for Biomedicine and Bioengineering)

Abstract

:
Nanoscale surface modifications influence peri-implant cell fate decisions and implant loading generates local tissue deformation, both of which will invariably impact bone healing. The objective of this study is to determine how loading affects healing around implants with nanotopography. Implants with a nanoporous surface were placed in over-sized osteotomies in rat tibiae and held stable by a system that permits controlled loading. Three regimens were applied: (a) no loading, (b) one daily loading session with a force of 1.5N, and (c) two such daily sessions. At 7 days post implantation, animals were sacrificed for histomorphometric and DNA microarray analyses. Implants subjected to no loading or only one daily loading session achieved high bone-implant contact (BIC), bone-implant distance (BID) and bone formation area near the implant (BFAt) values, while those subjected to two daily loading sessions showed less BFAt and BIC and more BID. Gene expression profiles differed between all groups mainly in unidentified genes, and no modulation of genes associated with inflammatory pathways was detected. These results indicate that implants with nanotopography can achieve a high level of bone formation even under micromotion and limit the inflammatory response to the implant surface.

1. Introduction

Surface modification strategies at all scales have been proposed for improving the osseointegration of implants, particularly in situations where bone quality is an issue or immediate loading is clinically indicated. Nanoscale features are widely found in nature and provide fascinating physicochemical properties such antibacterial capacity in insects and water repellence in plants [1,2]; they also guide the crosstalk between cells and matrix molecules [3,4,5,6,7]. Various cell types have been shown to respond to nanofeatures and there is now an abundant literature documenting the capacity of nanotopography to influence the activity of osteogenic cells [3,7,8,9], enhance osteogenic differentiation of stem cells and trigger a distinct set of signaling pathways [10,11]. Reports by several groups [12,13,14,15,16,17] have also shown the efficiency of nanoscale surface modification of implants placed in the complex environment of the body. However, these reports dealt with unloaded implants and comparative information on how nanotopographic implants perform under ‘acceptable’ and ‘detrimental’ loading conditions is still lacking.
When implants are placed in function, the imparted forces will cause some degree of micromotion, which generates local strain and stress conditions that deform interfacial tissues, which can influence the bone healing response [18,19].
Yet, few studies have investigated the effect of nanotopography under loading conditions and its impact on the healing events at the bone–implant interface. The objective of this study was to evaluate, using histomorphometry and DNA microarray analysis, the influence of nanotopography on the mechanobiology at the bone–implant interface under well-defined loading conditions. To achieve this, we have taken advantage of a rat tibial loading system that holds the implant stable, thereby allowing the controlled application of forces in a peri-implant environment that sustains de novo bone formation [20]. We have also used a facile oxidative nanopatterning to produce a unique nanoporous surface network that enhances the osteogenic response both in vivo and in vitro [3,17,21]. The results demonstrate that a surface with nanotopography can sustain improved bone formation even under micromotion. A better understanding of the impact of nanoscale surface features on micromotion is expected to foster the creation of implants with rationally engineered surfaces that will prevent detrimental tissue formation while actively promoting bone healing and regeneration around implants.

2. Materials and Methods

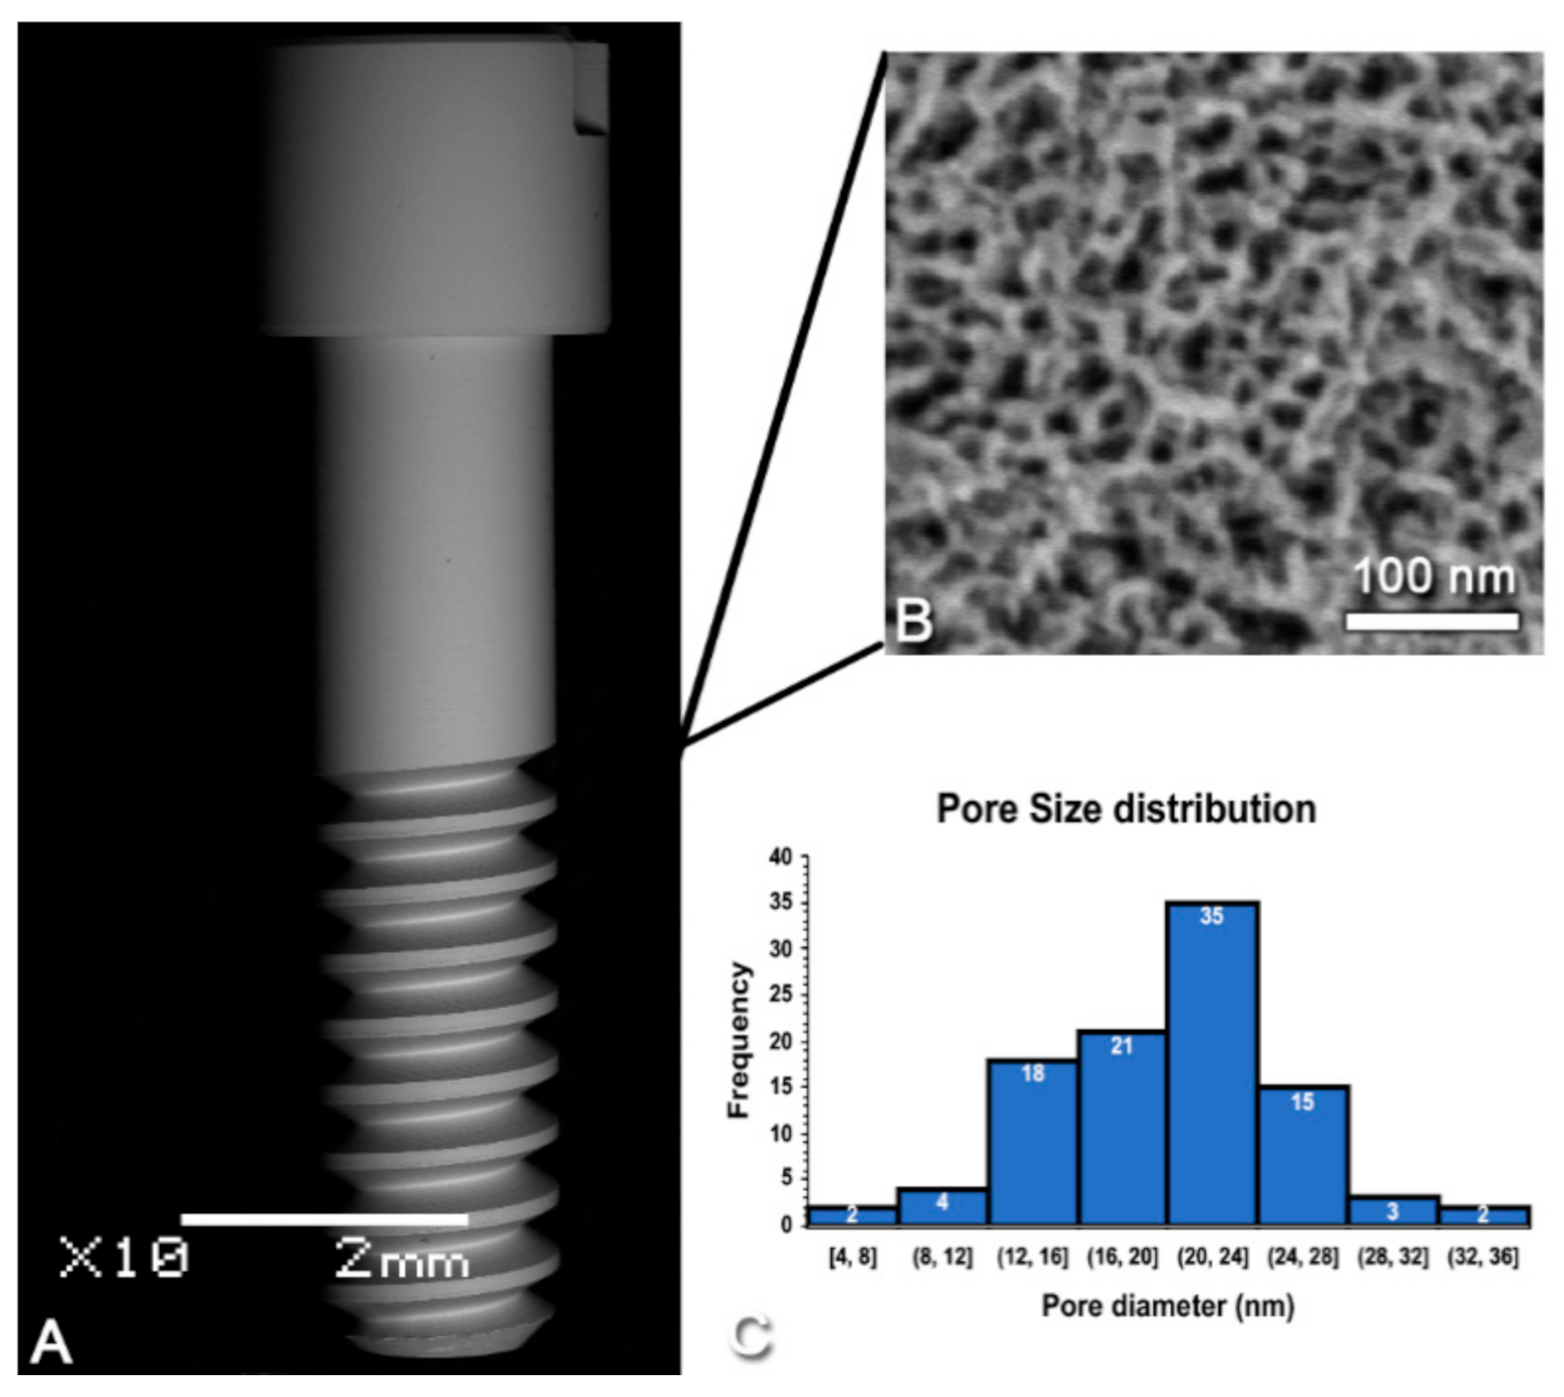
2.1. Surface Modification and Surface Analysis

Commercially pure grade II titanium implants (1.7 mm outer diameter including the threads; Medical Micro Machining Inc, Colfax, CA, United States) were nanotextured using a solution of H2SO4 and H2O2 for 2 h; their surface appearance as well as the distribution and size of the nanopores obtained were confirmed using a JEOL JSM-7400F (JEOL Ltd., Tokyo, Japan) field-emission scanning electron microscope (FE-SEM) operated at 1.5 kV, as previously described [3,22,23].

2.2. Ethical Approval and Animal Post-Surgical Monitoring

All animal experiments received approval of the Comité de déontologie de l’expérimentation sur les animaux of Université de Montréal (Protocol # 17–113) and are in accordance with the ARRIVE Guidelines for reporting animal research. The behavior and weight of the animals were checked on a daily basis at the University animal facilities throughout the period of experimentation. Moreover, the surgical wound site was inspected for visual signs of inflammation and infection and cleaned every day with a solution of Baxedin® Pre-Op (Omega Laboratories Ltd., Montreal, QC, Canada). The animals were placed in individual cages and allowed to move around freely, and they were given water and food ad libitum.

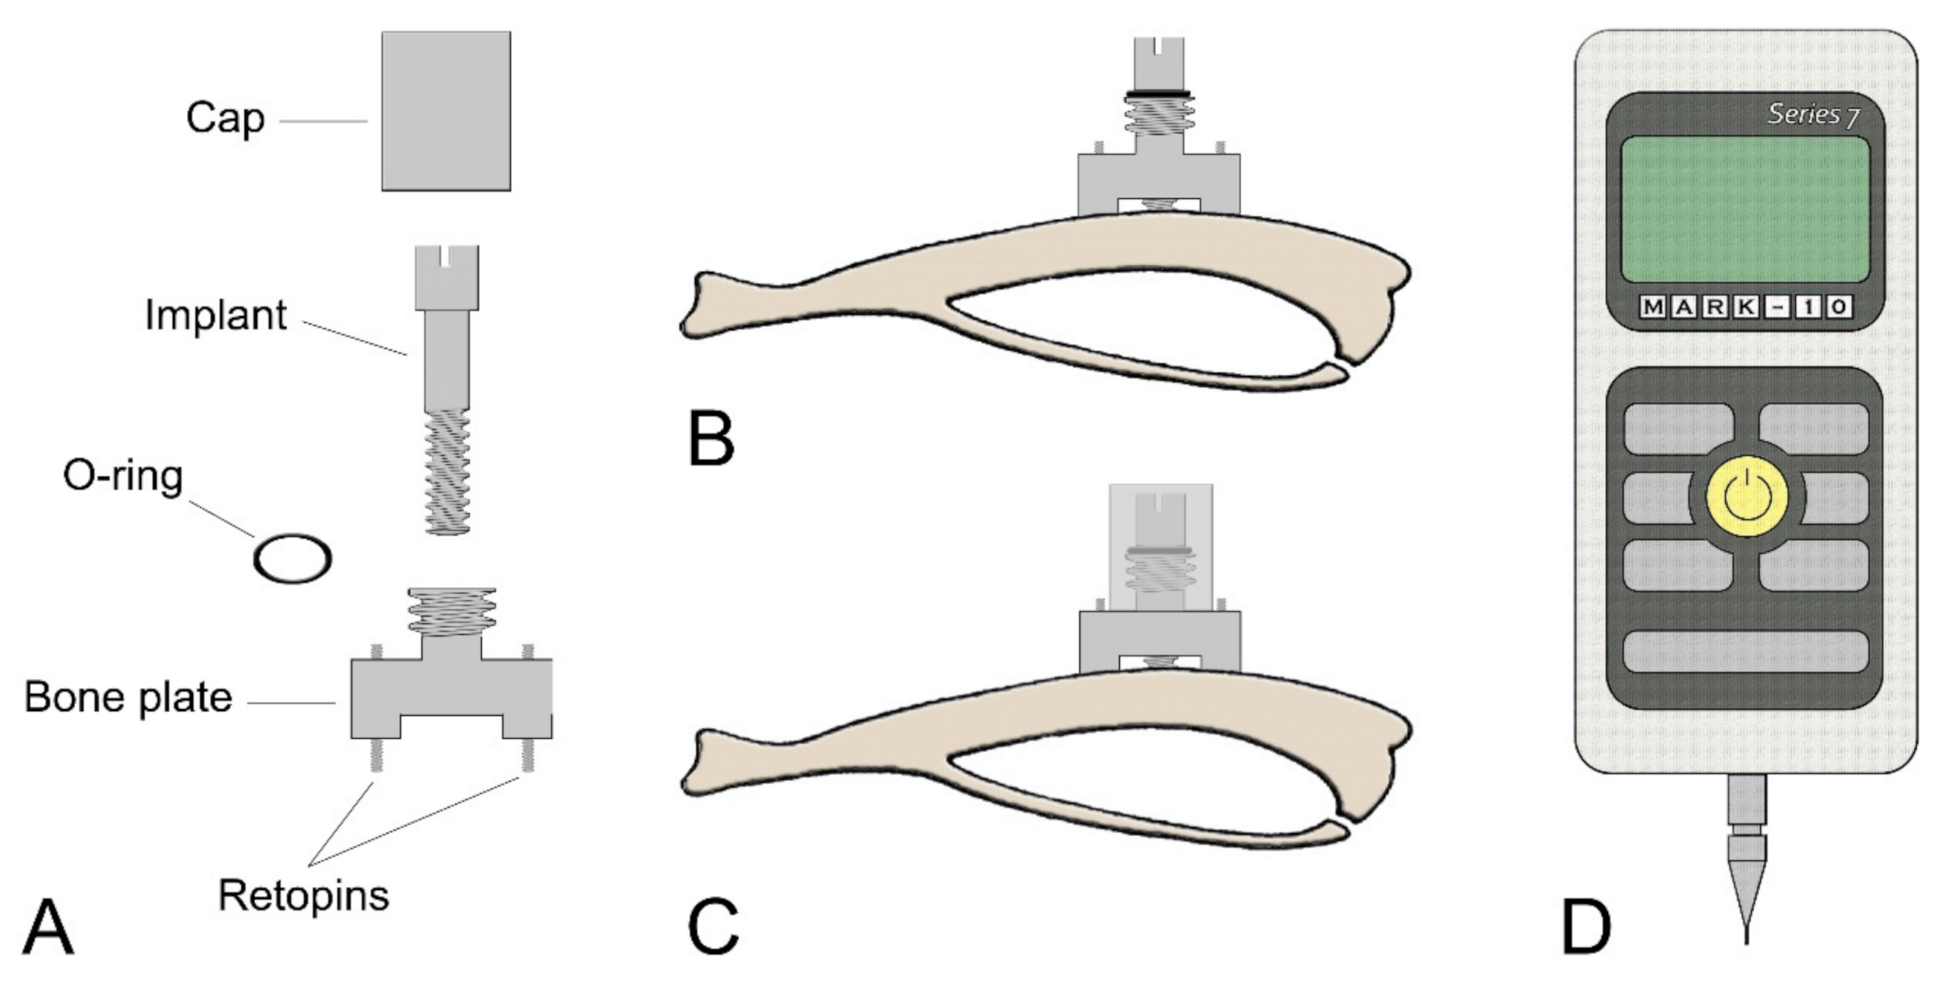
2.3. Surgical Procedure

A detailed description of the implant system and the surgical procedures is given in de Barros et al. [20]. Briefly, 28 male Wistar rats (200–225 g) were anesthetized with Ketamine 100 mg/kg and Xylazine 10 mg/kg. A bone plate was affixed to the superior portion of the tibia using retopins (NTI Kahla GmbH, Kahla, Germany) to guide implant placement, stabilize them and allow controlled loading.
The bony hole into which the surface-modified implants were placed was slightly larger (2.0 mm) than the implant (1.7 mm) in order to create a gap interface [20,24]. After surgery, the rats were given an injection of Buprenorphine (0.05 mg/kg) and Carprofen (0.5 mg/kg). Rats that were used for histomorphometry received an implant on each the tibia, while those for molecular analysis received only one implant on one of the tibiae.

2.4. Micromotion System and Loading Regimen

A Mark-10 hand-held device force gauge (Copiague, NY, USA) was used for loading implants using a force of 1.5N/cycle following the protocol discussed in Barros et al. [20] (Figure 1). The loading regiments and the experimental groups are summarized in Table 1. During implant loading and daily cleaning of the wound (for both loaded and unloaded groups), the animals were kept under Isoflurane at 1–2% (Baxter, Mississauga, ON, Canada). As discussed in de Barros et al. [20], the Isoflurane anesthesia applied has no significant effect on the bone healing response.

2.5. Tissue Processing for Histology

Seven days after implant placement, the animals were anesthetized with a solution of a chloral hydrate (0.4 mg/g) and Xylazine (0.005 mg/g) and sacrificed by an inhalation overdose of Isoflurane. Sample processing for histology/histomorphometry was as described in de Barros et al. [20]. Briefly, tibiae with implants in place were fixed in a mixture of 4% paraformaldehyde and 0.1% glutaraldehyde in 0.1M phosphate buffer, pH 7.2, and decalcified with Planck-Rychlo solution. Following decalcification, the implants were retrieved, and tibiae were processed for embedding in paraffin. All sections were cut longitudinally along the tibiae and stained with hematoxylin and eosin for both histological and histomorphometric analyses. For more detailed histological analyses, some deparaffinized sections were examined using backscatter electron imaging [25] in a JEOL JSM 6460LP variable pressure scanning electron microscope (VP-SEM; JEOL, Tokyo, Japan) operated at 20 kV and 40 Pa.

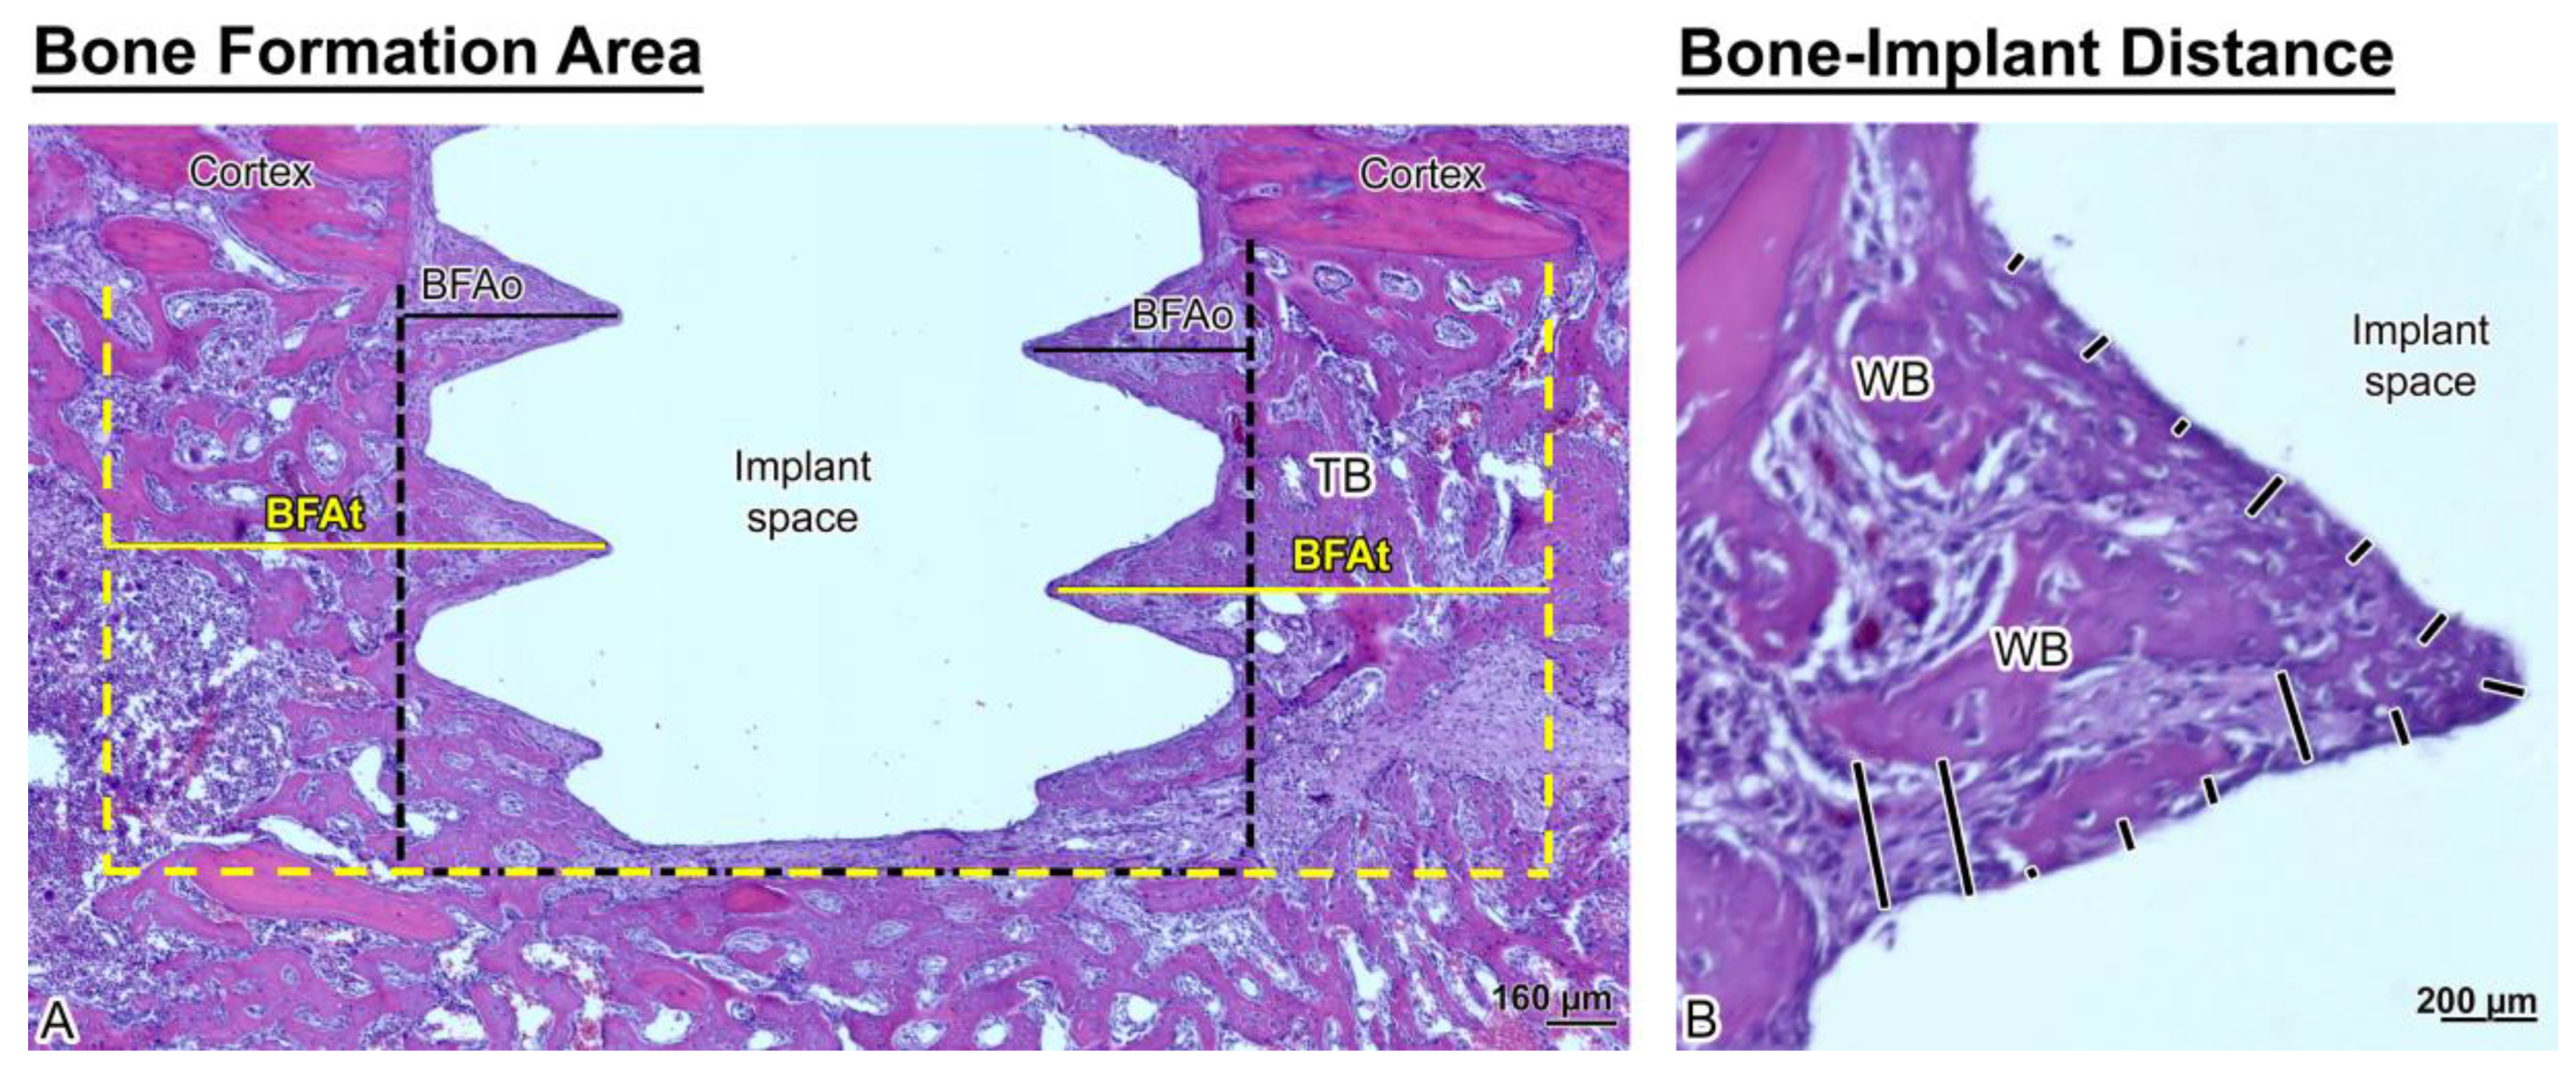
2.6. Histomorphometric Analyses

Only sections that reflected with fidelity the implant outline and showed no interfacial tearing were used for measurements, but in all cases 10 sections per implant were analyzed (sections/implant n = 10). Bone-implant contact (BIC), distance between new bone formation and implant surface (bone-implant distance, BID) and bone formation area (BFA) (a) within the osteotomy region (BFAo) and (b) an area corresponding to the region trephined out for microarray analysis (BFAt) were measured. For BID, 30 measurements on each of the 10 sections were taken along the lateral aspects of the implant, for a cumulative number of 300 measurements (n = 300) per implant. A detailed description of histomorphometric measurements using the Image-J software (NIH, MD, USA) is given in de Barros et al. [20].

2.7. Tissue Processing for RNA Extraction

RNA extraction was carried out as previously reported [20]. Briefly, (1) the implant was removed and immediately placed in 1 mL of TRIzol (Invitrogen, Burlington, ON, Canada), (2) the bone surrounding the implant was trephined under RNAlater (Fisher Scientific, Waltham, MA, USA) irrigation and placed in RNAlater solution (Fisher Scientific) for 48 h and finally placed in the corresponding TRIzol solution used to extract total RNA from any tissue adhering to the implant. The implant- and bone-derived RNA were therefore pooled. Purification and concentration of the total RNA was performed as recommended by manufacturer (Qiagen, Mississauga, ON, Canada). RNA quality was analyzed using the Agilent Bioanalyzer 2100 and only RNA samples with a high integrity number (RNA integrity number (RIN) > 8.5) were used for microarray analyses. The sample size for each group was n = 6 (Table 1).

2.8. DNA Microarray Design, Hybridization, Data Normalization and Analysis

For DNA microarray analysis, the Gene Chip Rat Gene 2.0 ST Array (Affymetrix, Santa Clara, CA, USA) was used and the samples were examined on a GeneChip® scanner 3000 (Affymetrix, Santa Clara, CA, USA). The Affymetrix® Expression Console™ and Affymetrix Transcriptome Analysis Console (TAC) softwares (Affymetrix, Santa Clara, CA, USA) were used to assess the gene level normalization and gene expression differences respectively. The Ingenuity Pathway Analysis (IPA) software (Qiagen Bioinformatics, Redwood City, CA, USA) was used for the pathway analyses and the gene Ontology (GO) terms were classified according the PANTHER Classification System (http://www.pantherdb.org/). The complete list of the biological process investigated can be found at http://pantherdb.org/panther/prowler.jsp.

2.9. Statistical Analyses

For histomorphometry analyses, the data were tested for normal distribution with the Shapiro–Wilk test using the median for each implant (n = 5 implants/group). The nonparametric analysis of variance (ANOVA)-type statistic (ATS) was performed [26]. To calculate the ATS, ranks were determined and Proc mixed was used with the ANOVAF option, followed by pairwise comparisons between groups. In all cases, Bonferroni correction was applied. SAS version 9.4 (SAS Institute Inc., Cary, NC, USA) and IBM SPSS Statistics version 25 (IBM Corp., Armonk, NY, USA) were used. Level of power ≥ 80% and p value < 0.05 were considered statistically significant.
For microarray, TAC software was used to evaluate the differences in gene expression between the groups by ANOVA, the fold change cut off was set at 2 and the level of significance was 5%.

3. Results

3.1. Characterization of Surface Topography

Figure 2A shows an SEM image of the screw-shaped implant used in this study. Consistent with previous reports [3,16,27,28], SEM imaging confirmed the presence of a surface network of nanopores (Figure 2B) with diameters in the range of 20 (±5) nm (Figure 2C), which was homogeneous through the whole implant. The nanopores exhibited depths ranging from 10 to 20 nm values [29].

3.2. Post-Surgical Animal Observations
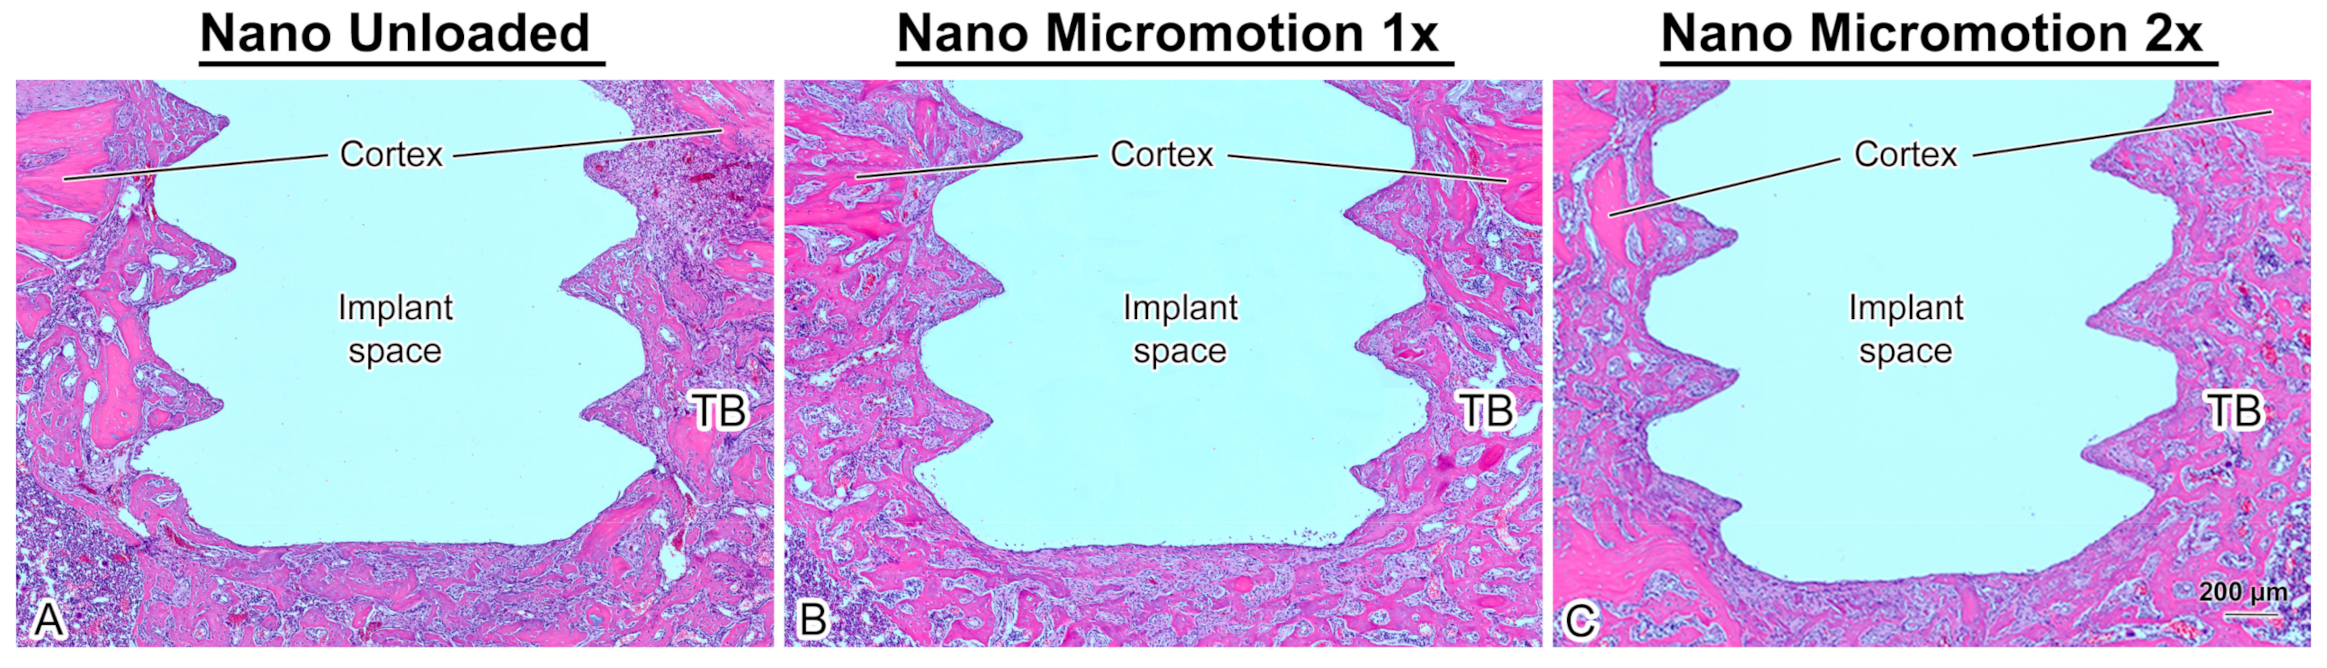
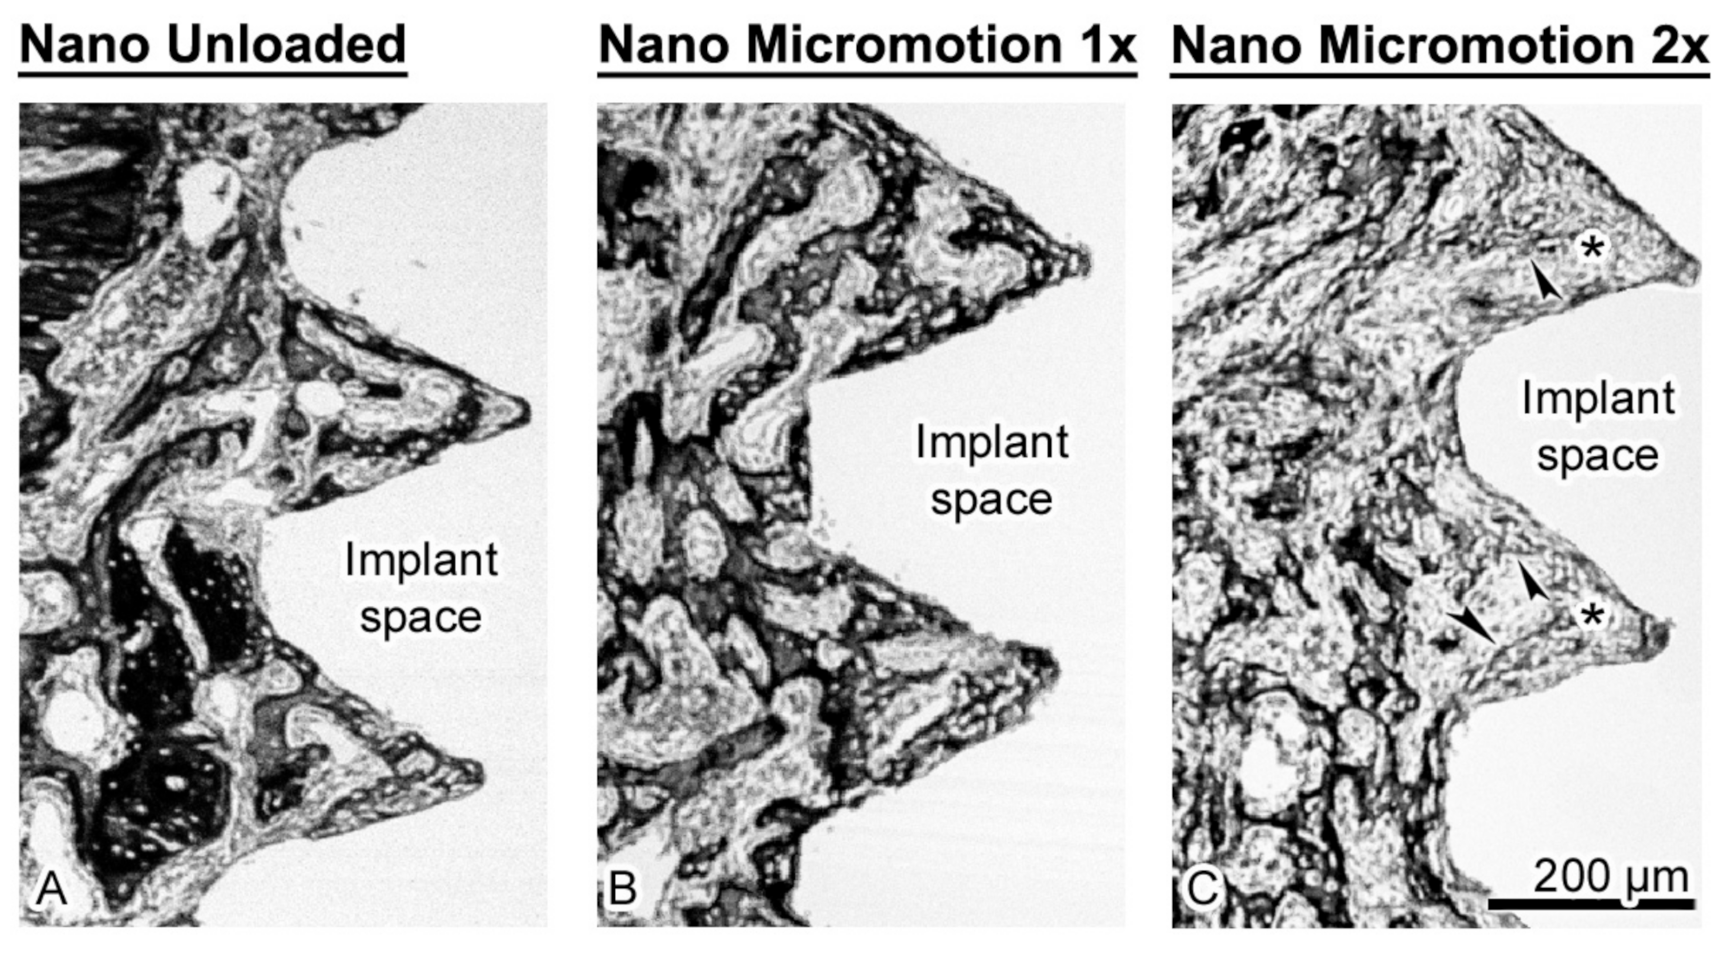
No adverse events (distress, infection and inflammation at the wound site) were detected throughout the 7-day experimental period. The experimental manipulations did not affect the mobility of the animals and, in all groups, weight gain was similar (~57 g/animal).

3.3. Histology

Histological analysis revealed no major inflammatory infiltrate around the implants. In all cases, there was newly formed trabecular bone in the marrow space surrounding the implants and there was no difference in its overall distribution between groups (Figure 3).
As illustrated in Figure 4, the trabecular bone is woven in nature (Figure 4B). However, bone formation appeared disrupted close the implant surface in the Nano Micromotion 2x group (Figure 3C and Figure 5C). Backscatter electron imaging allowed us to better visualize the region of disruption between the forming new bone and the implant surface, which was mainly occupied by fibrous-like tissue (Figure 5C).
The few trabeculae found in this region were thinner and emitted a lower backscatter signal, suggesting their organization was less compact. As usual, some osteoclasts (data not shown) were present at the surgical site; however, in all cases there was no notable accumulation of these resorptive cells in proximity to the implant surface.

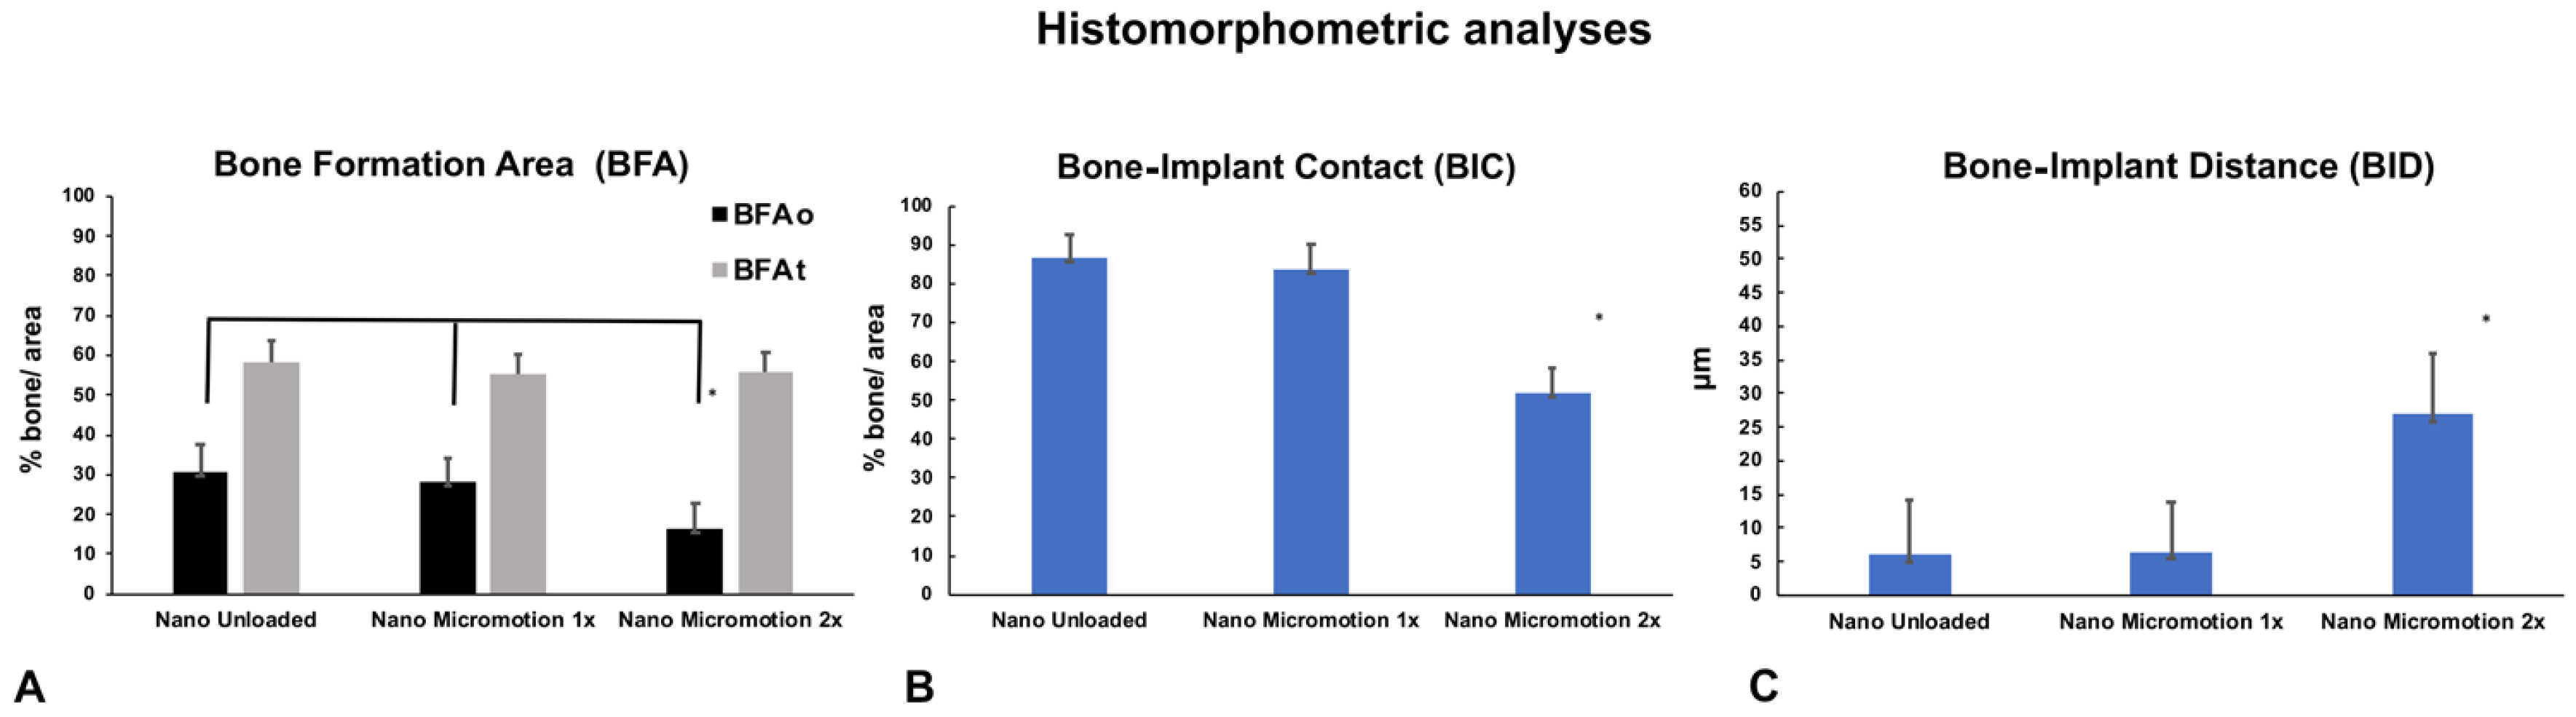
3.4. Histomorphometric Analyses

Histomorphometric analyses corroborated the histological findings. There was no significant difference in bone formation area (BFAt) (Figure 6A and Table 2). However, in the implant osteotomy area (BFAo), bone formation in the Nano Micromotion 2x group showed lower percentages when compared with the other groups (Figure 6A and Table 2). The Nano Micromotion 2x group also showed a lower percentage for BIC (Figure 6B, Table 2) and larger BID when compared with the other two groups (Figure 6C and Table 2). There was no significant difference in all the analyses between the Micromotion 1x and the Unloaded control group (Figure 6A–C and Table 2). The power of the study was 100%.

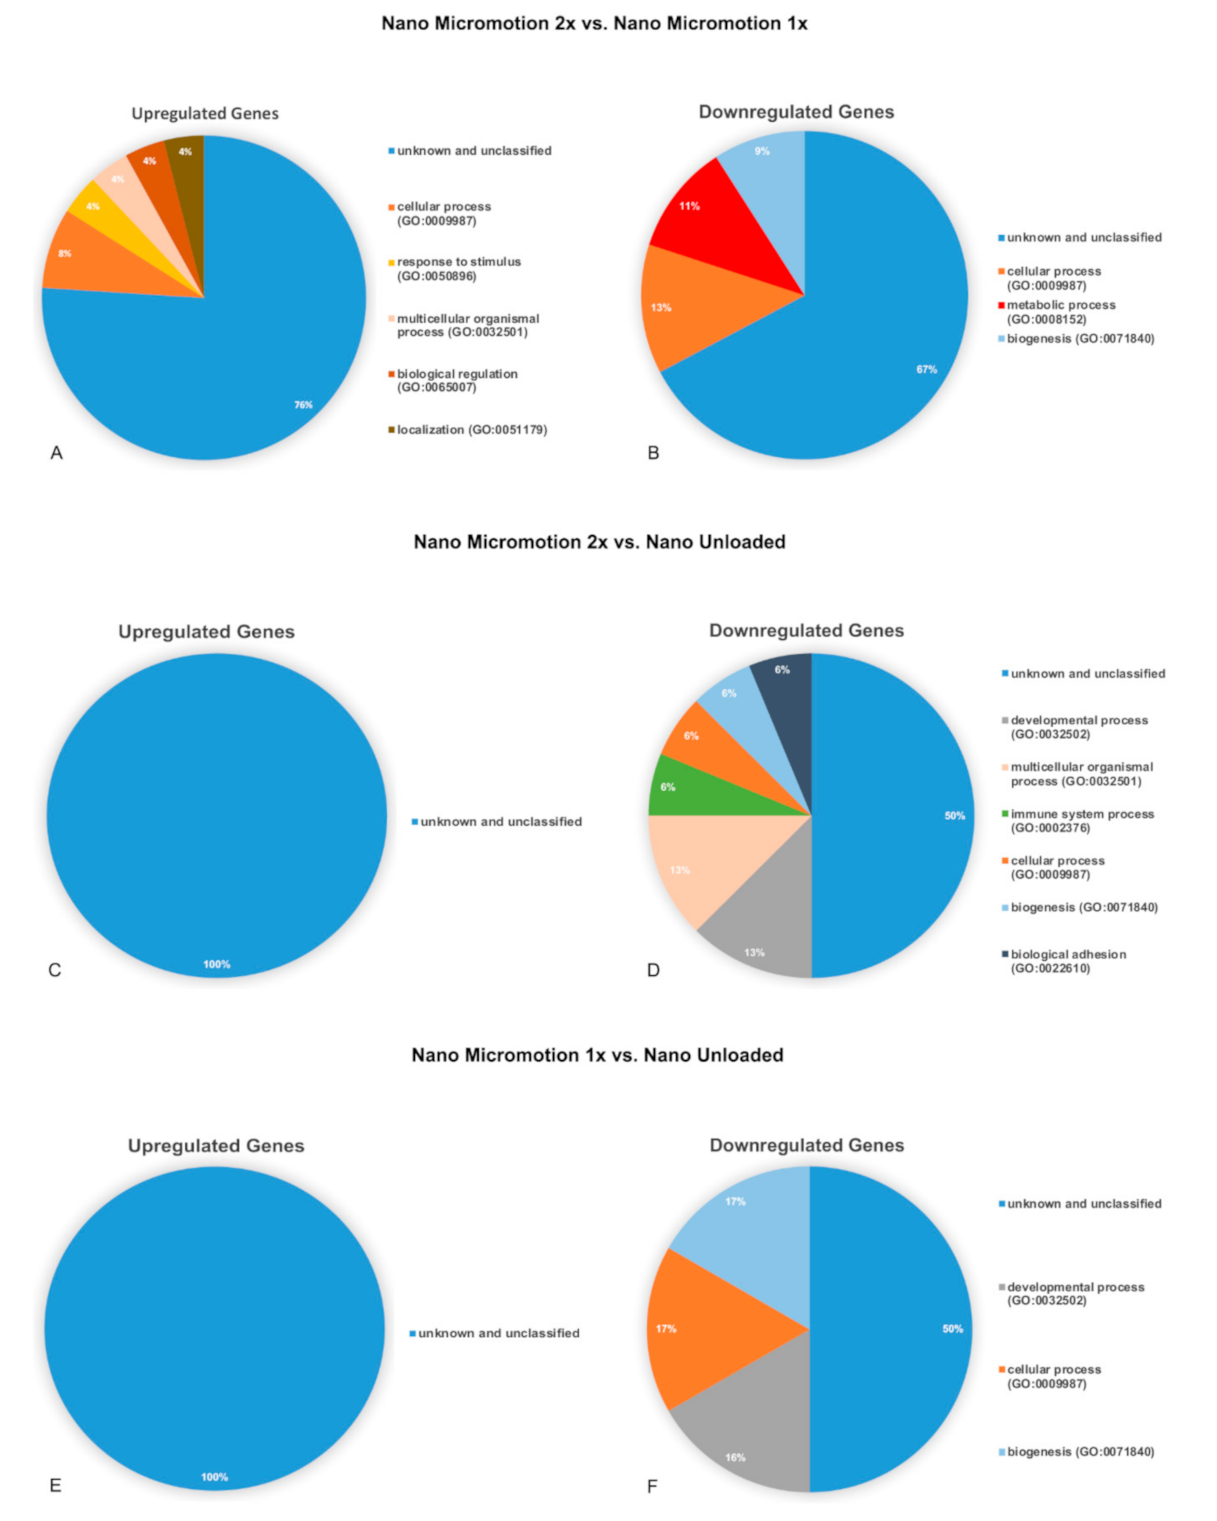
3.5. Gene Expression Profile

Microarray analysis revealed different gene expression profiles between the groups at day 7 post-surgery (Table 3).
A complete list of differentially expressed genes can be found in Tables S1–S3. The identified genes belonged mainly to the unidentified gene category (Table 3 and Figure 7). The genes were classified into biological processes (BP) according the Panther System Classification in order to evaluate their functional significance. The pie charts show the proportional distribution of up- (Figure 7A,C,E) and downregulated processes (Figure 7B,D,F) at 7 days post-surgery.
The results of the signaling pathways related with bone healing are presented in Tables S4–S6. Although few genes were implicated, the following pathways emerged: Hedgehog, signaling, mRNA processing, endochondral ossification, senescence and autophagy.

4. Discussion

The ultimate objective of our work is to better understand the impact of nanoscale surface modifications on micromotion-induced tissue deformation and damage at the tissue–implant interface where cell fate decisions are made. Both loading intensity and frequency play a critical role during bone healing [30,31]. At a high range of loading and micromotion, they can have deleterious outcomes such as the formation of interfacial fibrous tissue and/or interfere with bone repair [31,32,33]. In previous studies using the herein loading system in mice and in rats [20,24], we have demonstrated that multiple daily loading sessions create interfacial stress and strain conditions around machined-surface, screw-shaped implants that can significantly disrupt bone healing and cause fibrous tissue formation. In the present study using similar screw-shaped implants with nanotopography, we also show that simply doubling the number of loading sessions induces major changes at the bone–implant interface but to a lesser degree than similar implants with a machined surface (see below).
The surface generated by the treatment of titanium discs of the same commercial grade II as the implants used herein has been extensively characterized, including roughness values [11,27,29]. The pore size on the screw-shaped implants matches the value (~20 nm) obtained on discs. It should be noted here that the oxidative nanopatterning treatment applied does not cause any micro-roughness under the conditions used in this study [27] and in fact, at 1.5 h of treatment a mono-planar nanoporous surface is achieved [3]. Furthermore, Karazisis et al. [34] demonstrated using screw-shaped titanium implants that the influence of nanotopography on the early biological events of osseointegration is “independent of the underlying microscale topography”. Altogether, this suggests that nanotopography is responsible for the outcomes discussed below.
The BFAo, the BIC, and the BID were affected only in the Nano Micromotion 2x group. A possible explanation is that, compared to the Micromotion 1x group [20], the two loading cycles cause damage in the high-strain regions, which might not be repaired in time before the next loading session [20]. Since the loading is repeated for 7 days, the accumulated damage ultimately leads to an interference in bone healing along the implant surface. In contrast, the BFAt in all groups showed similar values and the placement of the implant into the marrow did not affect bone formation within the broad volume. This could be explained by two factors: (1) the drilling activated the bone modeling sequence in the bone marrow and this process is independent of the implant [35] and/or (2) the stress/strains generated by micromotion have a limited extension from the implant surface.
All groups of implants with nanotopography showed substantial improvement in bone healing when compared to results from a study using equivalent groups of machined surface titanium implants having the same shape and size, placed in the same anatomical site, and loaded using the exact same loading protocol [20]. Comparison with histomorphometry values reported in that study shows that BIC was increased by 1.5 times in the Nano Unloaded group, 1.8 times in the Nano Micromotion 1x and 2.6 times in the Nano Micromotion 2x. This improvement is particularly remarkable in the case of the Micromotion 2x treatment that generates an excessive loading situation that leads to an accumulation of tissue damage during the 7 days of double loading sessions [20]. The increase in BIC is also accompanied by an almost 40% decrease in average BID (Table S7) [20]. While nanotopography does not eliminate interfacial tissue damage, these results suggest that the nanoporous surface has the ability to significantly reduce it. This outcome is consistent with its demonstrated capacity of this nanostructured titanium surface to promote osteogenic activity and also to limit the growth of fibroblastic cells in vitro [11].
The above improvement could also be explained by differences in cell-surface interactions and resulting cell behavior at various scales. We have shown that macroscale surface features can have a detrimental effect on contact osteogenesis when the displacement of the implant relative to bone (micromotion) generates >30% principle strain levels [24,36,37]. If this same micromotion was applied to an implant with nanoscale topography, the displacement of nanoscale features relative to the large surface of the cell might not sufficiently deform entire cells to damage them. Instead, the multiple, small local strains may actually sum up to stimulate cell activity, in this case osteogenesis. Another non-exclusive explanation could be that the biomechanical relationship of cells with the nanoporous implant surface is different. We have recently shown in vitro that the nanoporous surface used here induces the formation of more mature focal adhesions and of numerous filopodia with very fine lateral protrusions [3]. Altogether, these adhesive structures could strengthen the adhesive interaction of cells with the surface and ‘stiffen’ the cells, allowing them to sustain more aggressive strain and stress levels [3,38,39].
The microarray analysis also detected bone-related genes, but these were not differentially expressed. This is consistent with the histological appearance and BFAt values indicating that, in all cases, bone formation was well advanced. Altogether, this suggests that the force applied and resulting implant micromotion were not sufficient to alter the overall osteogenesis during the 7-day interval tested. This may, however, not be the case at earlier time intervals and, as indicated by the BID values, in the Nano Micromotion 2x, also along the implant surface. Analyses at shorter intervals (e.g., 3- and 5-days post-surgery) and narrowing the sampling volume around the implant may put in evidence differentials in gene expression. Laser micro dissection might even allow one to observe local differences in gene expression that are expected at sites of low and high stain/stress points along the implant. Such detailed information would provide a better understanding of how nanotopography improves bone healing, both under stable and loading conditions.
The majority of the genes that were up or downregulated during loading are not classified. This indicates that a number of unsuspected ‘players’ could be involved in implant osseointegration, and these may represent potential targets for promoting bone formation around implants. It is interesting to note that in the report with machined-surface implants [20], micromotion elicited important changes in genes related to inflammatory pathways. With nanoporosity, these pathways were not differentially solicited (Table S8), a finding that is consistent with the lesser inflammatory propensity of the nanoporous surface [22] and that may in part contribute to the overall improvement in bone healing under all loading conditions tested. Finally, nanotopography modulates the expression of some miRNAs during the bone healing [40], such as miR1224, which is implicated in osteolytic bone metastasis [41], and miR140, a regulator of osteogenesis and chondrogenesis [42,43] (Table S9).

5. Conclusions

While nanotopography has been shown to stimulate bone formation under stable implant conditions, we show here for the first time that this capacity carries over with loading, at least during initial bone formation. The majority of the genes that were up and downregulated had no classification hit, and genes belonging to inflammatory pathways were not differentially expressed. Compared to machined surface implants tested under similar conditions, the improvements in BIC and BID values in the Nano Micromotion 2x group indicate that the nanoporous surface used alleviates to some degree the consequences of excessive micromotion. This novel finding raises the possibility that implants with nanostructured surfaces could better sustain challenging loading conditions during initial bone healing. It will be interesting to determine whether these gains translate over time during continued loading or secondary implant stabilization.

Supplementary Materials

The following are available online at https://www.mdpi.com/2079-4991/10/11/2191/s1, Table S1: Differentially known/classified Genes Expressed in the Nano Micromotion 2x group in comparison to the Nano Micromotion 1x group at Day 7, Table S2: Differentially known/classified Genes in the Nano Micromotion 2x group in comparison to the Nano Unloaded group at Day 7, Table S3: Differentially known/classified Genes in the Nano Micromotion 1x group in comparison to the Nano Unloaded group at Day 7, Table S4: List of local pathways obtained for genes differentially expressed in the Nano Micromotion 2x group in comparison to the Nano Micromotion 1x group at day 7, Table S5: List of local pathways obtained for genes differentially expressed in the Nano Micromotion 2x group in comparison to the Nano Unloaded group at day 7 and Table S6: List of local pathways obtained for genes differentially expressed in Nano Micromotion 1x group in comparison to the Nano Unloaded group at day 7. Table S7: Comparison of histomorphometric analyses between machined-surface implants (data from de Barros et al. [20]) vs implants with nanoporous surface. Table S8: List of inflammatory pathways elicited in Machined Surfaces in comparison to the Nanotexture Surfaces at day 7. Table S9: Differentially miRNA expressed genes in the nanotextured surfaces in comparison to the machined surfaces at Day 7.

Author Contributions

R.d.B.e.L.B. carried out all surgical procedures, contributed to histomorphometry and carried out analysis of DNA microarray results; K.J.P. carried out tissue processing and sectioning for histomorphometry and RNA extraction and characterization; A.P.D. contributed to sectioning and histomorphometry; D.G.B. acquired the backscattered electron images of deparaffinize sections and took part in review and writing the article; R.d.B.e.L.B., J.B.B. and A.N. participated to experimental design and data interpretation, and took part in drafting the article or revising it critically for important intellectual content. A.N. oversaw all aspects of the study. All authors have read and agreed to the published version of the manuscript.

Funding

This work was supported by National Institutes of Health (NIH, 5R01DE024000) and Canadian Institute of Health Research (CIHR, 362821) grants and by the Réseau de Recherche en Santé Buccodentaire et Osseuse (RSBO). Antonio Nanci holds a Canada Research Chair in Calcified Tissues, Biomaterials, and Structural Imaging.

Acknowledgments

We extend our thanks to Pierre Rompré (Statistician at Université de Montréal) for his guidance and technical support with the multi-level statistics analysis. The authors acknowledge the services from Génome Québec Innovation Center at McGill University (Montreal, Quebec, Canada) for performing the DNA microarray analysis.

Conflicts of Interest

The authors declare no conflict of interest.

References

  1. Ho, A.Y.; Yeo, L.P.; Lam, Y.C.; Rodriguez, I. Fabrication and analysis of gecko-inspired hierarchical polymer nanosetae. Acs Nano 2011, 5, 1897–1906. [Google Scholar] [CrossRef]
  2. Jaggessar, A.; Shahali, H.; Mathew, A.; Yarlagadda, P. Bio-mimicking nano and micro-structured surface fabrication for antibacterial properties in medical implants. J. Nanobiotechnol. 2017, 15, 64–84. [Google Scholar] [CrossRef] [Green Version]
  3. Bello, D.G.; Fouillen, A.; Badia, A.; Nanci, A. A nanoporous titanium surface promotes the maturation of focal adhesions and formation of filopodia with distinctive nanoscale protrusions by osteogenic cells. Acta Biomater. 2017, 60, 339–349. [Google Scholar] [CrossRef]
  4. Dalby, M.J.; Gadegaard, N.; Oreffo, R.O.C. Harnessing nanotopography and integrin-matrix interactions to influence stem cell fate. Nat. Mater. 2014, 13, 558–569. [Google Scholar] [CrossRef] [PubMed]
  5. Ni, S.Y.; Sun, L.L.; Ercan, B.; Liu, L.T.; Ziemer, K.; Webster, T.J. A mechanism for the enhanced attachment and proliferation of fibroblasts on anodized 316L stainless steel with nano-pit arrays. J. Biomed. Mater. Res. B 2014, 102, 1297–1303. [Google Scholar] [CrossRef]
  6. Rosa, A.L.; Kato, R.B.; Raucci, L.M.S.C.; Teixeira, L.N.; de Oliveira, F.S.; Bellesini, L.S.; de Oliveira, P.T.; Hassan, M.Q.; Beloti, M.M. Nanotopography drives stem cell fate toward osteoblast differentiation through alpha 1 beta 1 integrin signaling pathway. J. Cell Biochem. 2014, 115, 540–548. [Google Scholar] [CrossRef]
  7. Variola, F.; Brunski, J.B.; Orsini, G.; de Oliveira, P.T.; Wazen, R.; Nanci, A. Nanoscale surface modifications of medically relevant metals: State-of-the art and perspectives. Nanoscale 2011, 3, 335–353. [Google Scholar] [CrossRef] [Green Version]
  8. Huang, T.B.; Li, Y.Z.; Yu, K.; Yu, Z.; Wang, Y.; Jiang, Z.W.; Wang, H.M.; Yang, G.L. Effect of the Wnt signal-RANKL/OPG axis on the enhanced osteogenic integration of a lithium incorporated surface. Biomater. Sci. 2019, 7, 1101–1116. [Google Scholar] [CrossRef]
  9. Rajendran, A.; Vinoth, G.; Nivedhitha, J.; Iyer, K.M.; Pattanayak, D.K. Ca-Ag coexisting nano-structured titania layer on Ti metal surface with enhanced bioactivity, antibacterial and cell compatibility. Mater. Sci. Eng. C Mater. Biol. Appl. 2019, 99, 440–449. [Google Scholar] [CrossRef]
  10. Dalby, M.J.; Gadegaard, N.; Tare, R.; Andar, A.; Riehle, M.O.; Herzyk, P.; Wilkinson, C.D.W.; Oreffo, R.O.C. The control of human mesenchymal cell differentiation using nanoscale symmetry and disorder. Nat. Mater. 2007, 6, 997–1003. [Google Scholar] [CrossRef]
  11. Vetrone, F.; Variola, F.; de Oliveira, P.T.; Zalzal, S.F.; Yi, J.H.; Sam, J.; Bombonato-Prado, K.F.; Sarkissian, A.; Perepichka, D.F.; Wuest, J.D.; et al. Nanoscale oxidative patterning of metallic surfaces to modulate cell activity and fate. Nano Lett. 2009, 9, 659–665. [Google Scholar] [CrossRef]
  12. Branemark, R.; Emanuelsson, L.; Palmquist, A.; Thomsen, P. Bone response to laser-induced micro- and nano-size titanium surface features. Nanomed. Nanotechnol. 2011, 7, 220–227. [Google Scholar] [CrossRef]
  13. Jimbo, R.; Coelho, P.G.; Bryington, M.; Baldassarri, M.; Tovar, N.; Currie, F.; Hayashi, M.; Janal, M.N.; Andersson, M.; Ono, D.; et al. Nano hydroxyapatite-coated implants improve bone nanomechanical properties. J. Dent. Res. 2012, 91, 1172–1177. [Google Scholar] [CrossRef] [Green Version]
  14. Rani, V.V.D.; Vinoth-Kumar, L.; Anitha, V.C.; Manzoor, K.; Deepthy, M.; Shantikumar, V.N. Osteointegration of titanium implant is sensitive to specific nanostructure morphology. Acta Biomater. 2012, 8, 1976–1989. [Google Scholar] [CrossRef]
  15. Thalji, G.; Gretzer, C.; Cooper, L.F. Comparative molecular assessment of early osseointegration in implant-adherent cells. Bone 2013, 52, 444–453. [Google Scholar] [CrossRef]
  16. Wazen, R.M.; Kuroda, S.; Nishio, C.; Sellin, K.; Brunski, J.B.; Nanci, A. Gene expression profiling and histomorphometric analyses of the early bone healing response around nanotextured implants. Nanomedicine (London, England) 2013, 8, 1385–1395. [Google Scholar] [CrossRef] [PubMed] [Green Version]
  17. Tavares, M.G.; Tambasco de Oliveira, P.; Nanci, A.; Hawthorne, A.C.; Rosa, A.L.; Xavier, S.P. Treatment of a commercial, machined surface titanium implant with H2SO4/H2O2 enhances contact osteogenesis. Clin. Oral. Implant. Res. 2007, 18, 452–458. [Google Scholar] [CrossRef]
  18. Brunski, J.B. In vivo bone response to biomechanical loading at the bone-dental implant interface. Adv. Dent. Res. 1999, 13, 99–119. [Google Scholar] [CrossRef]
  19. Haiat, G.; Wang, H.L.; Brunski, J. Effects of biomechanical properties of the bone-implant interface on dental implant stability: From in silico approaches to the patient’s mouth. Annu. Rev. Biomed. Eng. 2014, 16, 187–213. [Google Scholar] [CrossRef]
  20. de Barros, E.L.B.R.; Dias, A.P.; Ponce, K.J.; Wazen, R.; Brunski, J.B.; Nanci, A. Bone healing response in cyclically loaded implants: Comparing zero, one, and two loading sessions per day. J. Mech. Behav. Biomed. Mater. 2018, 85, 152–161. [Google Scholar] [CrossRef]
  21. de Oliveira, P.T.; Zalzal, S.F.; Beloti, M.M.; Rosa, A.L.; Nanci, A. Enhancement of in vitro osteogenesis on titanium by chemically produced nanotopography. J. Biomed. Mater. Res. A 2007, 80a, 554–564. [Google Scholar] [CrossRef]
  22. Ariganello, M.B.; Guadarrama Bello, D.; Rodriguez-Contreras, A.; Sadeghi, S.; Isola, G.; Variola, F.; Nanci, A. Surface nanocavitation of titanium modulates macrophage activity. Int. J. Nanomed. 2018, 13, 8297–8308. [Google Scholar] [CrossRef] [Green Version]
  23. Nanci, A.; Wuest, J.D.; Peru, L.; Brunet, P.; Sharma, V.; Zalzal, S.; McKee, M.D. Chemical modification of titanium surfaces for covalent attachment of biological molecules. J. Biomed. Mater. Res. 1998, 40, 324–335. [Google Scholar] [CrossRef]
  24. Wazen, R.M.; Currey, J.A.; Guo, H.; Brunski, J.B.; Helms, J.A.; Nanci, A. Micromotion-induced strain fields influence early stages of repair at bone–implant interfaces. Acta Biomater. 2013, 9, 6663–6674. [Google Scholar] [CrossRef] [PubMed] [Green Version]
  25. Nanci, A.; Zalzal, S.; Smith, C.E. Routine use of backscattered electron imaging to visualize cytochemical and autoradiographic reactions in semithin plastic sections. J. Histochem. Cytochem. 1990, 38, 403–414. [Google Scholar] [CrossRef] [Green Version]
  26. Brunner, E.; Puri, M.L. Nonparametric methods in factorial designs. Stat. Pap. 2001, 42, 1–52. [Google Scholar] [CrossRef]
  27. Variola, F.; Lauria, A.; Nanci, A.; Rosei, F. Influence of treatment conditions on the chemical oxidative activity of H2SO4/H2O2 mixtures for modulating the topography of titanium. Adv. Eng. Mater. 2009, 11, B227–B234. [Google Scholar] [CrossRef]
  28. Variola, F.; Zalzal, S.F.; Leduc, A.; Barbeau, J.; Nanci, A. Oxidative nanopatterning of titanium generates mesoporous surfaces with antimicrobial properties. Int. J. Nanomed. 2014, 9, 2319–2325. [Google Scholar] [CrossRef] [Green Version]
  29. Yi, J.-H.; Bernard, C.; Variola, F.; Zalzal, S.F.; Wuest, J.D.; Rosei, F.; Nanci, A. Characterization of a bioactive nanotextured surface created by controlled chemical oxidation of titanium. Surf. Sci. 2006, 600, 4613–4621. [Google Scholar] [CrossRef]
  30. Meyer, U.; Wiesmann, H.P.; Kruse-Losler, B.; Handschel, J.; Stratmann, U.; Joos, U. Strain-related bone remodeling in distraction osteogenesis of the mandible. Plast. Reconstr. Surg. 1999, 103, 800–807. [Google Scholar] [CrossRef]
  31. Rubin, C.T.; Mcleod, K.J. Promotion of bony ingrowth by frequency-specific, low-amplitude mechanical strain. Clin. Orthop. Relat. R 1994, 298, 165–174. [Google Scholar] [CrossRef]
  32. De Smet, E.; Jaecques, S.; Vandamme, K.; Vander Sloten, J.; Naert, I. Positive effect of early loading on implant stability in the bi-cortical guinea-pig model. Clin. Oral. Implan. Res. 2005, 16, 402–407. [Google Scholar] [CrossRef]
  33. Szmukler-Moncler, S.; Salama, H.; Reingewirtz, Y.; Dubruille, J.H. Timing of loading and effect of micromotion on bone-dental implant interface: Review of experimental literature. J. Biomed. Mater. Res. 1998, 43, 192–203. [Google Scholar] [CrossRef]
  34. Karazisis, D.; Petronis, S.; Agheli, H.; Emanuelsson, L.; Norlindh, B.; Johansson, A.; Rasmusson, L.; Thomsen, P.; Omar, O. The influence of controlled surface nanotopography on the early biological events of osseointegration. Acta Biomater. 2017, 53, 559–571. [Google Scholar] [CrossRef]
  35. Suva, L.J.; Seedor, J.G.; Endo, N.; Quartuccio, H.A.; Thompson, D.D.; Bab, I.; Rodan, G.A. Pattern of gene expression following rat tibial marrow ablation. J. Bone Min. Res. 1993, 8, 379–388. [Google Scholar] [CrossRef]
  36. Leucht, P.; Kim, J.B.; Wazen, R.; Currey, J.A.; Nanci, A.; Brunski, J.B.; Helms, J.A. Effect of mechanical stimuli on skeletal regeneration around implants. Bone 2007, 40, 919–930. [Google Scholar] [CrossRef] [Green Version]
  37. Wazen, R.M.; Brunski, J.B.; Currey, J.A.; Helms, J.A.; Leucht, P.; Nanci, A. Interfacial Tissue Response is Influenced by Local Strain Created During Implant Micromotion. J. Bone Miner. Res. 2008, 23, S234. [Google Scholar] [CrossRef]
  38. de Oliveira, P.T.; Nanci, A. Nanotexturing of titanium-based surfaces upregulates expression of bone sialoprotein and osteopontin by cultured osteogenic cells. Biomaterials 2004, 25, 403–413. [Google Scholar] [CrossRef]
  39. Naganuma, T. The relationship between cell adhesion force activation on nano/micro-topographical surfaces and temporal dependence of cell morphology. Nanoscale 2017, 9, 13171–13186. [Google Scholar] [CrossRef]
  40. Sartori, E.M.; das Neves, A.M.; Magro-Filho, O.; Mendonca, D.B.S.; Krebsbach, P.H.; Cooper, L.F.; Mendonca, G. The role of microRNAs in the osseointegration process. Int. J. Oral. Maxillofac. Implant. 2019, 34, 397–410. [Google Scholar] [CrossRef]
  41. Kagiya, T. MicroRNAs and osteolytic bone metastasis: The roles of microRNAs in tumor-induced osteoclast differentiation. J. Clin. Med. 2015, 4, 1741–1752. [Google Scholar] [CrossRef] [Green Version]
  42. Dong, S.W.; Yang, B.; Guo, H.F.; Kang, F. MicroRNAs regulate osteogenesis and chondrogenesis. Biochem. Bioph. Res. Co 2012, 418, 587–591. [Google Scholar] [CrossRef]
  43. Nakamura, Y.; Inloes, J.B.; Katagiri, T.; Kobayashi, T. Chondrocyte-specific microRNA-140 regulates endochondral bone development and targets Dnpep to modulate bone morphogenetic protein signaling. Mol. Cell Biol. 2011, 31, 3019–3028. [Google Scholar] [CrossRef] [Green Version]
Figure 1. Schematic illustrations of (A) each component of the micromotion device and (B,C) the bone plate positioned on the proximal tibia metaphysis. (B) The bone plate is placed using two Ti-alloy Retopins®. The implant is guided through the middle of the micromotion device. (C) A cap is screwed onto the motion device to hold the implant in place and to secure it against accidental motion due to animal activity. The cap contains a central hole, which allows the loading device to create implant displacement without removing the cap. (D) Mark-10 Force Gauge loading component.
Nanomaterials 10 02191 g001
Figure 2. Scanning electron micrographs of (A) the screw-shaped implant used and (B) the nanoporous topography created by oxidative nanopatterning. (C) Size distribution of the nanopores (n = 100).
Nanomaterials 10 02191 g002
Figure 3. Light microscope images of longitudinally oriented sections stained with hematoxylin and eosin, from (A) Nano Unloaded; (B) Nano Micromotion 1x and (C) Nano Micromotion 2x groups at 7 days post-surgery. New bone forms around the implants in all groups, including between the implant threads. However, signs of disruption of bone healing at the bone–implant interface were noticed in the Nano Micromotion 2x group. TB = trabecular bone in marrow space.
Nanomaterials 10 02191 g003
Figure 4. Histological representation of (A) bone formation area near the implant (BFAt) (area delimited by the yellow dashed lines) and BFAo (area delimited by the black dashed lines) and (B) bone-implant distance (BID) measurements (black lines). Note that the newly formed bone around the implants is trabecular (TB) and woven (WB) in appearance.
Nanomaterials 10 02191 g004
Figure 5. Scanning electron images taken using the backscatter mode showing the (A) Nano Unloaded; (B) Nano Micromotion 1x and (C) Nano Micromotion 2x groups at 7 days post-surgery. In the Nano Unloaded and Nano Micromotion 1x groups, trabecular bone (black) was found all around the implant, including between the threads (A,B). However, in the Nano Micromotion 2x group the region close to the implants exhibited only sporadic and thinner bone trabeculae (arrowheads) and was mainly occupied by fibrous tissue (asterisks) (C).
Nanomaterials 10 02191 g005
Figure 6. Histomorphometric analyses of bone formation in Nano Unloaded, Nano Micromotion 1x and Nano Micromotion 2x groups at 7 days post-surgery. The Nano Micromotion 2x group showed (A) overall lower BFAo; (B) lower bone-implant contact (BIC), and (C) larger BID compared to the other two groups. Asterisks indicate statistically significant differences.
Nanomaterials 10 02191 g006
Figure 7. Pie charts showing the distribution of biological process ontologies (BP) related to upregulated (A,C,E) and downregulated (B,D,F) differentially expressed genes (p < 0.05). (A,B) Nano Micromotion 2x group vs. Nano Micromotion 1x group; (C,D) Nano Micromotion 2x group vs. Nano Unloaded group, and (E,F) Nano Micromotion 1x group vs. Nano Unloaded group at day 7 post-surgery.
Nanomaterials 10 02191 g007
Table 1. Experimental groups and loading regimen.
GroupNumber of Implants 1
Histological-Histomorphometric Analysis 2Microarray Analysis 3
1Nano Unloaded-No Loading5 implants6 implants
2Nano Micromotion 1x-60 cycles/1x-day, 7 days5 implants6 implants
3Nano Micromotion 2x-60 cycles/2x-day, 7 days5 implants6 implants
1 28 animals were used for the full experiment. 2 10 animals were used for the histologic-histomorphometric analysis, and implants were placed bilaterally. As discussed in Section 2.6 of the Materials and Methods, from a total of 20 implants placed only 15 (5 implants per group) were used. 3 For the microarray analysis, 18 animals (6 implants per group) were used.
Table 2. p values of analyses. Bonferroni correction was applied for pairwise comparisons.
TestOverall
p-Value
Nano Unloaded vs Nano Micromotion 1xNano Unloaded vs Nano Micromotion 2xNano Micromotion 1x vs Nano Micromotion 2x
BFAtANOVA-type statistic0.43991.00000.75391.0000
BFAoANOVA-type statistic0.00120.69000.00540.0075
BICANOVA-type statistic0.00080.52440.00420.0051
BIDANOVA-type statistic0.00210.40500.00750.0009
Table 3. Summary of microarray analysis.
Summary of Microarray Analysis
GroupsTotal Number Differentially Expressed GenesTotal Number Upregulated GenesUpregulated Unknown and Unclassified GenesNumber Upregulated GenesTotal Number Downregulated GenesDownregulated Unknown and Unclassified GenesNumber Downregulated Genes
Nano Micromotion 2x vs. Nano Micromotion 1x:692319446415
Nano Micromotion 2x vs. Nano Unloaded29151501486
Nano Micromotion 1x vs. Nano Unloaded14880633
Publisher’s Note: MDPI stays neutral with regard to jurisdictional claims in published maps and institutional affiliations.

