Article

Metal Oxide Nanolayer-Decorated Epitaxial Graphene: A Gas Sensor Study

1
Applied Sensor Science Unit, IFM, Linköping University, 58183 Linköping, Sweden
2
Institute of Physics, University of Tartu, 50411 Tartu, Estonia
3
Department of Systems Engineering, Lab for Measurement Technology, Saarland University, 66123 Saarbrücken, Germany
*
Author to whom correspondence should be addressed.
Nanomaterials 2020, 10(11), 2168; https://doi.org/10.3390/nano10112168
Submission received: 8 October 2020 / Revised: 23 October 2020 / Accepted: 28 October 2020 / Published: 30 October 2020
(This article belongs to the Special Issue Nanostructured Gas Sensors)

Abstract

:
In this manuscript, we explore the sensor properties of epitaxially grown graphene on silicon carbide decorated with nanolayers of CuO, Fe3O4, V2O5, or ZrO2. The sensor devices were investigated in regard to their response towards NH3 as a typical reducing gas and CO, C6H6, CH2O, and NO2 as gases of interest for air quality monitoring. Moreover, the impact of operating temperature, relative humidity, and additional UV irradiation as changes in the sensing environment have been explored towards their impact on sensing properties. Finally, a cross-laboratory study is presented, supporting stable sensor responses, and the final data is merged into a simplified sensor array. This study shows that sensors can be tailored not only by using different materials but also by applying different working conditions, according to the requirements of certain applications. Lastly, a combination of several different sensors into a sensor array leads to a well-performing sensor system that, with further development, could be suitable for several applications where there is no solution on the market today.

Graphical Abstract

1. Introduction

It is estimated that people in North America and Europe spend 90% of their time indoors, where the air quality is usually worse than in outdoor air. Poor indoor air quality is responsible for about 4 million premature deaths and costs about USD5 trillion in welfare costs per year [1,2]. One of the main challenges is to have a sensor solution that is accurate and reliable enough, while also being affordable [3]. Another big challenge is the miniaturization of such gas sensors, with reliable selectivity, stability, and sensitivity [4]. Moreover, IDTechEx expects that the total market for environmental sensors will be over USD3.8 billion by 2030 [5].
Two-dimensional materials such as graphene have been shown to exhibit outstanding sensitivity if used as gas sensors [6]. However, to achieve sensitivity and selectivity to desired target analytes, the surface normally needs to be functionalized. Often, metals or metal oxides are used for the functionalization, as there is a wide range of well-studied materials, which are not only well known in the scientific community but also dominate in commercial sensor applications [7]. A well-designed sensor focuses on a specific application, and the optimal material/gas combination already leads to very good sensor performance. To further increase the sensitivity, the surface-to-volume ratio of the sensing layers can be increased, as a larger detection area per unit volume results in more material/gas interaction due to a higher adsorption of gas molecules per volume. Especially when thinking about a miniaturization of the whole sensor device, nanostructured materials are often used with highly sensitive materials to combine their advantages. For example, the combination of sensitive and more selective nanostructured metal oxides with very sensitive and low noise graphene leads to promising sensor hybrids. There, the gas reaction mainly takes place on the metal oxide nanostructure, and the graphene is used as a highly sensitive transducer [8,9]. In this work, we show that decorating an epitaxially grown graphene surface with continuous metal oxide nanolayers (NLs) can lead to increased sensitivity and selectivity towards different desired target gases. The choice of material is based on previous observations. For example, we have shown that using Fe3O4 or TiO2 nanoparticles to decorate epitaxial graphene has very promising results regarding sensitivity [10,11]. However, controlled coverage of the whole surface with an NL is much easier compared to controlling the distribution of nanoparticles. Moreover, epitaxially grown graphene was found to outperform commercially available CVD graphene when used as a transducer in a gas sensor and decorated with V2O5 [12]. ZrO2 is used in many catalytic applications, such as the lambda sensor, and CuO was also found to be a very promising material for gas sensors [13,14]. Furthermore, the influence of several environmental properties on sensor performance is evaluated. The aim of this study is to provide an overview of how different material combinations affect sensor performance for a selection of typical toxic AQ pollutants.

2. Materials and Methods

The graphene surface was epitaxially grown on silicon carbide (SiC) through a silicon sublimation process [15]. As a semi-insulating 4H-SiC (0001) substrate is used, no further transfer of the grown graphene lattice is needed. Gold on titanium (Ti/Au, 2/200 nm) contact pads are sputtered onto the surface, and the resistance between the contacts is measured as a sensor response in the final device. More detailed information about the growth parameters, sensor fabrication, and the gas mixing system can be found in our previous works [10,12]. Gas measurements were performed with different gas mixing systems at Linköping University (LiU) [16] and Saarland University (UdS) [17,18]. Both laboratories use gas bottles with a purity of 6.0, and the gas mixing systems are calibrated on flow rather than concentration by using calibrated mass flow controllers (MFCs). To test the influence of UV irradiation on sensor response, two different UV LEDs, with wavelengths of 265 nm (Sensor Electronic Technology Inc, Colombia, GA, USA, S-T39B-F1-265-01-1-050) and 355 nm (Roithner Lasertechnik GmbH, Vienna, Austria, XSL-355-3E-R6), were used separately to illuminate the sensor layers.
The pulsed laser deposition (PLD) process used in this work is described in [12]. Copper oxide (CuO), iron (Fe) foil, vanadium pentoxide (V2O5), and zirconium dioxide (ZrO2) have been used as target materials. A krypton fluoride (KrF) excimer laser COMPexPro 205 (Coherent GmbH, Germany) at a wavelength of 248 nm and laser fluences between 3–7 J/cm2 have been used for ablation. The number of laser pulses was adjusted to achieve a layer thickness of around 0.5–1 nm. The sensor substrates were kept at room temperature during deposition.
In this manuscript, pristine epitaxial graphene on SiC will be referred to as PEG and decorated epitaxial graphene as DEG.
As mentioned before, the sensor resistance is measured over time, and the response is defined as
R e s p o n s e = R g a s R 0 R 0 100 %
where Rgas is the saturated/absolute highest resistance signal during the gas exposure, and R0 corresponds to the baseline resistance before gas exposure.

3. Results

3.1. Morphological and Structural Characterization

Figure 1a shows Atomic Force Microscopy (AFM) images obtained before the decoration of the graphene surface with the different metal oxide NLs, and Figure 1b shows a summary for all four surfaces after the decoration. The observed morphologies of the NL-decorated sensor surfaces are not very different compared to each other and still show a similar surface roughness compared to the pristine epitaxially grown graphene sample on SiC. The dominating features belong to the step-bunching edges formed at the SiC surface during high-temperature graphene growth. This is expected, as tapping mode AFM in ambient conditions does not allow the resolution of atomic structure, and the different layers form continuous films of a few atomic layers in thickness (0.5–1 nm) on top of a very flat substrate.
To ensure that the integrity of the graphene lattice is still given after the surface decoration, Raman spectroscopy measurements have been performed (see Figure 2). For a better comparison, all spectra are normalized to the G peak. All spectra exhibit the typical G and 2D peaks around 1610 and 2737 cm−1, respectively [19]. The peak observed around 1350 cm−1 could be misinterpreted as the D peak, which is related to defects of the graphene lattice. Instead, these features, arising above 1280 cm−1 and extending into the G peak, are related to the interfacial buffer layer between the graphene and the SiC substrate [19]. The small full width at half maximum (FWHM) value of the 2D peak of the pristine graphene reference is an indication of a uniform monolayer of graphene [20]. After the surface decoration, the Raman spectrum stays approximately the same as the reference, indicating no induced structural damage. While the position of the 2D peak occurs at the same Raman shift for all samples, the G peak varies a bit for the different samples. It occurs at 1605 ± 10 cm−1. This could be due to different levels of doping in the graphene due to the charge transfer between the graphene and the various metal oxide decoration materials or simply due to different levels of strain in the graphene lattices [21]. It can also be seen that the 2D peaks broaden a bit after the surface decoration, and the ratios between G and 2D peaks slightly decrease. This could be related to some inclusions of bi- or multilayer graphene in the measured spot.

3.2. Gas Measurements

Ammonia (NH3) gas was used to generally study the response of the different hybrid sensors towards influences of operating temperature, relative humidity, and irradiation with UV light during the gas measurements. In addition, the sensor response to benzene (C6H6), formaldehyde (CH2O), nitrogen dioxide (NO2), and carbon monoxide (CO), i.e., gases of interest for, e.g., air quality monitoring, is discussed. The results were obtained over a period of about two years with the same sensors, showing that the sensors work without significant degradation during this time span if the operating temperature is kept at 150 °C or lower.

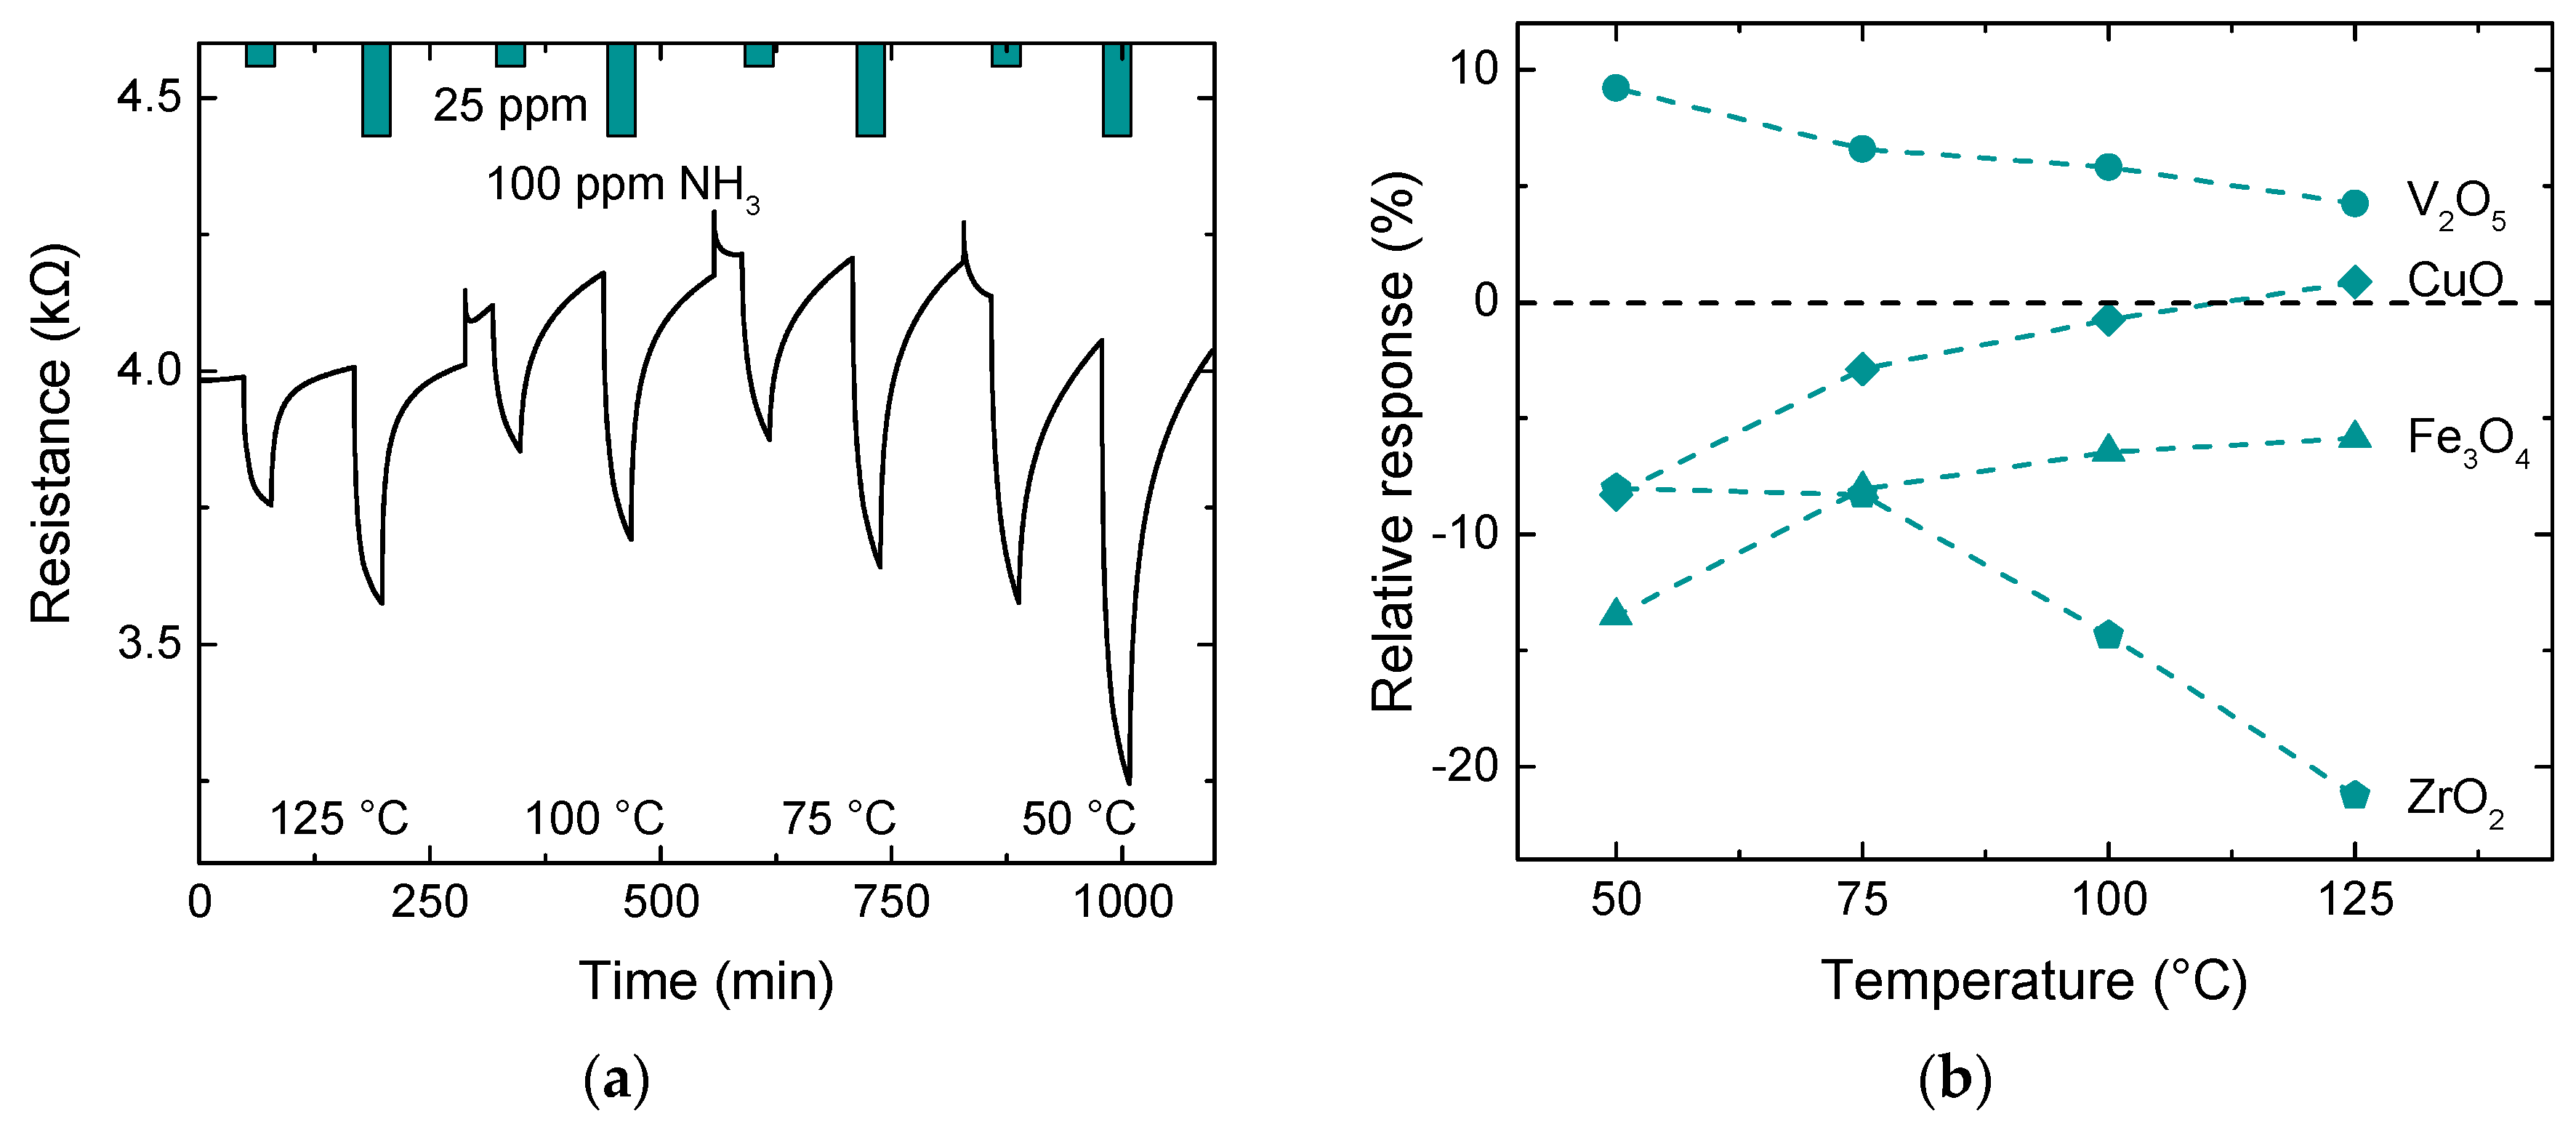
3.2.1. Influence of Operating Temperature

It is well known that the operating temperature of a sensing layer has a huge impact on the sensor response, especially when using metal oxides or catalytic metals [22]. The sensor response was tested at several rather low temperatures, as the current sensor packaging limits the operating temperature to 200 °C. Therefore, no temperature above 150 °C was used.
All sensors have been tested at 125, 100, 75, and 50 °C at 50% relative humidity (RH) and exposed to 25 and 100 ppm NH3. Each exposure lasted for 30 min, with a relaxation phase of 90 min in between exposures, where the system was purged with synthetic air as background gas (80/20–N2/O2), also at 50% RH. The resistance over time is exemplarily shown for the Fe3O4 NL DEG sensor in Figure 3a, and the results for all sensors towards 25 ppm are shown in Figure 3b. The sharp peaks in resistance when changing temperatures are due to an overshoot in the temperature control mechanism. The highest observed absolute responses for each sample are highlighted in bold. It can be clearly seen that an increase in operating temperature does not always mean an increase in sensor response. Only ZrO2 has its highest response at 125 °C, while all other sensors exhibit their highest response at 50 °C. However, this rather untypical behavior with increasing temperature could be due to a reaction with OH groups or be products of reactions from OH groups and NH3 instead, leading to a higher overall response at the lower temperature, which is not necessarily related only to the NH3 exposure itself. This phenomenon was shown to occur for metal oxide gas sensors when operating them at relatively low temperatures in a humid environment [23,24]. While a higher sensor response is normally desired, the conditions at which this occurs may impose other disadvantages like higher time constants or a less stable sensor baseline. A perfect example of this behavior can be clearly seen in Figure 3a, as only exposures at 125 °C come close to a steady-state sensor response during the 30 min gas exposure. τ63 is extrapolated for all four operating temperatures using an exponential fit. It continuously increases, from approximately 150 s at 125 °C up to 550 s at 50 °C on average. Furthermore, the sensors are not always able to relax back to the baseline after 90 min when operated at lower temperatures. As a compromise between the level of response, response shape, and relaxation, all further measurements with ammonia were conducted at 75 °C except for ZrO2, which was operated at 125 °C. The overall highest response was observed for ZrO2 with a change of −21.2% for 25 ppm NH3 at 125 °C. Moreover, ZrO2 and Fe3O4 NL DEG sensors exhibit n-type behavior, i.e., resistance is reduced during exposure to reducing gases, while V2O5 exhibits p-type behavior. Presumably, this difference is due to different charge transfers between the metal oxide layer and the graphene, which will depend on the work function difference between the materials. CuO, on the other hand, shows a positive response at 125 °C and then switches to a negative response at lower temperatures. This change can also be induced at 125 °C when using a higher concentration (100 ppm) instead. The reason for this change in response direction is likely due to increasing gas adsorption, resulting in sufficient electrons being donated to the graphene for the Fermi level to move from below the Dirac point (p-type conductivity) to above the Dirac point (n-type conductivity). The change with temperature could also partly explain why the absolute response increases with lower temperatures as temperature and NH3 concentration work against each other in terms of charge carrier generation.
Other gases like benzene or formaldehyde, both volatile organic compounds (VOC), on the other hand, normally require a higher temperature to interact with the sensor surface. In a dry ambient, the four sensors were exposed to 200 ppb of C6H6 and CH2O at 50, 100, and 150 °C. Only CuO DEG was able to detect gas pulses down to 50 °C. While the ZrO2 DEG sensors showed a response only at 150 °C, Fe3O4 and V2O5 DEG sensors also exhibited a response at 100 °C.

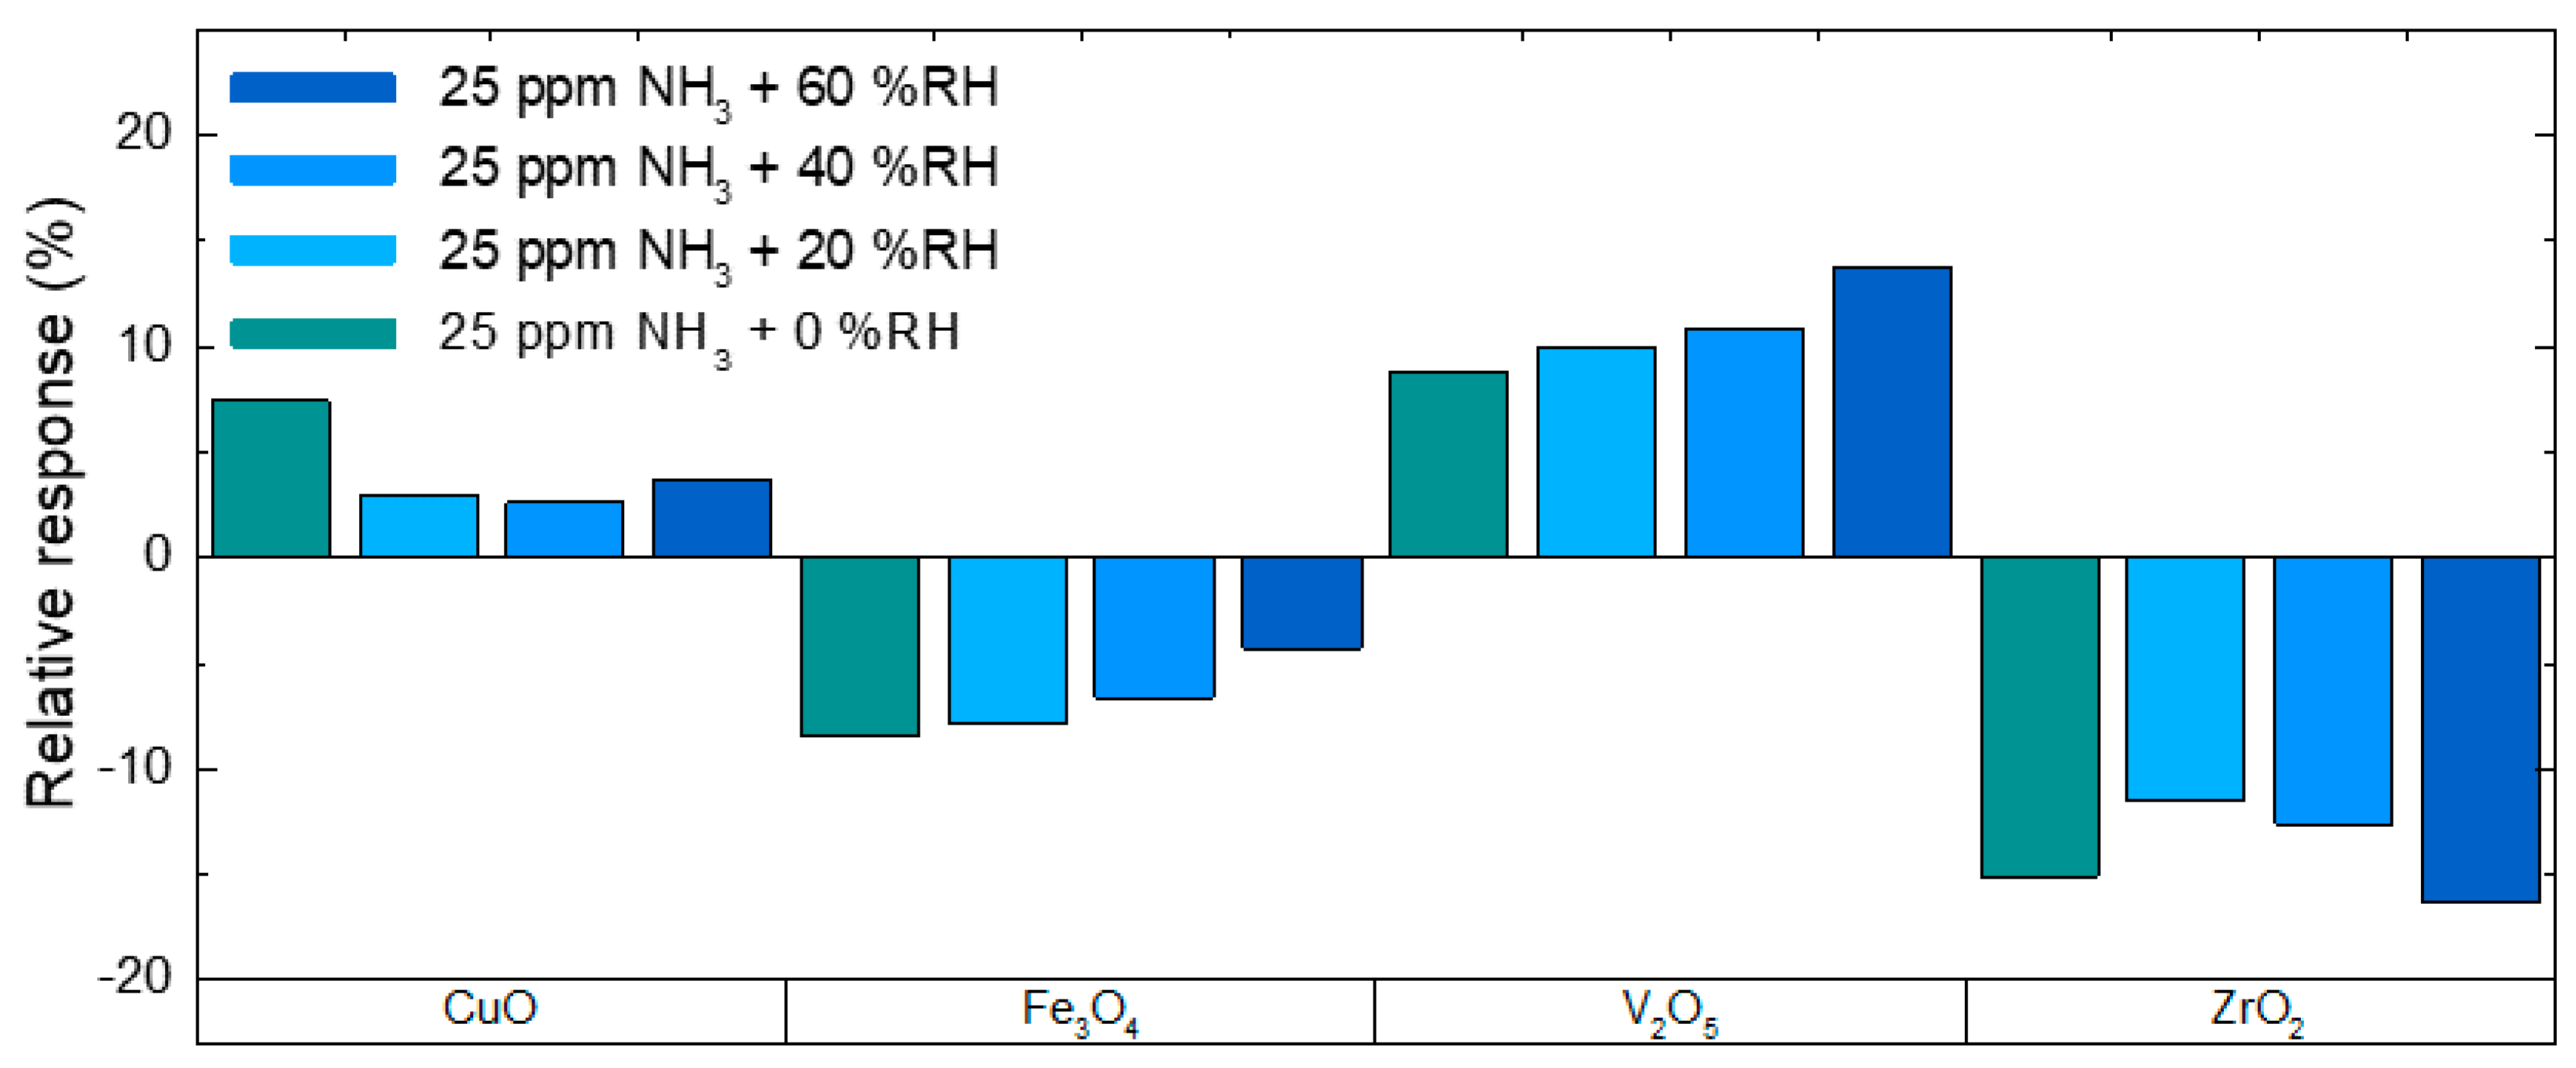
3.2.2. Influence of Relative Humidity

Besides the operating temperature, relative humidity in the ambient can be another critical parameter for sensor response. It was shown that many metal oxides exhibit a cross-sensitivity towards RH, and a higher level of RH in the ambient usually results in a lower gas sensitivity, as the target gas molecules compete with water molecules for available adsorption sites.
Figure 4 summarizes the response magnitudes for all four NL DEG sensors towards 30 min exposures of 25 ppm NH3 at different levels of RH. The sensors were tested at approximately 0%, 20%, 40%, and 60% RH, and the operating temperature was kept at 125 °C (ZrO2) and 75 °C (all other NLs), respectively. Comparing the response at 0% to 20% RH, all sensors exhibit a decrease in response except V2O5, which not only increases for the first 20% RH but progressively increases from 8.8% at 0% RH to 13.8% at 60% RH. On the contrary, the response of the Fe3O4 NL DEG sensor decreases progressively with an increase in humidity, from initially −8.4% at 0% RH down to −4.3% at 60% RH. CuO, on the other hand, starts with a decrease in response for the first 20% RH but then stays almost constant for 40% and 60% RH. After the first drop in response at 20% RH compared to 0% RH, the ZrO2 NL DEG sensor increases its response for 40% and 60% RH again, eventually exceeding the response observed at 0% RH. This increase in response with an increase of relative humidity in the environment could be due to an additional sensor reaction with OH groups or with products resulting from reactions of OH groups with NH3, which can occur for metal oxide gas sensors when operated in a humid environment at relatively low temperatures [23,24]. An analysis of the change in baseline resistance due to the change in relative humidity can be found in the supplementary material (compare Table S1).
Table 1 summarizes several measurements of all sensors towards all measured gases when exposed in a dry (0% RH; <5 ppm H2O for gas from gas bottles (6.0) and <63.2 ppm for gas from a 0-air generator; see Section 3.3) or a humid (25% or 50% RH) environment. The measurements were performed in different laboratories, and the differences are discussed in Section 3.3. In this section, we show only one value per gas. All measurements were performed at 150 °C operating temperature, and the response was measured after 30 min of exposure. It can be clearly seen that the introduction of relative humidity can have a severe effect on the measured sensor response, e.g., no sensor was able to detect CO, C6H6, or CH2O in the presence of humidity. Similar to the observations for NH3, relative humidity enhances or hinders the response towards NO2. It greatly increases the response for V2O5 by almost 50% but only marginally increases it for ZrO2 by about 8% of the original response. The high response of the Fe3O4 NL DEG sensor decreases by about one-third. The response for CuO does not only decrease strongly, but it also changes direction from an increase in resistance towards NO2 exposure to a decrease in resistance if relative humidity is added. This is similar to what was observed for this sensor when exposed to NH3 + 50% RH at a temperature below 125 °C.

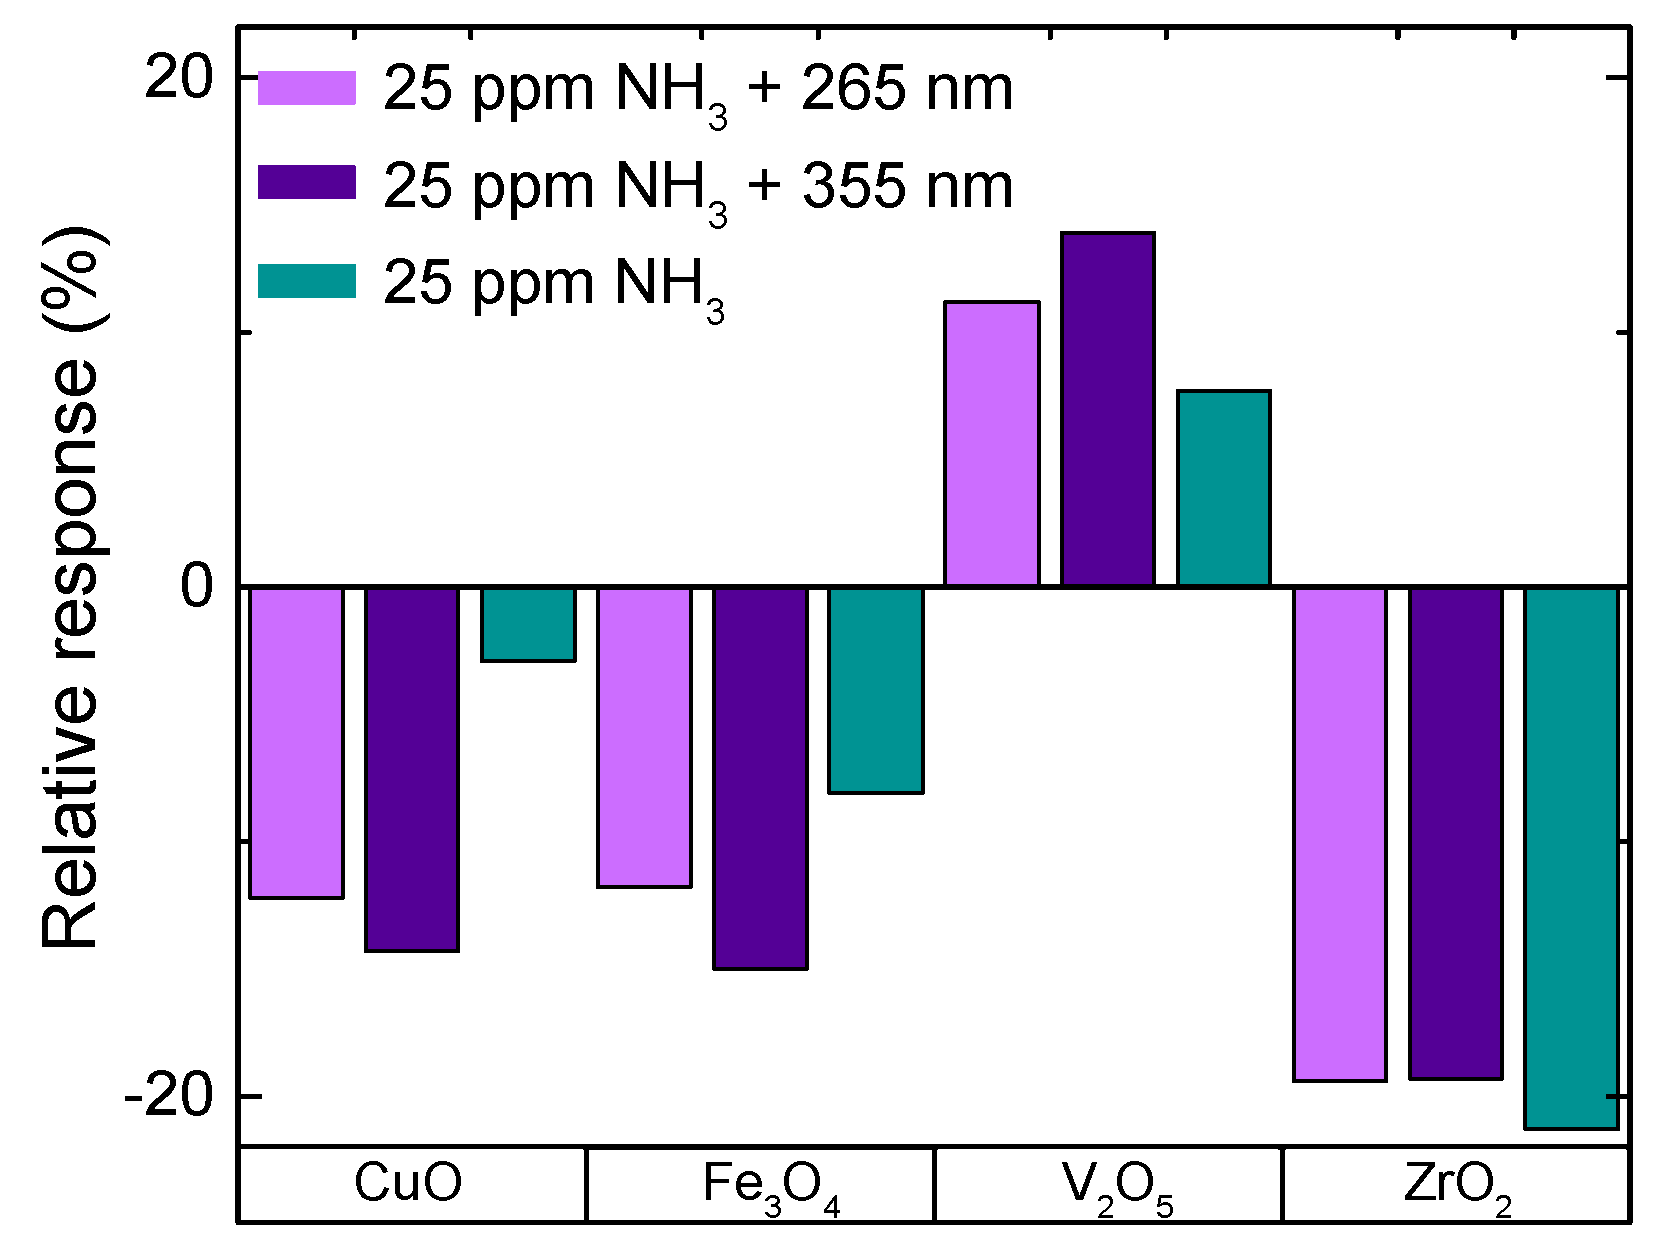
3.2.3. Influence of UV Irradiation

The sensitivity of a chemical gas sensor was shown to be enhanced through UV irradiation for many different material/gas combinations, and, normally, the irradiation also decreases time constants, hence speeding up the sensor response [25]. Moreover, it was shown that UV irradiation can be used to clean graphene surfaces, thus freeing active sites for a target gas interaction [26]. Through the irradiation with light, photons can react with the target gas or the sensing material, which depends on the possibility of adsorbing photons at the given photon energy. Therefore, certain wavelengths work best for a given material/gas combination, and longer wavelengths will not have an effect at all.
Figure 5 summarizes the responses towards a 30 min exposure of 25 ppm NH3 at 50% RH without and with the influence of UV irradiation. The sensors were operated at 75 °C except for ZrO2, which was operated at 125 °C. A clear trend can be observed as the relative sensor response is highest with 355 nm UV irradiation and decreases with no irradiation for all sensors except ZrO2. For ZrO2, on the other hand, a small decrease is observed with UV irradiation (−19.3%) compared to −21.3% without irradiation. When changing the UV irradiation from 355 to 265 nm, the sensor response decreases slightly. Both wavelengths have a strong impact on the time constants, which are lower with additional UV light compared to no irradiation. With UV irradiation, the time constants range between 350–500 s, whereas without irradiation, they go up to 550–1000 s. In contrast to the small effect on the response when adding UV irradiation, the ZrO2 DEG sensor shows the highest enhancement in time constant from 1000 s down to 450 s.
The complete sensing mechanism of DEG is not fully understood yet, and the introduction of one more variable like UV irradiation results in additional complexity. It is known that if the bandgap is below the photon energy (e.g., 3.49 eV for 355 nm), there will be charge excitation, changing the charge density in the surface modification and graphene as well [25]. This effect should be more distinct for thicker surface layers. This is in agreement with the observation that only ZrO2, with its comparably large bandgap (>5 eV), shows no significant difference in response magnitude under UV irradiation, while all other sensors did exhibit a significant difference (CuO ≈ 1.4 eV, Fe3O4 ≈ 3 eV, and V2O5 ≈ 2.4 eV).

3.3. Interlab Studies

To verify that measurements performed are valid regardless of the lab-setting, some measurements were first performed in the gas sensing lab at Linköping University (LiU) and then repeated in another lab at Saarland University (UdS). All measurements were performed at 150 °C operating temperature, but the tested gas concentrations and levels of relative humidity were not always the same due to some restrictions of the respective systems. For example, the level of humidity and the gas concentrations changed between 25% RH and 200 ppb for LiU and 50% RH and 500 ppb for UdS, respectively. This means that a higher sensor response is expected for measurements performed at UdS as a higher concentration was used. Nevertheless, we tried to keep everything as close as possible to support the comparison. Measurements that did not show a response at both labs are not included (e.g., CH2O with humidity; compare Section 3.2.2). An overview of the comparison is given in Table 2. If exposed to C6H6 and CH2O, the response measured at UdS is lower for all sensors except for V2O5. Especially for the CuO DEG sensor, the response varies a lot. The reported response for ZrO2 towards C6H6 was only observed at LiU, but the response (0.02%) was very small. Therefore, the measurements conducted with VOCs do not result in a clear outcome for the interlab studies. On the other hand, measurements with exposures towards NO2 show the same trend for three of the four sensors: the response increases with an increase in concentration and decreases with the introduction of relative humidity, indicating that the sensors show very similar performance at both laboratories. The only exception is the exposure of the CuO NL towards 200 ppb at 25% RH at LiU, where the response direction changed compared to the exposure at 0% RH or towards 500 ppb at 50% RH at UdS, which could be explained by the competing effects of NO2 and RH on the sensor surface.
The single standard deviation of the baseline resistance was used as an indicator of noise. Since a similar electronic setup was used in both labs, there is no distinct trend in the noise level between the labs. The standard deviation stayed below 0.1 Ω for all sensors, leading to a worst-case relative noise level of approximately 0.007%. This highly depends on the baseline resistance of the different sensors, which varied between 1.5 to 3.2 kΩ. With the ZrO2 DEG sensor, the relative baseline noise was even 10 times lower.
Additional deviations could come from the uncertainties in concentration from the gas bottles, as each bottle, even with a purity of 6.0, has an approximate error range in concentration of up to ±10%. This alone can have a major impact on the observed sensor response. Another problem could come from the administered flows from the MFCs, although this is rather unlikely as only calibrated MFCs are used and frequently reassessed. Moreover, the background gas (purity of 6.0) used for mixing of test gases still contains approximately 1 ppm of contaminants, or the system could be contaminated by prior gas tests [28]. This can especially influence the comparison between both labs as the background gas at LiU is mixed from gas bottles (N2 and O2), while the background gas at UdS comes from a 0-air generator. Since only relative responses and not absolute values are compared, the comparison is still valid. A variation due to the very small difference in background humidity is not expected (compare Section 3.2.2).
Nevertheless, we think that interlab studies should be conducted to verify sensor performances, at least qualitatively, and to raise awareness that published results may only be accurate for the specific setup used for the investigation, which itself can have an influence on sensor response. Indepth studies, comparing their gas measurements with certified labs, have shown that even there, unexpected deviations can occur, which opens the possibility for more insight into sensor behavior [29,30]. Unfortunately, round-robin testing, which is the standard in analytical chemistry to ensure that experimental procedures are correct, is still not applied in the field of chemical sensor research [31,32].

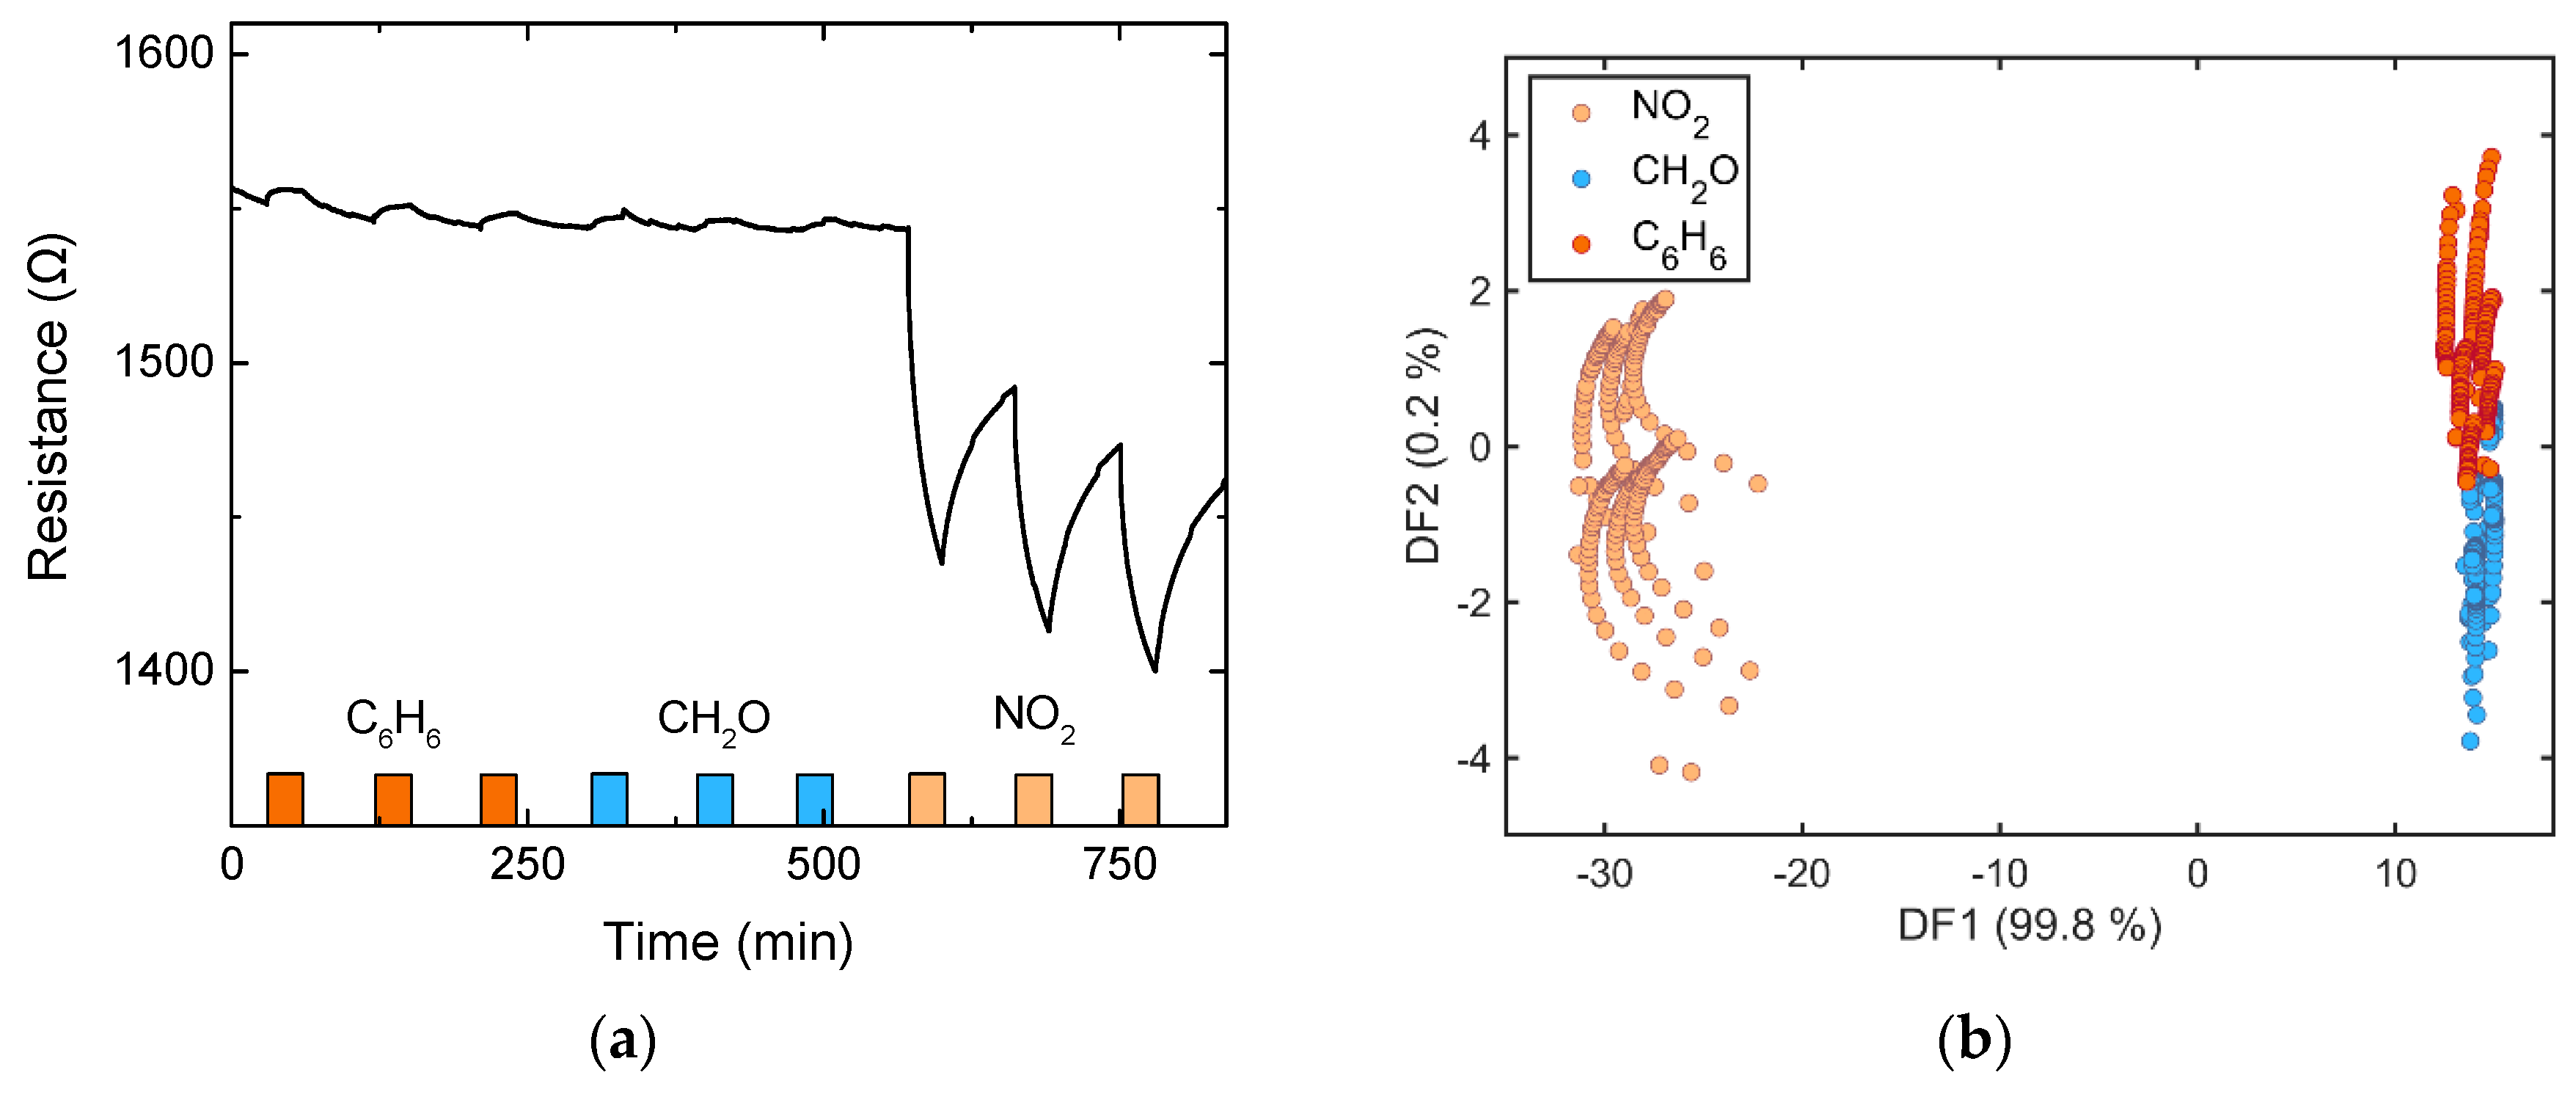
3.4. Data Analysis/Multisensor Array

As we have seen in the earlier sections, the different NL DEG sensors respond differently to different gases and environmental influences. This is summarized in Table 3. If the gas has the addition “+RH”, either 25% or 50% RH was used, which did not matter for the direction of response in this case. The addition “+UV” means that the measurement was performed with 355 nm UV LED and at 50% RH.
However, one sensor alone would not be able to distinguish between different gases very effectively. Therefore, using a sensor array with all or some of the used sensors could lead to a better classification of exposed gases [33]. A simple LDA (linear discriminant analysis) [34] was used to differentiate between three gases (C6H6, CH2O, and NO2) applied to all sensors during several single gas exposures at 0% RH. Each gas was applied three times, with a concentration of 200 ppb and a sensor operating temperature of 150 °C. The gas cycle was repeated twice, resulting in six exposures per gas in total. DAV3E, a MATLAB toolbox [35], was used to calculate an LDA scatter plot based on each measurement point during the exposure of each sensor. Each measurement point is used as this is exactly what would happen if the sensors are used in a real setup, where the resistance over time is measured and gas exposures need to be determined. For better clarity, however, only every 50th point is plotted. The first five seconds of each exposure are neglected due to time constants of the gas mixing system. The result of this LDA is shown in Figure 6. As expected, it is rather easy to discriminate between NO2 and the two VOCs, as the response towards NO2 is much higher in comparison. It is harder, but still not impossible, to discriminate between benzene and formaldehyde. This example is very much oversimplified as, for example, similar concentrations of different gases might give very different magnitudes of response (e.g., NO2 vs. VOCs). Another problem is the high time constants of the sensor, and, therefore, each measurement point was used and not the slope of the change of the signal during exposure. One way to overcome this issue would be the application of cycled methods like temperature cycled operation (TCO) to create steep changes and more transient data for evaluation [33,36,37]. A more extensive data set with different gases, concentration levels, and combined gas exposures would be needed to make a proper statement about the applicability of these exact four sensors to real-world applications, which, in turn, would be highly application-dependent.

4. Conclusions

In conclusion, we have shown that nanolayer-decorated epitaxial graphene sensors perform differently depending on the decoration material used and the measurement conditions. Increased operating temperature and level of relative humidity were found to either increase or decrease the sensor response towards NH3, depending on the material. Moreover, illumination with UV light, in general, results in increased sensor response and decreased time constants, although some decoration materials are not significantly affected by UV. Investigating gases of interest for AQM, the influence of relative humidity is large as it inhibits the response towards C6H6, CH2O, and CO completely, at least at the low concentrations tested here. Comparing the sensors in an interlab study, the responses vary strongly for the measured VOCs but stay very comparable for NO2. This could indicate significant variations in either the concentrations of the source gases or, more likely, the concentrations of impurities in the source gas bottles, which, in turn, is an important aspect to consider for sensor calibration. Combining all four sensors into a sensor array, it was possible to distinguish between C6H6, CH2O, and NO2 in a dry ambient using an LDA.

Supplementary Materials

The following are available online at https://www.mdpi.com/2079-4991/10/11/2168/s1, Table S1: Summary of changes of baseline resistance with varying relative humidity.

Author Contributions

Conceptualization, M.R. and J.E.; methodology, M.R. and M.K.; software, M.R.; validation, M.R.; formal analysis, M.R.; investigation, M.R., A.I. and M.K.; resources, R.J. and A.S.; data curation, M.R.; writing—original draft preparation, M.R.; writing—review and editing, M.R., A.I., M.K., R.J., A.S. and J.E.; visualization, M.R.; supervision, J.E.; project administration, J.E.; funding acquisition, J.E. and R.J. All authors have read and agreed to the published version of the manuscript.

Funding

This research was funded by the Swedish Foundation for Strategic Research (SSF) through the grants GMT14-0077 and RMA15-024, as well as by the Estonian Ministry of Education and Research (institutional grant IUT34-27) and HORIZON 2020 Project No. 881603.

Acknowledgments

The authors would like to thank Professor Rositsa Yakimova and Ivan G. Ivanov from the Semiconductor Materials Division at Linköping University, Sweden, for the provision of pristine epitaxial graphene and the collection of Raman spectra, respectively, and Tobias Baur from the Lab for Measurement Technology at Saarland University, Germany, for helpful discussions regarding the usage of DAV3E.

Conflicts of Interest

The authors declare no conflict of interest. The funders had no role in the design of the study; in the collection, analyses, or interpretation of data; in the writing of the manuscript, or in the decision to publish the results.

References

  1. World Health Organisation. WHO Social Media Toolkit for Air Pollution and Child Health: Prescribing Clean Air Launch; WHO: Geneva, Switzerland, 2018. [Google Scholar]
  2. The World Bank. The Cost of Air Pollution: Strengthening the Economic Case for Action; World Bank: Washington, DC, USA, 2016. [Google Scholar]
  3. Szulczyński, B.; Gębicki, J. Currently commercially available chemical sensors employed for detection of volatile organic compounds in outdoor and indoor air. Environments 2017, 4, 21. [Google Scholar] [CrossRef] [Green Version]
  4. Spinelle, L.; Gerboles, M.; Kok, G.; Persijn, S.; Sauerwald, T. Review of portable and low-cost sensors for the ambient air monitoring of benzene and other volatile organic compounds. Sensors 2017, 17, 1520. [Google Scholar] [CrossRef] [PubMed] [Green Version]
  5. Jiang, L. Environmental Gas Sensors 2020–2030: Technologies, Manufacturers, Forecasts; IDTechEx: Boston, MA, USA, 2020. [Google Scholar]
  6. Anichini, C.; Czepa, W.; Pakulski, D.; Aliprandi, A.; Ciesielski, A.; Samorì, P. Chemical sensing with 2D materials. Chem. Soc. Rev. 2018, 47, 4860–4908. [Google Scholar] [CrossRef] [PubMed] [Green Version]
  7. Malik, R.; Tomer, V.K.; Mishra, Y.K.; Lin, L. Functional gas sensing nanomaterials: A panoramic view. Appl. Phys. Rev. 2020, 7. [Google Scholar] [CrossRef] [Green Version]
  8. Meng, F.L.; Guo, Z.; Huang, X.J. Graphene-based hybrids for chemiresistive gas sensors. TrAC–Trends Anal. Chem. 2015, 68, 37–47. [Google Scholar] [CrossRef]
  9. Gupta Chatterjee, S.; Chatterjee, S.; Ray, A.K.; Chakraborty, A.K. Graphene-metal oxide nanohybrids for toxic gas sensor: A review. Sens. Actuators B Chem. 2015, 221, 1170–1181. [Google Scholar] [CrossRef]
  10. Rodner, M.; Puglisi, D.; Ekeroth, S.; Helmersson, U.; Shtepliuk, I.; Yakimova, R.; Skallberg, A.; Uvdal, K.; Schütze, A.; Eriksson, J. Graphene decorated with iron oxide nanoparticles for highly sensitive interaction with volatile organic compounds. Sensors 2019, 19, 918. [Google Scholar] [CrossRef] [Green Version]
  11. Rodner, M.; Bahonjic, J.; Mathisen, M.; Gunnarsson, R.; Ekeroth, S.; Helmersson, U.; Ivanov, I.G.; Yakimova, R.; Eriksson, J. Performance tuning of gas sensors based on epitaxial graphene on silicon carbide. Mater. Des. 2018, 153, 153–158. [Google Scholar] [CrossRef]
  12. Kodu, M.; Berholts, A.; Kahro, T.; Eriksson, J.; Yakimova, R.; Avarmaa, T.; Renge, I.; Alles, H.; Jaaniso, R. Graphene-based ammonia sensors functionalised with sub-monolayer V2O5: A comparative study of chemical vapour deposited and epitaxial graphene. Sensors 2019, 19, 951. [Google Scholar] [CrossRef] [Green Version]
  13. Eschnauer, H.R. Pollution reduction in motor car exhaust gases by regulation of the fuel mixture with the lambda-sensor. In Anthropogenic Platinum-Group Element Emissions: Their Impact on Man and Environment; Zereini, F., Alt, F., Eds.; Springer: Berlin/Heidelberg, Gremany, 2000; pp. 285–291. ISBN 978-3-642-59678-0. [Google Scholar]
  14. Samarasekara, P.; Kumara, N.T.R.N.; Yapa, N.U.S. Sputtered copper oxide (CuO) thin films for gas sensor devices. J. Phys. Condens. Matter 2006, 18, 2417–2420. [Google Scholar] [CrossRef]
  15. Yakimova, R.; Virojanadara, C.; Gogova, D.; Syväjärvi, M.; Siche, D.; Larsson, K.; Johansson, L.I. Analysis of the formation conditions for large area epitaxial graphene on SiC substrates. Mater. Sci. Forum 2010, 645–648, 565–568. [Google Scholar] [CrossRef] [Green Version]
  16. Lloyd Spetz, A.; Andersson, M. Technology and application opportunities for SiC-FET gas sensors. In Solid State Gas Sensors–Industrial Application; Fleischer, M., Lehmann, M., Eds.; Springer: Berlin/Heidelberg, Germany, 2011; pp. 189–214. ISBN 978-3-642-28092-4. [Google Scholar]
  17. Helwig, N.; Schüler, M.; Bur, C.; Schütze, A.; Sauerwald, T. Gas mixing apparatus for automated gas sensor characterization. Meas. Sci. Technol. 2014, 25, 055903. [Google Scholar] [CrossRef]
  18. Leidinger, M.; Schultealbert, C.; Neu, J.; Schütze, A.; Sauerwald, T. Characterization and calibration of gas sensor systems at ppb level–A versatile test gas generation system. Meas. Sci. Technol. 2018, 29. [Google Scholar] [CrossRef] [Green Version]
  19. Lee, D.S.; Riedl, C.; Krauss, B.; Von Klitzing, K.; Starke, U.; Smet, J.H. Raman spectra of epitaxial graphene on SiC and of epitaxial graphene transferred to SiO2. Nano Lett. 2008, 8, 4320–4325. [Google Scholar] [CrossRef] [Green Version]
  20. Ferrari, A.C. Raman spectroscopy of graphene and graphite: Disorder, electron-phonon coupling, doping and nonadiabatic effects. Solid State Commun. 2007, 143, 47–57. [Google Scholar] [CrossRef]
  21. Bouhafs, C.; Zakharov, A.A.; Ivanov, I.G.; Giannazzo, F.; Eriksson, J.; Stanishev, V.; Kühne, P.; Iakimov, T.; Hofmann, T.; Schubert, M.; et al. Multi-scale investigation of interface properties, stacking order and decoupling of few layer graphene on C-face 4H-SiC. Carbon. N. Y. 2017, 116, 722–732. [Google Scholar] [CrossRef] [Green Version]
  22. Barsan, N.; Koziej, D.; Weimar, U. Metal oxide-based gas sensor research: How to? Sens. Actuators B Chem. 2007, 121, 18–35. [Google Scholar] [CrossRef]
  23. Barsan, N.; Weimar, U. Conduction model of metal oxide gas sensors. J. Electron. 2001, 7, 143–167. [Google Scholar] [CrossRef]
  24. Dickey, E.C.; Varghese, O.K.; Ong, K.G.; Gong, D.; Paulose, M.; Grimes, C. A room temperature ammonia and humidity sensing using highly ordered Nanoporous alumina films. Sensors 2002, 2, 91–110. [Google Scholar] [CrossRef] [Green Version]
  25. Espid, E.; Taghipour, F. UV-LED photo-activated chemical gas sensors: A review. Crit. Rev. Solid State Mater. Sci. 2017, 42, 416–432. [Google Scholar] [CrossRef]
  26. Berholts, A.; Kahro, T.; Floren, A.; Alles, H.; Jaaniso, R. Photo-activated oxygen sensitivity of graphene at room temperature. Appl. Phys. Lett. 2014, 105. [Google Scholar] [CrossRef]
  27. Rodner, M.; Icardi, A.; Kodu, M.; Jaaniso, R.; Eriksson, J. Metal oxide nanolayer decorated epitaxial Graphene gas sensors for Air quality Monitoring. In Proceedings of the SMSI 2020 Conference–Sensor and Measurement Science International, Nuremberg, Germany, 22–25 June 2020; pp. 129–130. [Google Scholar]
  28. Schütze, A.; Baur, T.; Leidinger, M.; Reimringer, W.; Jung, R.; Conrad, T.; Sauerwald, T. Highly sensitive and selective voc sensor systems based on semiconductor gas sensors: How to? Environments 2017, 4, 20. [Google Scholar] [CrossRef] [Green Version]
  29. Bastuck, M.; Baur, T.; Richter, M.; Mull, B.; Schütze, A.; Sauerwald, T. Comparison of ppb-level gas measurements with a metal-oxide semiconductor gas sensor in two independent laboratories. Sens. Actuators B Chem. 2018, 273, 1037–1046. [Google Scholar] [CrossRef]
  30. Sauerwald, T.; Baur, T.; Leidinger, M.; Reimringer, W.; Spinelle, L.; Gerboles, M.; Kok, G.; Schütze, A. Highly sensitive benzene detection with metal oxide semiconductor gas sensors—An inter-laboratory comparison. J. Sens. Sens. Syst. 2018, 7, 235–243. [Google Scholar] [CrossRef] [Green Version]
  31. Buttner, W.; Burgess, R.; Rivkin, C.; Post, M.; Boon-Brett, L.; Black, G.; Harskamp, F.; Moretto, P. Round robin Testing of commercial hydrogen sensor performance—Observations and results: Preprint. In Proceedings of the National Hydrogen Association Conference and Expo, Long Beach, CA, USA, 3–6 May 2010. [Google Scholar]
  32. Moritz, A.; Breuer, D. Production of test gases in the ppb range for round-robin tests and quality assurance measures during the measurement of VOCs. J. Environ. Monit. 2008, 10, 1454–1459. [Google Scholar] [CrossRef] [PubMed]
  33. Reimann, P.; Schütze, A. Sensor arrays, Virtual multisensors, data fusion, and Gas sensor data evaluation. In Springer Series on Chemical Sensors and Biosensors; Springer: Berlin/Heidelberg, Germany, 2014; Volume 15, pp. 67–107. ISBN 978-3-642-54518-4. [Google Scholar]
  34. Duda, R.; Hart, P.; Stork, D. Pattern Classification; John Wiley & Sons: Hoboken, NY, USA, 2001. [Google Scholar]
  35. Bastuck, M.; Baur, T.; Schütze, A. DAV3E–A MATLAB toolbox for multivariate sensor data evaluation. Sensors 2018, 489–506. [Google Scholar]
  36. Bur, C.; Bastuck, M.; Puglisi, D.; Schütze, A.; Lloyd Spetz, A.; Andersson, M. Discrimination and quantification of volatile organic compounds in the ppb-range with gas sensitive SiC-FETs using multivariate statistics. Sens. Actuators B Chem. 2015, 214, 25–233. [Google Scholar] [CrossRef] [Green Version]
  37. Bastuck, M. Improving the Performance of Gas Sensor Systems with Advanced Data Evaluation, Operation, and Calibration Methods; Linköping University: Linköping, Sweden, 2019. [Google Scholar]
Figure 1. AFM images of pristine epitaxial graphene (PEG) (a) before and (b) after the decoration with nanolayers (NLs).
Nanomaterials 10 02168 g001
Figure 2. Raman spectra for PEG and after NL decoration.
Nanomaterials 10 02168 g002
Figure 3. (a) Resistance over time of Fe3O4 NL decorated epitaxial graphene (DEG) vs. 25 and 100 ppm NH3 at different operating temperatures at 50% relative humidity (RH) and (b) relative responses of NL DEG samples for 25 ppm NH3 exposures at different operating temperatures at 50% RH.
Nanomaterials 10 02168 g003
Figure 4. Relative responses of NL DEG samples for 25 ppm NH3 exposures at 75 °C (except ZrO2 at 125 °C) at different levels of RH.
Nanomaterials 10 02168 g004
Figure 5. Relative responses of NL DEG sensors vs. 25 ppm of NH3 at 50% RH, without and with UV irradiation, based on [27].
Nanomaterials 10 02168 g005
Figure 6. (a) Resistance over time of V2O5 NL DEG towards 200 ppb of C6H6, CH2O, and NO2 at 0% RH and 150 °C and (b) linear discriminant analysis (LDA) based on gas exposures of all four sensors.
Nanomaterials 10 02168 g006
Table 1. Summary of relative responses towards CO, C6H6, CH2O, and NO2 in dry and humid conditions.
Relative Response (%)
CO
500 ppb 0% RH
CO
500 ppb 50% RH
C6H6 200 ppb 0% RHC6H6 200 ppb 25% RHCH2O 200 ppb 0% RHCH2O 200 ppb 25% RHNO2
200 ppb 0% RH
NO2
200 ppb 25% RH
CuO0.12/2.81/1.54/5.28−0.89
Fe3O40.09/0.40/0.33/39.6926.68
V2O50.14/0.17/0.25/−5.84−8.65
ZrO2//0.02///−14.60−15.75
Table 2. Summary of responses of all sensors towards C6H6, CH2O, and NO2 at 150 °C under dry and humid conditions.
Relative Response (%)
C6H6 200 ppb 0% RH LiUC6H6 500 ppb 0% RH UdSCH2O 200 ppb 0% RH LiUCH2O 500 ppb 0% RH UdSNO2
200 ppb 0% RH LiU
NO2
500 ppb 0% RH UdS
NO2
200 ppb 25% RH LiU
NO2
500 ppb 50% RH UdS
CuO2.810.451.540.925.2814.60−0.895.87
Fe3O40.400.200.330.1939.6965.8226.6860.63
V2O50.170.270.250.38−5.84−8.93−8.65−11.87
ZrO20.02///−14.60−17.10−15.75−16.94
Table 3. Summary of response directions (+ for positive, − for negative, and/for no response) of all sensors towards CO, C6H6, CH2O, NH3, and NO2 under dry and humid conditions.
Qualitative Response
COCO + RHC6H6C6H6 + RHCH2OCH2O + RHNH3NH3 + RHNH3 + UVNO2NO2 + RH
CuO+/+/+/+++
Fe3O4+/+/+/++
V2O5+/+/+/+++
ZrO2//+///
Publisher’s Note: MDPI stays neutral with regard to jurisdictional claims in published maps and institutional affiliations.

