Optical Limiting of Carbon Nanohorn-Based Aqueous Nanofluids: A Systematic Study

 , , , , and
Abstract
:1. Introduction
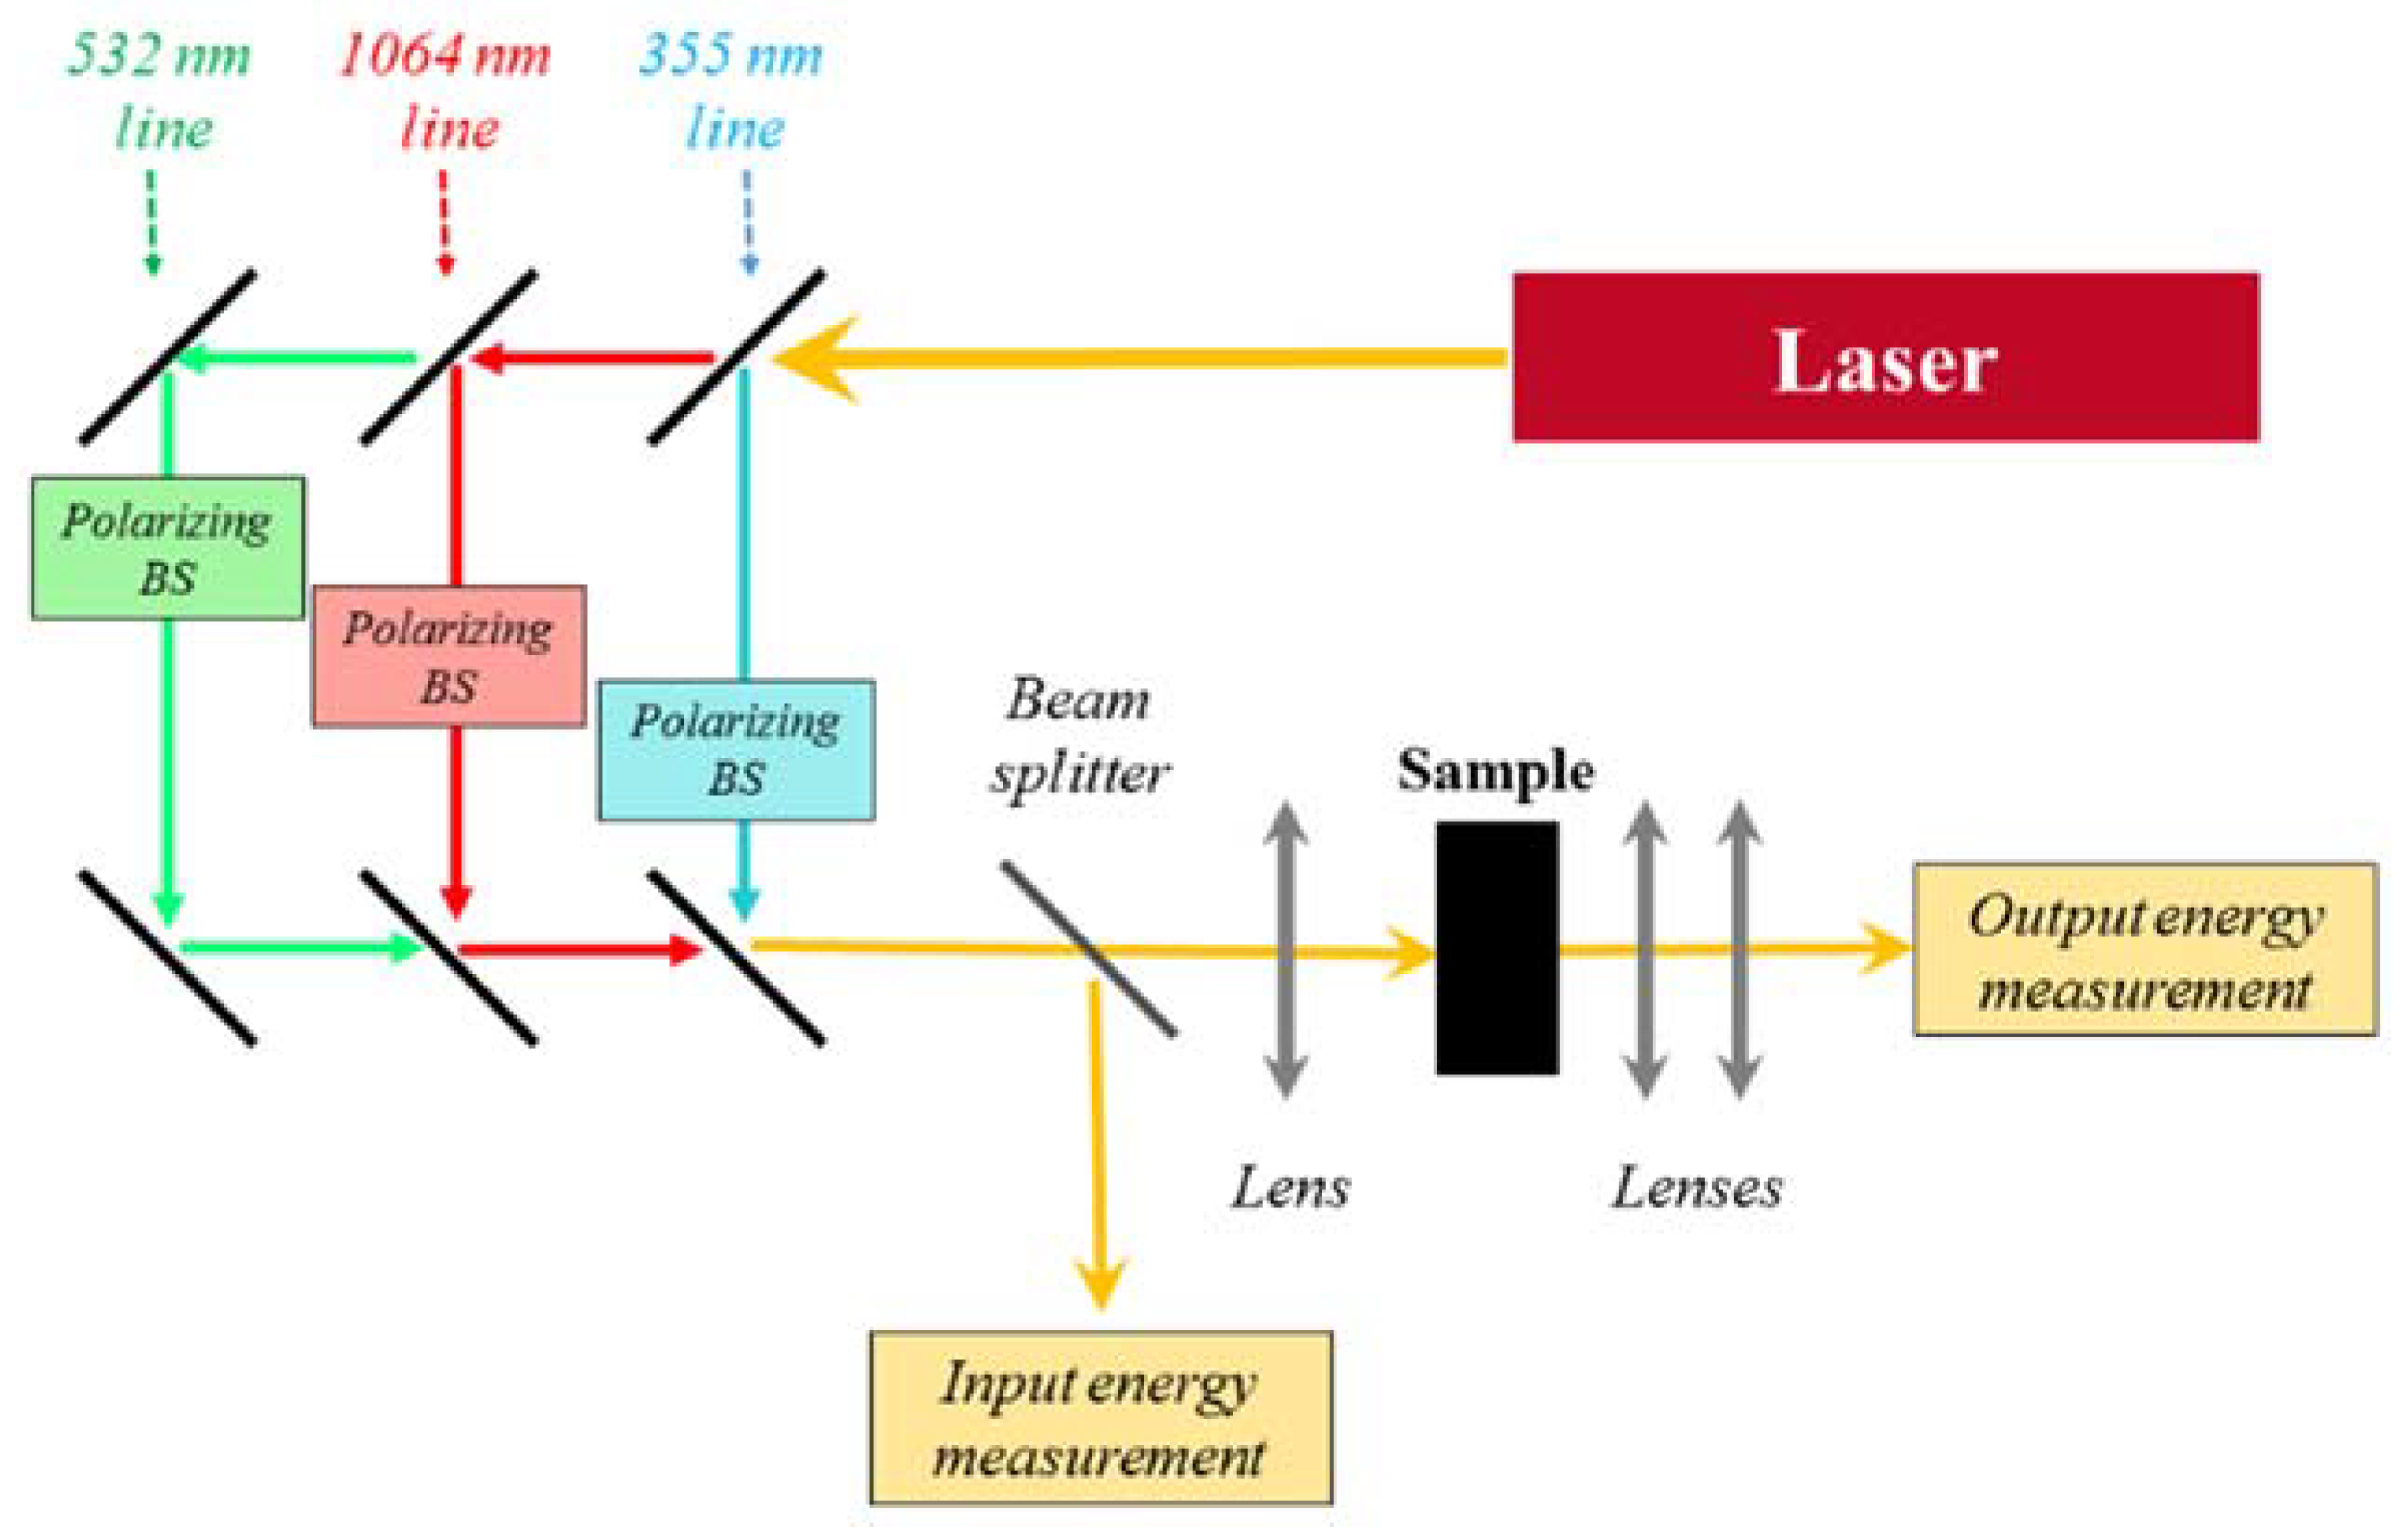
2. Experimental
3. Results and Discussion
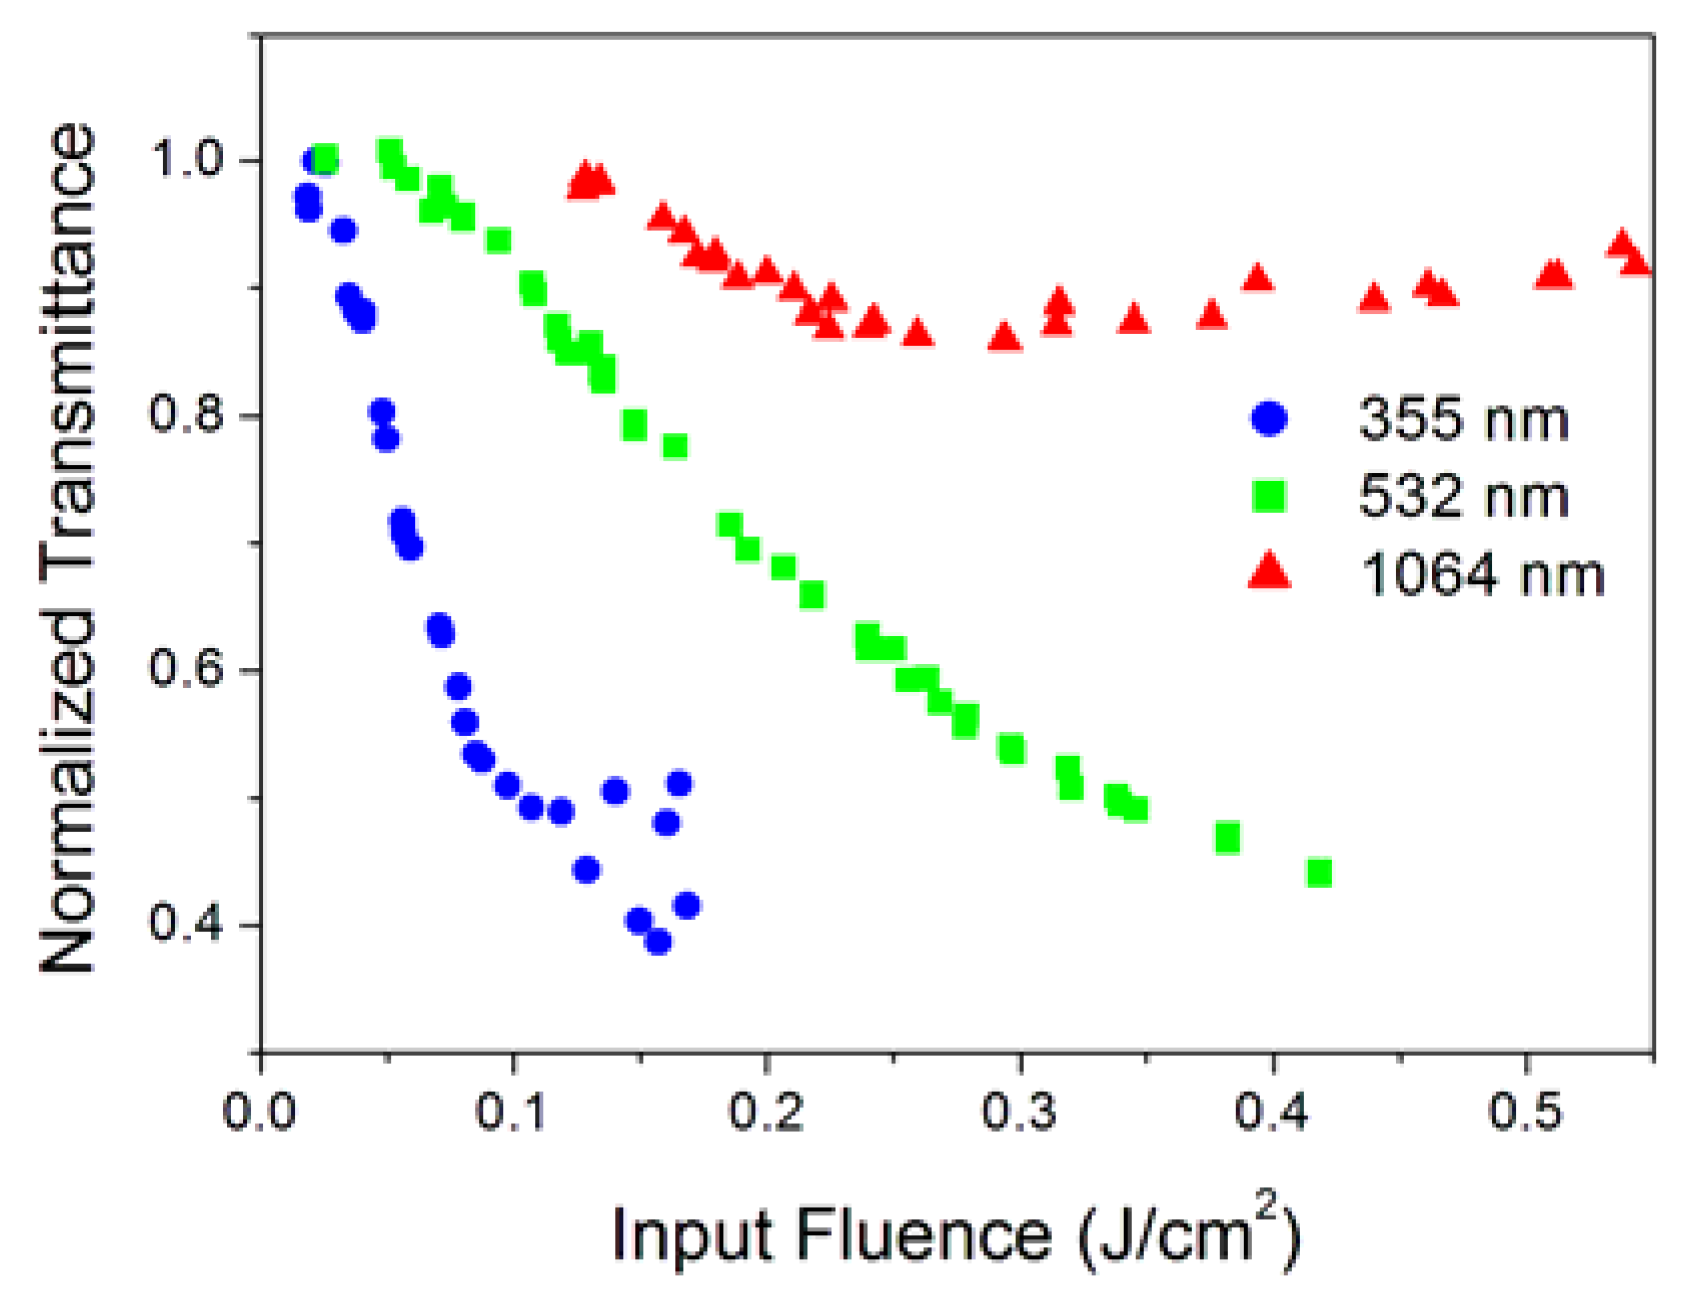
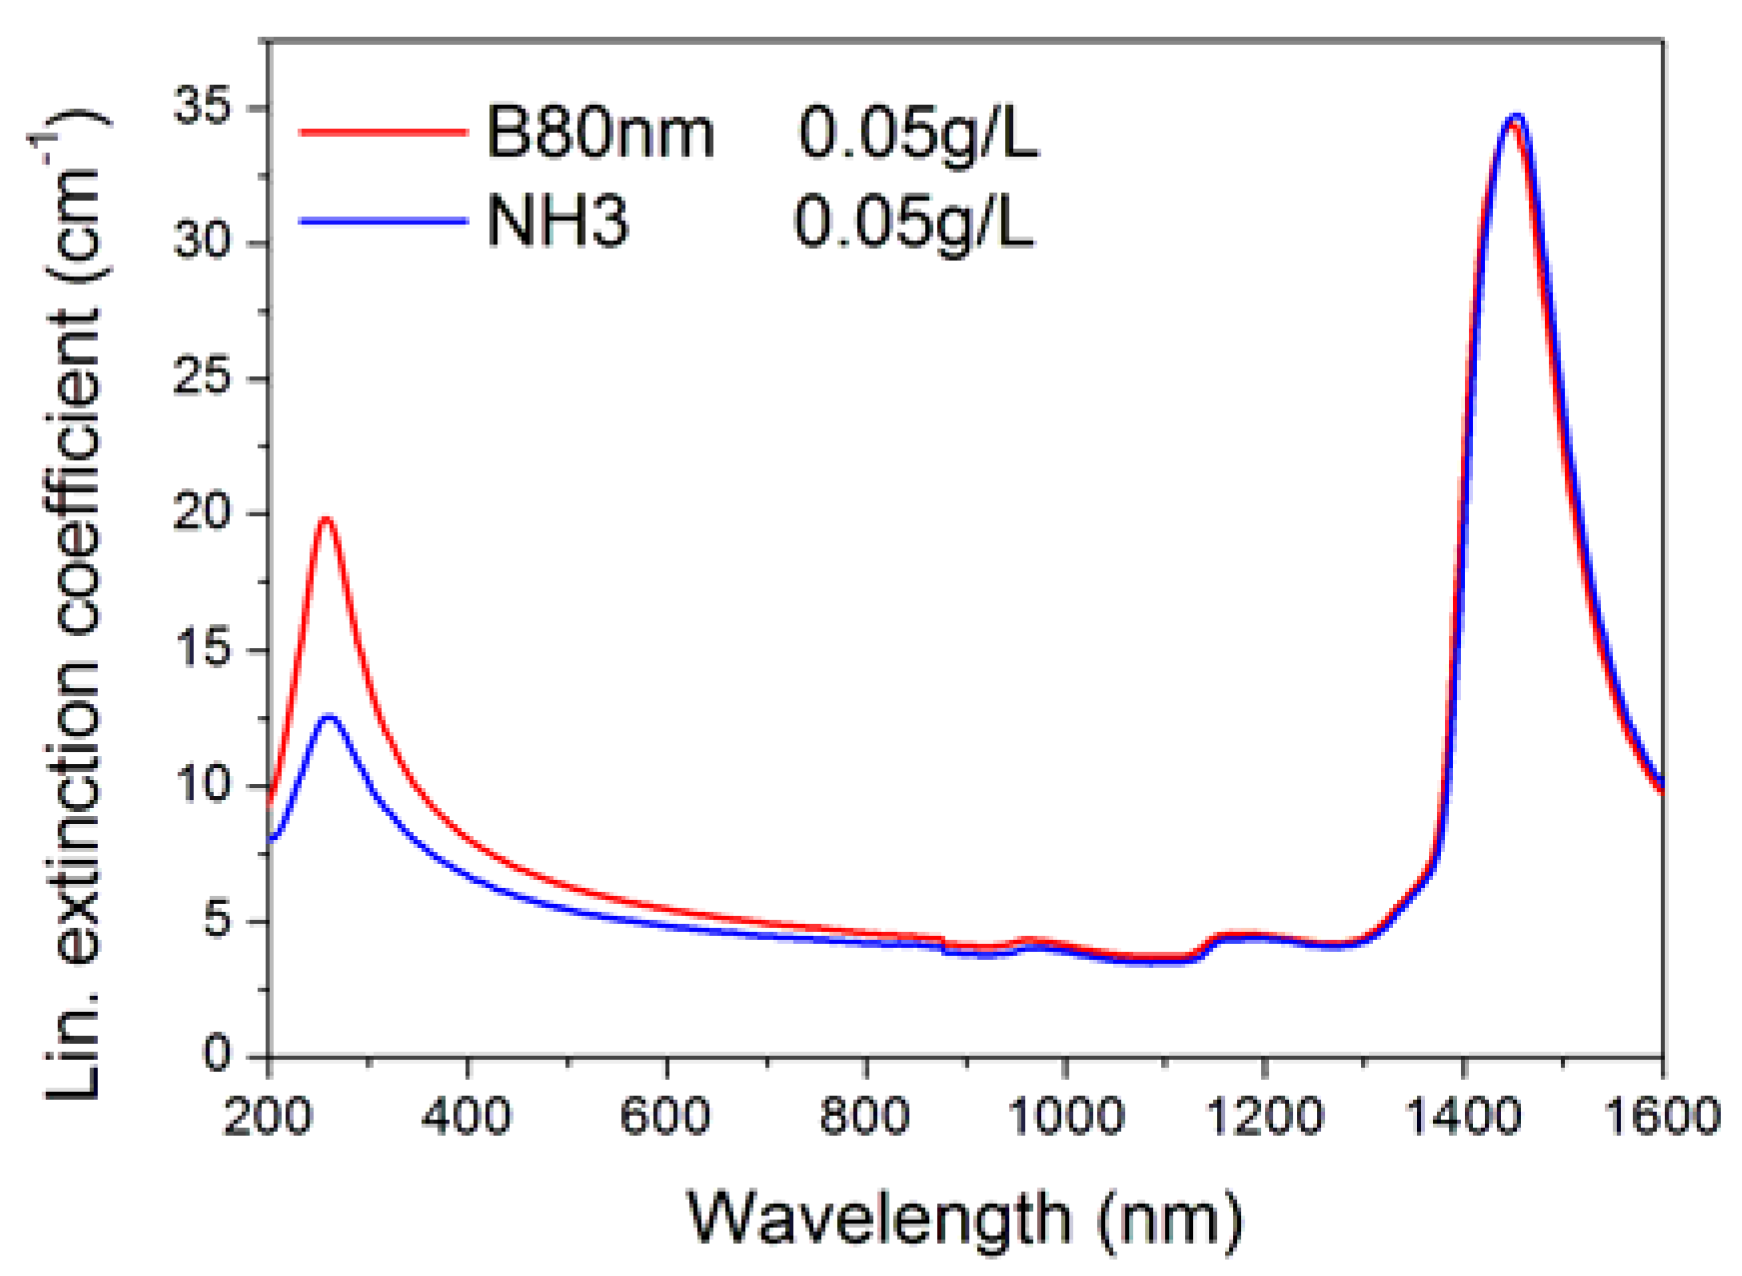
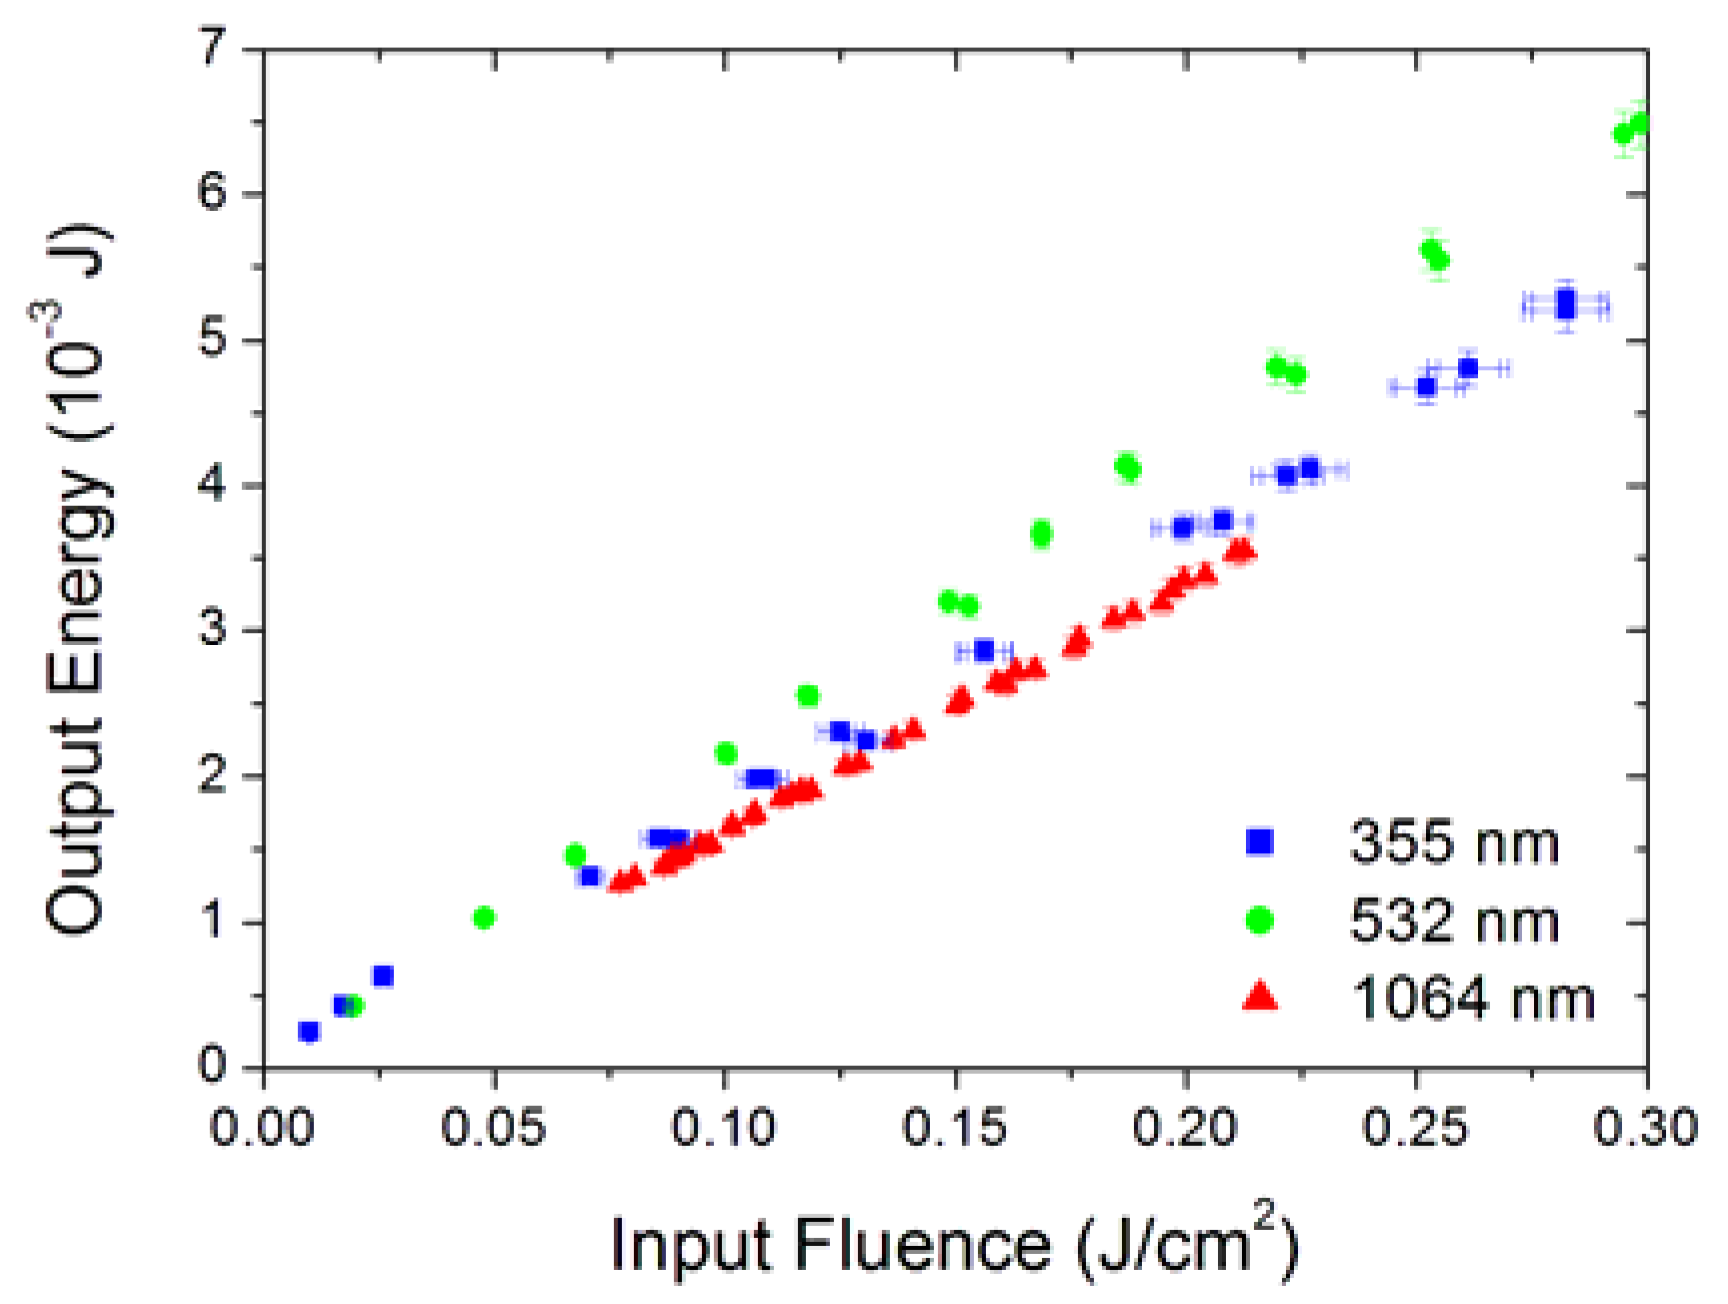
3.1. Broadband Optical Limiting
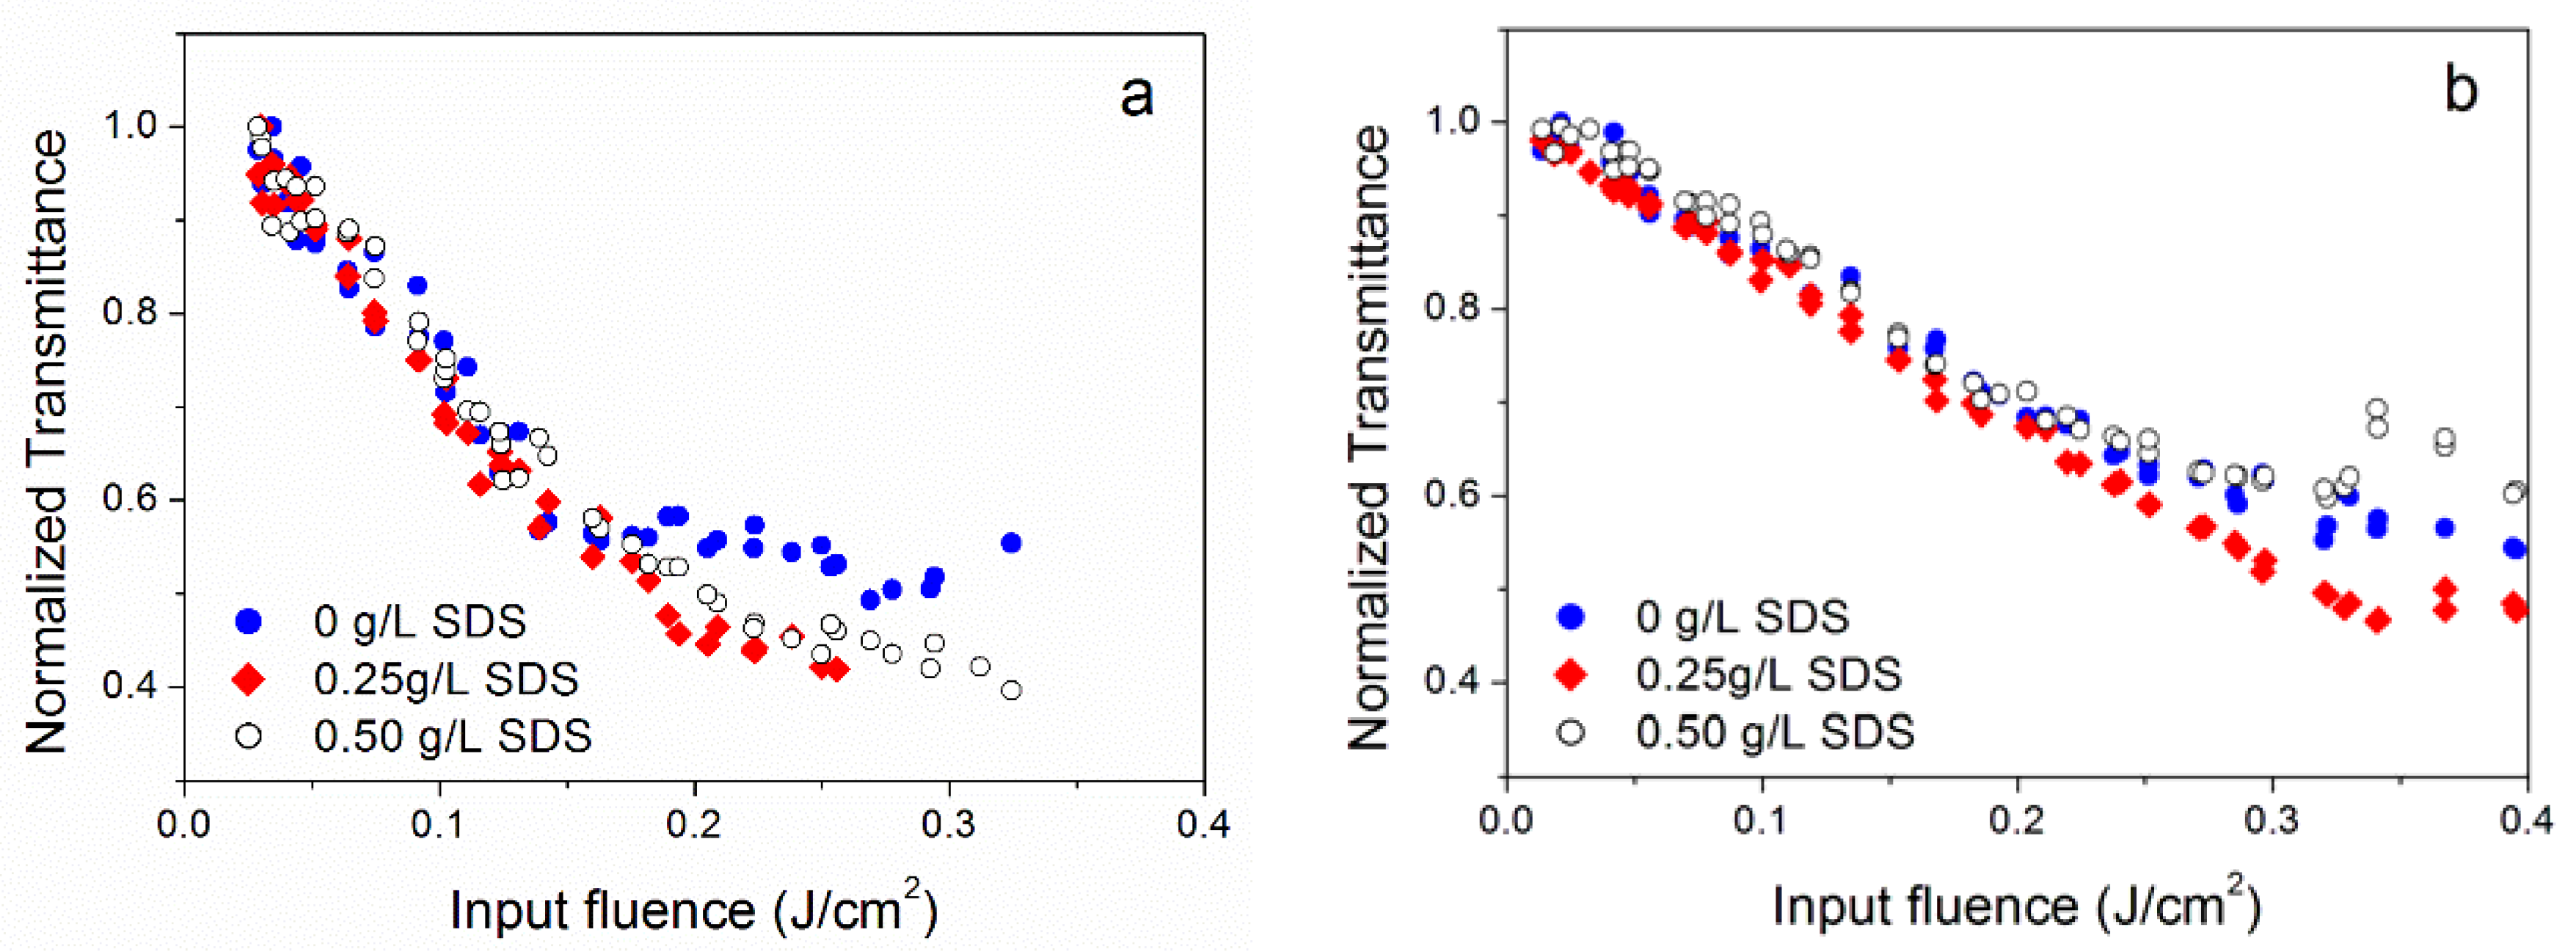
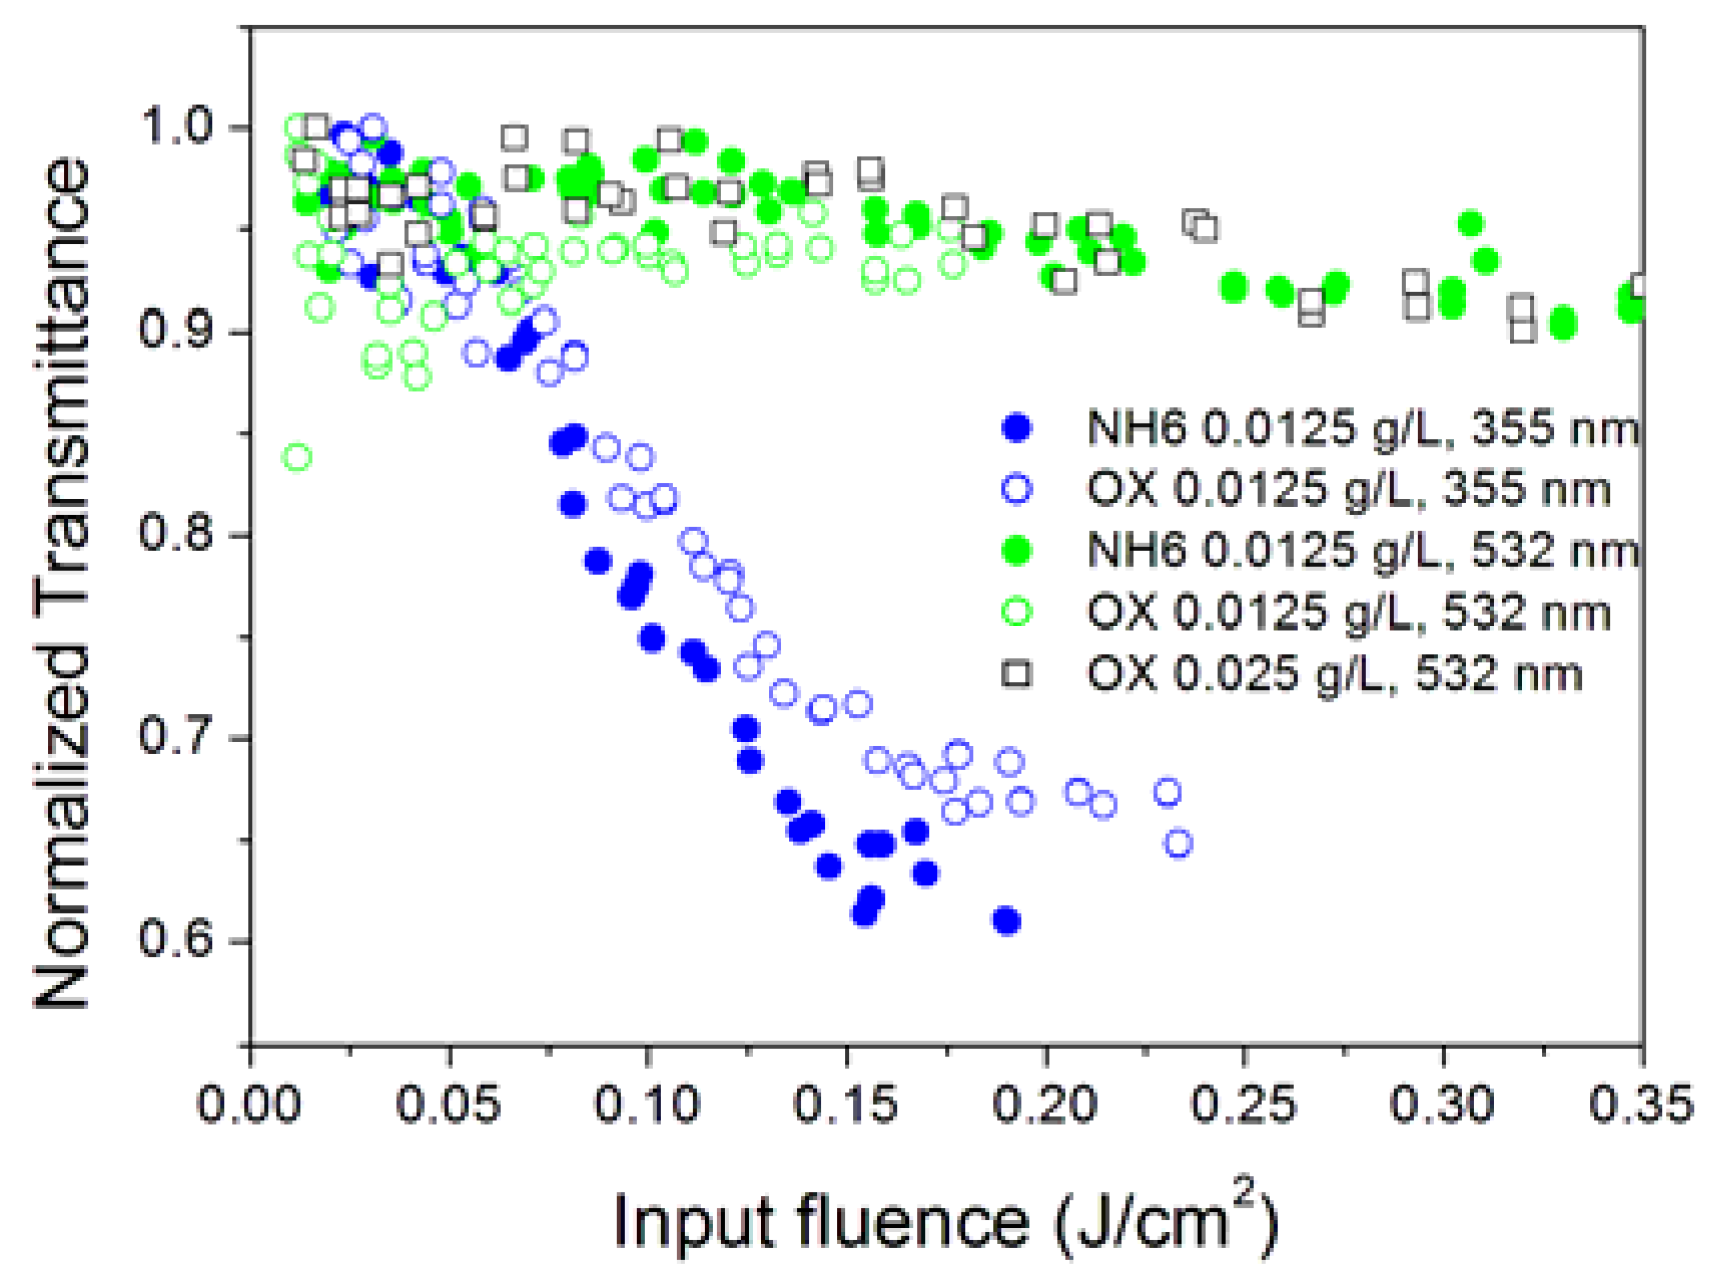
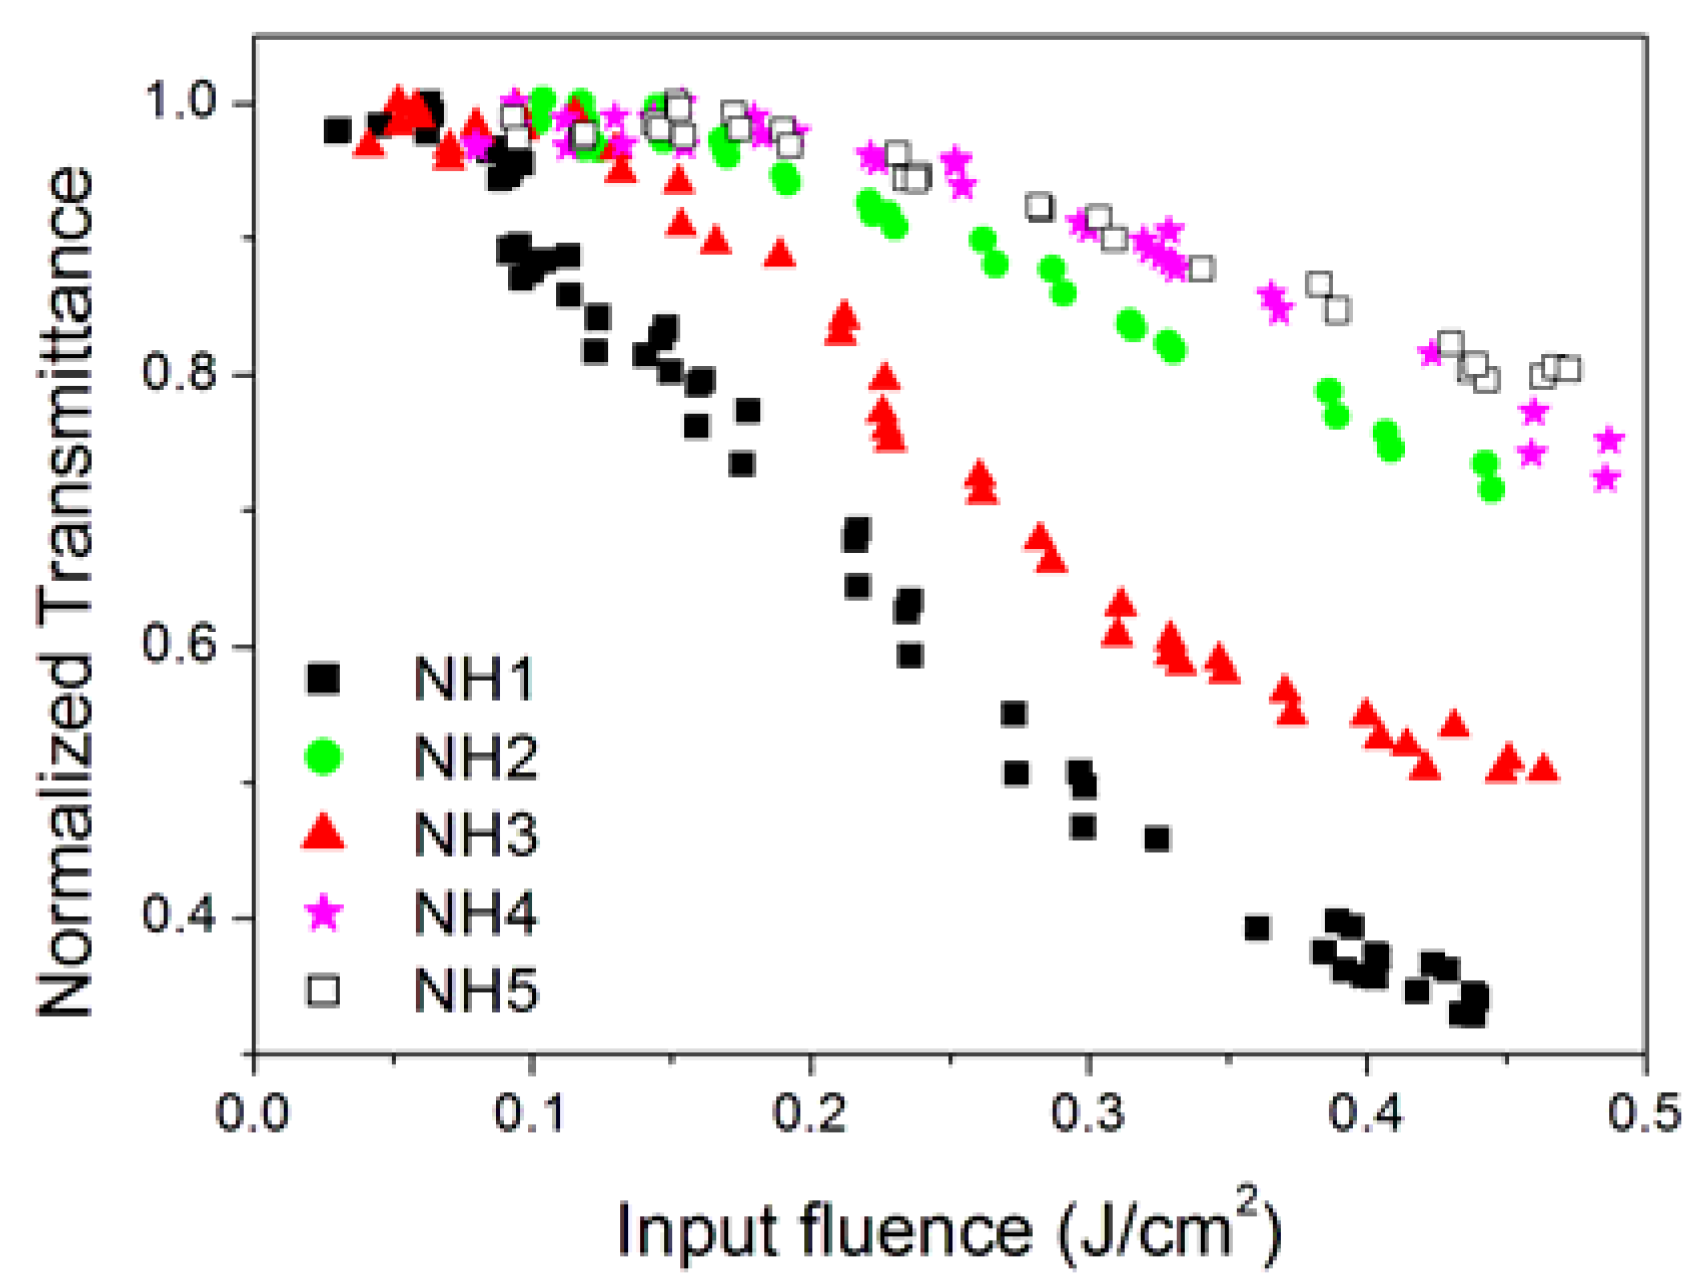
3.2. Effect of Surfactant Concentration
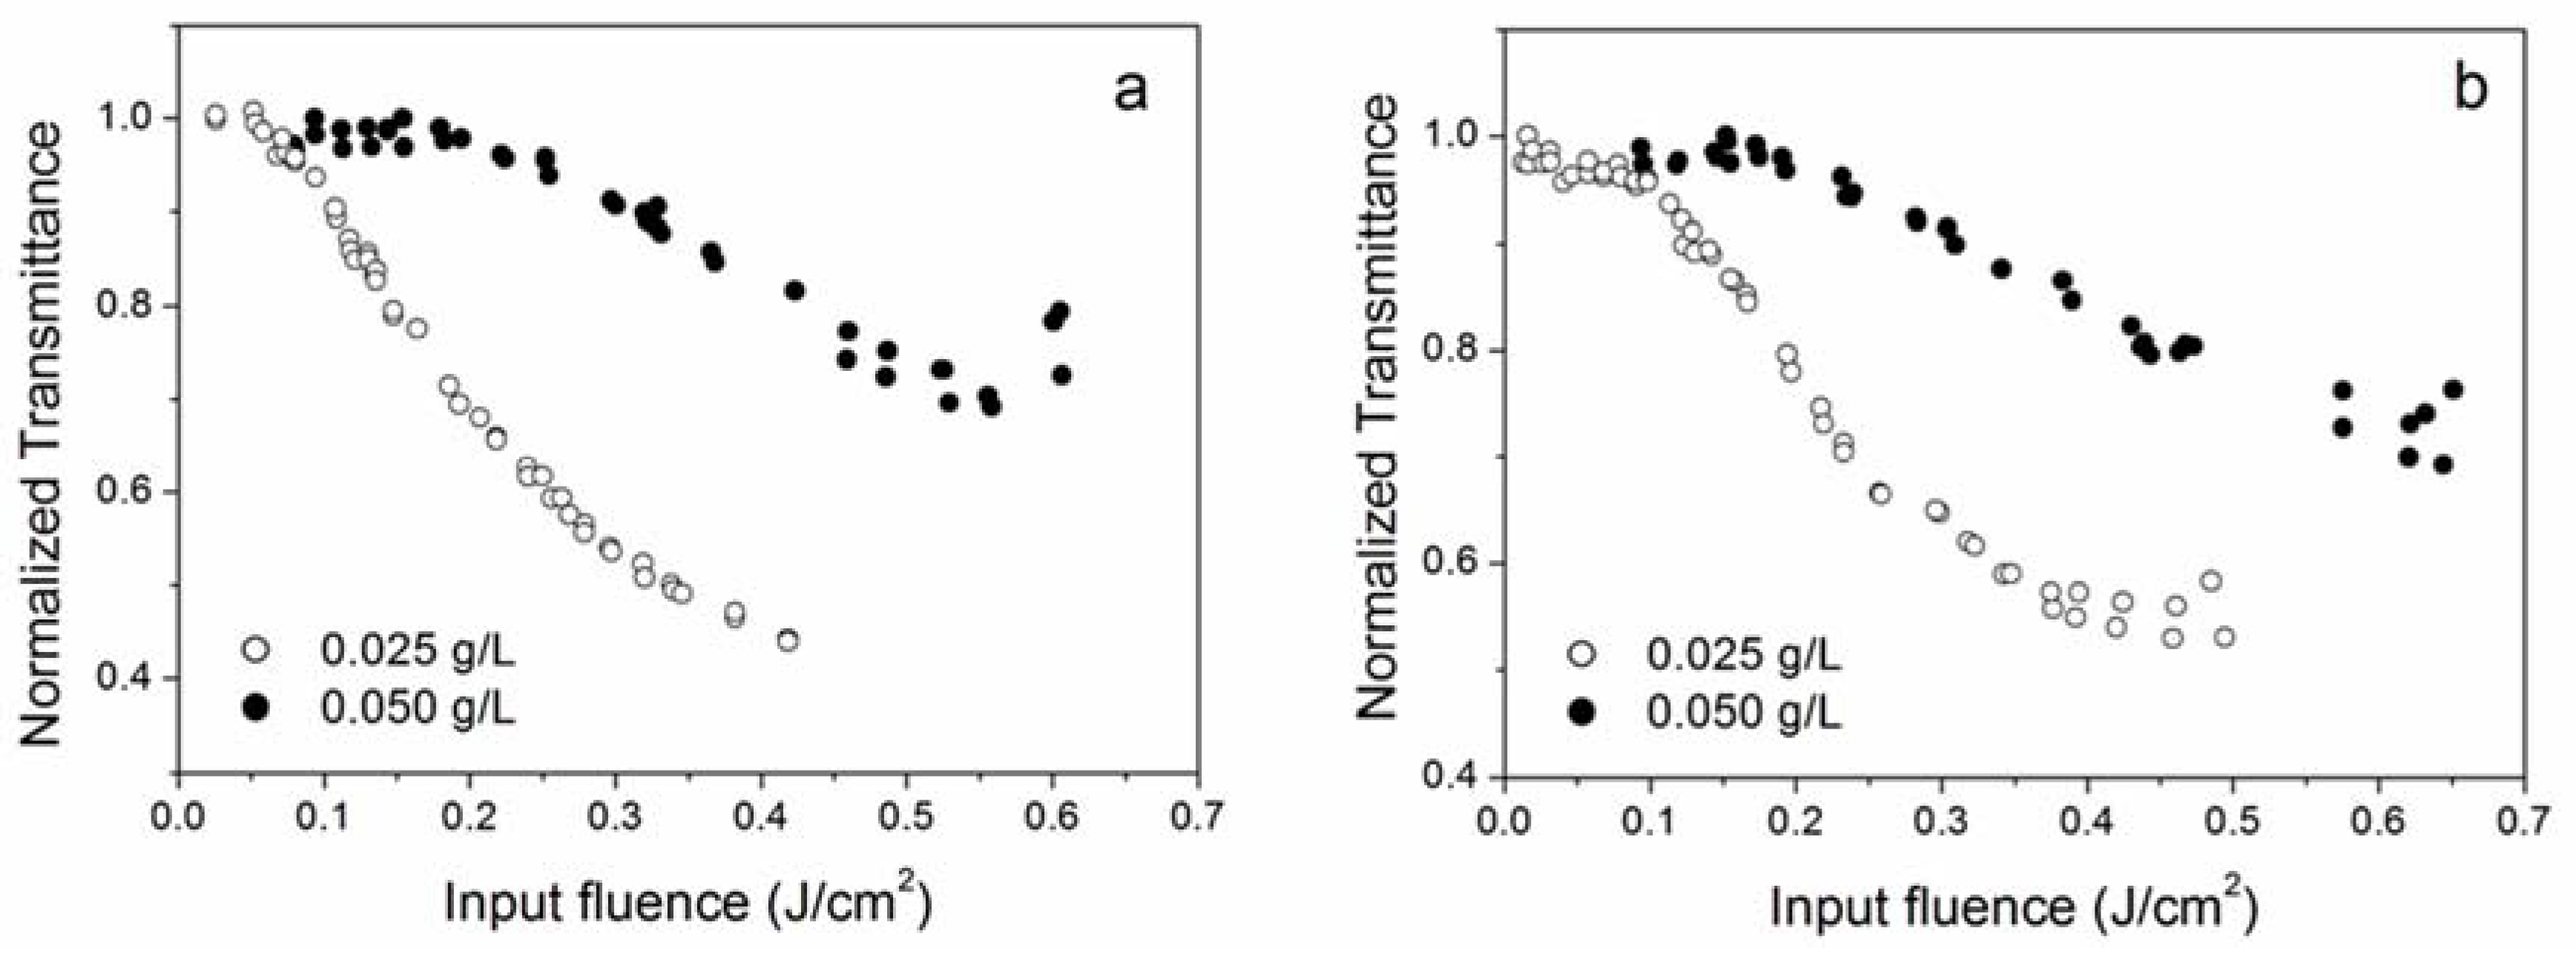
3.3. Effect of Nanoparticle Concentration
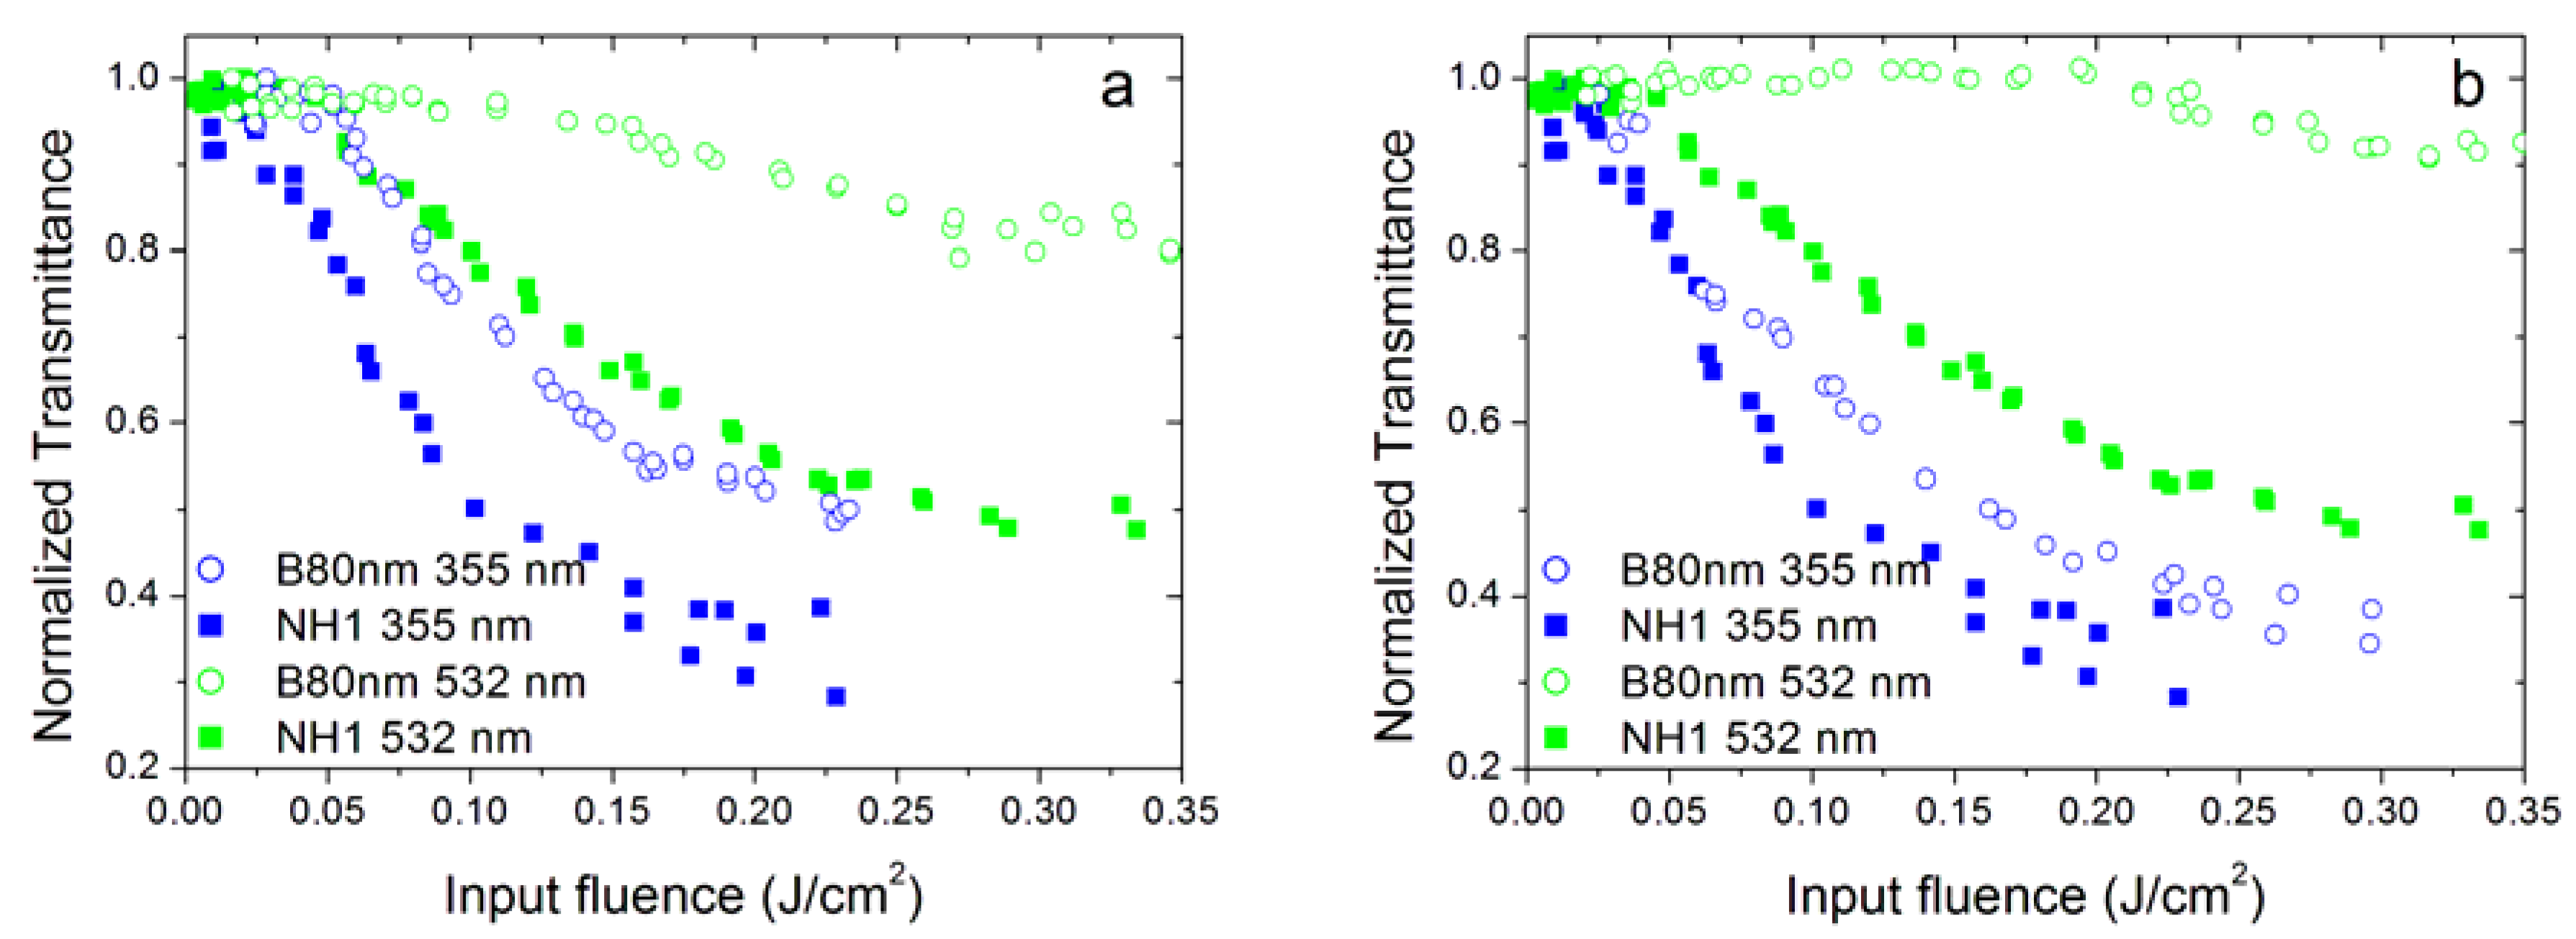
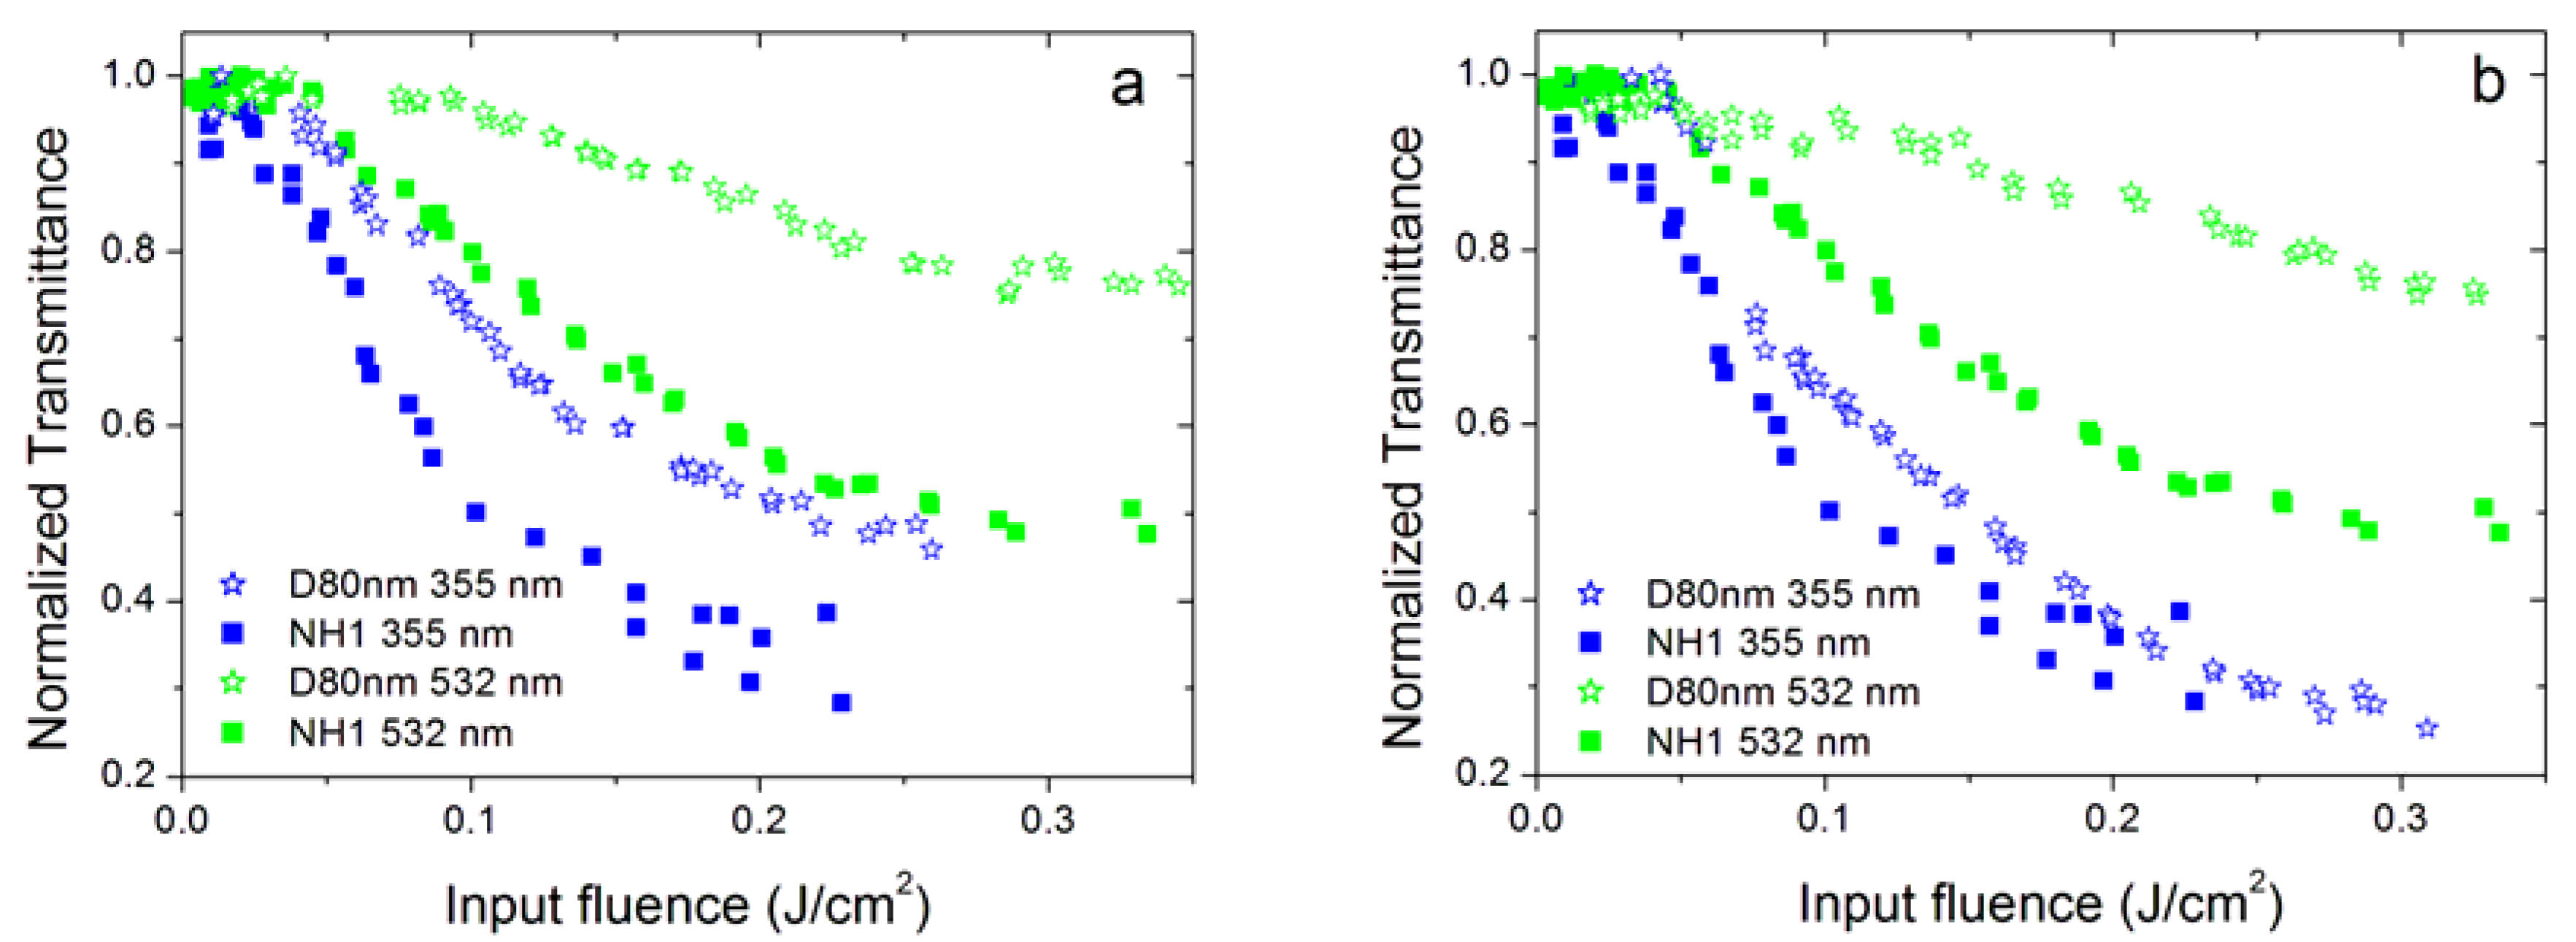
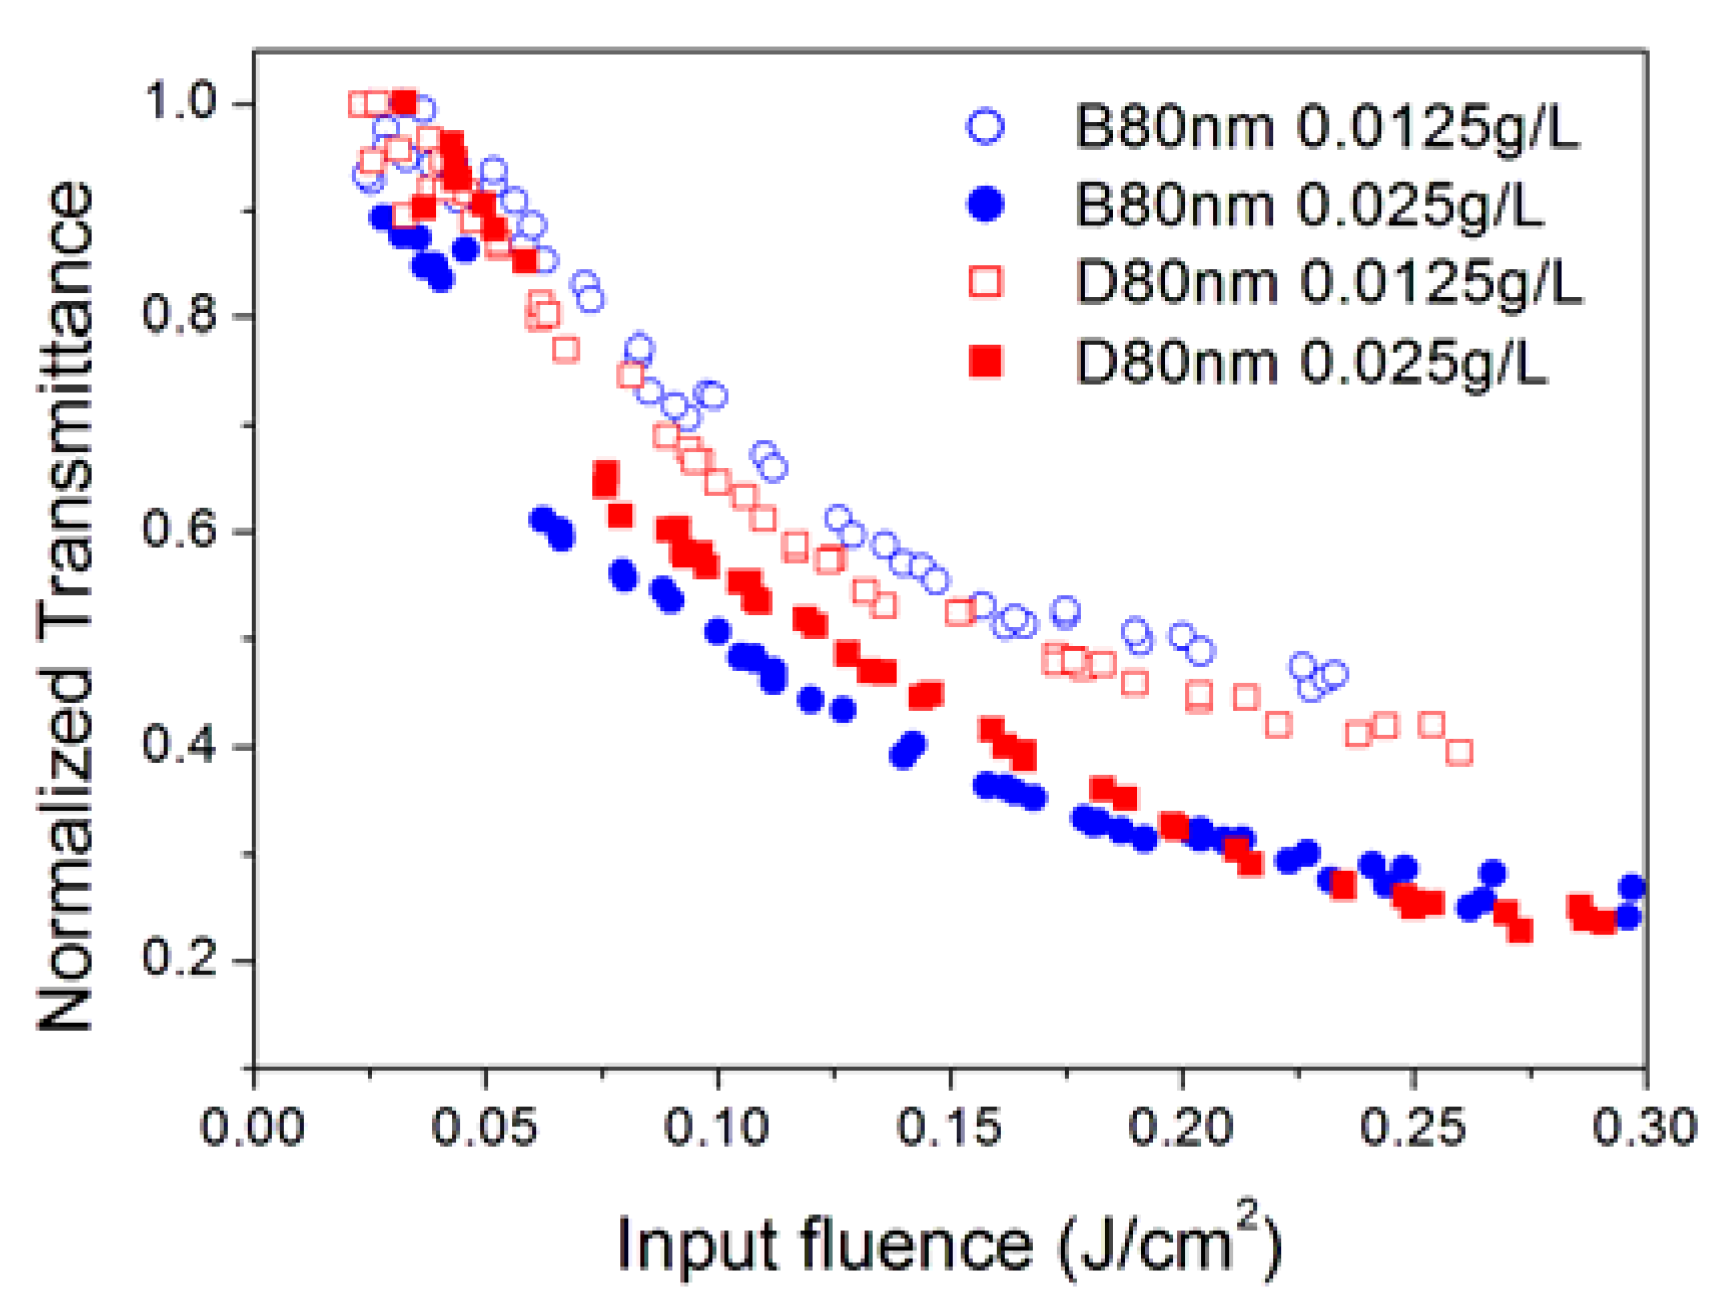
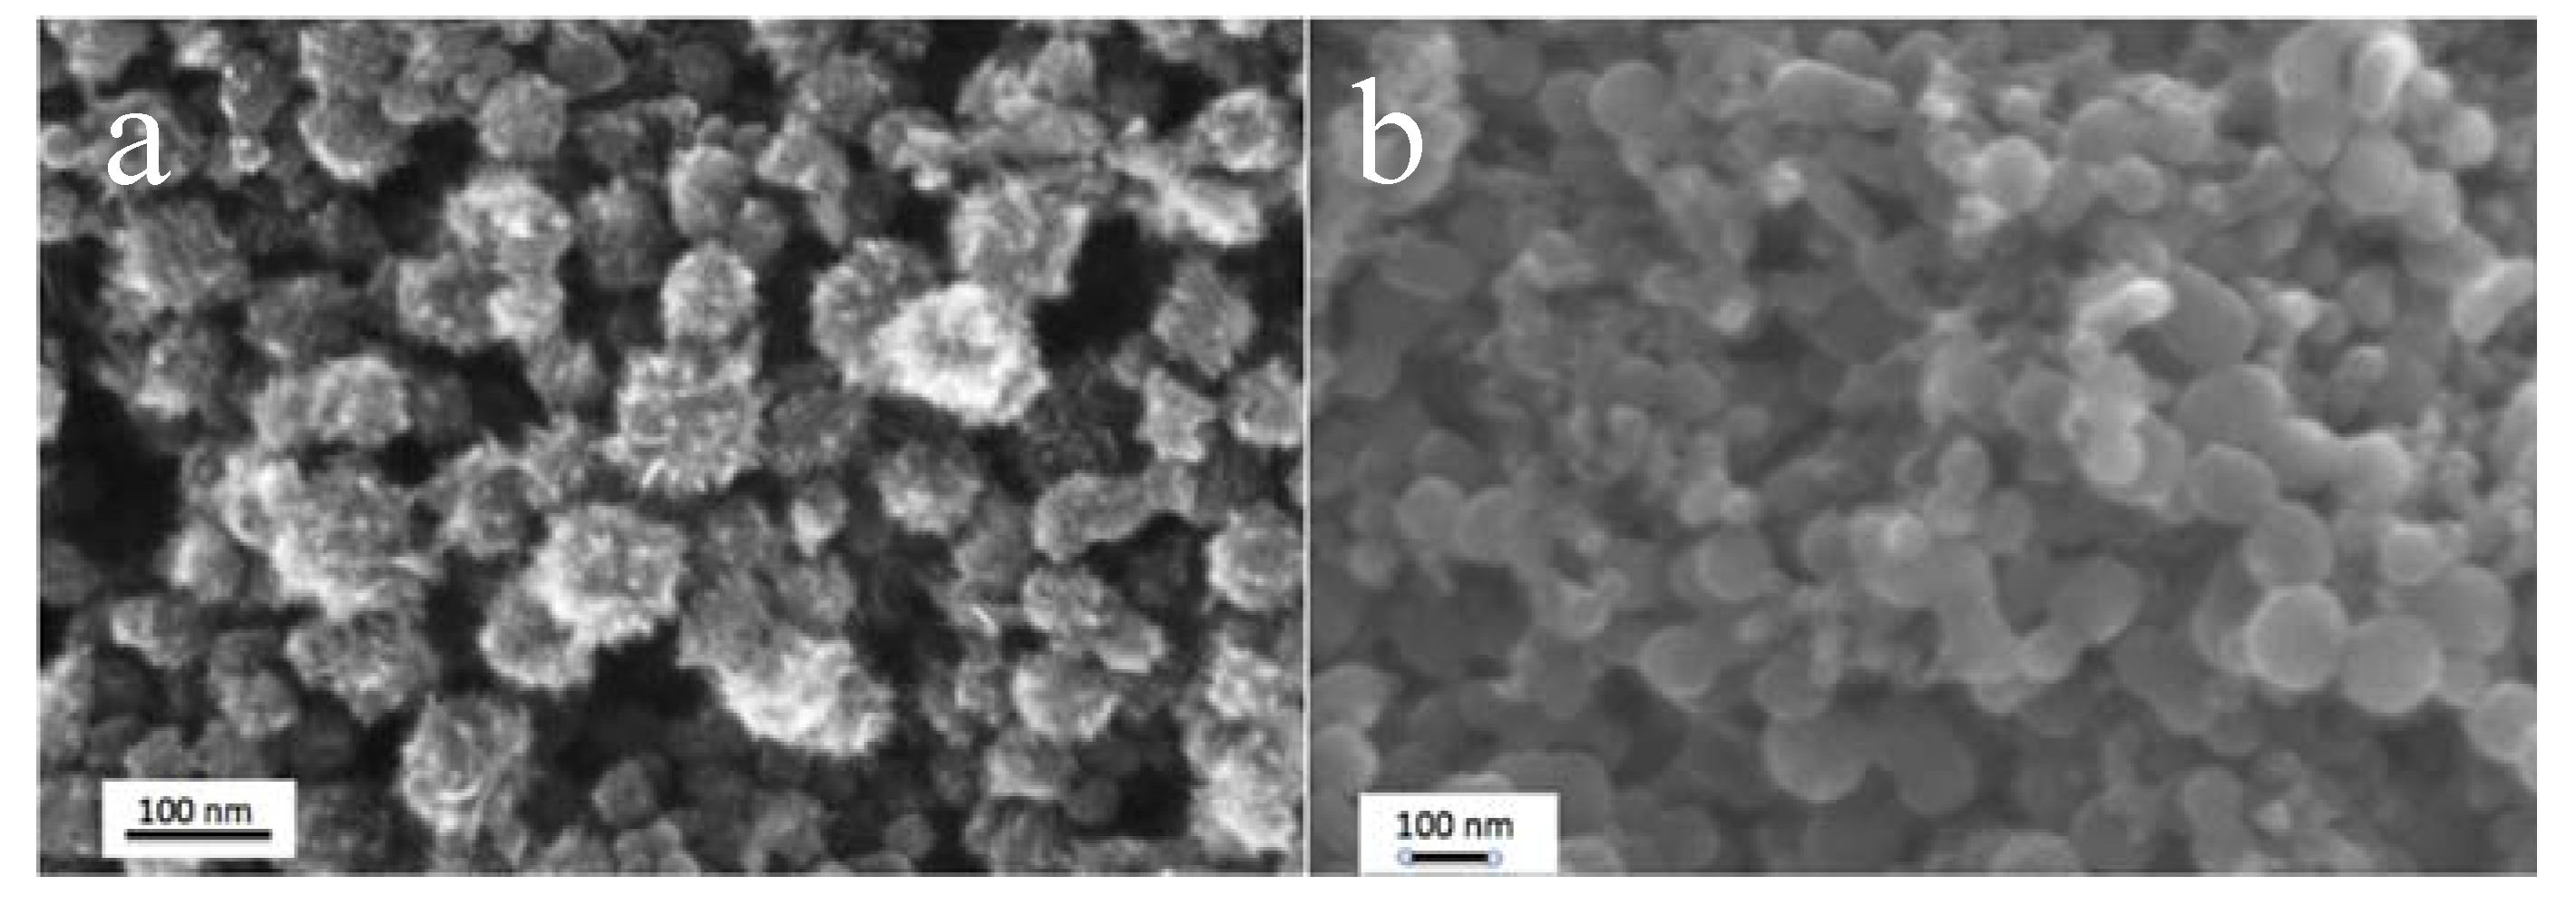
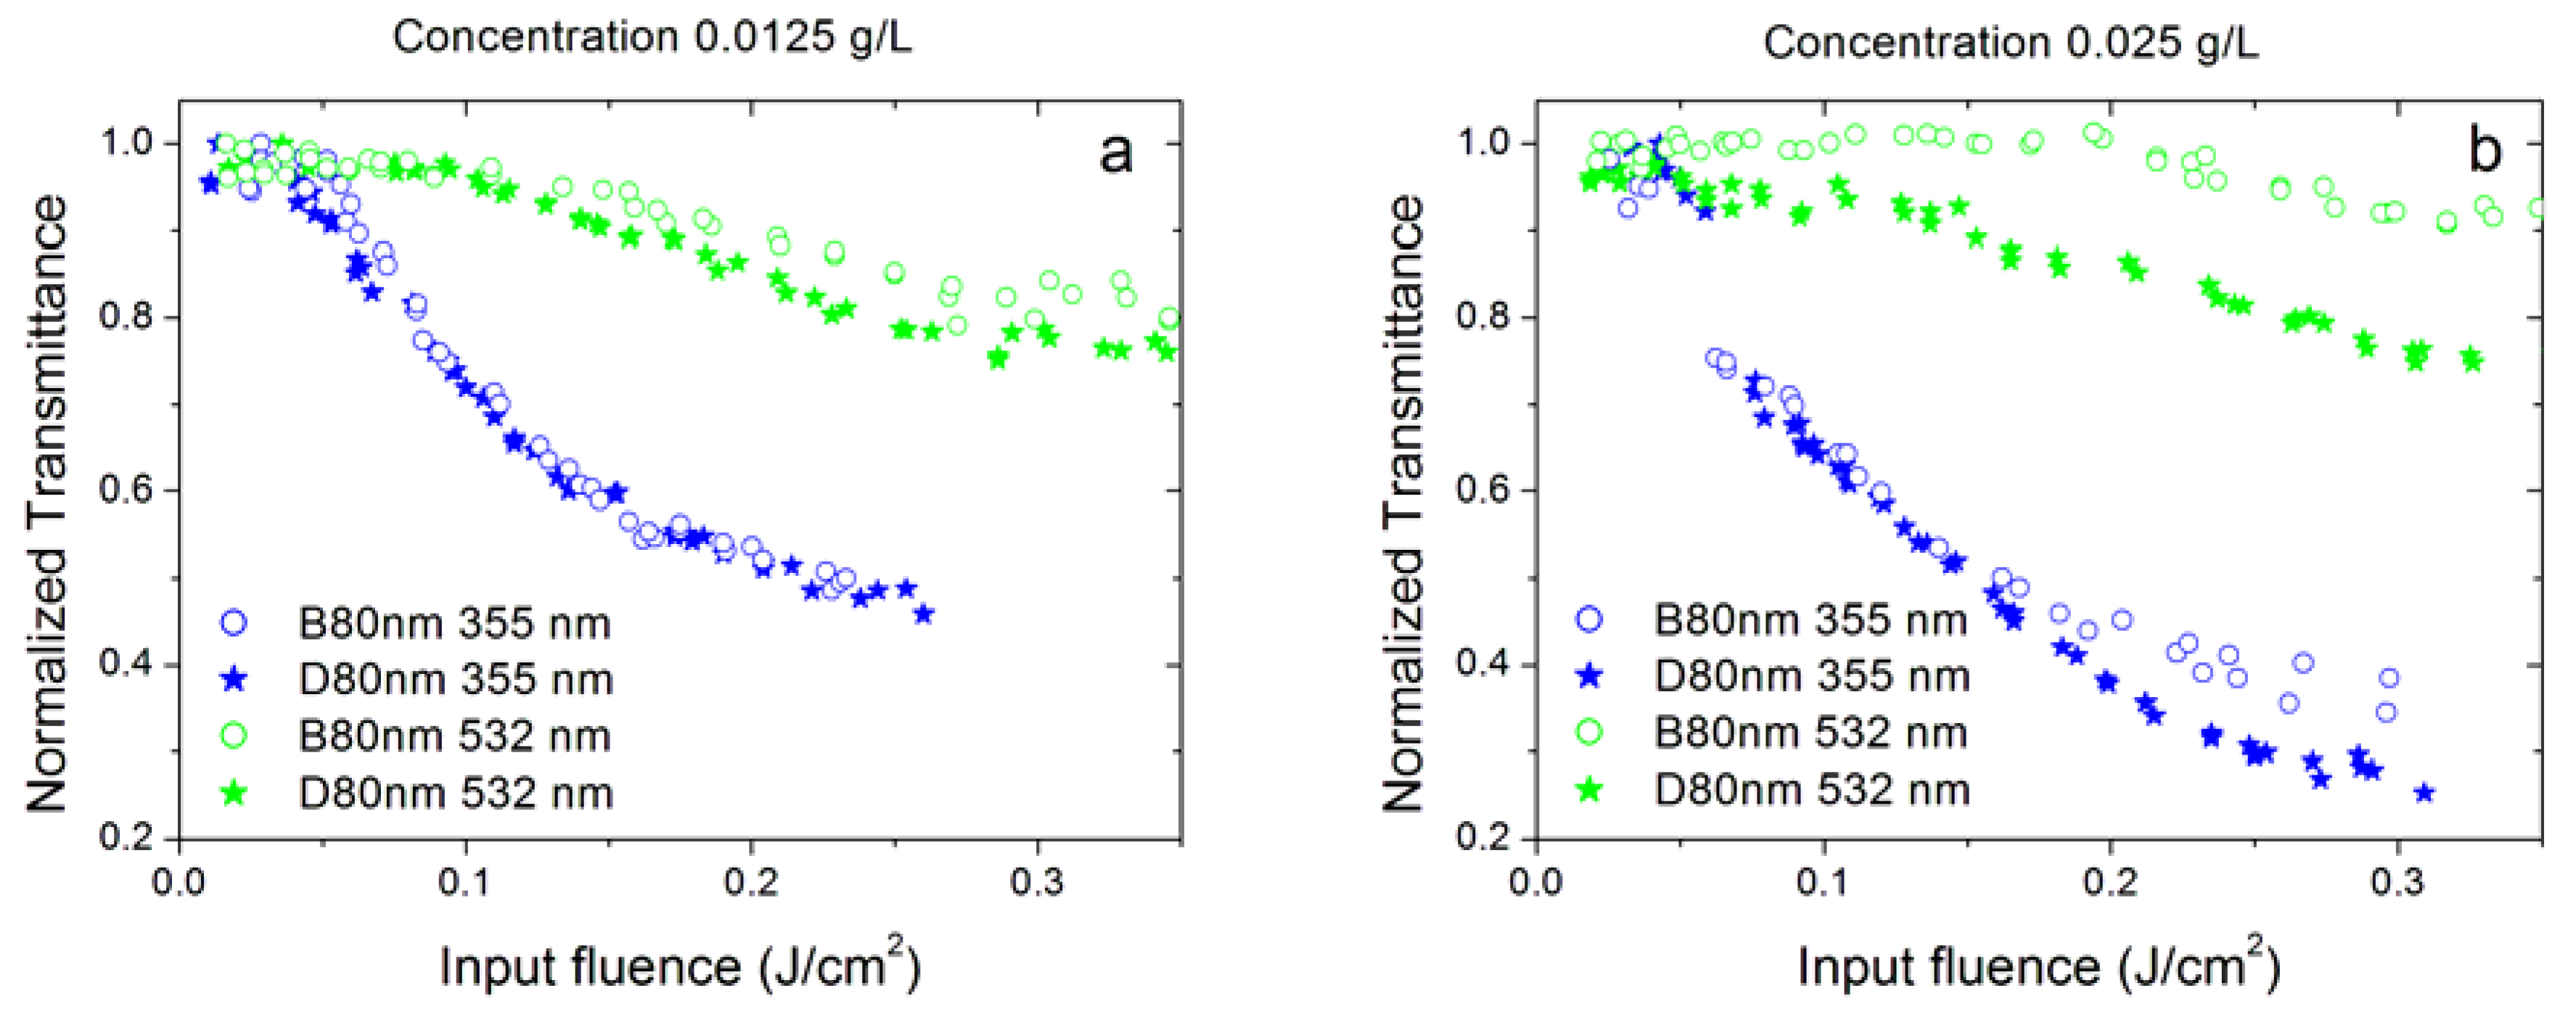
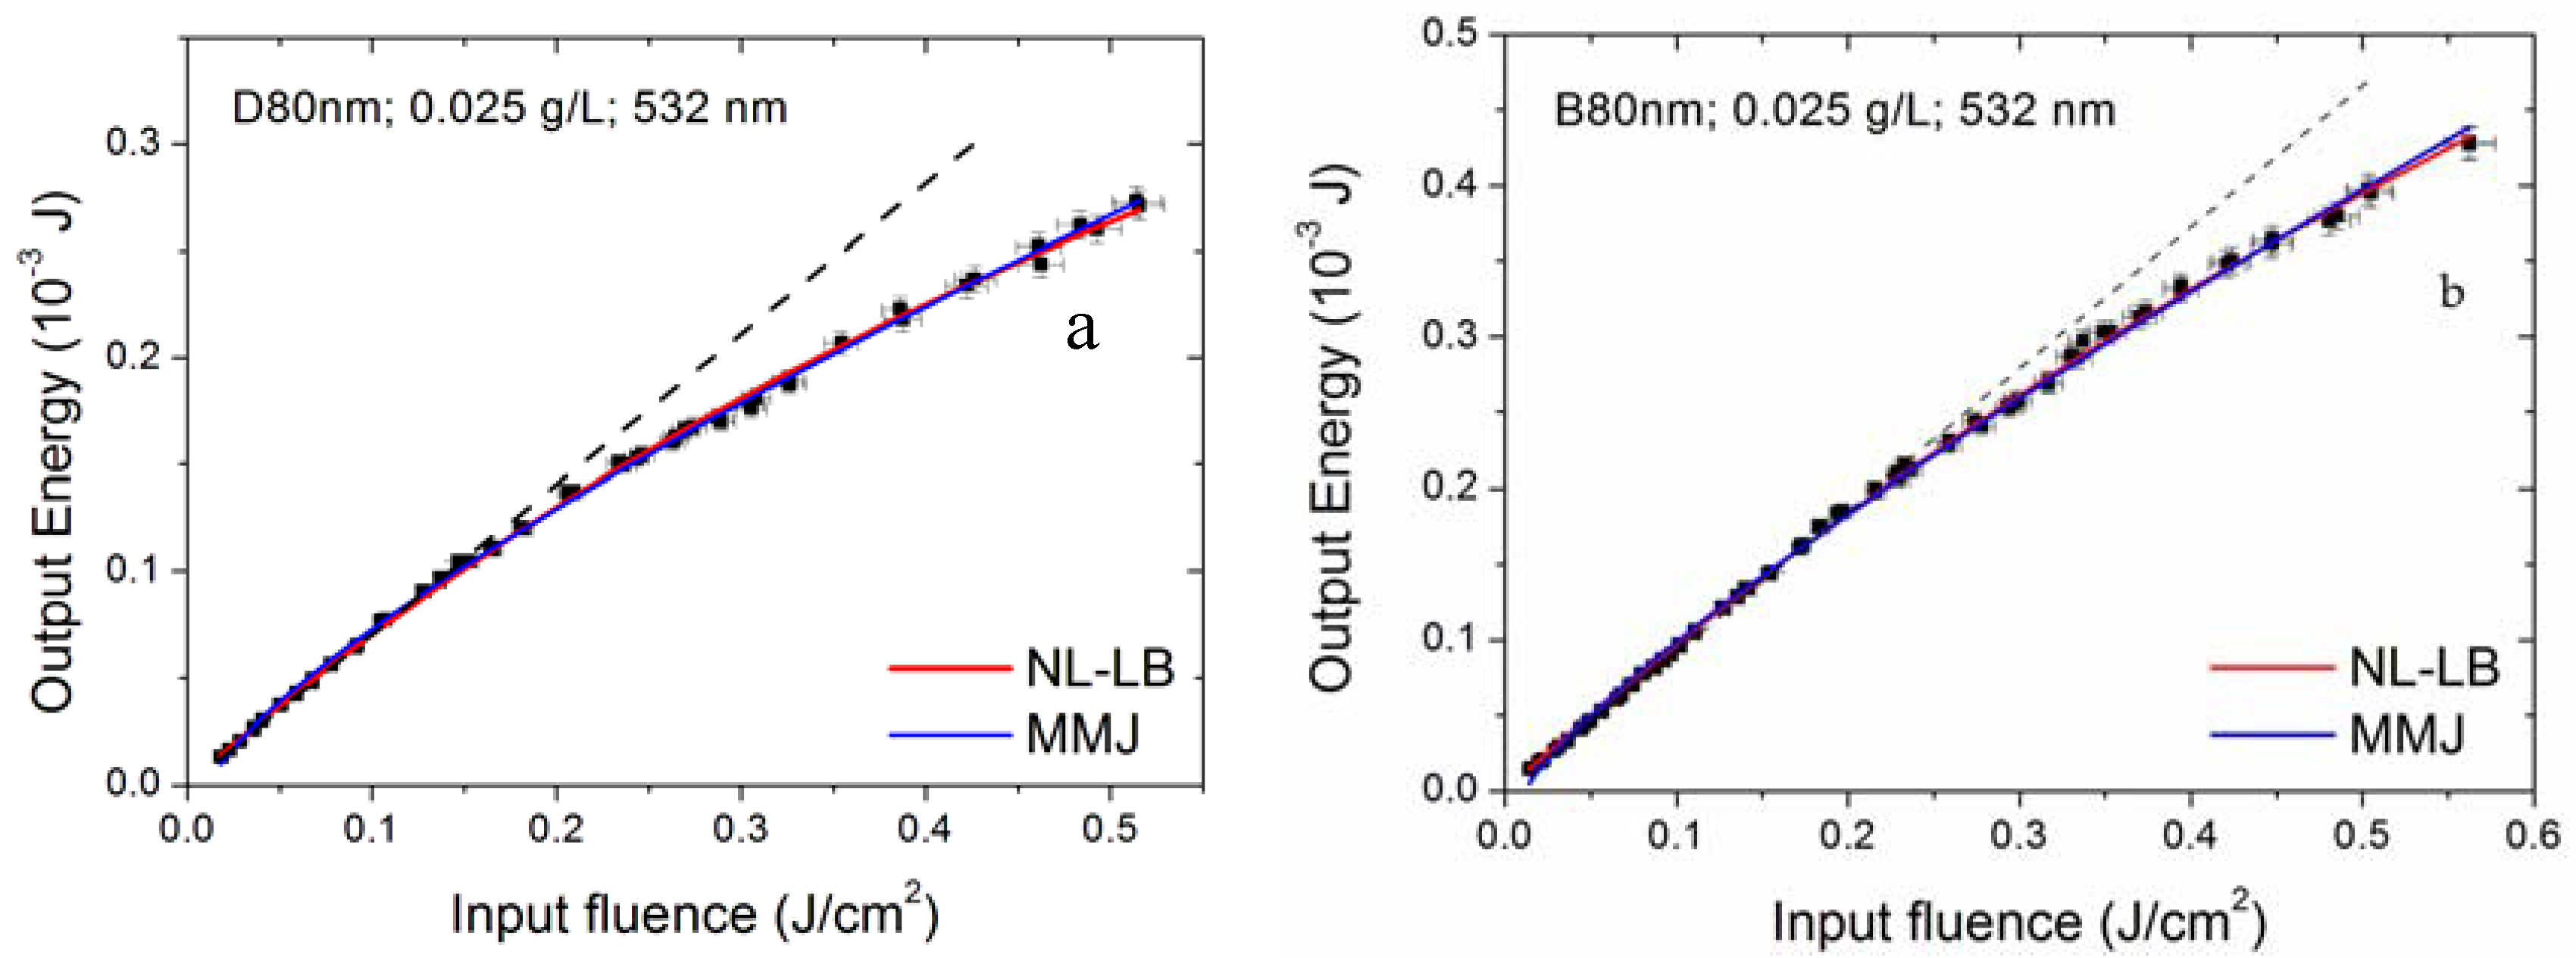
3.4. Effect of Nanoparticle Morphology
3.5. Effect of Sizes of Aggregates
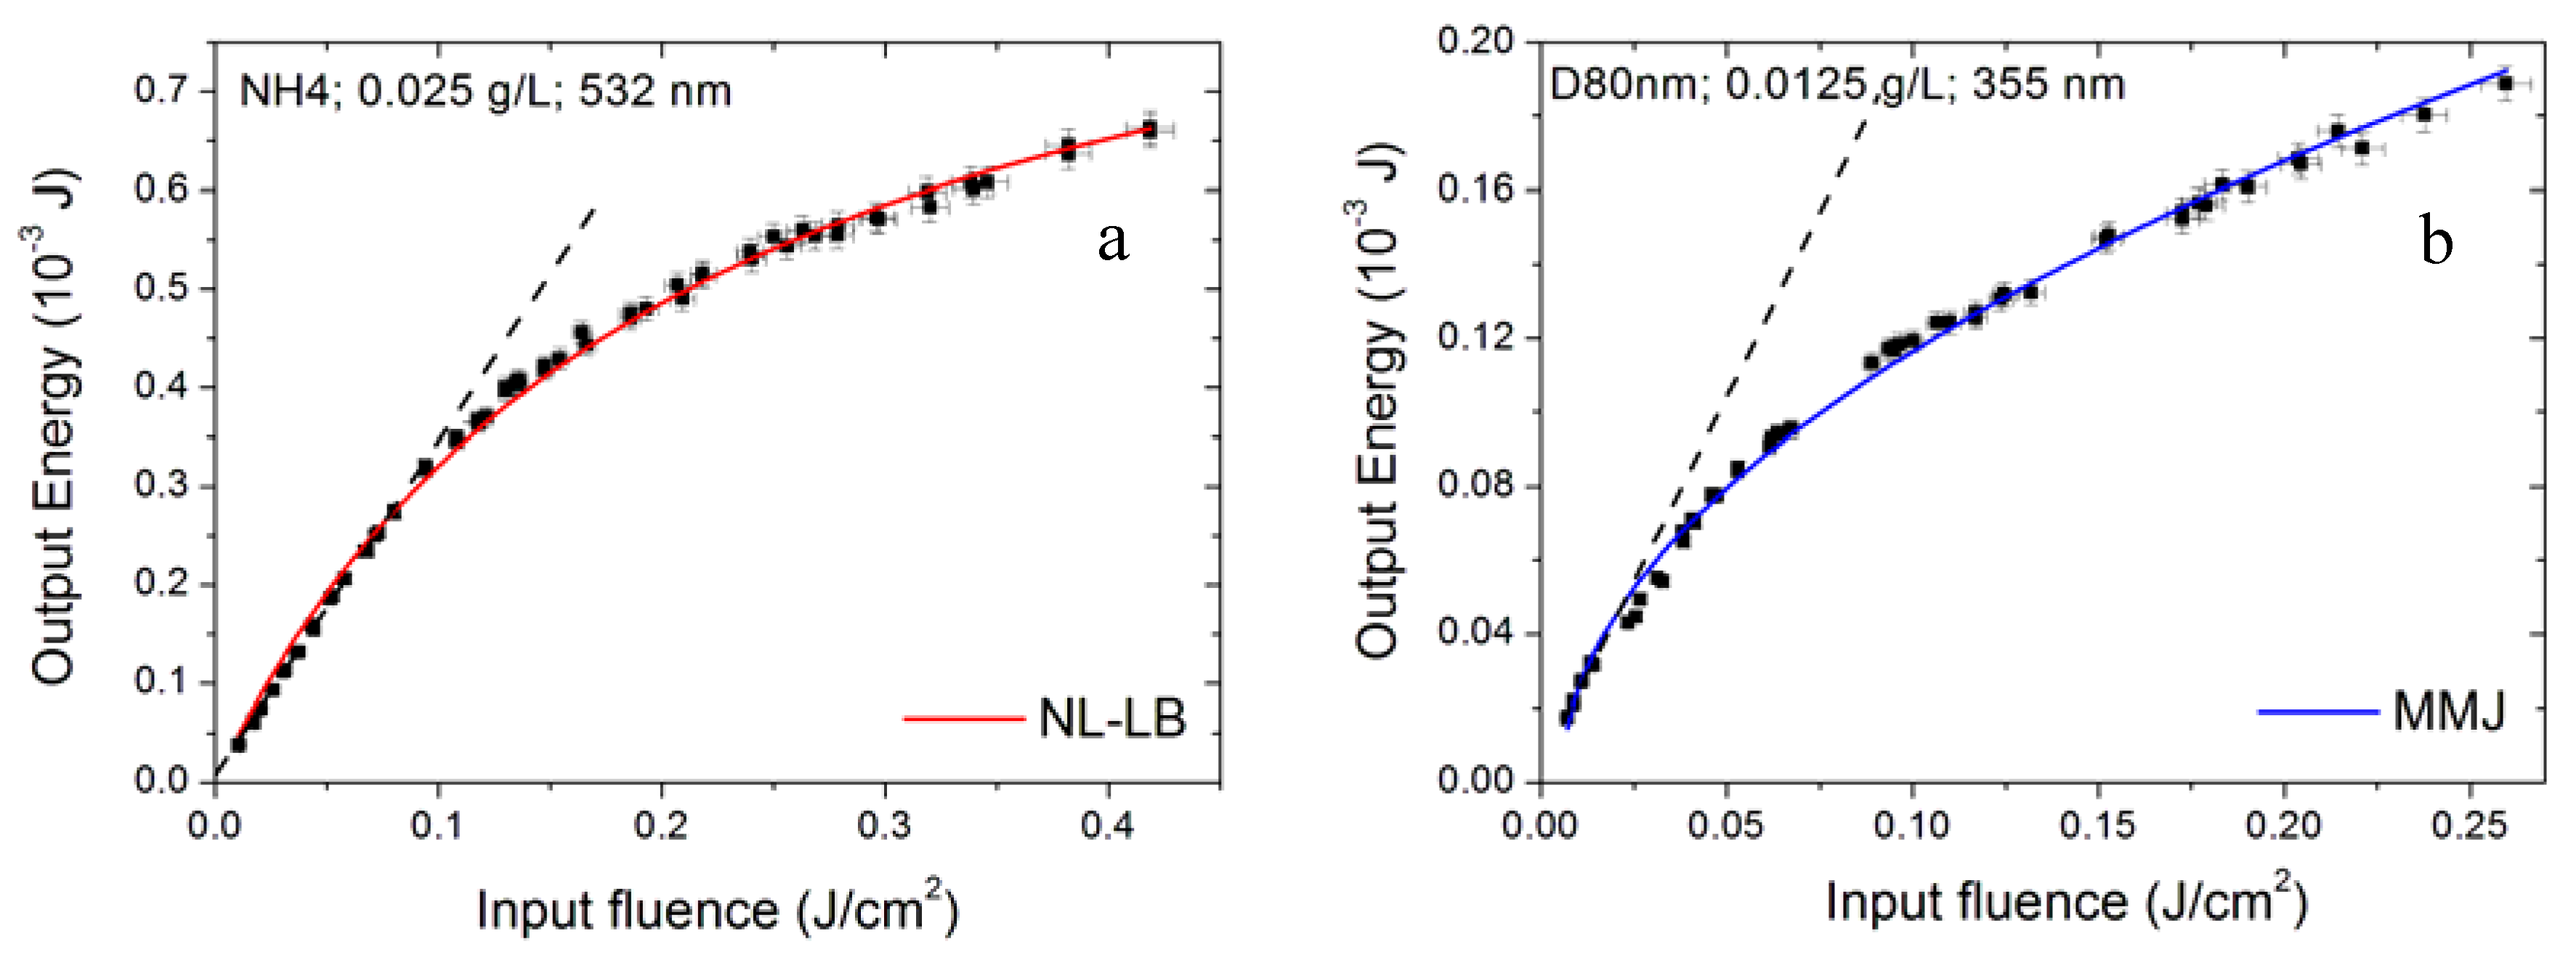
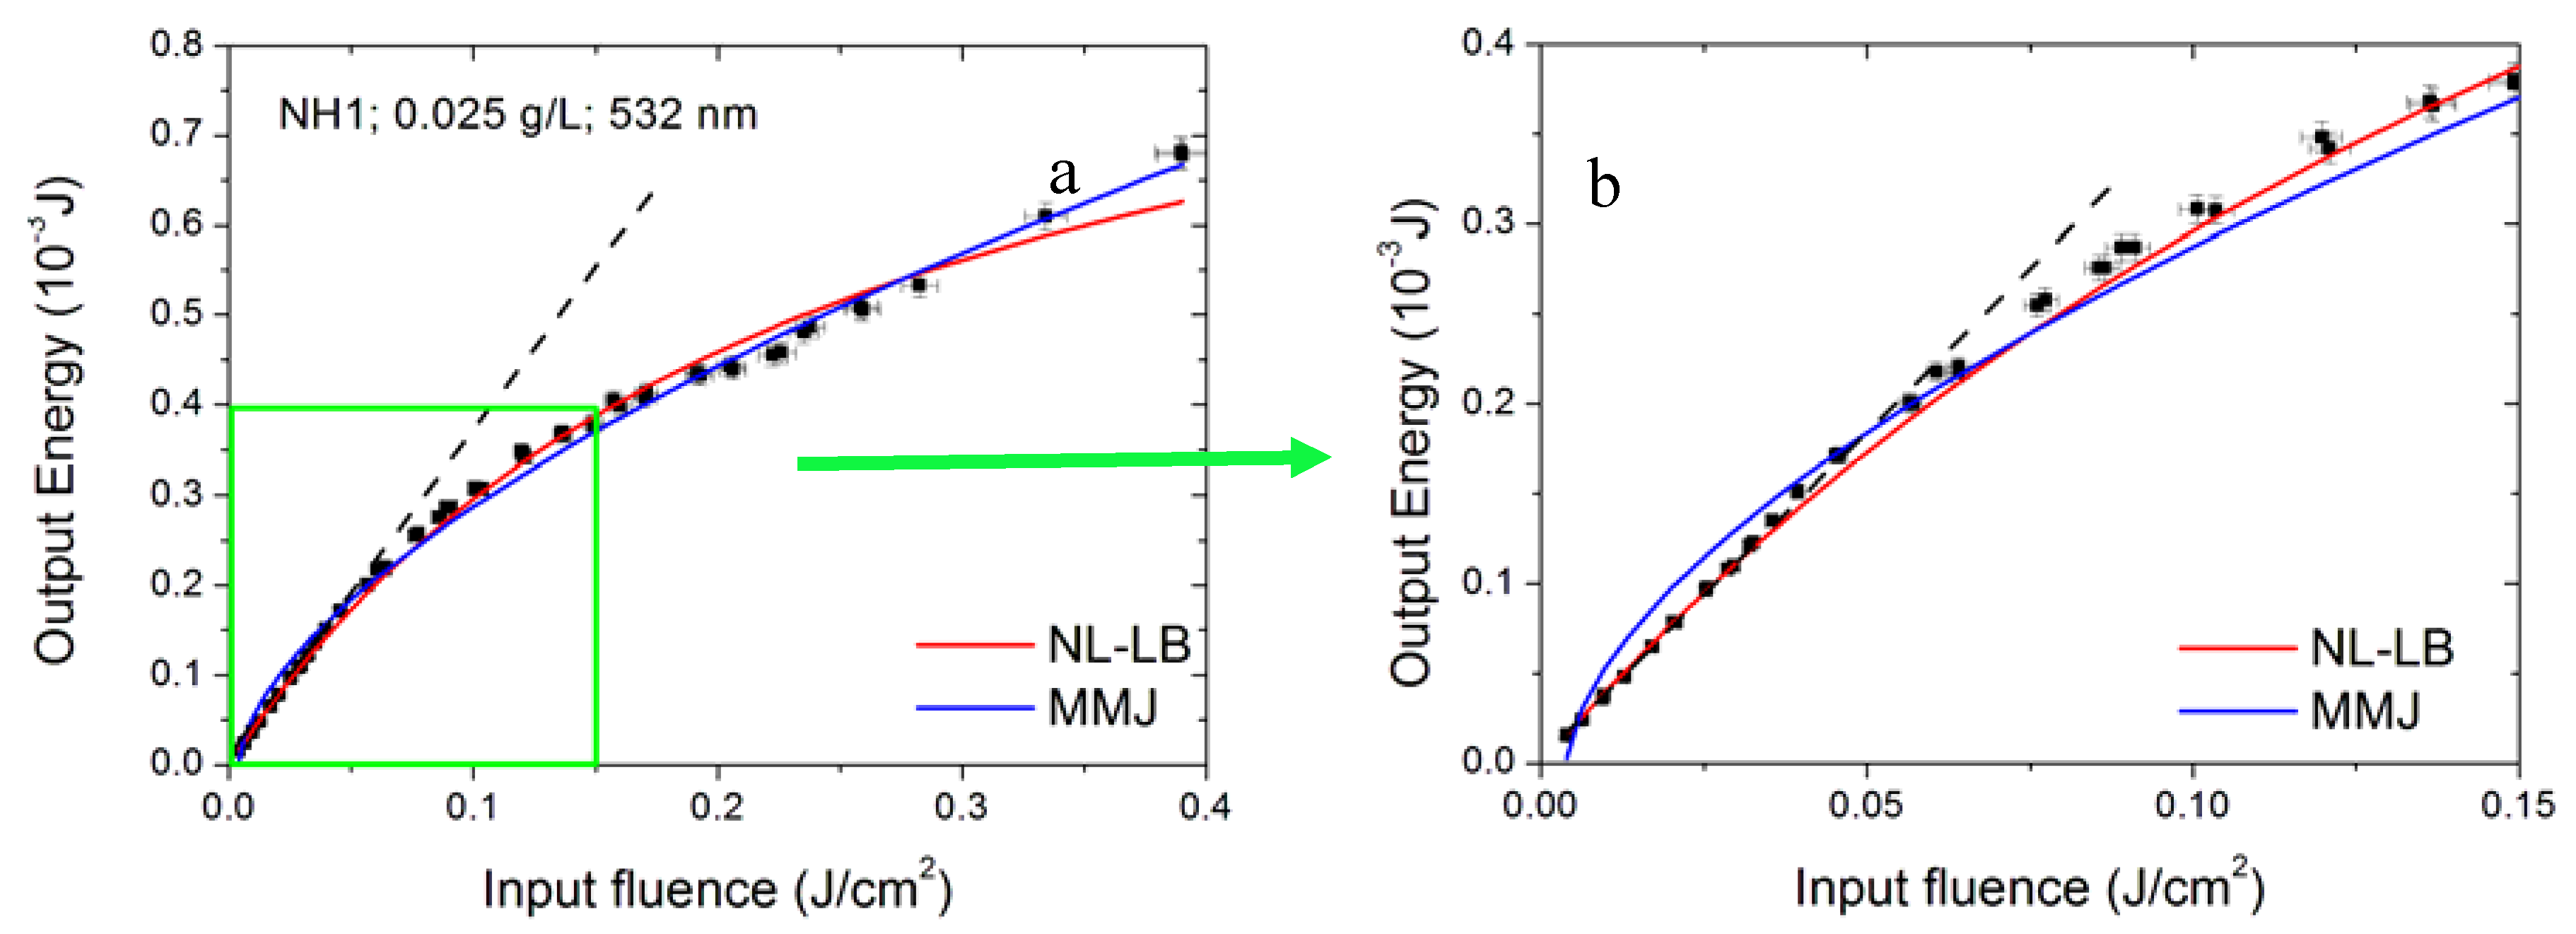
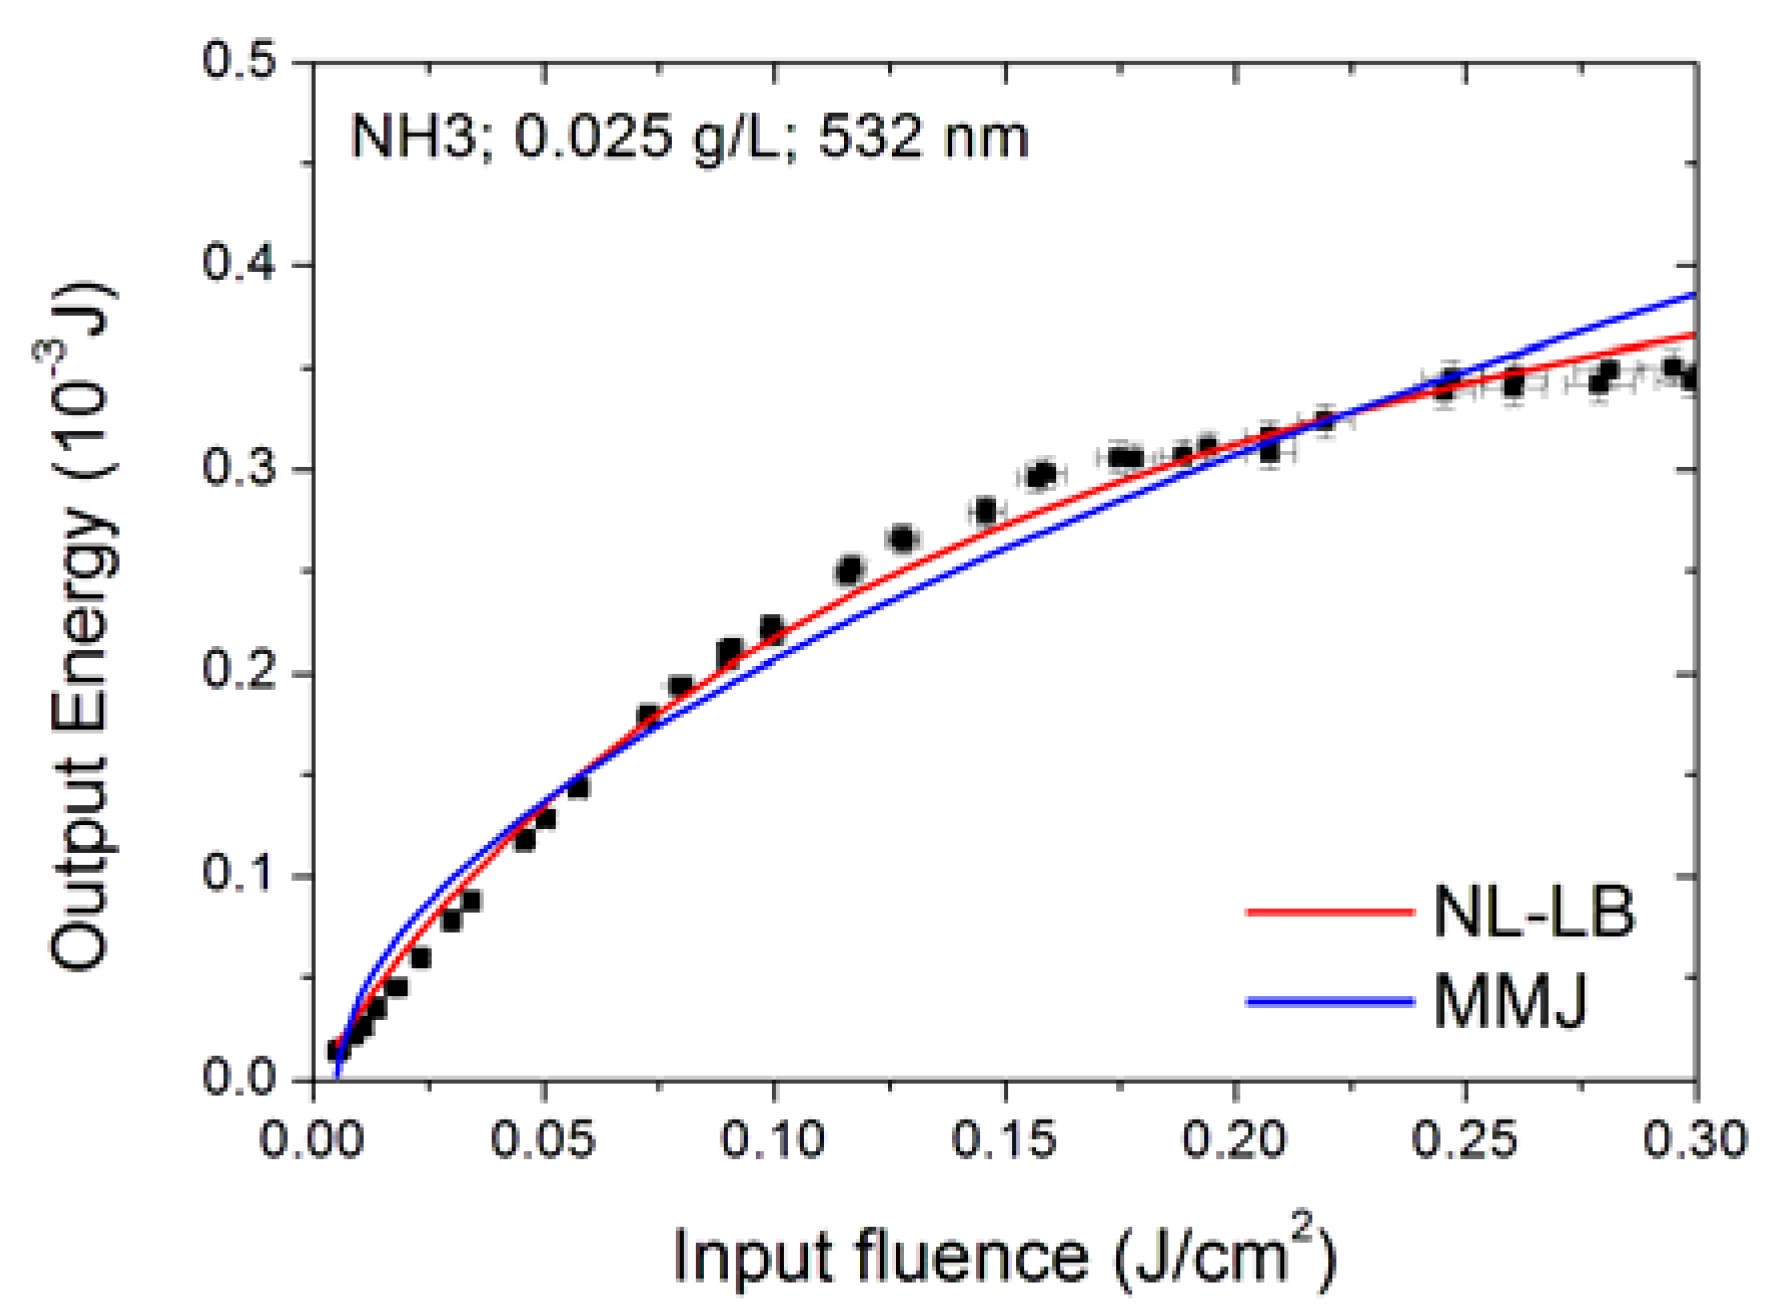
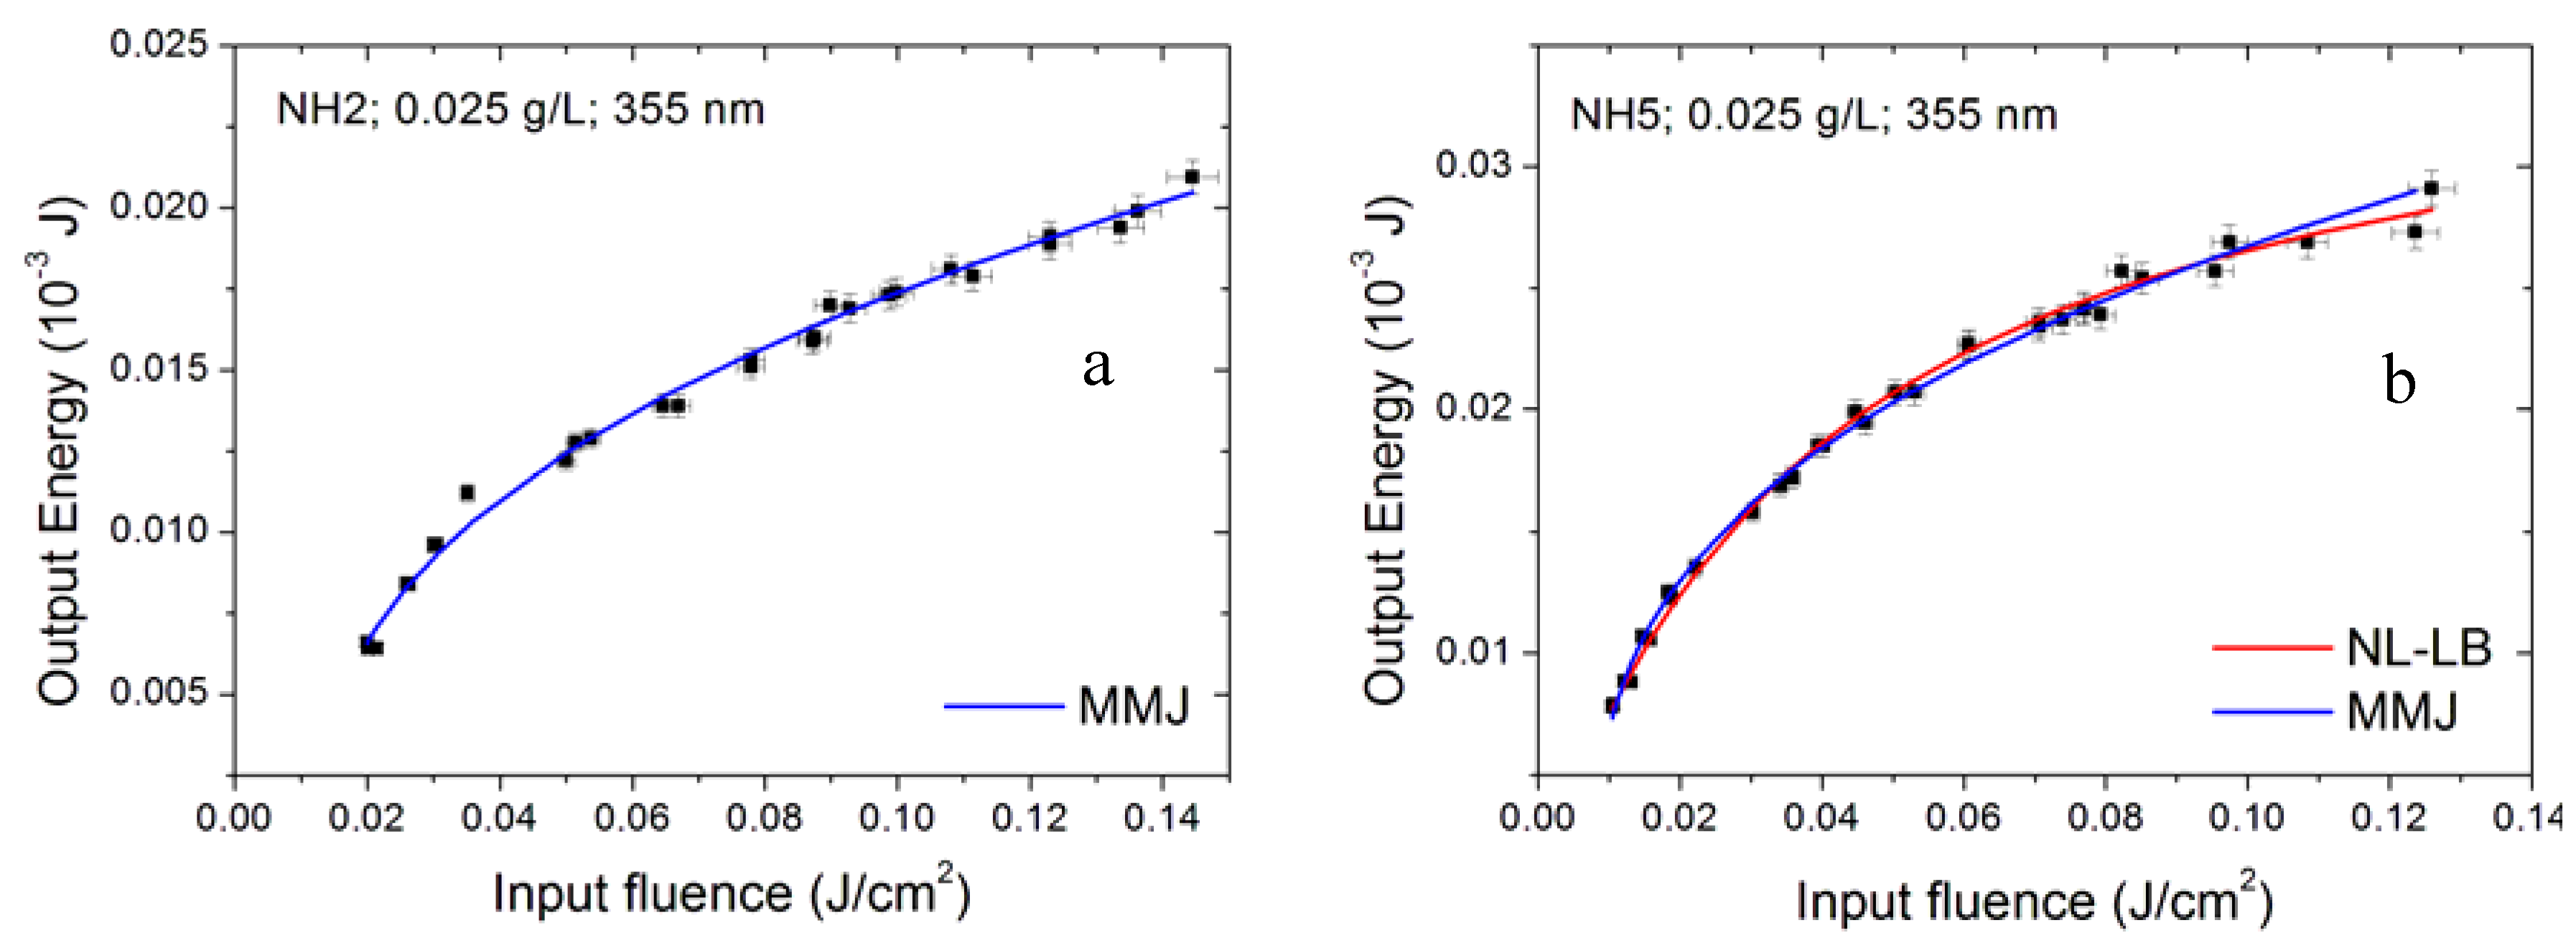
3.6. Modelling the Optical Limiting Curve
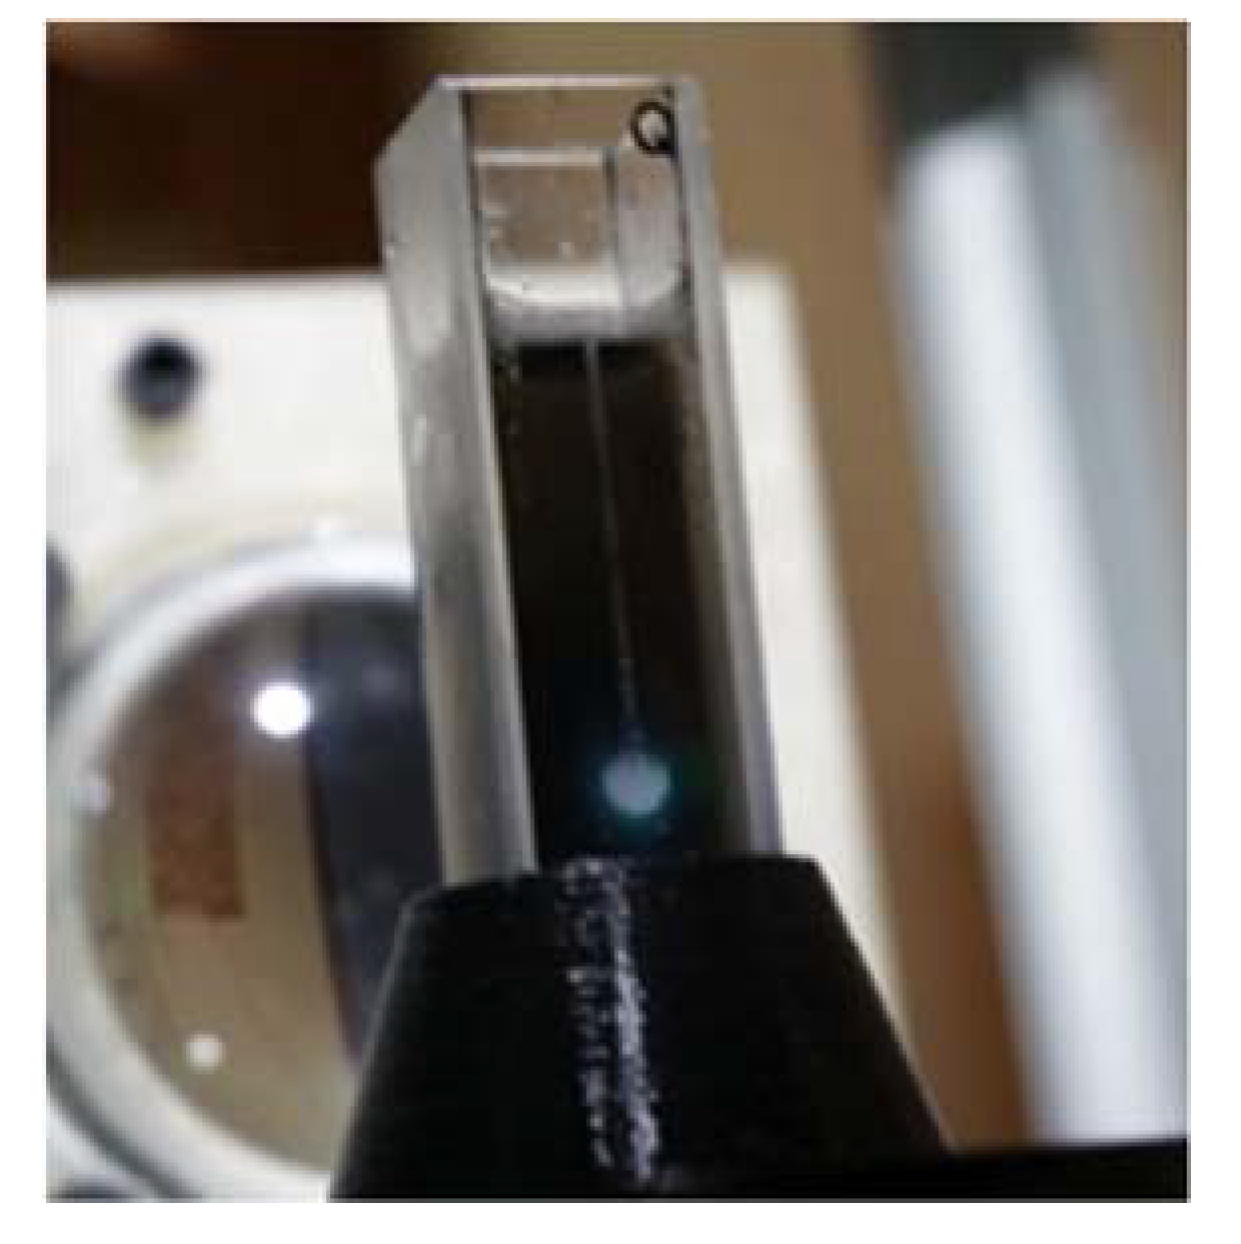
3.7. Production of Vapor Bubbles
4. Conclusions
Supplementary Materials
Author Contributions
Funding
Acknowledgments
Conflicts of Interest
Abbreviations
| Nomenclature | |
| Abbreviations | |
| OL | Optical limiting |
| CNTs | Carbon Nanotubes |
| SWCNHs | Single Walled Carbon Nanohorns |
| SDS | Sodium Dodecyl Sulphate |
| NH1, NH2, NH3, NH4, NH5, NH6, OX, B80nm, D80nm | Sample labels (explanations in Table 1) |
| UV–VIS | Ultraviolet–Visible |
| UV | Ultraviolet |
| DLS | Dynamic Light Scattering |
| ESA | Excited State Absorption |
| SEM | Scanning Electron Microscope |
| TEM | Transmission Electron Microscope |
| XRD | X-ray Diffraction |
| NL-LB | Nonlinear Lambert–Beer |
| MMJ | McEwan–Milsom–James |
| Symbols | |
| E | Energy |
| F | Energy fluence |
| T | Relative transmittance |
| Reduced Planck constant | |
| ω | Angular speed of the electromagnetic wave |
| z | Position in the sample |
| α | Linear extinction coefficient |
| σ1 | Excited State Absorption cross section |
| Ts2 | Fitting coefficient (see text for explanation) |
| L | Sample thickness |
| αe | Nonlinear extinction coefficient |
| S | S = Σi (observed Eout, i − computed Eout, i)2, see text for explanation |
| A | Laser spot area |
| Subscripts | |
| in | input |
| out | output |
| m | minimum |
| t | threshold |
Appendix A. Linearity of the Base Fluid

References
- Calvete, M.; Yang, G.Y.; Hanack, M. Porphyrins and phthalocyanines as materials for optical limiting. Synth. Met. 2004, 141, 231–243. [Google Scholar] [CrossRef]
- Van Stryland, E.W.; Wu, Y.Y.; Hagan, D.J.; Soileau, M.J.; Mansour, K. Optical limiting with semiconductors. J. Opt. Soc. Am. B 1988, 5, 1980–1988. [Google Scholar] [CrossRef] [Green Version]
- Khoo, I.C.; Michael, R.R.; Finn, G.M. Self-phase modulation and optical limiting of a low-power CO2 laser with a nematic liquid-crystal film. Appl. Phys. Lett. 1988, 52, 2108–2110. [Google Scholar] [CrossRef]
- Liberman, V.; Rothschild, M.; Bakr, O.M.; Stellacci, F. Optical limiting with complex plasmonic nanoparticles. J. Opt. 2010, 12, 065001. [Google Scholar] [CrossRef]
- Porel, S.; Singh, S.; Harsha, S.S.; Rao, D.N.; Radhakrishnan, T.P. Nanoparticle-embedded polymer: In situ synthesis, free-standing films with highly monodisperse silver nanoparticles and optical limiting. Chem. Mater. 2005, 17, 9–12. [Google Scholar] [CrossRef]
- Tutt, L.W.; Kost, A. Optical limiting performance of C60 and C70 solutions. Nature 1992, 356, 225–226. [Google Scholar] [CrossRef]
- Vincent, D.; Cruickshank, J. Optical limiting with C60 and other fullerenes. Appl. Opt. 1997, 36, 7794–7798. [Google Scholar] [CrossRef] [PubMed]
- Riggs, J.E.; Walker, D.B.; Carroll, D.L.; Sun, Y.P. Optical limiting properties of suspended and solubilized carbon nanotubes. J. Phys. Chem. B 2000, 104, 7071–7076. [Google Scholar] [CrossRef]
- Koudoumas, E.; Kokkinaki, O.; Konstantaki, M.; Couris, S.; Korovin, S.; Detkov, P.; Kuznetsov, V.; Pimenov, S.; Pustovoi, V. Onion-like carbon and diamond nanoparticles for optical limiting. Chem. Phys. Lett. 2002, 357, 336–340. [Google Scholar] [CrossRef]
- Choi, S.U.; Eastman, J. Enhancing Thermal Conductivity of Fluids with Nanoparticles; No. ANL/MSD/CP-84938; CONF-951135-29; Argonne National Lab.: Lemont, IL, USA, 1995. [Google Scholar]
- Gupta, M.; Singh, V.; Kumar, R.; Said, Z. A review on thermophysical properties of nanofluids and heat transfer applications. Renew. Sustain. Energy Rev. 2017, 74, 638–670. [Google Scholar] [CrossRef]
- Abad, J.M.N.; Alizadeh, R.; Fattahi, A.; Doranehgard, M.H.; Alhajri, E.; Karimi, N. Analysis of transport processes in a reacting flow of hybrid nanofluid around a bluff-body embedded in porous media using artificial neural network and particle swarm optimization. J. Mol. Liq. 2020, 313, 113492. [Google Scholar] [CrossRef]
- Sidik, N.A.C.; Yazid, M.N.A.W.M.; Samion, S. A review on the use of carbon nanotubes nanofluid for energy harvesting system. Int. J. Heat Mass Transf. 2017, 111, 782–794. [Google Scholar] [CrossRef]
- Lama, C.W.; James, J.T.; McCluskey, R.; Arepalli, S.; Hunter, R.L. A Review of Carbon Nanotube Toxicity and Assessment of Potential Occupational and Environmental Health Risks. Crit. Rev. Toxicol. 2006, 36, 189–217. [Google Scholar] [CrossRef]
- Iijima, S. Helical microtubules of graphitic carbon. Nature 1991, 354, 56–58. [Google Scholar] [CrossRef]
- Miyawaki, J.; Yudasaka, M.; Kubo, T.A.Y.; Iijima, S. Toxicity of Single-Walled Carbon Nanohorns. ACS Nano 2008, 2, 213–226. [Google Scholar] [CrossRef] [PubMed]
- Zhu, S.; Xu, G. Single-Walled carbon nanohorns and their application. Nanoscale 2010, 2, 2538–2549. [Google Scholar] [CrossRef]
- Sani, E.; Barison, S.; Pagura, C.; Mercatelli, L.; Sansoni, P.; Fontani, D.; Jafrancesco, D.; Francini, F. Carbon nanohorns-based nanofluids as direct sunlight absorbers. Opt. Express 2010, 18, 5179–5187. [Google Scholar] [CrossRef] [PubMed]
- Dengler, S.; Muller, O.; Hege, C.; Eberle, B. Nonlinear optical effects in colloidal carbon nanohorns- a new optical limiting material. J. Phys. D Appl. Phys. 2016, 49, 365501. [Google Scholar] [CrossRef]
- Wang, J.; Hernandez, Y.; Lotya, M.; Coleman, J.N.; Blau, W.J. Broadband nonlinear optical response of graphene dispersions. Adv. Mater. 2009, 21, 2430–2435. [Google Scholar] [CrossRef]
- Wang, J.; Blau, W.J. Solvent effect on optical limiting properties of single-walled carbon nanotube dispersions. J. Phys. Chem. C 2008, 112, 2298–2303. [Google Scholar] [CrossRef]
- Mishra, S.R.; Rawat, H.S.; Mehendale, S.C.; Rustagi, K.C.; Sood, A.K.; Bandyopadhyay, R.; Govindaraj, A.; Rao, C.N.R. Optical limiting in single-walled carbon nanotube suspensions. Chem. Phys. Lett. 2000, 317, 510–514. [Google Scholar] [CrossRef] [Green Version]
- Sani, E.; Dell’Oro, A. Optical constants of ethylene glycol over an extremely wide spectral range. Opt. Mater. 2014, 37, 36. [Google Scholar] [CrossRef]
- Sani, E.; Dell’Oro, A. Spectral optical constants of ethanol and isopropanol from ultraviolet to far infrared. Opt. Mater. 2016, 60, 137–141. [Google Scholar] [CrossRef]
- Wang, J.; Blau, W.J. Nonlinear optical and optical limiting properties of individual single-walled carbon nanotubes. Appl. Phys. B Lasers Opt. 2008, 91, 521–524. [Google Scholar] [CrossRef]
- Sani, E.; Papi, N.; Mercatelli, L.; Żyła, G. Graphite/diamond ethylene glycol-nanofluids for solar energy applications. Renew. Energy 2018, 126, 692–698. [Google Scholar] [CrossRef]
- Sani, E.; Vallejo, J.P.; Mercatelli, L.; Martina, M.R.; Di Rosa, D.; Dell’Oro, A.; Lugo, L. A Comprehensive Physical Profile for Aqueous Dispersions of Carbon Derivatives as Solar Working Fluids. Appl. Sci. 2020, 10, 528. [Google Scholar] [CrossRef] [Green Version]
- Vallejo, J.P.; Mercatelli, L.; Martina, M.R.; Di Rosa, D.; Dell’Oro, A.; Lugo, L.; Sani, E. Comparative study of different functionalized graphene-nanoplatelet aqueous nanofluids for solar energy applications. Renew. Energy 2019, 141, 791–801. [Google Scholar] [CrossRef]
- Lapotko, D. Optical excitation and detection of vapor bubbles around plasmonic nanoparticles. Opt. Express 2009, 17, 2538–2556. [Google Scholar] [CrossRef] [PubMed]
- Azami, T.; Kasuya, D.; Yoshitake, T.; Kubo, Y.; Yudasaka, M.; Ichihashi, T.; IIjima, S. Production of small single-wall carbon nanohorns by CO2 laser ablation of graphite in Ne-gas atmosphere. Carbon N. Y. 2007, 45, 1364–1369. [Google Scholar] [CrossRef]
- Kasuya, D.; Yudasaka, M.; Takahashi, K.; Kokai, F.; Iijima, S. Selective Production of Single-Wall Carbon Nanohorn Aggregates and Their Formation Mechanism. J. Phys. Chem. B 2002, 106, 4947–4951. [Google Scholar] [CrossRef]
- Battiston, S.; Bolzan, M.; Fiameni, S.; Gerbasi, R.; Meneghetti, M.; Miorin, E.; Mortalo, C.; Pagura, C. Single wall carbon nanohorns coated with anatase titanium oxide. Carbon N. Y. 2009, 47, 1321–1326. [Google Scholar] [CrossRef]
- Agresti, F.; Barison, S.; Famengo, A.; Pagura, C.; Fedele, L.; Rossi, S.; Bobbo, S.; Rancan, M.; Fabrizio, M. Surface oxidation of Single Wall Carbon Nanohorns for the production of surfactant free water-based colloids. J. Colloid Interface Sci. 2018, 514, 528–533. [Google Scholar] [CrossRef] [PubMed]
- Vanyukov, V.; Mogileva, T.; Mikheev, G.; Puzir, A.; Bondar, V.; Svirko, Y. Size effect on the optical limiting in suspensions of detonation nanodiamond clusters. Appl. Opt. 2013, 52, 4123–4130. [Google Scholar] [CrossRef] [PubMed] [Green Version]
- Hagam, D.J.; Xia, T.; Said, A.A.; Van Stryland, E.W. Tandem Limiter Optimization. In Nonlinear Optical Materials for Switching and Limiting; International Society for Optics and Photonics: Bellingham, WA, USA, 1994; Volume 2229, pp. 179–191. [Google Scholar]
- Pritchett, T. Models for Saturable and Reverse Saturable Absorption in Materials for Optical Limiting; No. ARL-TR-2567; Army Research Lab.: White Sands Missile Range, NM, USA, 2002. [Google Scholar]
- Vincent, D. Optical limiting threshold in carbon suspension and reverse saturable absorber materials. Appl. Opt. 2001, 40, 6646–6653. [Google Scholar] [CrossRef]
- McEwan, K.J.; Milsom, P.K.; James, D. Nonlinear optical effects in carbon suspensions. In Nonlinear Optical Liquids for Power Limiting and Imaging; International Society for Optics and Photonics: Bellingham, WA, USA, 1998; Volume 3472, pp. 42–53. [Google Scholar]


| Sample Label | Morphology | Individual Nanoparticle (Dry) Size (nm) | Concentration g/L | Notes on Preparation |
|---|---|---|---|---|
| NH1 | Dahlia | 60 | 0.025 0.05 | SDS 0.0025 g/L SDS 0.005 g/L Sonication only |
| NH2 | Dahlia | 60 | 0.025 0.05 | SDS 0.0025 g/L SDS 0.005 g/L Sonication + 15′ homog. |
| NH3 | Dahlia | 60 | 0.025 0.05 | SDS 0.0025 g/L SDS 0.005 g/L Sonication + 30′ homog. |
| NH4 | Dahlia | 60 | 0.025 0.05 | SDS 0.0025 g/L SDS 0.005 g/L Sonication + 45′ homog. |
| NH5 | Dahlia | 60 | 0.025 0.05 | SDS 0.0025 g/L SDS 0.005 g/L Sonication + 60′ homog. |
| NH6 * | Dahlia | 60 | 0.0125 | SDS 0.00625 g/L Sonication+15′ homog. |
| OX | Oxidized dahlia | 60 | 0.0125 0.025 | pH 4.8 Sonication + 15′ homog. |
| B80nm | Bud | 80 | 0.0125 0.025 (0.05) | SDS 0.075 g/L SDS 0.15 g/L SDS 0.30 g/L |
| D80nm | Dahlia | 80 | 0.0125 0.025 | SDS 0.075 g/L 0.15 g/L |
| Sample Label | DLS Hydrodynamic Sizes (nm) | ζ Potential (mV) |
|---|---|---|
| NH1 | 202 | −27.4 |
| NH2 | 118 | −29.0 |
| NH3 | 151 | −29.5 |
| NH4 | 98 | −32.7 |
| NH5 | 123 | −31.8 |
| B80nm | 197 | −28.0 |
| D80nm | 241 | −33.3 |
| NH6 | 140 | −46.5 |
| OX | 115 | −45.1 |
| Minimum Relative Transmittances Tmin | ||||
|---|---|---|---|---|
| Sample | Concentration g/L | @355 nm | @532 nm | @1064 nm |
| NH1 | 0.025 0.05 | 0.18 | 0.46 0.33 | 0.70 0.47 |
| NH2 | 0.025 0.05 | 0.42 | 0.60 0.71 | - - |
| NH3 | 0.025 0.05 | 0.24 | 0.43 0.49 | 0.83 0.80 |
| NH4 | 0.025 0.05 | 0.30 | 0.44 0.63 | 0.82 - |
| NH5 | 0.025 0.05 | 0.35 | 0.56 0.65 | - - |
| B80nm | 0.0125 0.025 | 0.49 0.30 | 0.81 0.81 | - - |
| D80nm | 0.0125 0.025 | 0.31 0.24 | 0.75 0.73 | - - |
| NH6 | 0.0125 | 0.64 | 0.90 | - |
| OX | 0.0125 0.025 | 0.70 | x 0.90 | - - |
| Sample | Concentration g/L | Model | Wavelength | Threshold Fluence (mJ/cm2) |
|---|---|---|---|---|
| NH1 | 0.025 | NL-LB | 532 nm | 18.7 ± 0.8 |
| NL-LB | 1064 nm | 73 ± 10 | ||
| NH2 | 0.025 | MMJ | 355 nm | 21 ± 2 |
| NL-LB | 532 nm | 36.6 ± 1.2 | ||
| 0.05 | NL-LB | 532 nm | 64 ± 4 | |
| MMJ | 532 nm | 133 ± 4 | ||
| NH3 | 0.025 | NL-LB | 1064 nm | 178 ± 21 |
| NH4 | 0.025 | NL-LB | 532 nm | 20.8 ± 0.8 |
| NL-LB | 1064 nm | 68 ± 5 | ||
| 0.05 | NL-LB | 532 nm | 70 ± 2 | |
| MMJ | 532 nm | 128 ± 3 | ||
| NH5 | 0.025 | NL-LB | 355 nm | 4.0 ± 0.1 |
| MMJ | 355 nm | 12.6 ± 0.3 | ||
| NL-LB | 532 nm | 32.4 ± 0.8 | ||
| 0.05 | NL-LB | 532 nm | 93 ± 4 | |
| MMJ | 532 nm | 125 ± 4 | ||
| B80nm | 0.0125 | MMJ | 355 nm | 32 ± 1 |
| NL-LB | 532 nm | 145 ± 12 | ||
| MMJ | 532 nm | 46 ± 4 | ||
| 0.025 | NL-LB | 532 nm | 166 ± 17 | |
| MMJ | 532 nm | 64.5 ± 0.8 | ||
| D80nm | 0.0125 | MMJ | 355 nm | 11.1 ± 0.3 |
| NL-LB | 532 nm | 66 ± 4 | ||
| MMJ | 532 nm | 44 ± 1 | ||
| 0.025 | NL-LB | 355 nm | 7.0 ± 0.7 | |
| NL-LB | 532 nm | 108 ± 8 | ||
| MMJ | 532 nm | 48 ± 1 | ||
| NH6 | 0.0125 | NL-LB | 355 nm | 20 ± 1 |
| MMJ | 355 nm | 11.9 ± 0.3 | ||
| NL-LB | 532 nm | 832 ± 416 | ||
| OX | 0.0125 | NL-LB | 355 nm | 34 ± 2 |
| MMJ | 355 nm | 29 ± 3 |
| Sample | Concentration g/L | αe/α | Wavelength |
|---|---|---|---|
| NH2 | 0.025 | 2.5 ± 0.2 | 355 nm |
| 0.05 | 2.0 ± 0.2 | 532 nm | |
| NH4 | 0.05 | 1.9 ± 0.1 | 532 nm |
| NH5 | 0.025 | 2.8 ± 0.2 | 355 nm |
| 0.05 | 1.6 ± 0.1 | 532 nm | |
| B80nm | 0.0125 | 2.3 ± 0.1 | 355 nm |
| 1.2 ± 0.1 | 532 nm | ||
| 0.025 | 1.2 ± 0.1 | 532 nm | |
| D80nm | 0.0125 | 2.0 ± 0.1 | 355 nm |
| 1.4 ± 0.1 | 532 nm | ||
| 0.025 | 1.3 ± 0.1 | 532 nm | |
| NH6 | 0.0125 | 1.5 ± 0.1 | 355 nm |
| OX | 0.0125 | 1.5 ± 0.1 | 355 nm |
Publisher’s Note: MDPI stays neutral with regard to jurisdictional claims in published maps and institutional affiliations. |
© 2020 by the authors. Licensee MDPI, Basel, Switzerland. This article is an open access article distributed under the terms and conditions of the Creative Commons Attribution (CC BY) license (http://creativecommons.org/licenses/by/4.0/).
Share and Cite
Sani, E.; Papi, N.; Mercatelli, L.; Barison, S.; Agresti, F.; Rossi, S.; Dell’Oro, A. Optical Limiting of Carbon Nanohorn-Based Aqueous Nanofluids: A Systematic Study. Nanomaterials 2020, 10, 2160. https://doi.org/10.3390/nano10112160
Sani E, Papi N, Mercatelli L, Barison S, Agresti F, Rossi S, Dell’Oro A. Optical Limiting of Carbon Nanohorn-Based Aqueous Nanofluids: A Systematic Study. Nanomaterials. 2020; 10(11):2160. https://doi.org/10.3390/nano10112160
Chicago/Turabian StyleSani, Elisa, Nicolò Papi, Luca Mercatelli, Simona Barison, Filippo Agresti, Stefano Rossi, and Aldo Dell’Oro. 2020. "Optical Limiting of Carbon Nanohorn-Based Aqueous Nanofluids: A Systematic Study" Nanomaterials 10, no. 11: 2160. https://doi.org/10.3390/nano10112160
APA StyleSani, E., Papi, N., Mercatelli, L., Barison, S., Agresti, F., Rossi, S., & Dell’Oro, A. (2020). Optical Limiting of Carbon Nanohorn-Based Aqueous Nanofluids: A Systematic Study. Nanomaterials, 10(11), 2160. https://doi.org/10.3390/nano10112160