The electrochemical impedance spectroscopy (EIS), and potentiodynamic polarization (PP) corrosion measurements were carried out in 3.5 wt. % NaCl solutions at room temperature, to illustrate the corrosion performance of the electroless NiP-TNPs coatings with different Ti nanoparticles concentrations.
3.5.1. Electrochemical Impedance Spectroscopy (EIS)
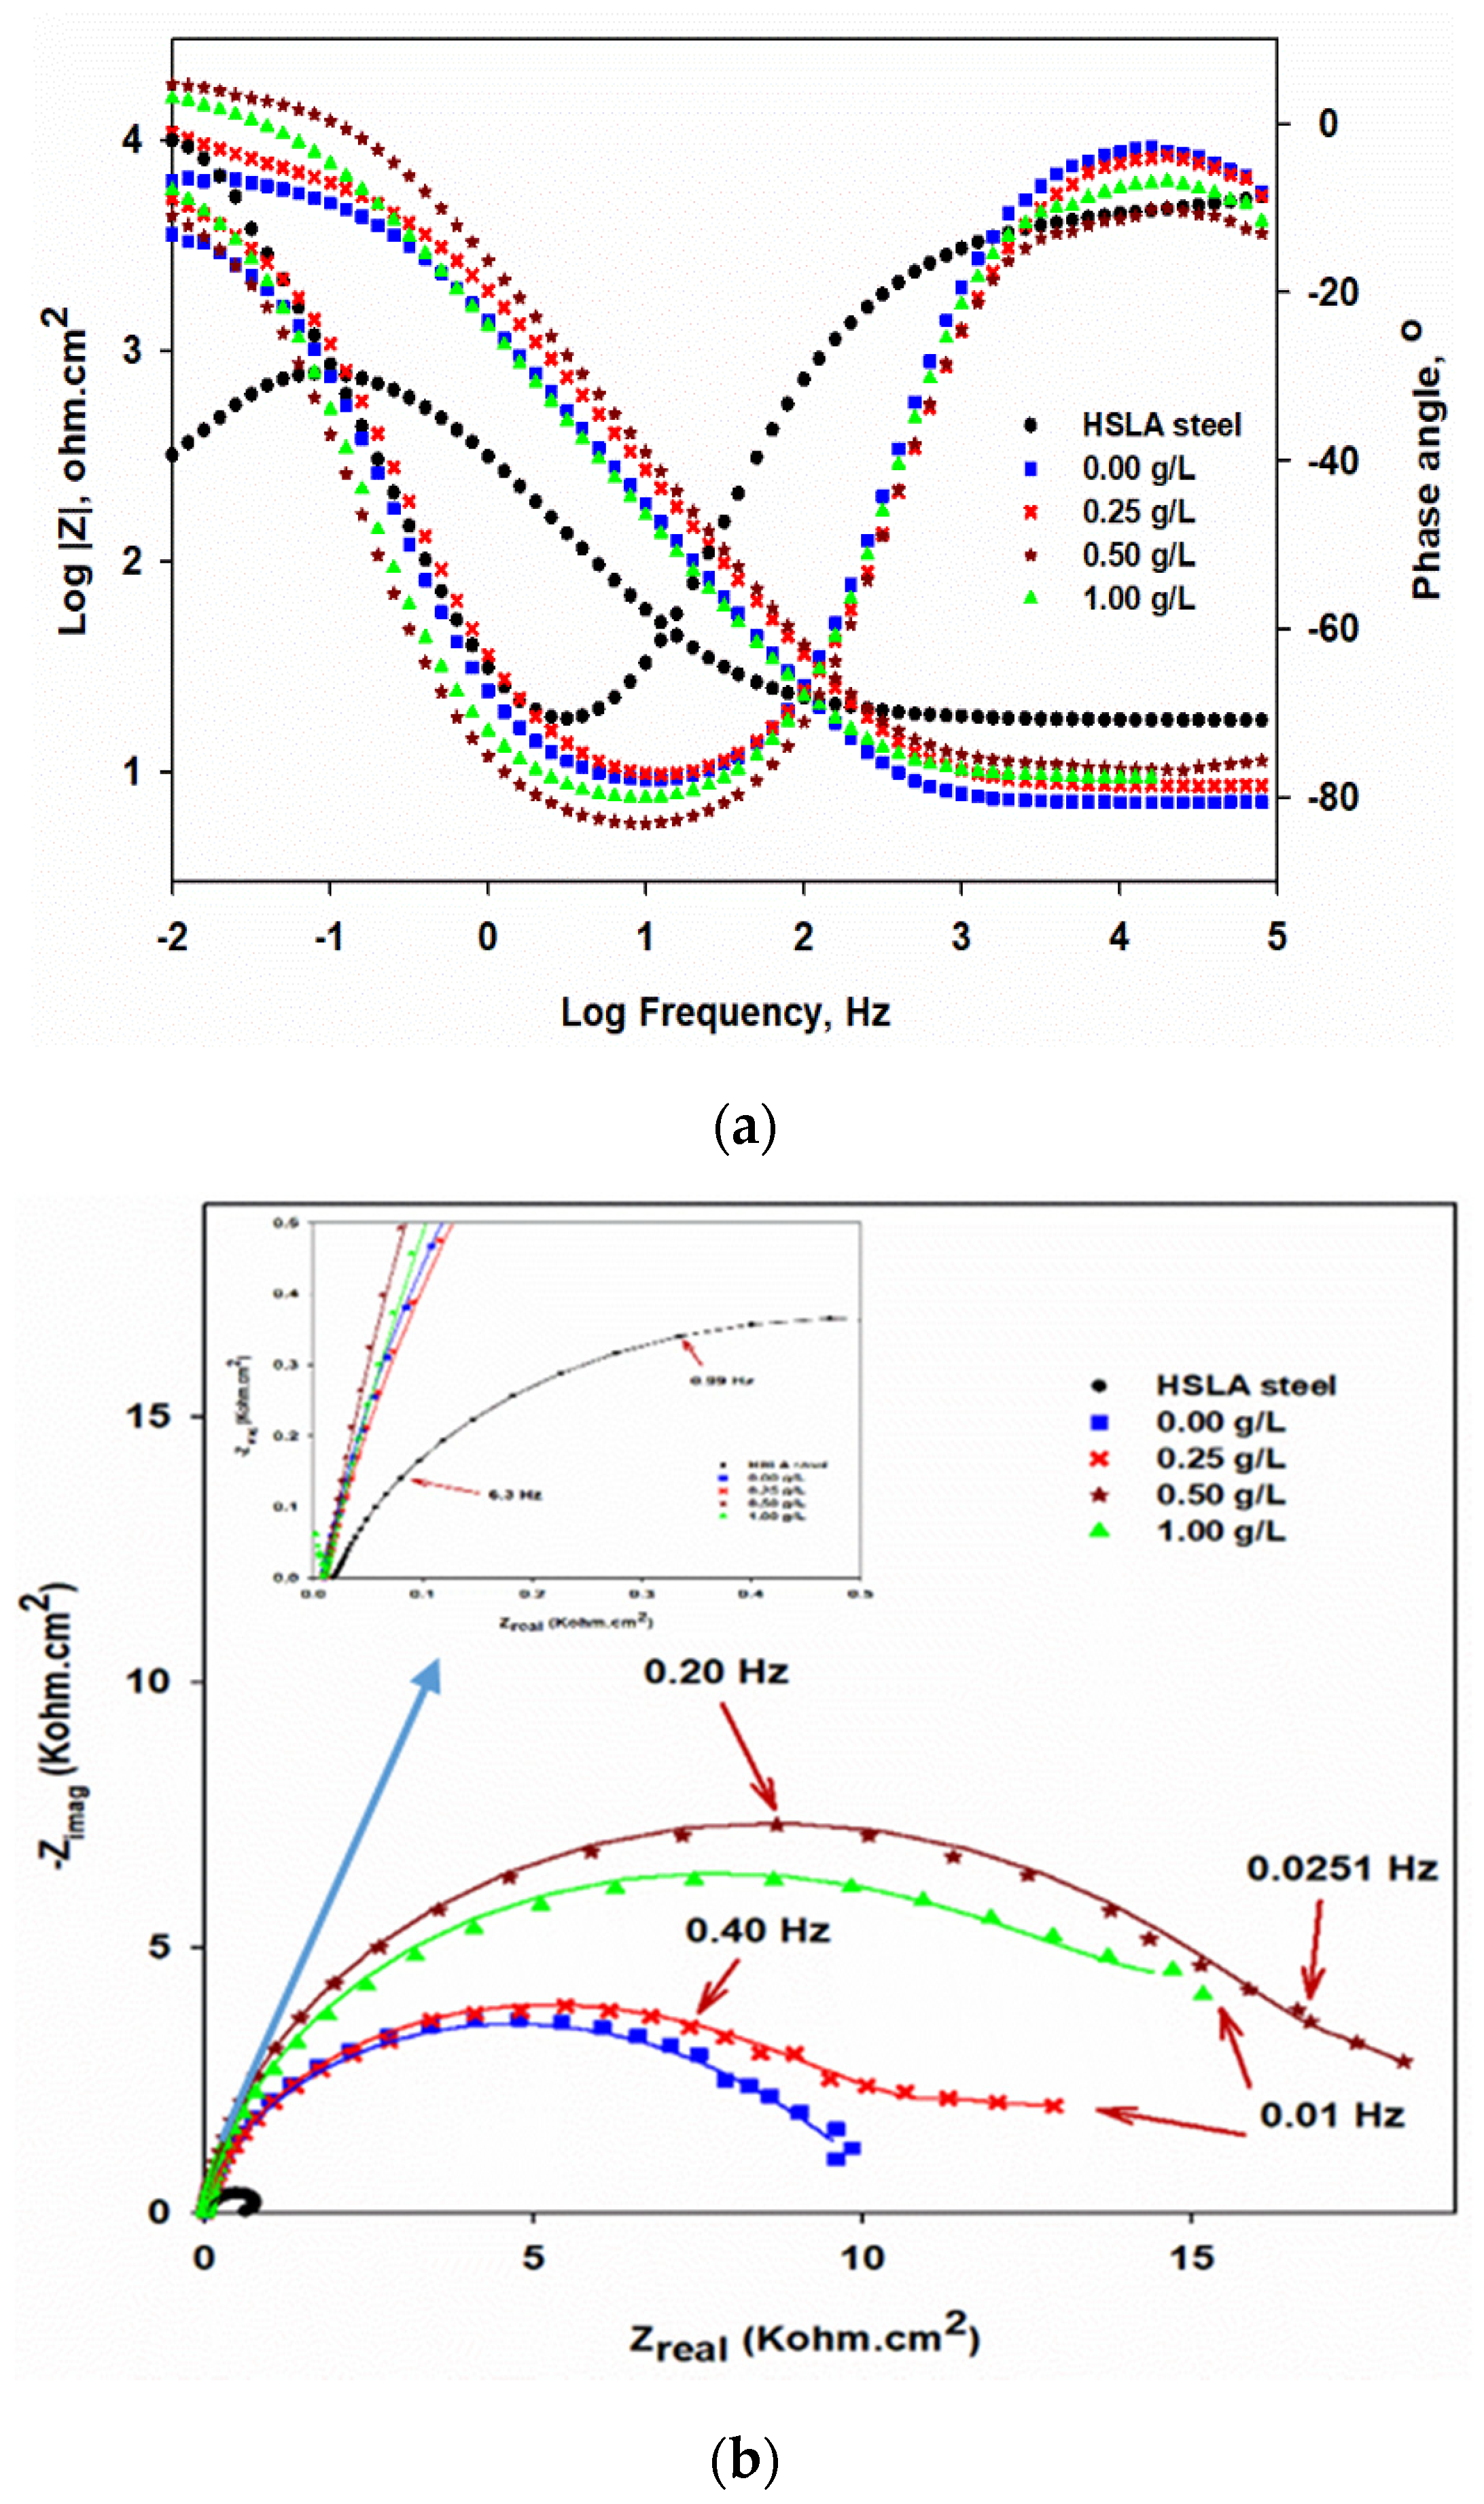
The bode-phase angle plots and the corresponding Nyquist-plots, which are measured at OCP, for the developed coatings are shown in
Figure 8a,b, respectively. The inset in
Figure 8b is the magnifications of the low impedance regions of the Nyquist plots of the different measured samples. The measured and the fitted EIS data are represented by dots and complete lines, respectively.
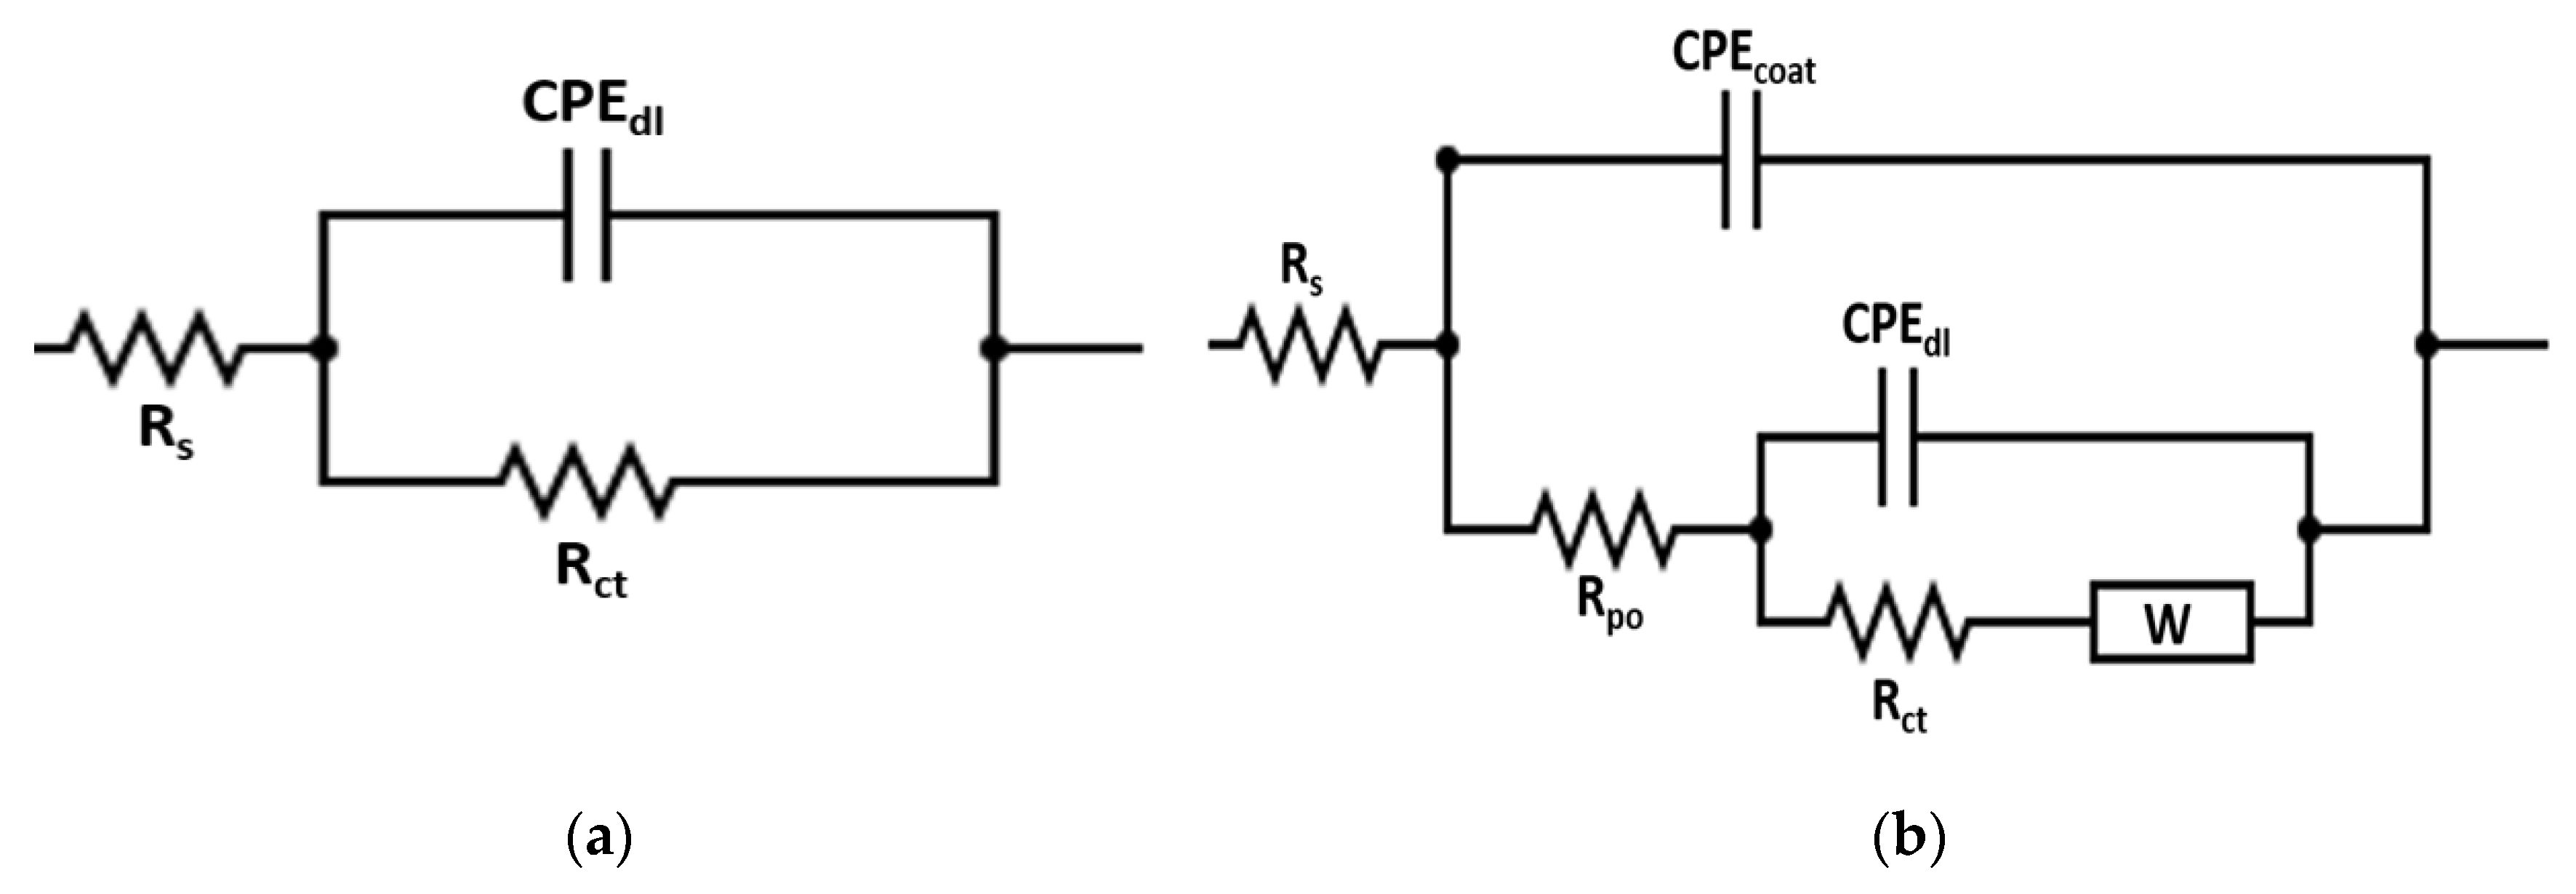
Figure 9a,b shows the equivalent circuits that were used to fit the EIS data and possessed one and two–time constants with a diffusion component, respectively, depending mainly on the coating type. Different EIS parameters obtained after fitting the measured data are shown in
Table 5. The
Rs,
Rpo, and
Rct are solution, pore, and charge transfer resistances, respectively, CPE
coat donates the constants-phase element for the coating and CPE
dl is the constant-phase element for the double layer. The low–frequency time constant (CPE
dl and R
ct) demonstrates to the substrate/coating interface, whereas the combination of CPE
coat and
Rpo represents the high–frequency time constant that corresponds to the coating/solution interface. The
W is referred to the Warburg diffusion resistance, which clarifies the existence of electrolyte diffusion. The CPE is a pseudo-capacitive element, which is used instead of the regular one due to the surface roughness and the coating inhomogeneity, which is assigned to the irregular thickness of the deposited coatings, in addition to the non-uniform current distribution at the surface [
42]. The impedance of CPE is calculated using the following Equation [
43];
where Q is the CPE constant and equals to the (1/|Z|) at ω = 1 rad/s, j is the imaginary number, ω is the angular frequency of the AC signal (1/rad), and
n is the CPE exponent. The deviation from ideal behavior is expressed by the exponent
n (0 ≤
n ≤ 1). The ideal resistor is indicated when
n equals zero, whereas the ideal capacitor is acted when
n equals 1 [
44,
45].
As in
Figure 8a and
Table 5, the impedance value for the HSLA steel substrate is approximately 670 Ω·cm
2. The impedance value has increased by one order magnitude for electroless NiP coating compared to that of the substrate. The formation of the hypophosphite layer causes the increased impedance value of the NiP coating due to the reaction of the phosphorus with water [
46,
47]. This layer acts as a protective layer for nickel, since it prevents its further hydration in the corrosive media, resulting in the improvement of the corrosion-protection of the NiP coatings. The impedance of the NiP coating is further increased with the reinforcement of TNPs. As is well known, Ti itself is a corrosion-resistant metal [
48], which leads to improving the corrosion-resistance of the NiP coatings. Furthermore, the NiP coatings may be more porous; therefore, it becomes denser with the addition of TNPs, and its porosity decreases, reducing the active sites for the corrosion and preventing the direct contact of electrolyte with the substrate [
49]. It can be seen in
Table 5, the charge transfer resistances of the NiP-TNPs composite coatings have increased as the concentration of the TNPs in the electroless bath increased to 0.5 g/L, and then it slightly decreased. The highest value of
Rct is observed at NiP-0.5TNPs (18.6 KΩ·cm
2), with approximately 96.5% protection efficiency, which is reduced to 15.4 KΩ·cm
2 at NiP-1.0TNPs, with approximately 95.6% protection efficiency, as shown in
Table 5. The slight reduction in the
Rct value is due to the increase in the content of TNPs, which may generate defects, causing more inhomogeneity in coatings.
Moreover, it is noticed that the phase-angle plots of the NiP coatings in the absence and presence of TNPs have the same shape and position, as shown in
Figure 8a. This indicates that there is a similar fundamental process that takes place on their surfaces. However, they have different peak maximum values, depending on their protection ability. The maximal peak values of the NiP-TNPs coatings are higher than the NiP coatings. As a comparison, the NiP-0.5TNP coatings have the highest peak maximal value, indicating the better corrosion resistance for NiP-TNPs nanocomposite coatings. On the contrary, the phase angle plots of the various developed coatings are different in shape, position, and peak maximum, when compared to that of the substrate. Therefore, the substrate shows one-time constant behavior, whereas the developed coatings display two-time constants fitting, in which two relaxation processes take place. One is due to the coating layer and measured at the intermediate and higher frequencies. The other one is checked at lower rates and related to the electrochemical reactions that happened at the substrate and coating interphase.
Nyquist plots for HSLA steel, NiP, and NiP-TNPs composite coatings with different content of TNPs are depicted in
Figure 8b. The semicircle radius of Nyquist curves significantly increased for NiP and NiP-TNPs composite coatings as compared to HSLA steel, the increase in impedance values for Nyquist plots are also consistent with their Bode plots.
Furthermore, the decrease in porosity of the NiP coating with the addition of TNPs also helps to increase the pore resistance (
Rpo) of the NiP-TNPs coatings. The values of
Rpo are given in
Table 5. The pore resistance (
Rpo) of NiP-TNPs coatings increases with the addition of TNPs and reaches its highest value at NiP-0.5TNPs composition. Furthermore, the decrease in the amount of constant phase element for NiP-TNPs nanocomposites coatings as compared to HSLA steel and NiP coating proves their better corrosion-resistant behavior. It is worth mentioning that the inhibition efficiency (
I.E) of the coatings was calculated by using the following equation [
47].
where the
Rct2 and
Rct1 are the charge-transfer resistance of the substrate and coating, respectively. The inhibition efficiency for NiP and NiP-TNPs is given in
Table 5.
3.5.2. Potentiodynamic Polarization Technique
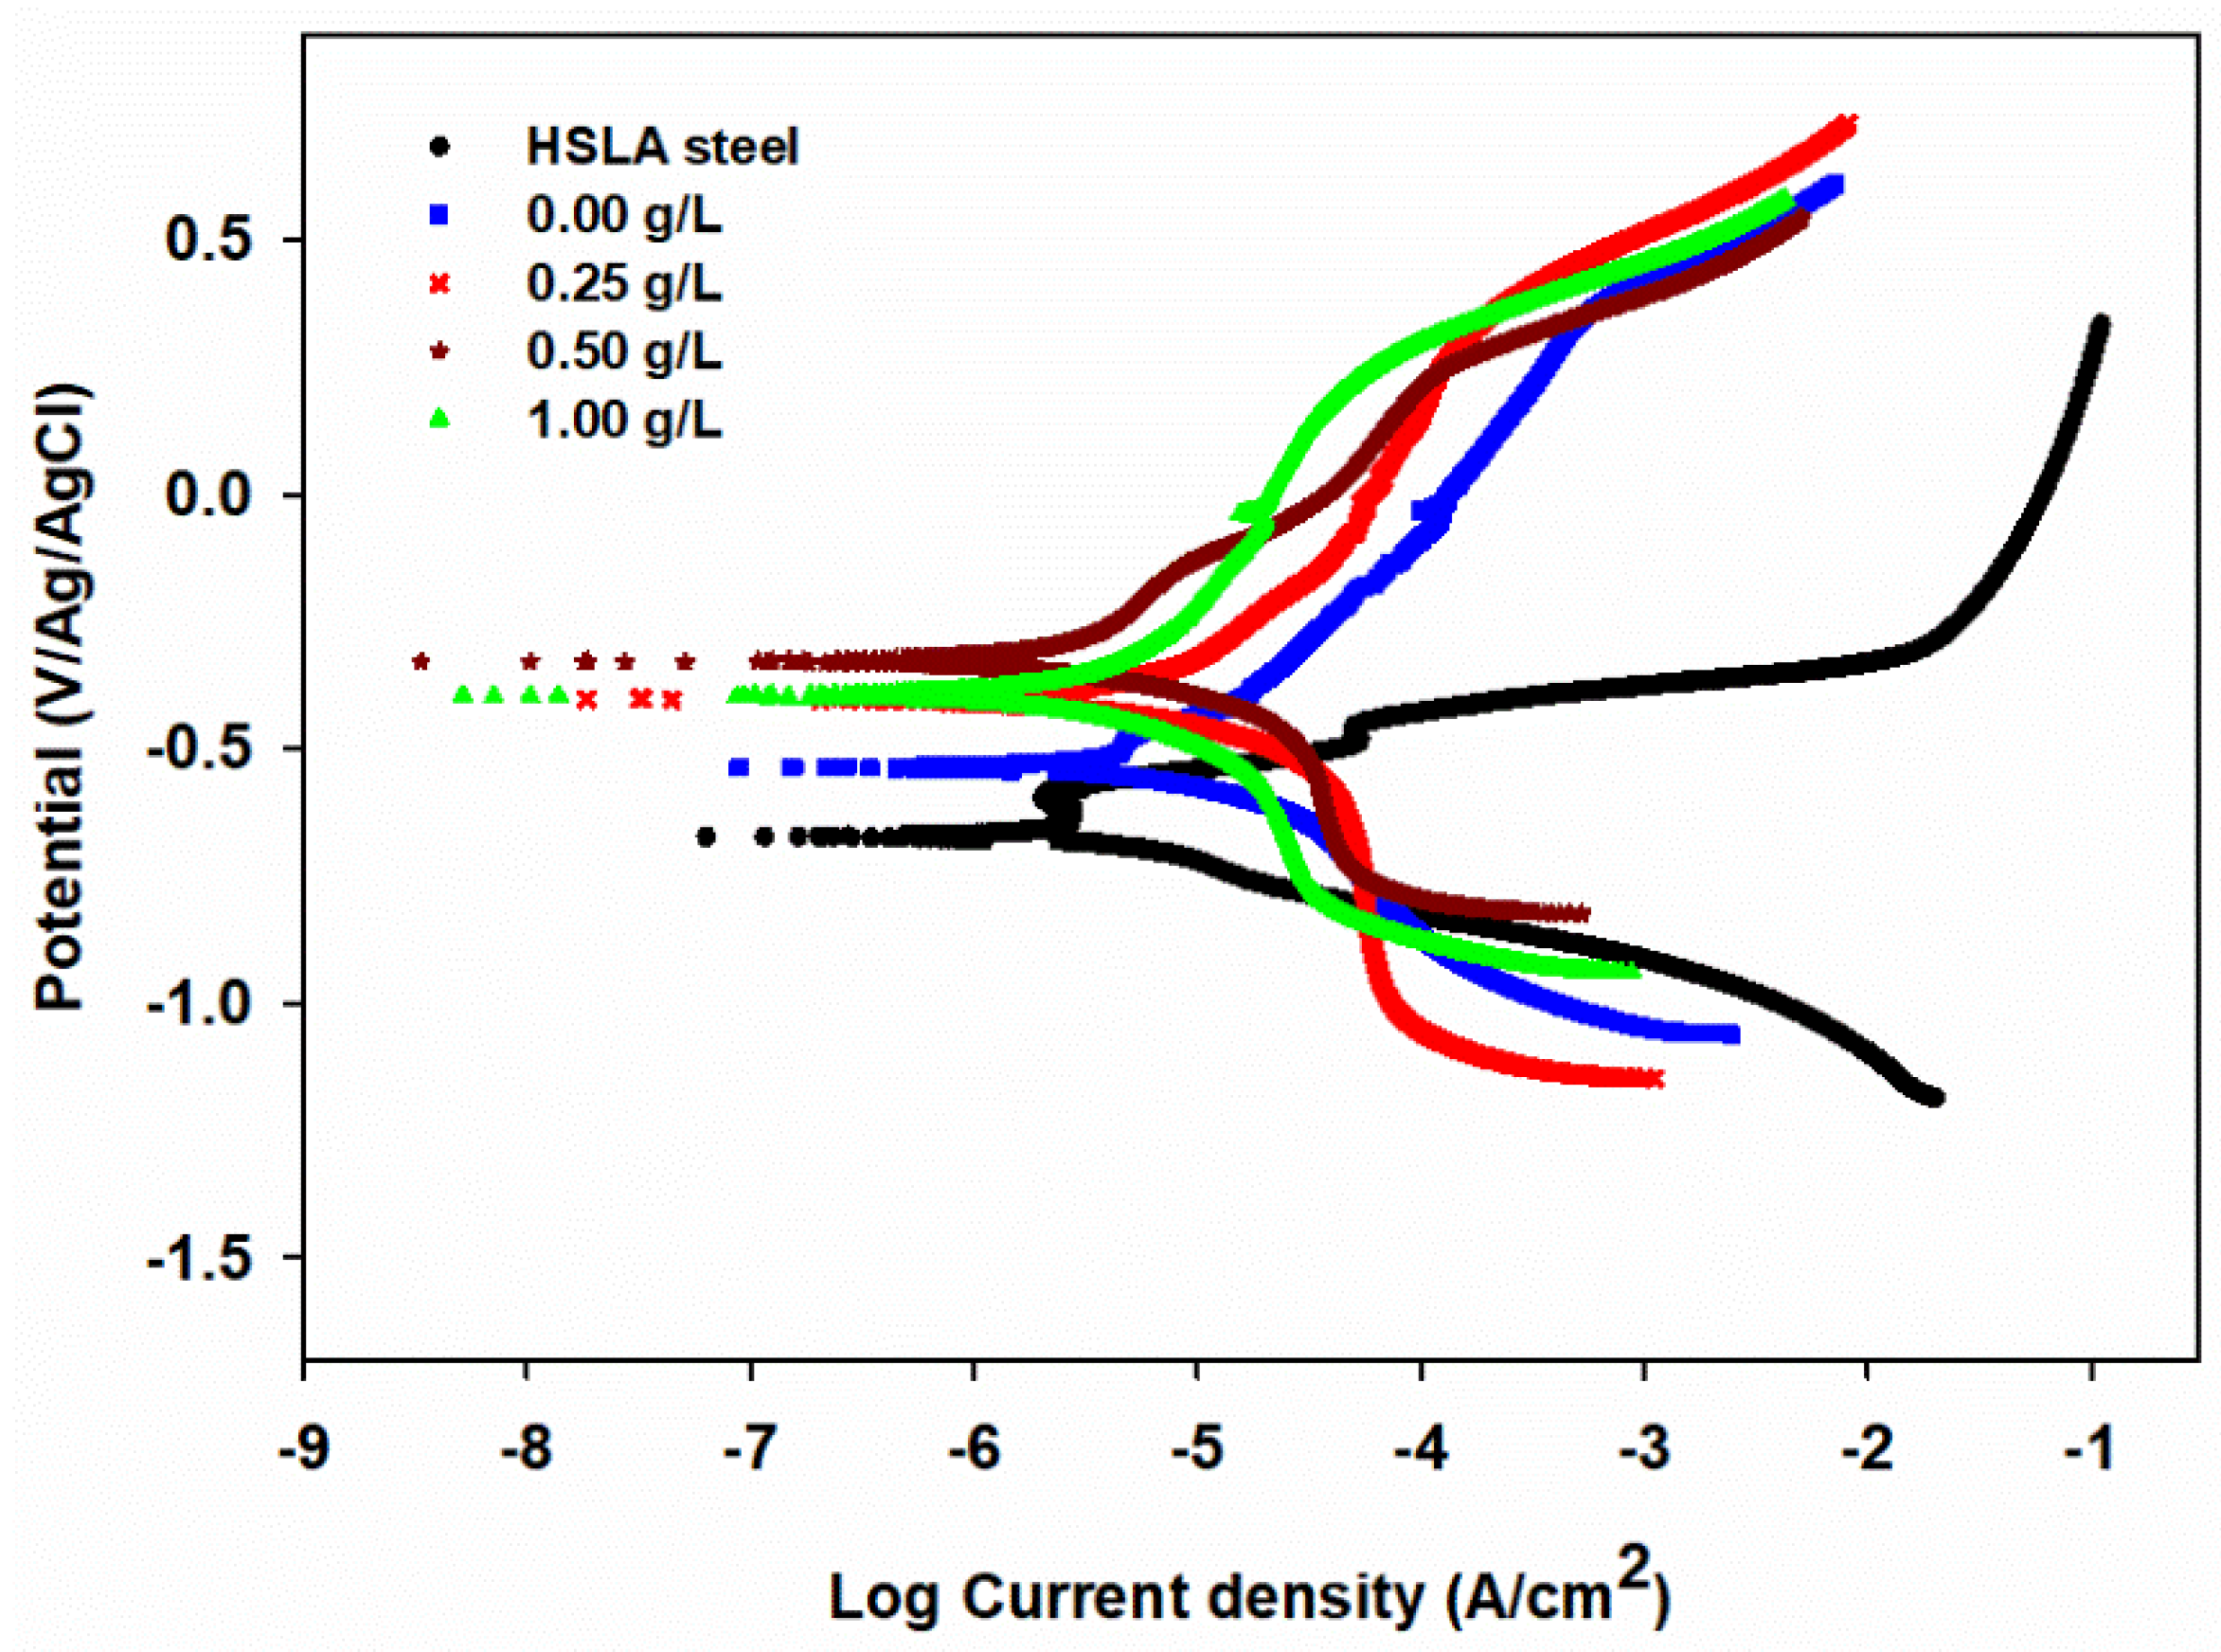
Figure 10 shows the Tafel plots (Potentiodynamic polarization curves) of HSLA steel, NiP, and NiP-TNPs nanocomposite coatings (NiP-0.25TNPs, NiP-0.5TNPs, and NiP-1.0TNPs) that are immersed in 3.5 wt. % NaCl at 25 °C.
Table 6 summarizes the various electrochemical parameters:
icorr (corrosion-current density),
Ecorr (corrosion-potential),
bc and
ba (anodic and cathodic Tafel slopes) that acquired using the Tafel extrapolation method, and the corrosion inhibition efficiency (
IE%) for all coatings. The inhibition efficiency (
IE%) for the coated samples derived from the data obtained from Tafel plots is obtained by applying the following equation [
47].
where the
icorr1 and
icorr2 are the corrosion current density of the substrate and coating samples, respectively. The corrosion-potential (
Ecorr) for HSLA steel was around −764 mV, while that for the NiP coating is shifted toward more positive value (−527 mV), which is further anodically shifted to −383, −311, and −388 mV by the addition of TNPs (amounting 0.25, 0.5, and 1.0 g/L, in electroless deposition bath correspondingly) in the NiP matrix. The reduction in the corrosion potential of the NiP-TNPs nanocomposite coatings compared to NiP coatings proves their better corrosion resistance. The more negative value of the corrosion potential of HSLA steel indicates that the steel’s surface is more susceptible to corrosion. Moreover, a noteworthy decrease in the corrosion-current density values of the coated samples compared to the values for the substrate is observed, such that the icorr value is dropped from 69 µA·cm
−2, in the case of the substrate, to 8.2 µA·cm
−2 for NiP coating. A further drop in the icorr value to 6.5 µA·cm
−2 takes place at NiP-0.25TNPs coating, signifying an increase in the corrosion resistance of the NiP coating in the presence of TNPs nanoparticles. As the concentration of the TNPs particles is increased into the NiP matrix, the icorr of the NiP-TNPs nanocomposite coating decreases and reaches to the highest drop at NiP-0.5TNPs composite coating composition, as shown in
Figure 10 and
Table 6. Further increase in the TNPs concentration into NiP matrix (NiP-1.0TNPs nanocomposite coating), led to an increase of about 27.5% in icorr of the NiP-1.0TNPs coating, resulting in a reduction in its protection efficiency of about 1.6%, compared to that of the NiP-0.5TNPs nanocomposite coating. Distinctly, the NiP-0.5TNPs nanocomposite coating has the highest corrosion protection efficiency, reaching 94.2%, as shown in
Table 6. The change in the values of anodic and cathodic Tafel slopes (
ba,
bc) indicates the change in the mechanism of iron dissolution due to the deposition process. The results of EIS and potentiodynamic polarization measurements are consistent and confirmed with each other.

 ,
, 


