Chloramine-T/N-Bromosuccinimide/FeCl3/KIO3 Decorated Graphene Oxide Nanosheets and Their Antibacterial Activity


Abstract
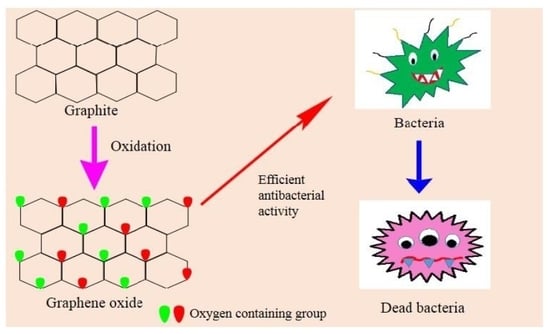
1. Introduction
2. Materials and Methods
2.1. Chemicals and Reagents
2.2. Syntheses
2.2.1. Preparation of GO NS
2.2.2. Sample Preparation for Antibacterial Activity of Synthesized GO NS
2.2.3. Preparation of Antibacterial Assay
2.3. Instrumentation
3. Results and Discussion
3.1. XRD
3.1.1. Scherrer’s Method
3.1.2. Crystallite Size and Strain
3.1.3. Dislocation Density (δ)
3.1.4. Specific Surface Area (SSA)
3.1.5. Stacking Fault Probability (α)
3.1.6. Lattice Parameters
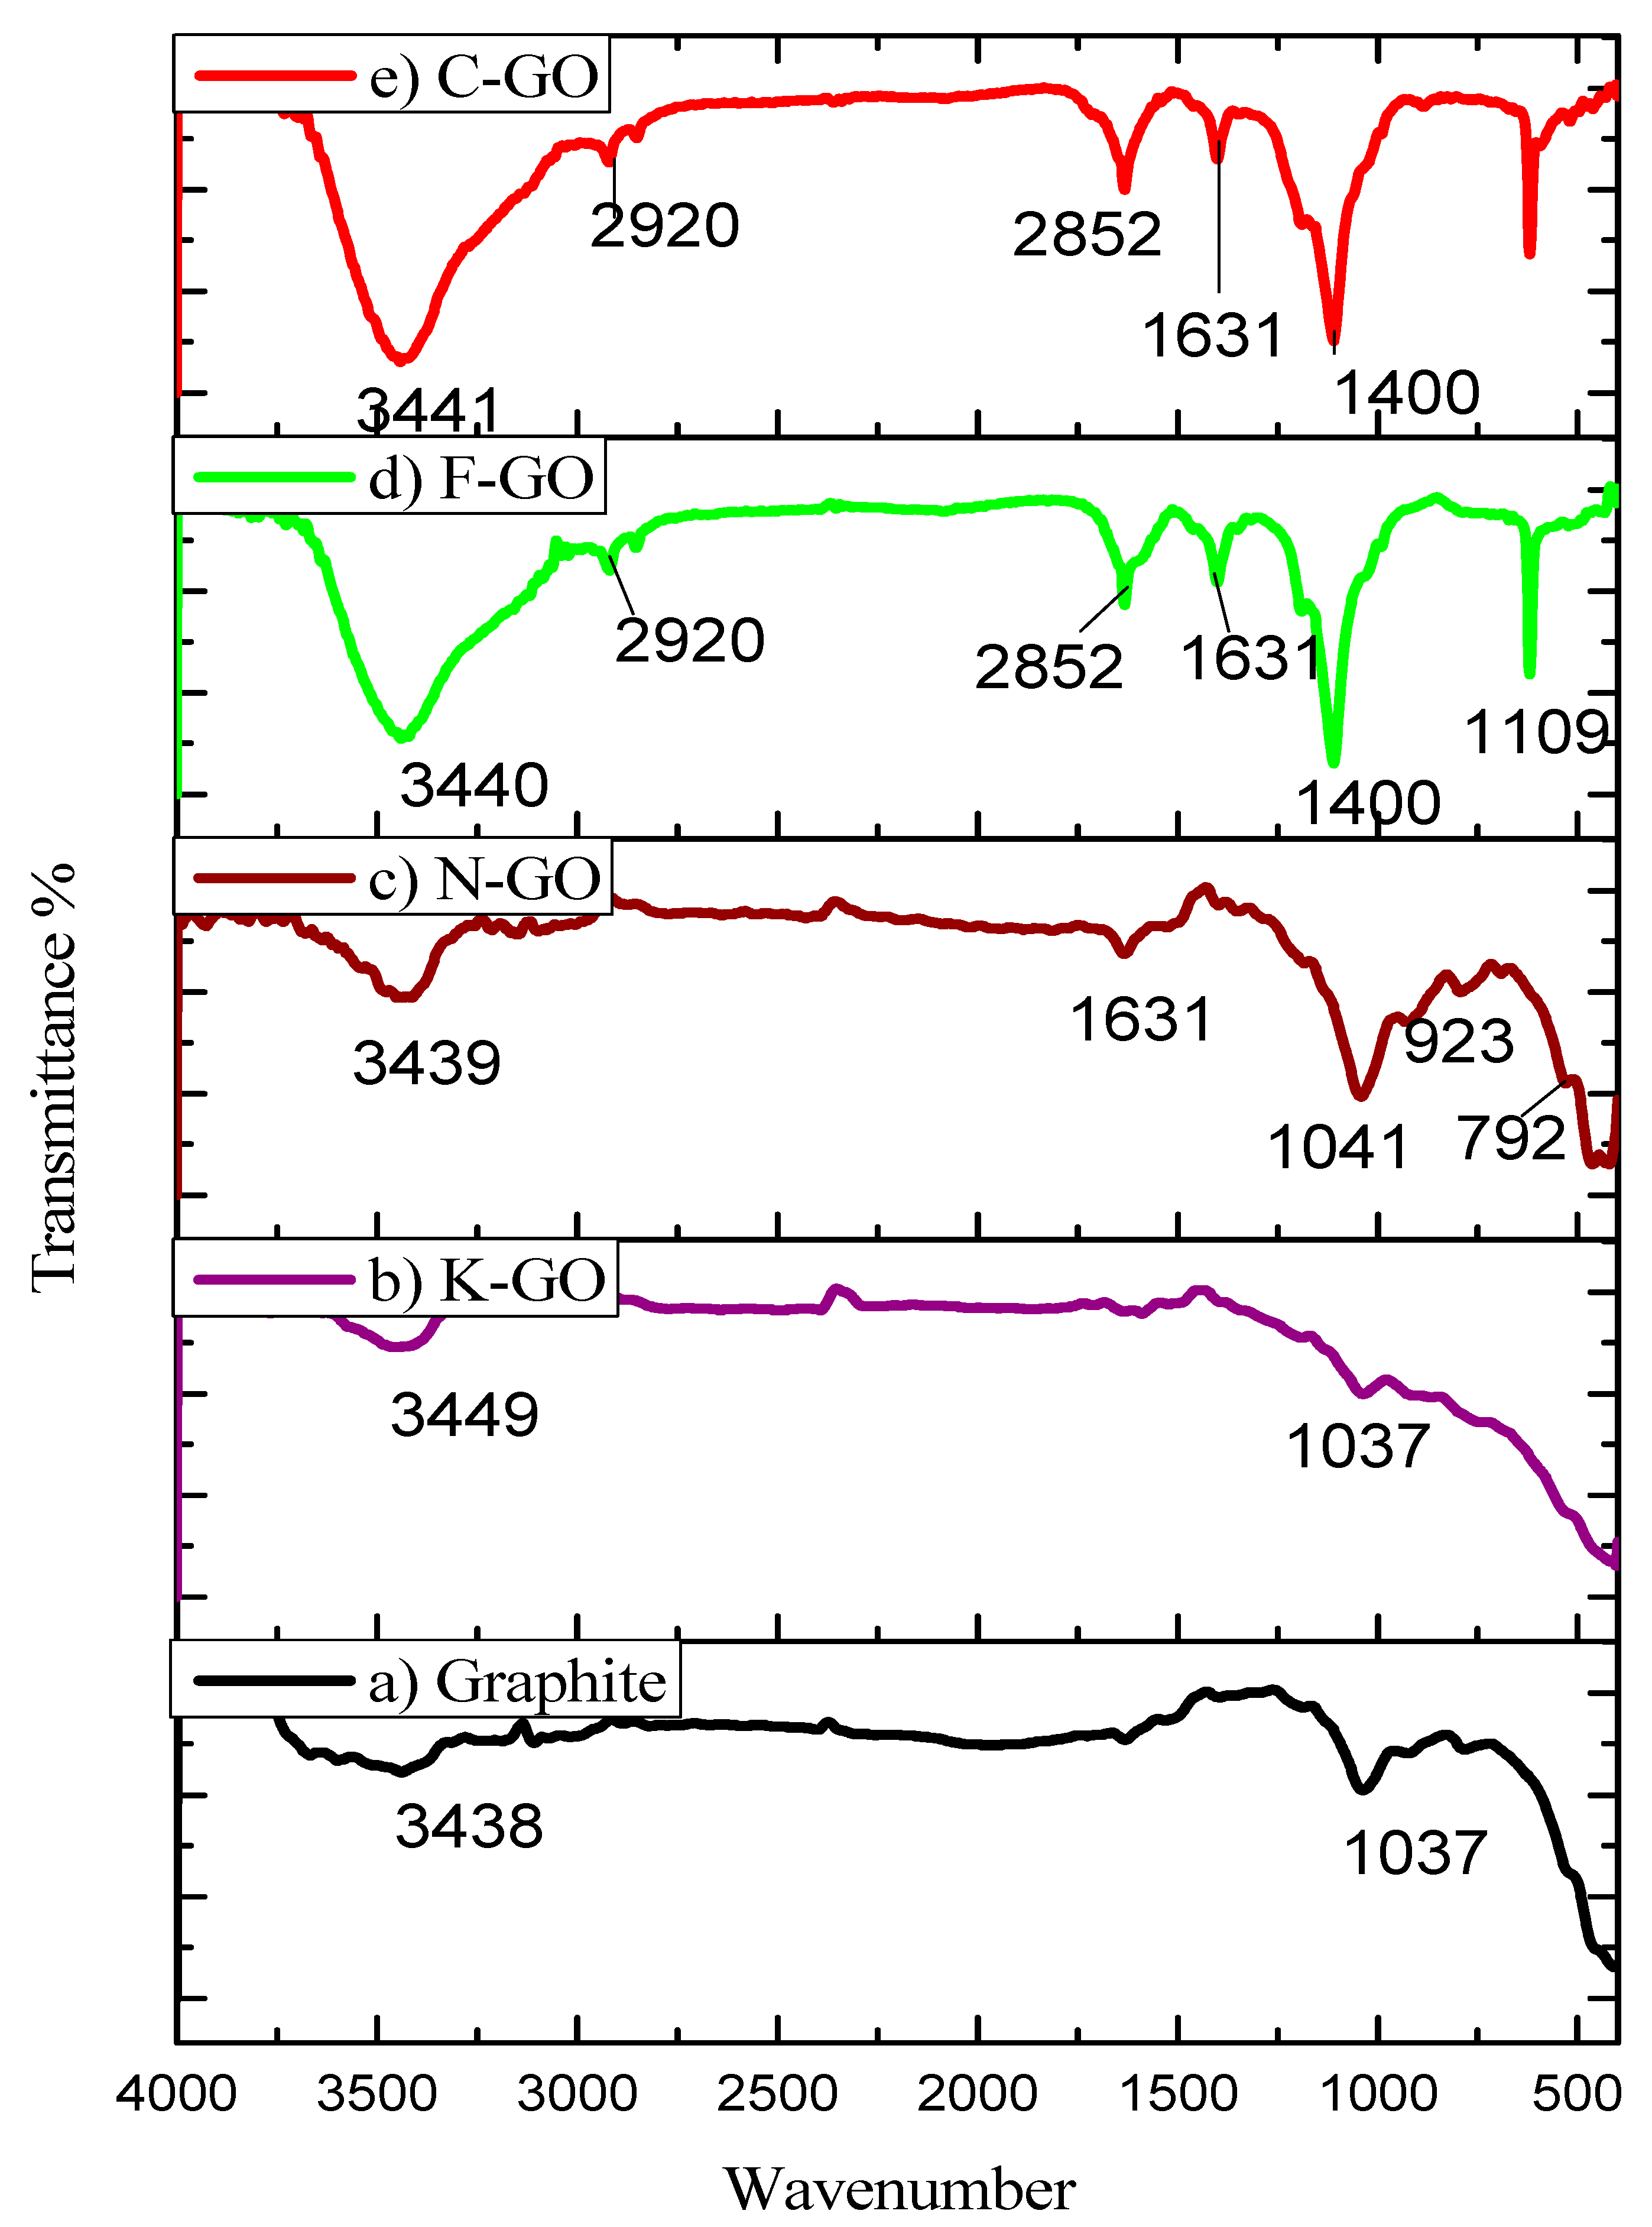
3.2. FTIR
3.3. SEM
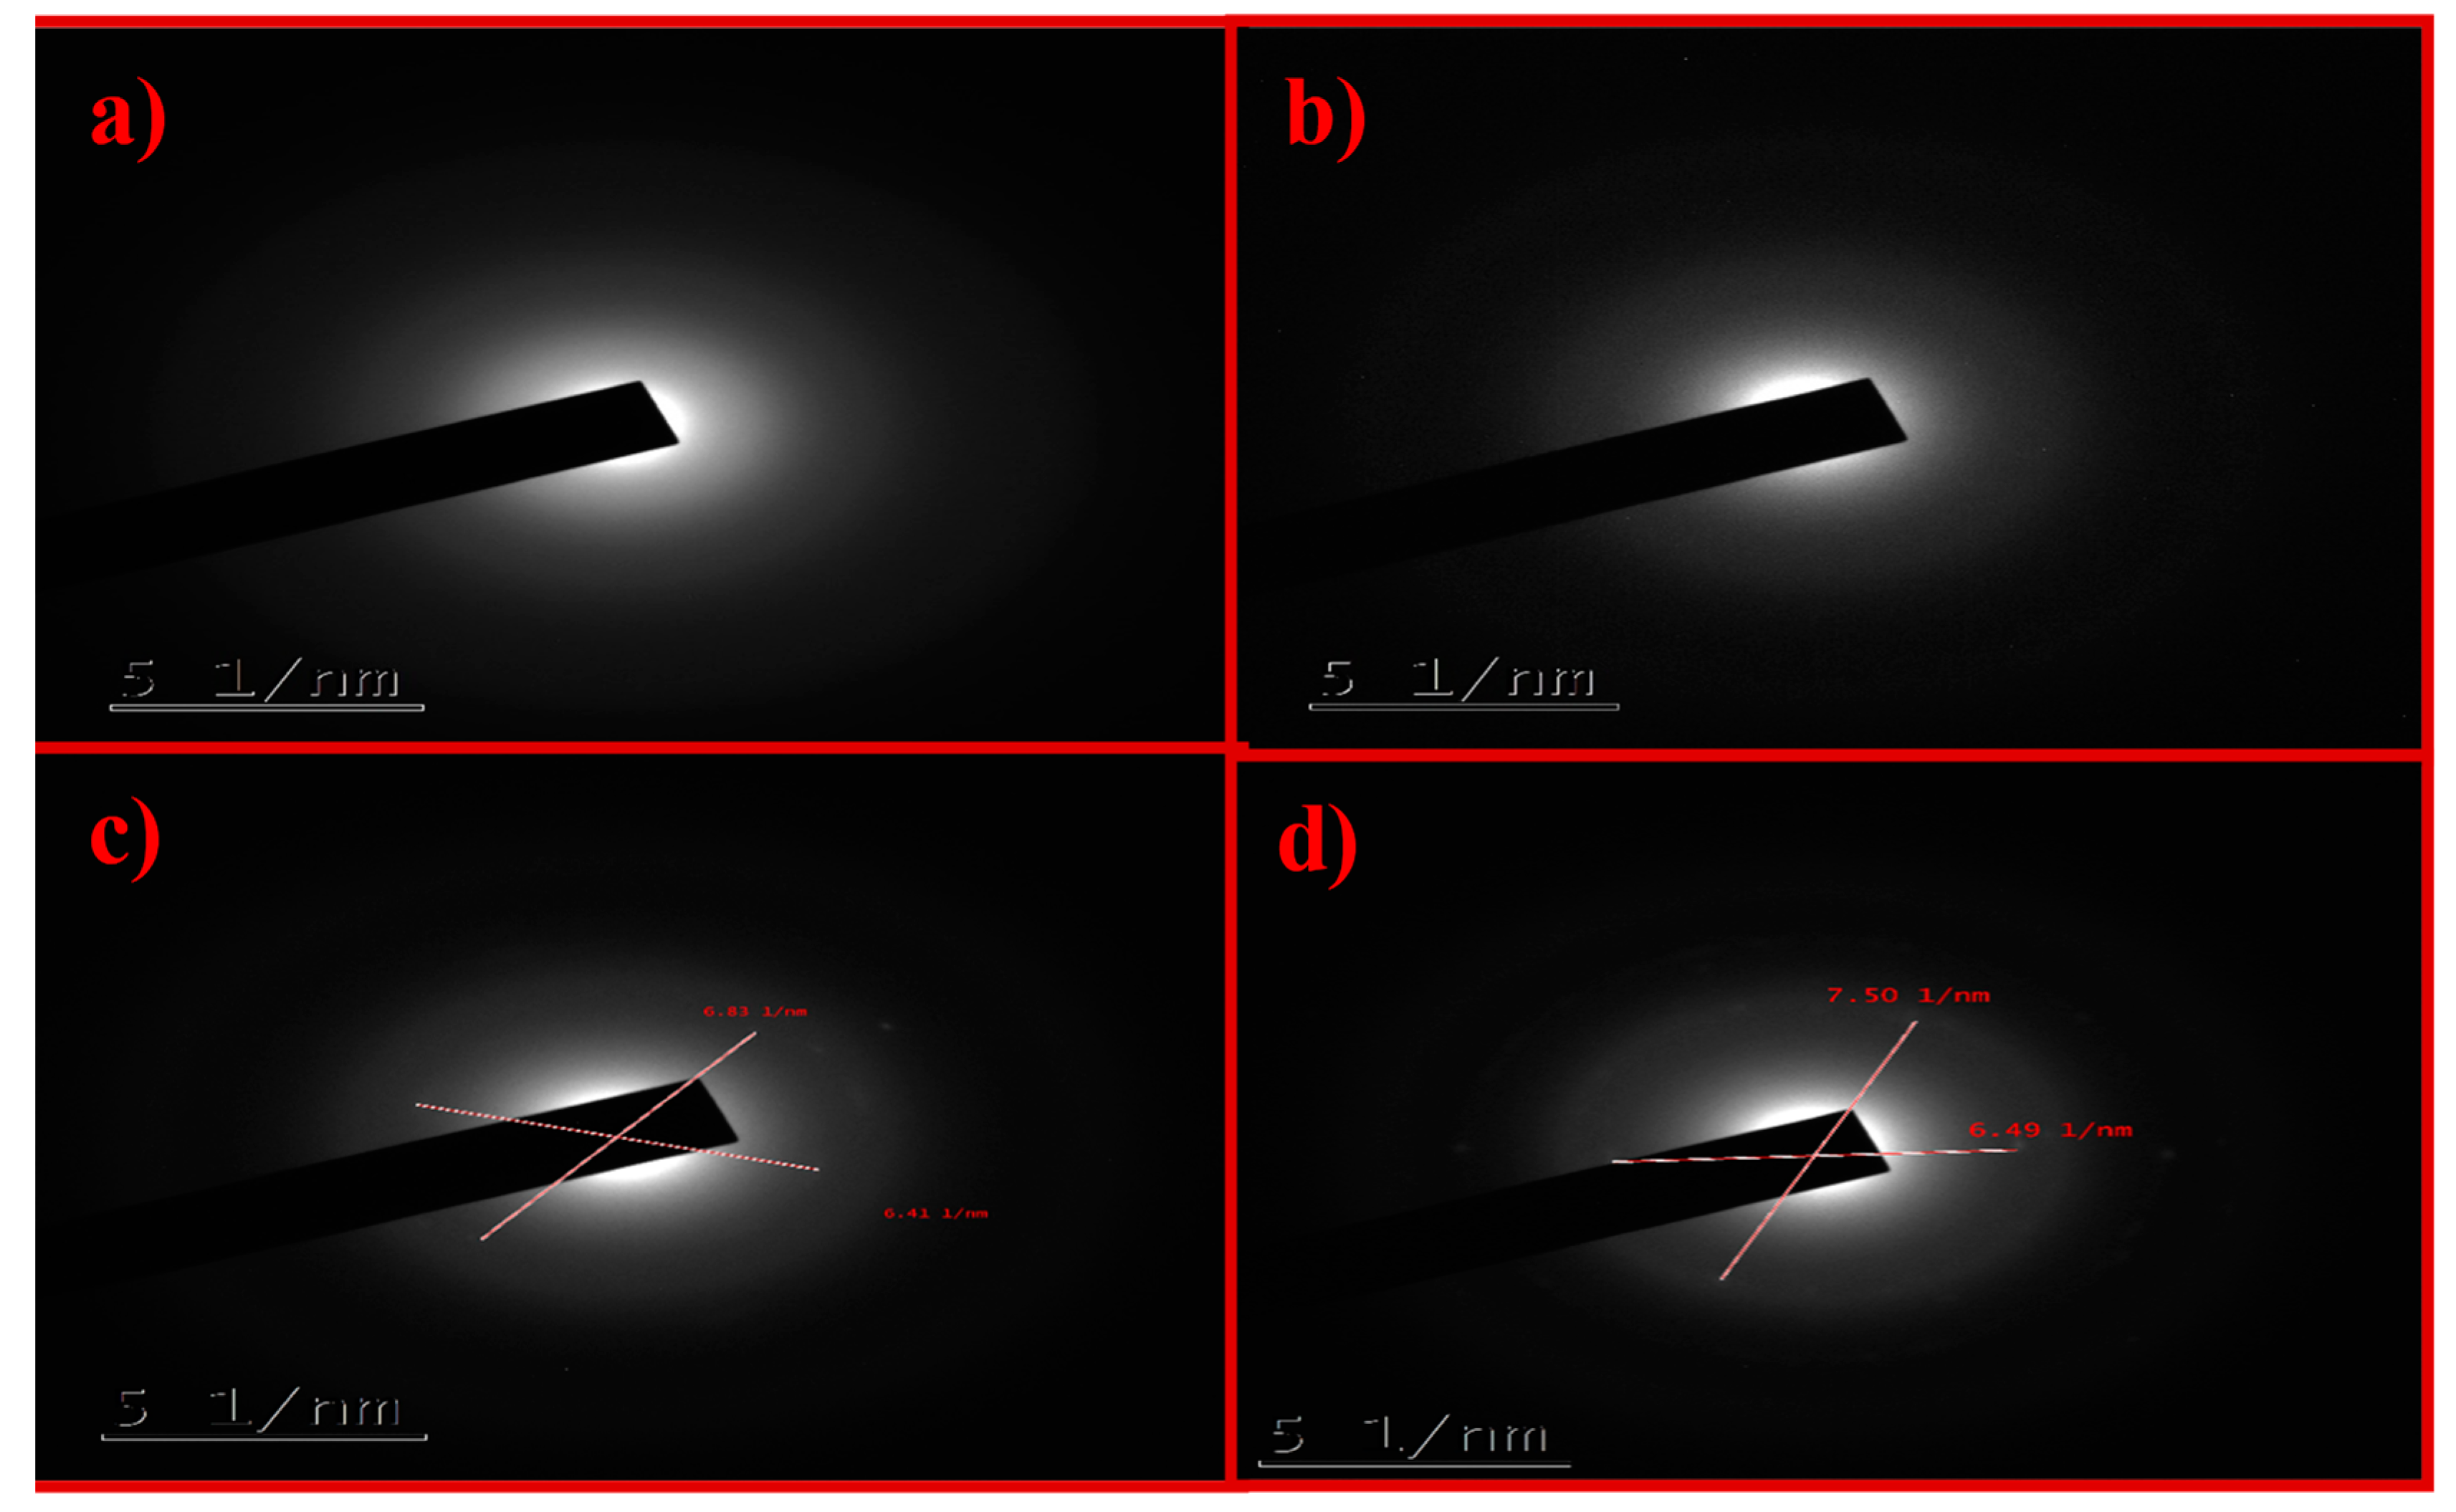
3.4. HRTEM
3.5. Antibacterial Activity Studies
3.5.1. Effect of GO Concentration on Bacteria Evolution in Planktonic Culture
3.5.2. Effect of Dose Concentration
3.5.3. Effect of Time
4. Conclusions
Supplementary Materials
Author Contributions
Funding
Acknowledgments
Conflicts of Interest
References
- Guerrero-Contreras, J.; Caballero-Briones, F. Graphene oxide powders with different oxidation degree, prepared by synthesis variations of the Hummers method. Mat. Chem Phys. 2015, 153, 209–220. [Google Scholar] [CrossRef]
- Zhang, J.; Wang, Z.; Hu, P.A.; Fu, Y.Q.; Placido, F. Electronic properties of microscale reduced graphene oxide patterned by micromolding. Nanosci. Nanotechnol. Lett. 2012, 4, 889–894. [Google Scholar] [CrossRef]
- Pan, S.; Liu, X.; Wang, X. Semiconductor–enhanced Raman Scattering: active nanomaterial’s and applications. Mater. Charact. 2011, 62, 1094–1101. [Google Scholar] [CrossRef]
- Allen, M.J.; Tung, V.C.; Kaner, R.B. Honeycomb Carbon: A Review of Graphene. Chem. Rev. 2010, 110, 132–145. [Google Scholar] [CrossRef]
- Kumar, P.; Subrahmanyam, K.S.; Rao, C.N.R. Toward highly electrically conductive and thermally insulating graphene nanocomposites: Al2O3-graphene. Mater. Express 2011, 1, 252–256. [Google Scholar] [CrossRef]
- Li, X.; Song, H.; Du, K.; Zhang, Y.; Huang, J. Additive of graphene nanosheets on the anode performances of spherical natural graphite for lithium ion batteries. Nanosci. Nanotechnol. Lett. 2012, 4, 191–194. [Google Scholar] [CrossRef]
- Wang, G.; Shen, X.; Wang, B.; Yao, J.; Park, J. Synthesis and characterization of hydrophilic and organophillic graphene nanosheets. Carbon 2009, 47, 1359–1364. [Google Scholar] [CrossRef]
- Lambert, T.N.; Chavez, C.A.; Sanchez, B.H.; Lu, P.; Bell, N.S.; Ambrosini, A.; Friedman, T.; Boyle, T.J.; Wheeler, D.R.; Huber, D.L. Synthesis and characterization of Titania-Graphene nanosheets. J. Phys. Chem. C 2009, 113, 19812–19823. [Google Scholar] [CrossRef]
- Yosuke, I.; Tomohiro, S.; Shinji, K.; Hidenori, K.; Masashige, T. Fusing Treatment of Pentacenes: Toward Giant Graphene-Like Molecule. Mater. Express 2011, 1, 36. [Google Scholar]
- Kuila, T.; Bhadra, S.; Yao, D.; Kim, N.H.; Bose, S.; Lee, J.H. Recent advances in graphene based polymer composites. Prog. Polym. Sci. 2010, 35, 1350–1375. [Google Scholar] [CrossRef]
- Mihara, S.; Tsubota, T.; Murakami, N.; Ohno, T. Improvement of electrical conductivity while maintaining a high transmittance of graphene oxide/MWCNT film by hydrazine reduction. J. Nanosci. Nanotechnol. 2012, 12, 6930–6934. [Google Scholar] [CrossRef] [PubMed]
- Tatsumi, I.; Yuji, Y.; Tateaki, S.; Futoshi, K.; Hidemi, H. Intercalation of PF-6 anion into nanopore into graphene layer for improved capacity of hybrid capacitor. Nanosci. Nanotechnol. Lett. 2012, 4, 182–184. [Google Scholar]
- Liu, H.; Miao, C.; Tang, Z.; Zheng, X.; Qin, X.; Zhang, X. LiAlH4 and PBr3 assisted high quality synthesis of graphene with excellent performances for lithium ion batteries. Mater. Lett. 2012, 83, 62. [Google Scholar] [CrossRef]
- Lu, L.; Liu, J.; Huand, Y.; Chen, W. Large volume variation of an anisotropic graphene nanosheet electrochemical- mechanical actuator under low voltage stimulation. Chem. Commun. 2012, 48, 3978–3980. [Google Scholar] [CrossRef]
- Hong, W.; Bai, H.; Xu, Y.; Yao, Z.; Gu, Z.; Shi, G. Preparation of gold nanoparticle/graphene composites with controlled weight contents and their application in Biosensors. J. Phys. Chem. C 2010, 114, 1822–1826. [Google Scholar] [CrossRef]
- Camara, N.; Jouault, B.; Caboni, A.; Tiberj, A.; Godignon, P.; Camassel, J. Epitaxial graphene growth on α- SiC: Probing the effect of surface orientation. Nanosci. Nanotechnol. Lett. 2011, 3, 49–54. [Google Scholar] [CrossRef]
- Novoselov, K.S.; Geim, A.K.; Morozov, S.V.; Jiang, D.; Zhang, Y.; Dubonos, S.V.; Grigorieva, I.V.; Firsov, A.A. Electric field effect in atomically thin carbon film. Science 2004, 306, 666–669. [Google Scholar] [CrossRef]
- Chang, Q.H.; Guo, G.L.; Wang, T.; Ji, L.C.; Huang, L.; Ling, B.; Yang, H.F. Few layer graphene direct deposition on Ni and Cu foil by cold-wall chemical vapour deposition. J. Nanosci. Nanotechnol. 2012, 12, 6516–6520. [Google Scholar] [CrossRef]
- Zabba, N.I.; Foo, K.L.; Hashim, U.; Tan, S.J.; Liu, W.W.; Woon, C.H. Synthesis of graphene oxide using modified Hummers method: Solvent influence. Proc. Eng. 2017, 184, 469–477. [Google Scholar] [CrossRef]
- Marcano, D.C.; Kosynkin, D.V.; Berlin, J.M.; Sinitskii, A.; Sun, Z.; Slesarev, A.; Alemany, L.B.; Lu, W.; Tour, J.M. Improved synthesis of graphene oxide. ACS Nano 2010, 4, 4806–4814. [Google Scholar] [CrossRef]
- Hummers, W.S., Jr.; Offeman, E.R. Preparation of graphitic oxide. J. Am. Chem. Soc. 1958, 80, 1339. [Google Scholar] [CrossRef]
- Chen, J.; Peng, H.; Wang, X.; Shao, F.; Yuan, Z.; Han, H. Graphene oxide exhibit broad-spectrum antibacterial activity against bacterial phytopathogens and fungal conidia by intertwining and membrane perturbation. Nanoscale 2014, 6, 1879–1889. [Google Scholar] [CrossRef] [PubMed]
- Mejías-Carpio, I.E.; Santos, C.M.; Wei, X.; Rodrigues, D.F. Toxicity of a polymer-graphene oxide composite against bacterial planktonic cells, biofilms and mammalian cells. Nanoscale 2012, 4, 4746–4756. [Google Scholar] [CrossRef] [PubMed]
- Akhavan, O.; Ghaderi, E. Toxicity of graphene and graphene oxide nanowalls against bacteria. ACS Nano 2010, 4, 5731–5736. [Google Scholar] [CrossRef] [PubMed]
- Krishnamoorthy, K.; Veerapandian, M.; Zhang, L.; Yun, K.; Kim, S.J. Antibacterial efficiency of graphene nanosheets against pathogenic bacteria via lipid peroxidation. J. Phys. Chem. C 2012, 116, 17280–17287. [Google Scholar] [CrossRef]
- Gurunathan, S.; Han, J.W.; Dayem, A.A.; Eppakayala, V.; Kim, J.-H. Oxidative stress-mediated antibacterial activity of graphene oxide and reduced graphene oxide in pseudomonas aeruginosa. Int. J. Nanomed. 2012, 7, 5901–5914. [Google Scholar] [CrossRef]
- He, Y.; Qian, L.; Liu, X.; Hu, R.; Haung, M.; Liu, Y.; Chen, G.; Losic, D.; Zhu, H. Graphene oxide as an antimicrobial agent can extend the vase life of cut flowers. Nano Res. 2018, 11, 6010–6022. [Google Scholar] [CrossRef]
- Hui, L.; Piao, J.-G.; Auletta, J.; Hu, K.; Zhu, Y.; Meyer, T.; Liu, H.; Yang, L. Availability of the Basal Planes of Graphene Oxide Determines Whether It Is Antibacterial. ACS Appl. Mater. Interf. 2014, 6, 13183–13190. [Google Scholar] [CrossRef]
- Tu, Y.; Lv, M.; Xiu, P.; Huynh, T.; Zhang, M.; Castelli, M.; Liu, Z.; Huang, Q.; Fan, C.; Fang, H.; et al. Destructive extraction of phospholipids from Escherichia Coli membranes by graphene nanosheets. Nat. Nanotechnol. 2013, 8, 594–601. [Google Scholar] [CrossRef]
- Lyon, D.Y.; Alvarez, P.J.J. Fullerene water suspension (nC60) exerts antibacterial effects via ROS- independent protein oxidation. Environ. Sci. Technol. 2008, 42, 8127–8132. [Google Scholar] [CrossRef]
- Kang, S.; Herzberg, M.; Rodrigues, D.F.; Elimelech, M. Antibacterial effects of carbon nanotubes: Size does matter! Langmuir 2008, 24, 6409–6413. [Google Scholar] [CrossRef] [PubMed]
- Vecitis, C.D.; Zodrow, K.R.; Kang, S.; Elimelech, M. Electronic-structure-dependent bacterial cytotoxicity of single-walled carbon nanotubes. ACS Nano 2010, 4, 5471–5479. [Google Scholar] [CrossRef] [PubMed]
- Castrillón, S.R.V.; Perreault, F.; de Faria, A.F.; Elimelech, M. Intercalation of graphene oxide with bacterial cell membranes: Insight from force Spectroscopy. Environ. Sci. Technol. Lett. 2015, 2, 112–117. [Google Scholar] [CrossRef]
- Perreault, F.; Tousley, M.E.; Elimelech, M. Thin- film composite polyamide membranes functionalized with biocidal graphene oxide nanosheets. Environ. Sci. Technol. Lett. 2014, 1, 71–76. [Google Scholar] [CrossRef]
- Karimi, L.; Yazdanshenas, M.E.; Khajavi, R.; Rashidi, A.; Mirjalili, M. Using graphene/TiO2 nanocomposites as a new route for preparation of electro conductive, self-cleaning, antibacterial and antifungal cotton fabric without toxicity. Cellulose 2014, 21, 3813–3827. [Google Scholar] [CrossRef]
- Santos, C.M.; Tria, M.C.R.; Vergara, R.A.M.V.; Ahmed, F.; Advincula, R.C.; Rodrigues, D.F. Antibacterial graphene polymer (PVK-GO) nanocomposite film. Chem. Commun. 2011, 47, 8892–8894. [Google Scholar] [CrossRef]
- Musico, Y.L.F.; Santos, C.M.; Dalida, M.L.P.; Rodrigues, D.F. Surface modification of membrane filters using Graphene and Graphene oxide based nanomaterials for bacterial inactivation and removal. ACS Sustainabld Chem. Eng. 2014, 2, 1559–1565. [Google Scholar] [CrossRef]
- Lee, J.J.; Chae, H.R.; Won, Y.J.; Lee, K.; Lee, C.H.; Lee, H.H.; Kim, I.C.; Lee, J.J. Graphene oxide nanoplateletes composites membrane with hydrophilic and antifouling properties for wastewater treatment. J. Membr. Sci. 2013, 448, 223–230. [Google Scholar] [CrossRef]
- Melo, L.F.; Bott, T.R. Biofouling in water system. Exp. Therm. Fluid Sci. 1997, 14, 375–381. [Google Scholar] [CrossRef]
- Elimelech, M.; Phillip, W.A. The future of seawater desalination, energy, technology and the environment. Science 2011, 333, 712–717. [Google Scholar] [CrossRef]
- Schultz, M.P.; Bendick, J.A.; Holm, E.R.; Hertel, W.M. Economic impact of biofouling on a naval surfaceship. Biofouling 2011, 27, 87–98. [Google Scholar] [CrossRef] [PubMed]
- Kang, S.; Mauter, M.S.; Elimelech, M. Physicochemical determinants of multi-walled carbon nanotube bacterial cytotoxicity. Environ. Sci. Technol. 2008, 42, 7528–7534. [Google Scholar] [CrossRef] [PubMed]
- Gascho, J.L.S.; Costa, S.F.; Recco, A.A.C.; Pezzin, S.H. Graphene oxide films obtained by vaccum filtration: X-ray diffraction evidence of crystalline reorganization. J. Nanomater. 2019, 12, 1–13. [Google Scholar] [CrossRef]
- Chen, J.; Yao, B.; Li, C.; Shi, G. An improved Hummers method for eco- friendly synthesis of graphene oxide. Carbon 2013, 64, 225–229. [Google Scholar] [CrossRef]
- Lv, W.; Tang, D.-M.; He, Y.-B.; You, C.-H.; Shi, Z.-Q.; Chen, X.-C.; Chen, C.-M.; Hou, P.-X.; Liu, C.; Yang, Q.-H. Low temperature exfoliated graphenes: Vacuum promoted exfoliation and electrochemical energy storage. ACS Nano 2009, 3, 3730–3736. [Google Scholar] [CrossRef]
- Kaniyoor, A.; Baby, T.T.; Ramaprabhu, S. Graphene synthesis via hydrogen induced low temperature exfoliation of graphene oxide. J. Mater. Chem. 2010, 20, 8467–8469. [Google Scholar] [CrossRef]
- Chen, D.; Yi, R.; Chen, S.; Xu, T.; Gordin, M.L.; Lv, D.; Wang, D. Solvothermal synthesis of V2O5/graphene nono composites for high performance lithium ion batteries. Mater. Sci. Eng. B 2014, 185, 7–12. [Google Scholar] [CrossRef]
- Xu, Y.; Bai, H.; Lu, G.; Li, C.; Shi, G. Flexible graphene film via the filtration of water-soluble noncovalent functionalized graphene sheets. J. Am. Chem. Soc. 2008, 130, 5856–5857. [Google Scholar] [CrossRef]
- Verma, S.; Mungse, H.P.; Kumar, N.; Choudhary, S.; Jain, S.L.; Sain, B.; Khatri, O.P. Graphene oxide: an efficient and reusable carbocatalyst for Aza- Michael addition of amines to activated alkenes. Chem. Commun. 2011, 47, 12673–12675. [Google Scholar] [CrossRef]
- Kartick, B.; Srivastava, S.K.; Srivastava, I. Green Synthesis of Graphene. J. Nanosci. Nanotechnol. 2013, 13, 4320–4324. [Google Scholar] [CrossRef]
- Nehru, L.C.; Swaminathan, V.; Sanjeeviraja, C. Photoluminescence Studies on Nanocrystalline Tin Oxide Powder for Optoelectronic Devices, American. J. Mater. Sci. 2012, 2, 6–10. [Google Scholar]
- Sirdeshmukh, D.B.; Sirdeshmukh, L.; Subhadra, K.G. Micro- and Macro-Properties of solids: Thermal, Mechanical and Dielectric properties; Springer: NewYork, NY, USA, 2006. [Google Scholar]
- Chinh, N.Q.; Gubicza, J.; Langdon, T.G. Characteristics of face-centered cubic metals processed by equal-channel angular pressing. J. Mater. Sci. 2007, 42, 1594–1605. [Google Scholar] [CrossRef]
- Chen, J.; Yaling, L.; Wang, Y.; Yun, J.; Cao, D. Preparation and characterization of zinc sulphide nanoparticles under high-gravity environment. Mat. Res. Bull. 2004, 39, 185–194. [Google Scholar] [CrossRef]
- Zhang, J.; Xiao, X.; Nan, J. Hydrothermal–hydrolysis synthesis and photocatalytic properties of nano TiO2 with an adjustable crystalline size. J. Hazard. Mater. 2010, 176, 617–622. [Google Scholar] [CrossRef]
- Thool, G.S.; Singh, A.K.; Singh, R.S.; Gupta, A.; Susan, M.A.B.H. Facile synthesis of flat crystal ZnO thin films by solution growth method: A micro-structural investigation. J. Saudi Chem. Soc. 2014, 18, 712–721. [Google Scholar] [CrossRef]
- Jia, G.Z.; Wang, Y.F.; Yao, J.H. Fabrication and strain investigation of ZnO nanorods on Si composing sol-gel and chemical bath deposition method. J. Phys. Chem. Solids 2012, 73, 495–498. [Google Scholar] [CrossRef]
- Liu, W.L.; Chang, Y.C.; Hsieh, S.H.; Chen, W.J. Effects of Anions in Electrodeposition Baths on Morphologies of Zinc Oxide Thin Films. Int. J. Electrochem. Sci. 2013, 8, 983–990. [Google Scholar]
- Pasquini, L.M.; Sekol, R.C.; Taylor, A.D.; Pfefferle, L.D.; Zimmerman, J.B. Realizing comparable oxidative and cytotoxic potential of single and multi-walled carbon nanotubes through annealing. Environ. Sci. Technol. 2013, 47, 8775–8783. [Google Scholar]
- Gupta, D.K.; Rajaura, R.S.; Sharma, K. Synthesis and Characterization of Graphene Oxide Nanoparticles and their Antibacterial Activity. Int. J. Environ. Sci. Technol. 2015, 1, 16–24. [Google Scholar]
- Mizushima, S. On true crystallite thickness and interlayer spacing in graphitic carbons. TANSO 1968, 52, 9–12, [In Japanese]. [Google Scholar] [CrossRef]
- Thrower, P.A.; Nagle, D.C. The importance of strain in crystallite size determinations in graphite. Carbon 1973, 11, 663–664. [Google Scholar] [CrossRef]
- Wu, H.; Zhao, W.; Hu, H.; Chen, G. One-step in situ ball milling synthesis of polymer functionalized graphene nanocomposites. J. Mater Chem. 2011, 21, 8626–8632. [Google Scholar] [CrossRef]
- Amsden, G.W. Erythromycin, clarithromycin, and azithromycin: are the differences real? Clin. Ther. 1966, 18, 56–72. [Google Scholar] [CrossRef]
- Liang, J.H.; Han, X. Structure-activity relationships and mechanism of action of macrolides derived from erythromycin as antibacterial agents. Curr. Top. Med. Chem. 2013, 13, 3131–3164. [Google Scholar] [CrossRef]
- Gottardi, W.; Nagl, M. Chlorine covers on living bacteria: the initial step in antibacterial action of active chlorine compound. J. Antimicrob. Chemother. 2005, 55, 475–482. [Google Scholar] [CrossRef]
- Arnitz, R.; Nagl, M.; Gottardi, W. Microbial activity of monochloramine and chloramine T compared. J. Hosp. Infect. 2009, 73, 164–170. [Google Scholar] [CrossRef]
- Das, M.R.; Sarma, R.K.; Saikia, R.; Kale, V.S.; Shelke, M.V.; Sengupta, P. Synthesis of Silver Nanoparticles in an Aqueous Suspension of Graphene Oxide Sheets and Its Antibacterial Activity. Colloids Surf. B Biol. 2011, 83, 16–22. [Google Scholar] [CrossRef]
- Hu, W.; Peng, P.; Luo, W.; Lv, M.; Li, X.; Li, D.; Huang, Q.; Fan, C. Graphene-based antibacterial paper. ACS Nano 2010, 7, 4317–4323. [Google Scholar] [CrossRef]
- McFarland, J. The Nephelometer: An instrument for estimating the number of bacteria in suspensions used for calculating the opsonic index and for vaccines. J. Am. Med. Assoc. 1907, 14, 1176–1178. [Google Scholar] [CrossRef]
- Hong, B.J.; Compton, O.C.; An, Z.; Eryazici, I.; Nguyen, S.T. Successful stabilization of graphene oxide in electrolyte solutions: enhancement of biofunctionalization and cellular uptake. ACS Nano 2012, 6, 63–73. [Google Scholar] [CrossRef]
- Fu, H.; Qu, X.; Chen, W.; Zhu, D. Transformation and destabilization of graphene oxide in reducing aqueous solutions containing sulphide. Environ. Toxicol. Chem. 2014, 33, 2647–2653. [Google Scholar] [CrossRef] [PubMed]
- Salas, E.C.; Sun, Z.; Luttge, A.; Tour, J.M. Reduction of graphene oxide via bacterial respiration. ACS Nano 2010, 4, 4852–4856. [Google Scholar] [CrossRef] [PubMed]
- Gurunathan, S.; Han, J.W.; Eppakayala, V.; Kim, J.H. Microbial reduction of graphene oxide by Escherichia coli: A green chemistry approach. Coll. Surf. B 2013, 102, 772–777. [Google Scholar] [CrossRef] [PubMed]
- Wang, G.; Qian, F.; Saltikov, C.W.; Jiao, Y.; Li, Y. Microbial reduction of graphene oxide by Shewanella. Nano Res. 2011, 4, 563–570. [Google Scholar] [CrossRef]


| Sample | 2θ of the Most Intense Peak (Degree) | θ of the Most Intense Peak (Degree) | FWHM of the Most Intense Peak (β) Radians | Size of the Particle (D) nm |
|---|---|---|---|---|
| Graphite | 26.1 | 13.05 | 0.00835 ± 0.006 | 17.79 ± 0.88 |
| K–GO | 26.5 | 13.25 | 0.00415 ± 0.003 | 35.83 ± 2.5 |
| N–GO | 26.1 | 13.05 | 0.00415 ± 0.003 | 37.40 ± 2.68 |
| F–GO | 11.5 | 5.7 | 0.00472 ± 0.004 | 30.79 ± 1.53 |
| C–GO | 11.6 | 5.8 | 0.00530 ± 0.002 | 27.45 ± 1.22 |
| Sample | 2θ | hkl | d-Spacing (Å) | ||
|---|---|---|---|---|---|
| Observed | Standard | Observed | Standard | ||
| Graphite | 26.17 ± 0.001 | 26.15 | 002 | 3.377 ± 0.02 | 3.3 |
| K–GO | 26.5 ± 0.003 | 26.4 | 002 | 3.358 ± 0.05 | 3.4 |
| N–GO | 26.17 ± 0.001 | 26.15 | 002 | 3.402 ± 0.03 | 3.3 |
| F–GO | 11.5 ± 0.03 | 11.1 | 001 | 7.62 ± 0.04 | 7.94 |
| C–GO | 11.6 ± 0.04 | 11.1 | 001 | 7.608 ± 0.03 | 7.94 |
| Serial Number | Bacteria | Zone of Inhibition (mm) of Erythromycin (100 μg/mL) |
|---|---|---|
| 1. | Pseudomonas pneumoniae | 16 mm |
| 2. | Staphylococcus aureus | 18 mm |
| Bacterial Species | Concentration of K–GO | ||
| 50 µL | 100 µL | 150 µL | |
| Pseudomonas pneumonia | 1 mm | 1 mm | 2 mm |
| Staphylococcus aureus | 1.5 mm | 1 mm | 0 mm |
| Bacterial Species | Concentration of N–GO | ||
| 50 µL | 100 µL | 150 µL | |
| Pseudomonas pneumonia | 1.6 mm | 1 mm | 1 mm |
| Staphylococcus aureus | 0 mm | 0 mm | 1.5 mm |
| Bacterial Species | Concentration of F–GO | ||
| 50 µL | 100 µL | 150 µL | |
| Pseudomonas pneumonia | 4 mm | 1 mm | 1.6 mm |
| Staphylococcus aureus | 0 mm | 1 mm | 1.5 mm |
| Bacterial Species | Concentration of C–GO | ||
| 50 µL | 100 µL | 150 µL | |
| Pseudomonas pneumonia | 0 mm | 1.5 mm | 1 mm |
| Staphylococcus aureus | 1.5 mm | 8 mm | 10 mm |
© 2020 by the authors. Licensee MDPI, Basel, Switzerland. This article is an open access article distributed under the terms and conditions of the Creative Commons Attribution (CC BY) license (http://creativecommons.org/licenses/by/4.0/).
Share and Cite
Hashmi, A.; Singh, A.K.; Jain, B.; Carabineiro, S.A.C. Chloramine-T/N-Bromosuccinimide/FeCl3/KIO3 Decorated Graphene Oxide Nanosheets and Their Antibacterial Activity. Nanomaterials 2020, 10, 105. https://doi.org/10.3390/nano10010105
Hashmi A, Singh AK, Jain B, Carabineiro SAC. Chloramine-T/N-Bromosuccinimide/FeCl3/KIO3 Decorated Graphene Oxide Nanosheets and Their Antibacterial Activity. Nanomaterials. 2020; 10(1):105. https://doi.org/10.3390/nano10010105
Chicago/Turabian StyleHashmi, Ayesha, Ajaya Kumar Singh, Bhawana Jain, and Sónia Alexandra Correia Carabineiro. 2020. "Chloramine-T/N-Bromosuccinimide/FeCl3/KIO3 Decorated Graphene Oxide Nanosheets and Their Antibacterial Activity" Nanomaterials 10, no. 1: 105. https://doi.org/10.3390/nano10010105
APA StyleHashmi, A., Singh, A. K., Jain, B., & Carabineiro, S. A. C. (2020). Chloramine-T/N-Bromosuccinimide/FeCl3/KIO3 Decorated Graphene Oxide Nanosheets and Their Antibacterial Activity. Nanomaterials, 10(1), 105. https://doi.org/10.3390/nano10010105