Microencapsulation of Bioactive Principles with an Airless Spray-Gun Suitable for Processing High Viscous Solutions

Abstract
:1. Introduction
2. Results and Discussion
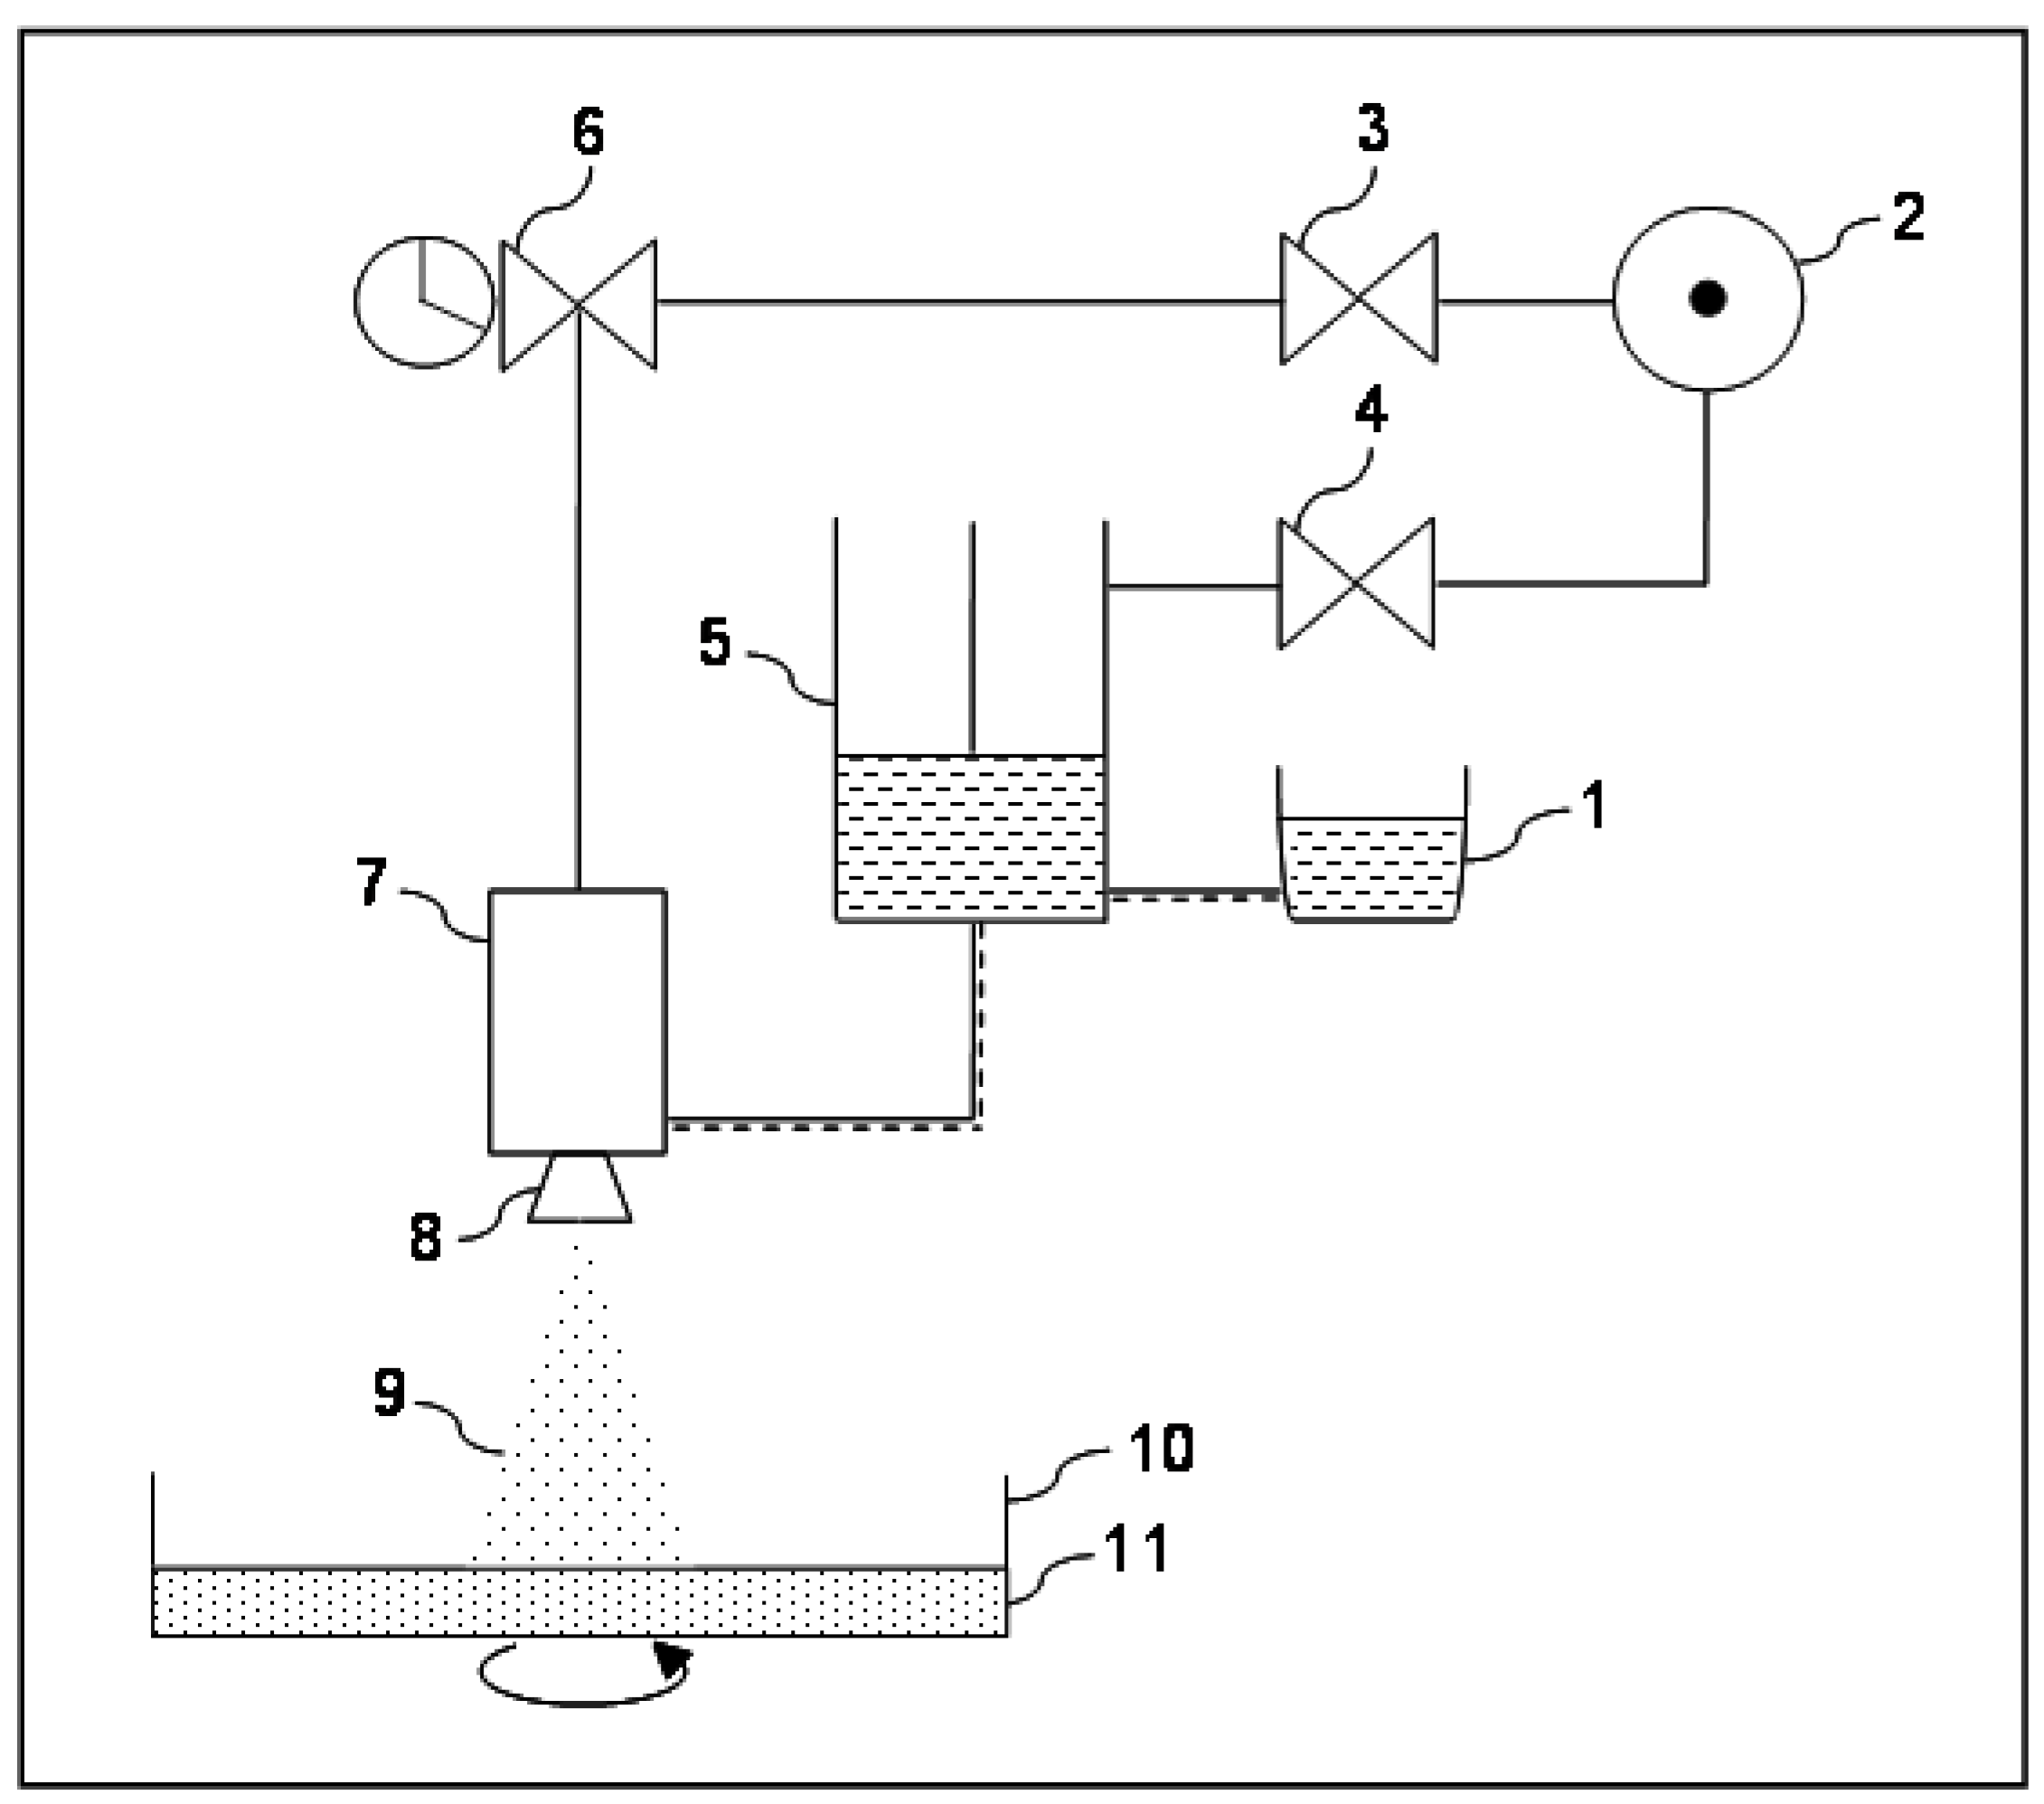
2.1. Airless Spray-Gun Description
2.2. Preliminary Experiments for Parameter Setting

| Batch number | Nozzle’s orifice | Alginate (% w/v) | CaCl2 (% w/v) | Qualitative scoring |
|---|---|---|---|---|
| 1 | Large | 2 | 15 | +/− |
| 2 | 3 | + | ||
| 3 | 4 | + | ||
| 4 | 5 | − | ||
| 5 | Small | 1 | + | |
| 6 | 2 | + | ||
| 7 | 3 | + | ||
| 8 | 4 | +/− |
2.3. Prototype’s Production Yield
| Batch n. | Volume (L) | FS dry weight (g) | MP dry weight (g) | Yield (%) |
|---|---|---|---|---|
| 3-1L | 1 | 25.4 | 12.0 | 47.2 |
| 3-2L | 2 | 50.8 | 35.5 | 69.9 |
| 3-3L | 3 | 76.2 | 66.7 | 87.5 |
| 3-4L | 4 | 101.6 | 91.8 | 90.4 |
| % w/v alginate | 1 | 2 | 3 | 4 | 4.2 | 4.4 |
|---|---|---|---|---|---|---|
| Single atomization (g) | 7.31 ± 0.1 | 7.04 ± 0.4 | 7.21 ± 0.8 | 6.68 ± 0.1 | 6.38 ± 0.1 | 6.08 ± 0.04 |
| Total (g) | 438.2 ± 4.6 | 422.4 ± 22 | 432.7 ± 46.2 | 400.5 ± 21.5 | 382.7 ± 6.1 | 366.5 ± 4.4 |
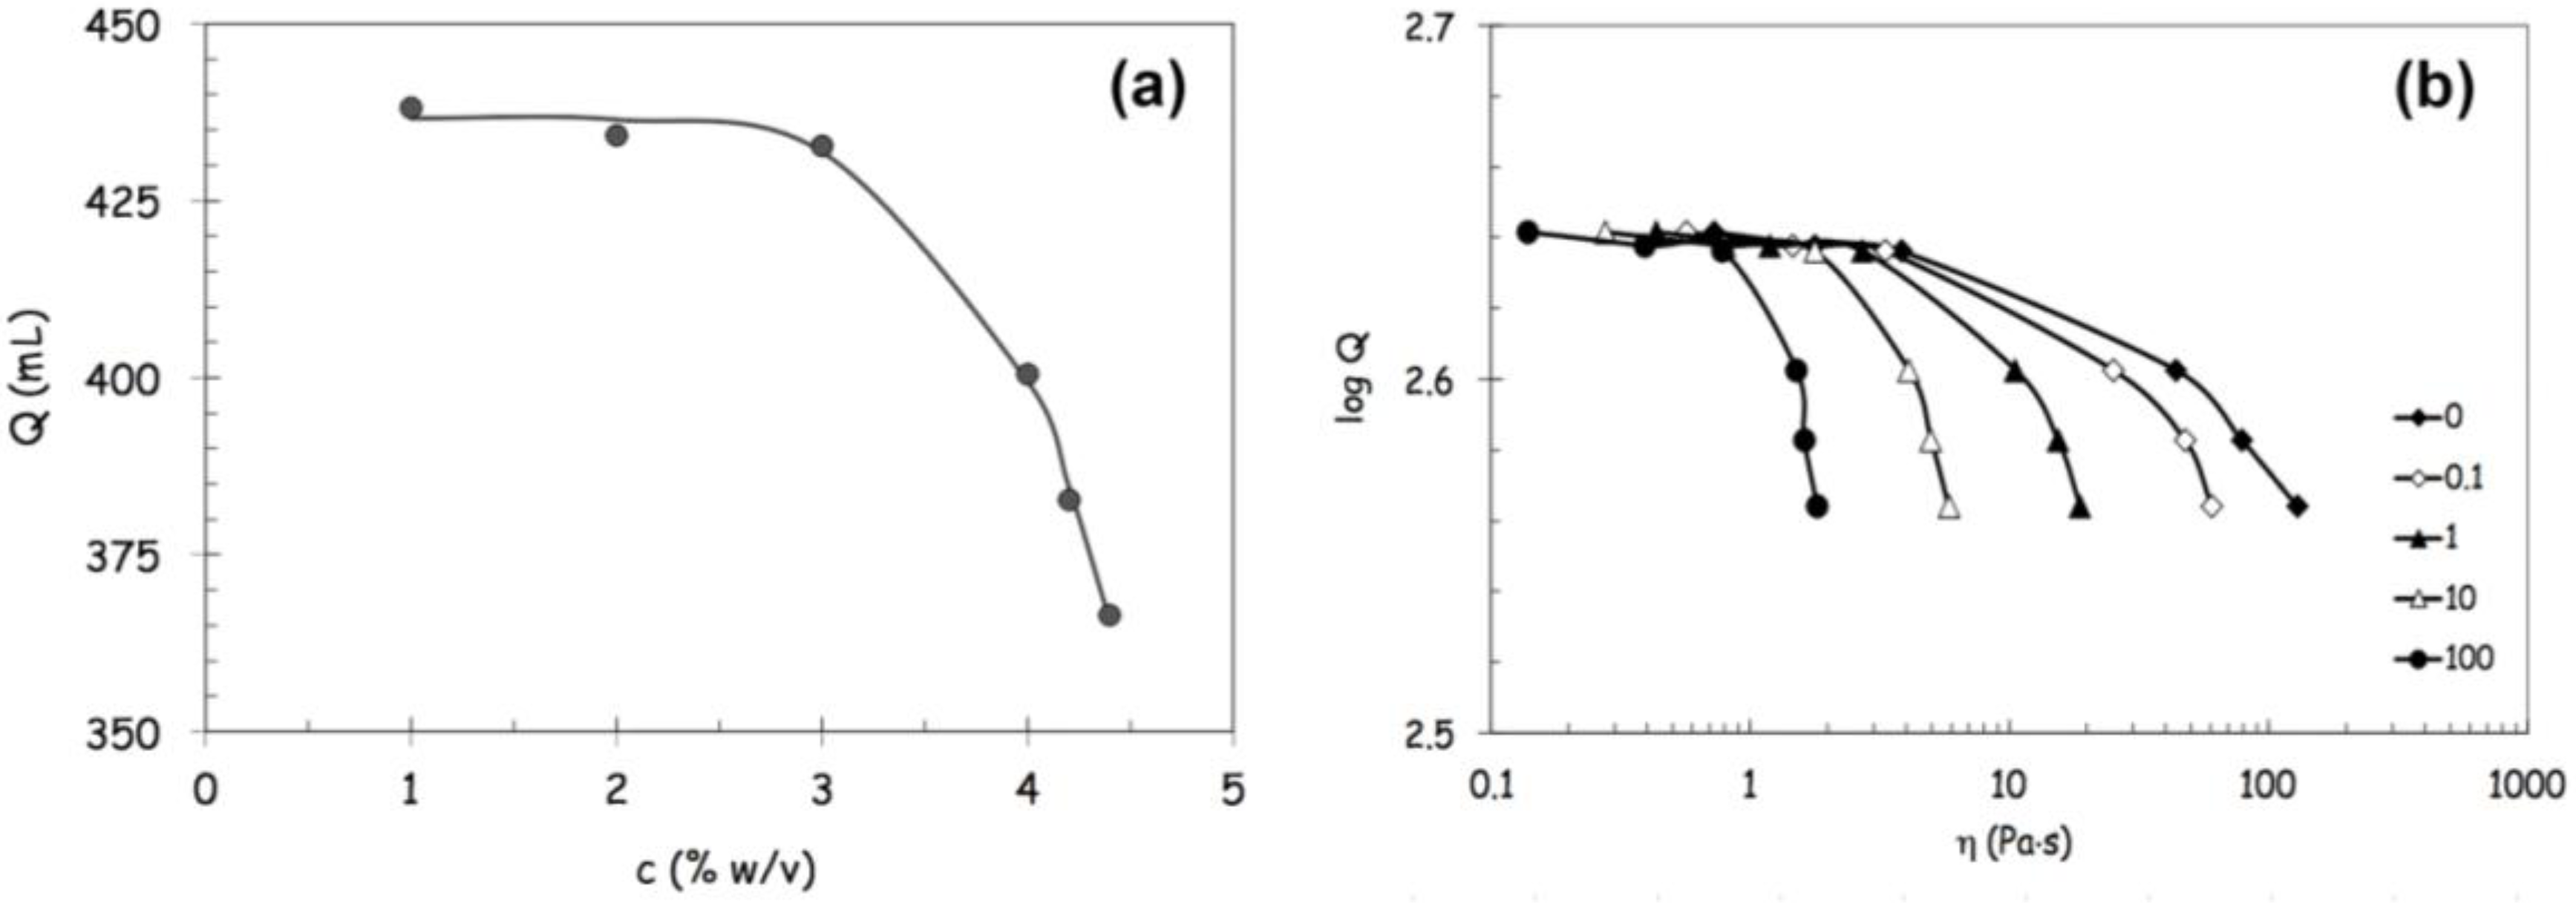
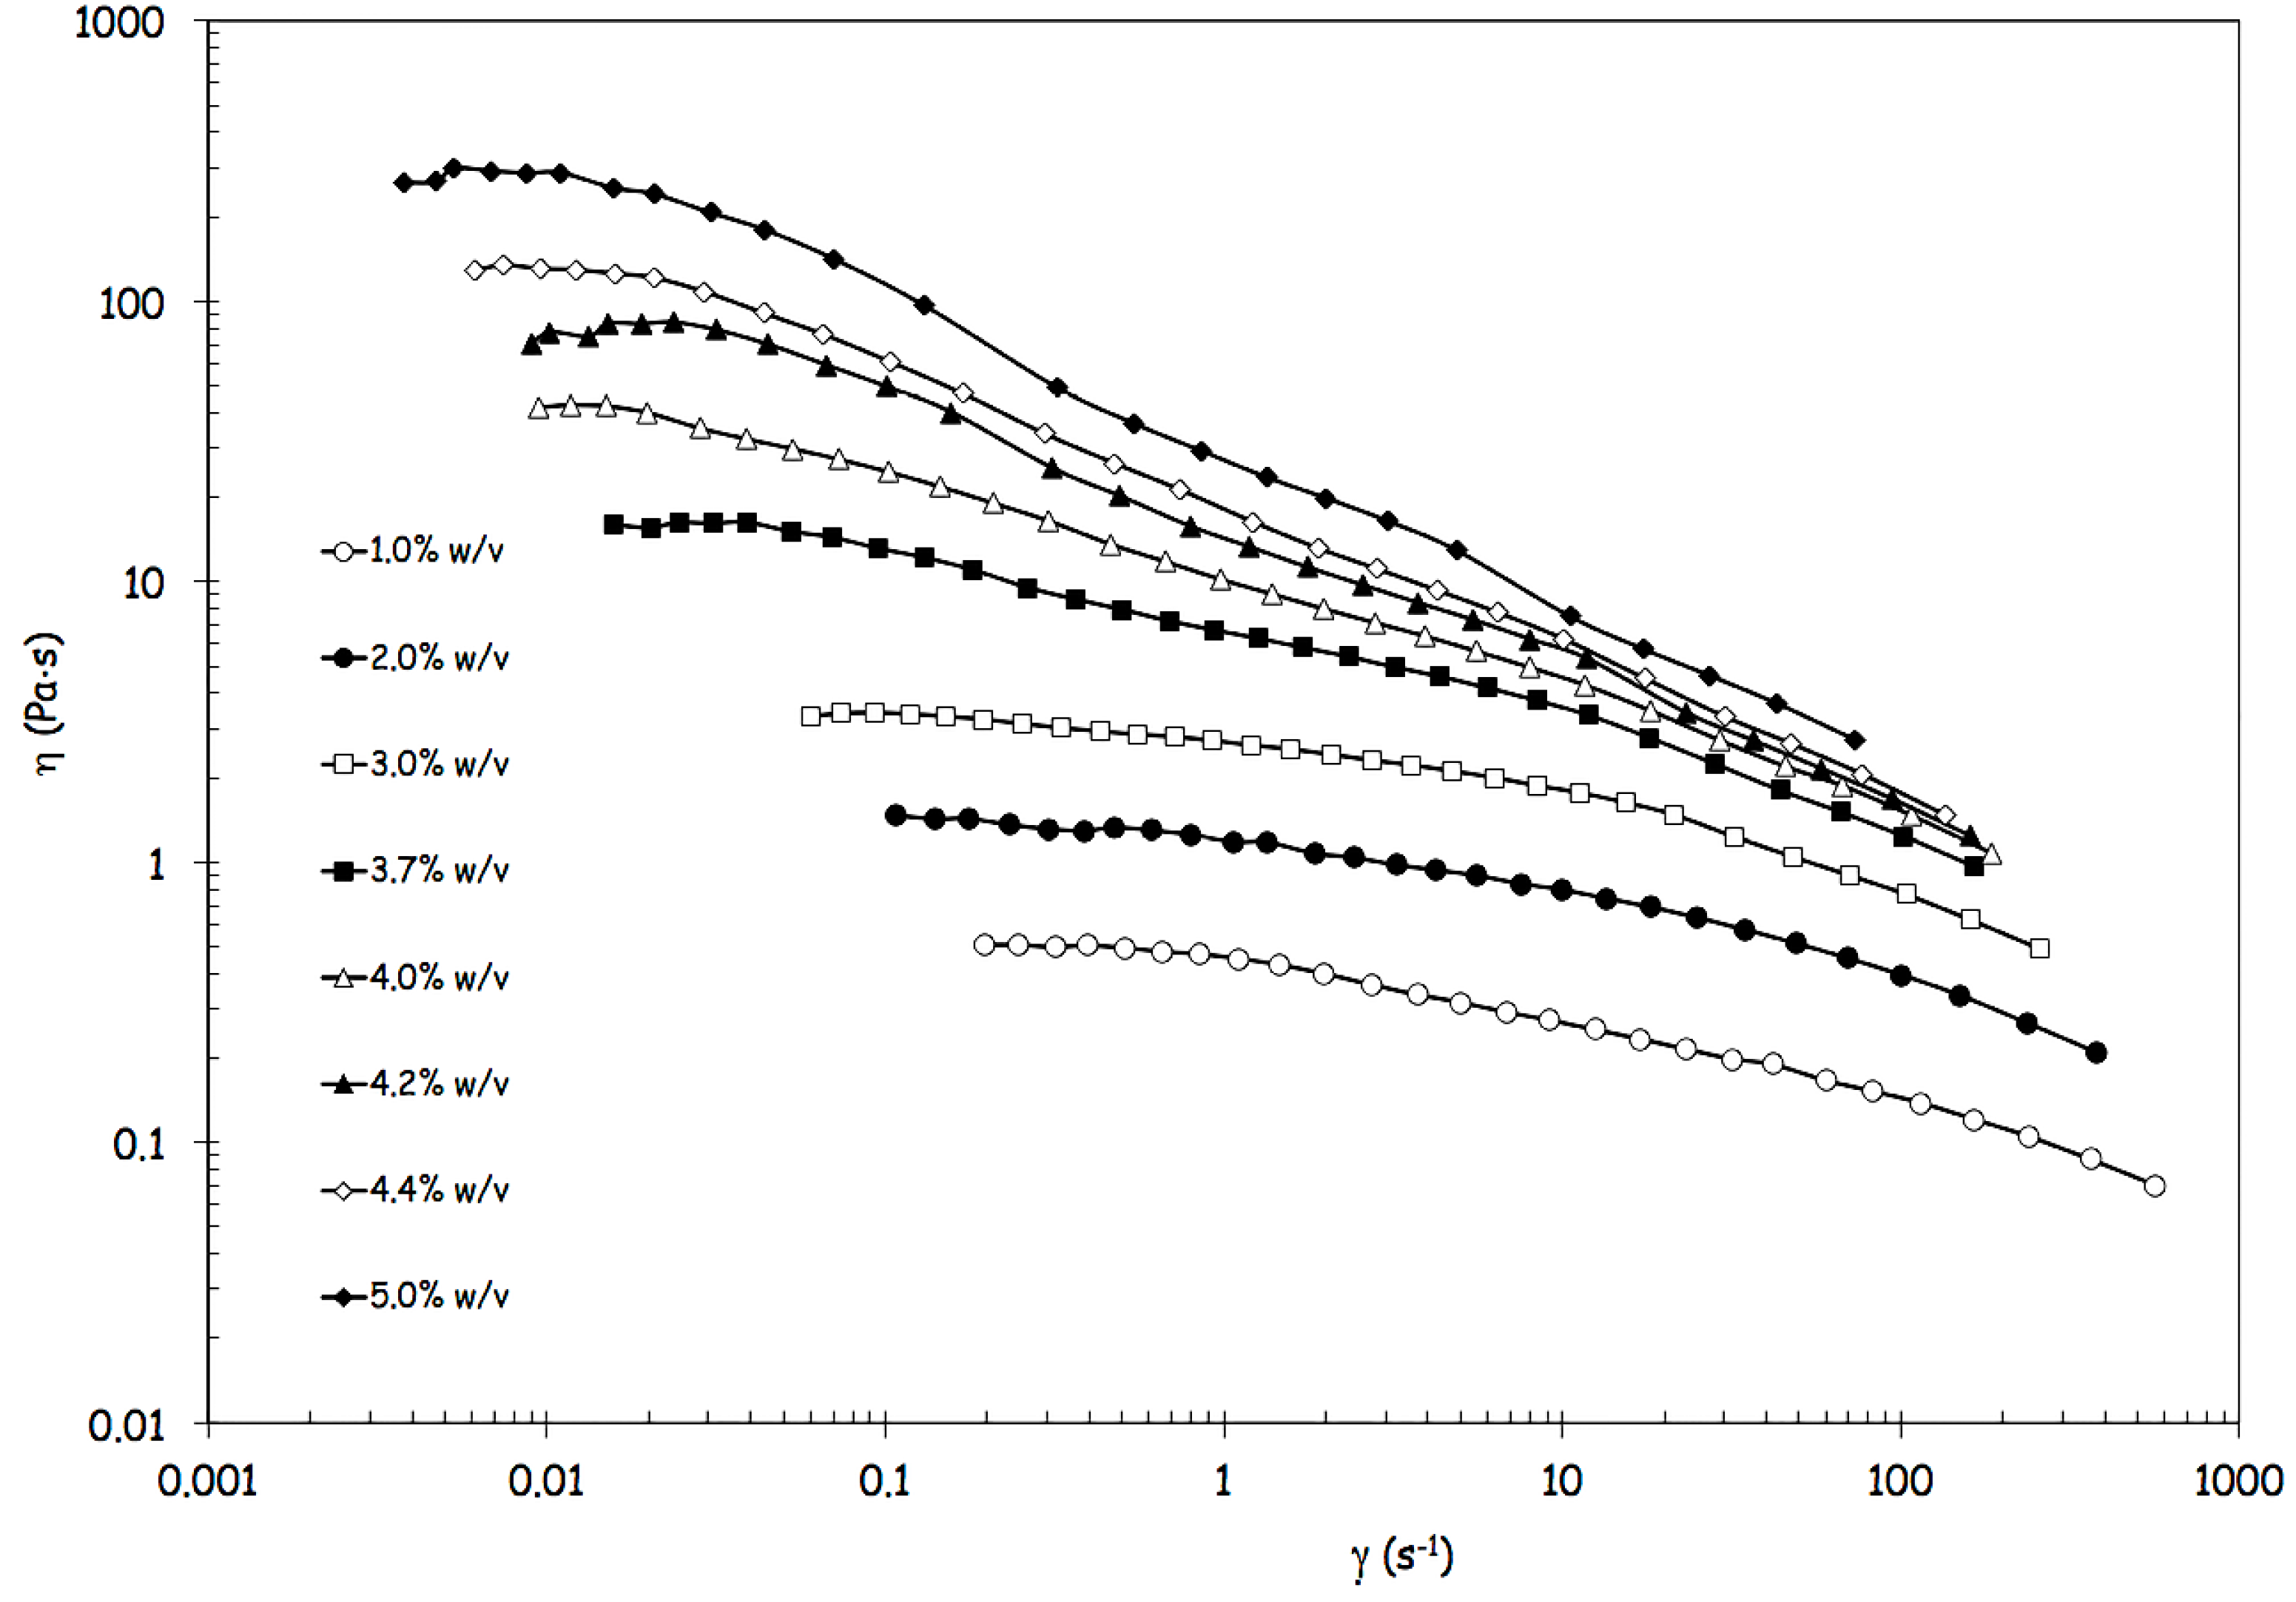
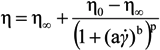
2.4. Rheological Analysis
 c, derived from model parameters (a, b and p) in correspondence with η = η0/2.c, at infinite shear viscosity η∞ set equal to zero; and Panel (c): effects produced by an increase of alginate concentration above 3% w/von viscosity values at different reference shear conditions (0.1, 1, 10, 100 s−1).
c, at infinite shear viscosity η∞ set equal to zero; and Panel (c): effects produced by an increase of alginate concentration above 3% w/von viscosity values at different reference shear conditions (0.1, 1, 10, 100 s−1).
c, derived from model parameters (a, b and p) in correspondence with η = η0/2.c, at infinite shear viscosity η∞ set equal to zero; and Panel (c): effects produced by an increase of alginate concentration above 3% w/von viscosity values at different reference shear conditions (0.1, 1, 10, 100 s−1).
c, at infinite shear viscosity η∞ set equal to zero; and Panel (c): effects produced by an increase of alginate concentration above 3% w/von viscosity values at different reference shear conditions (0.1, 1, 10, 100 s−1).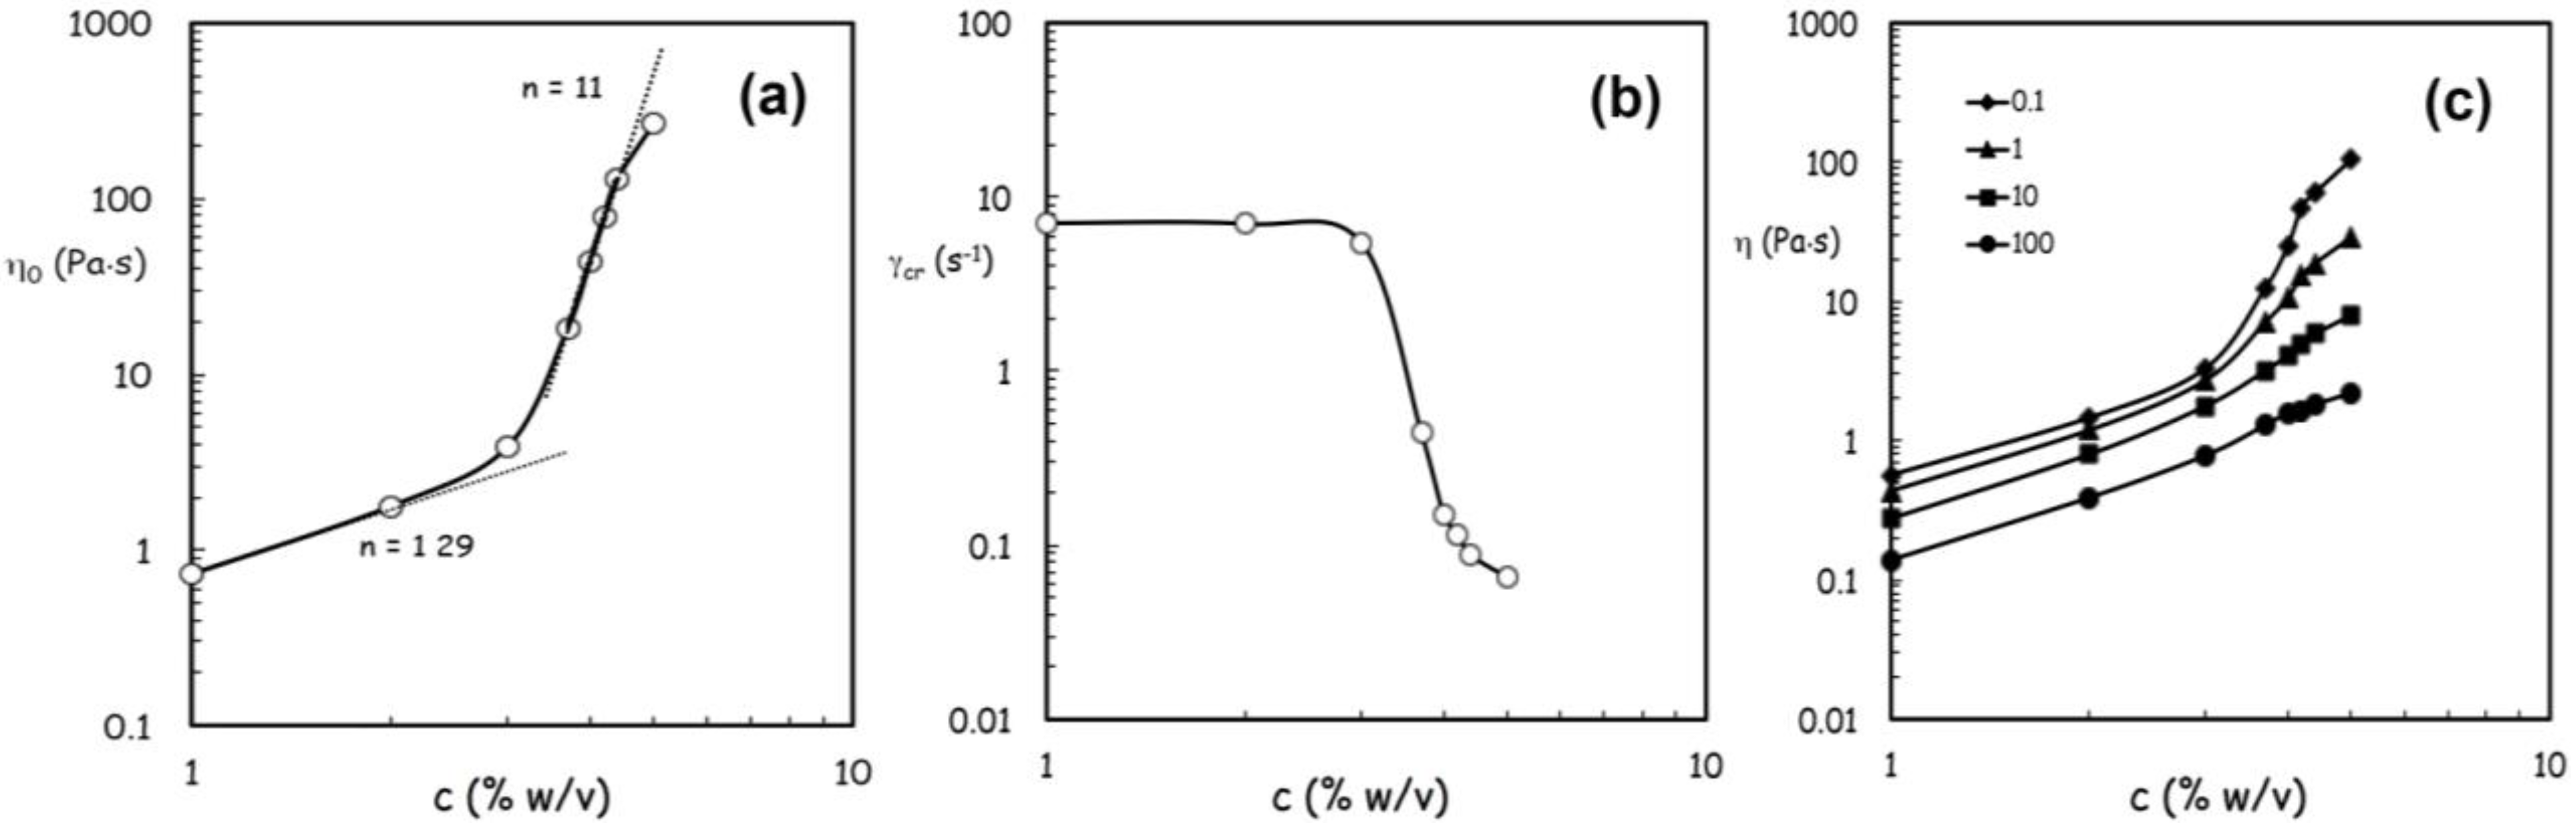
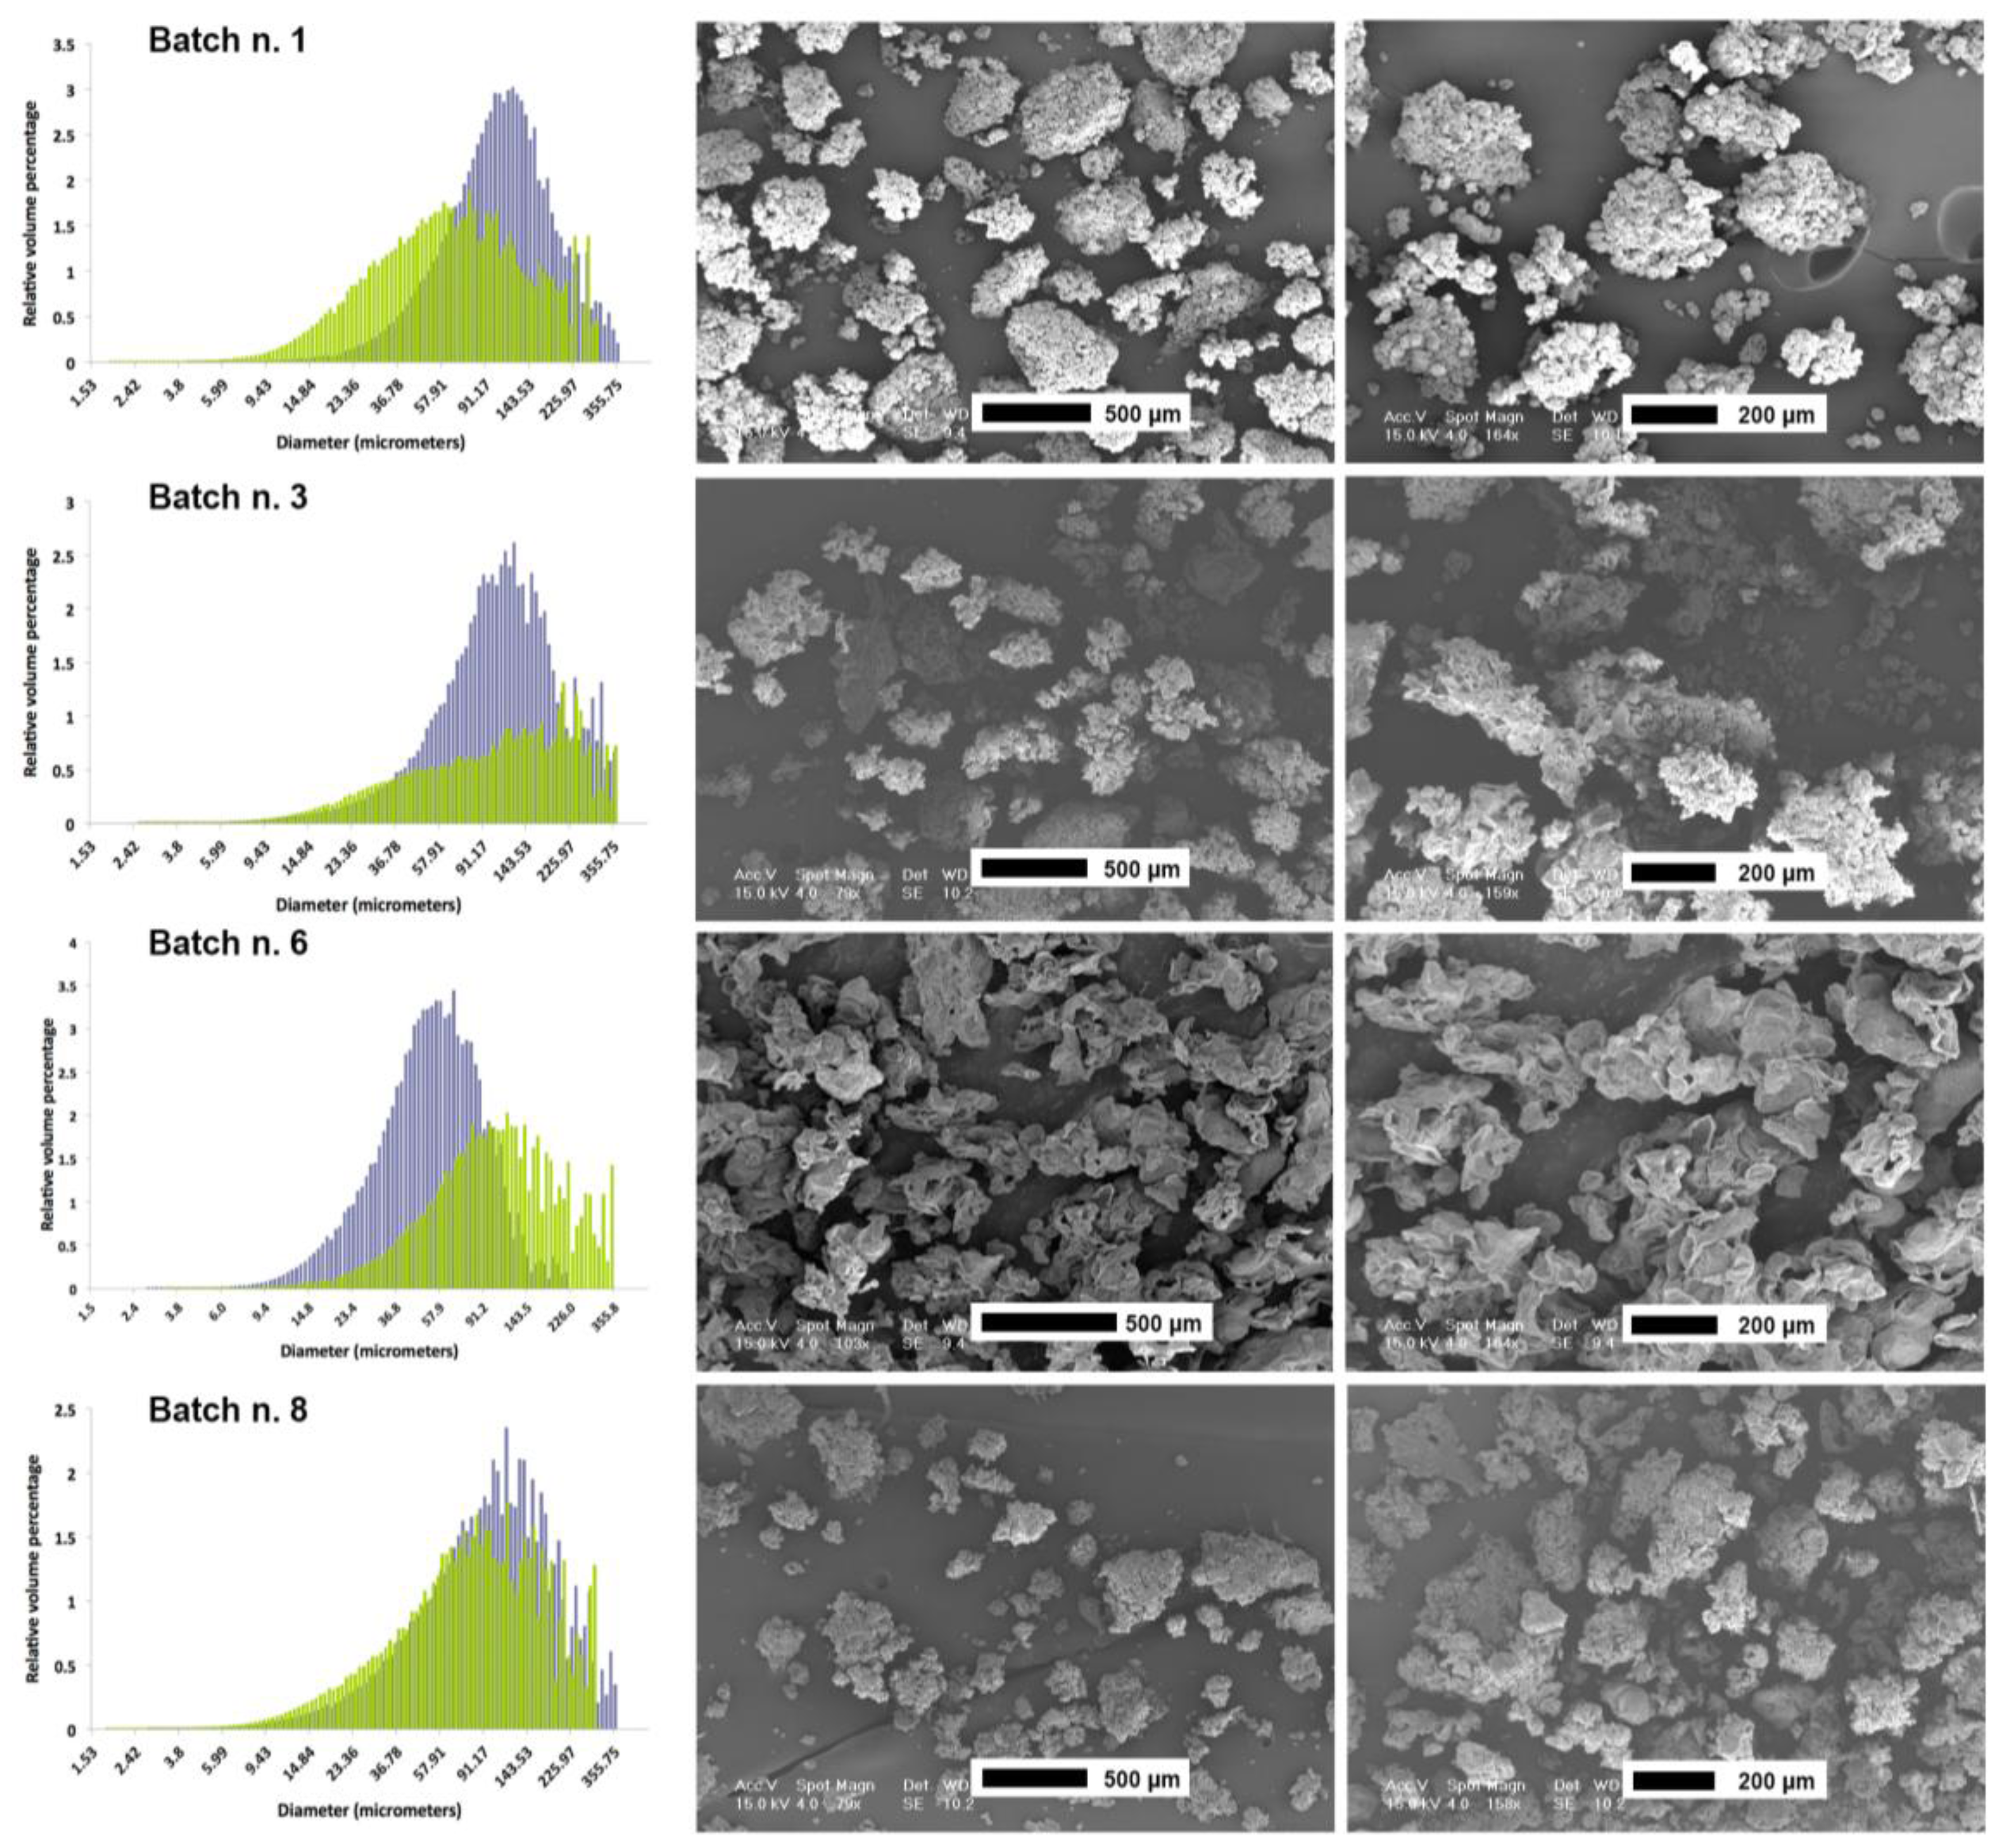
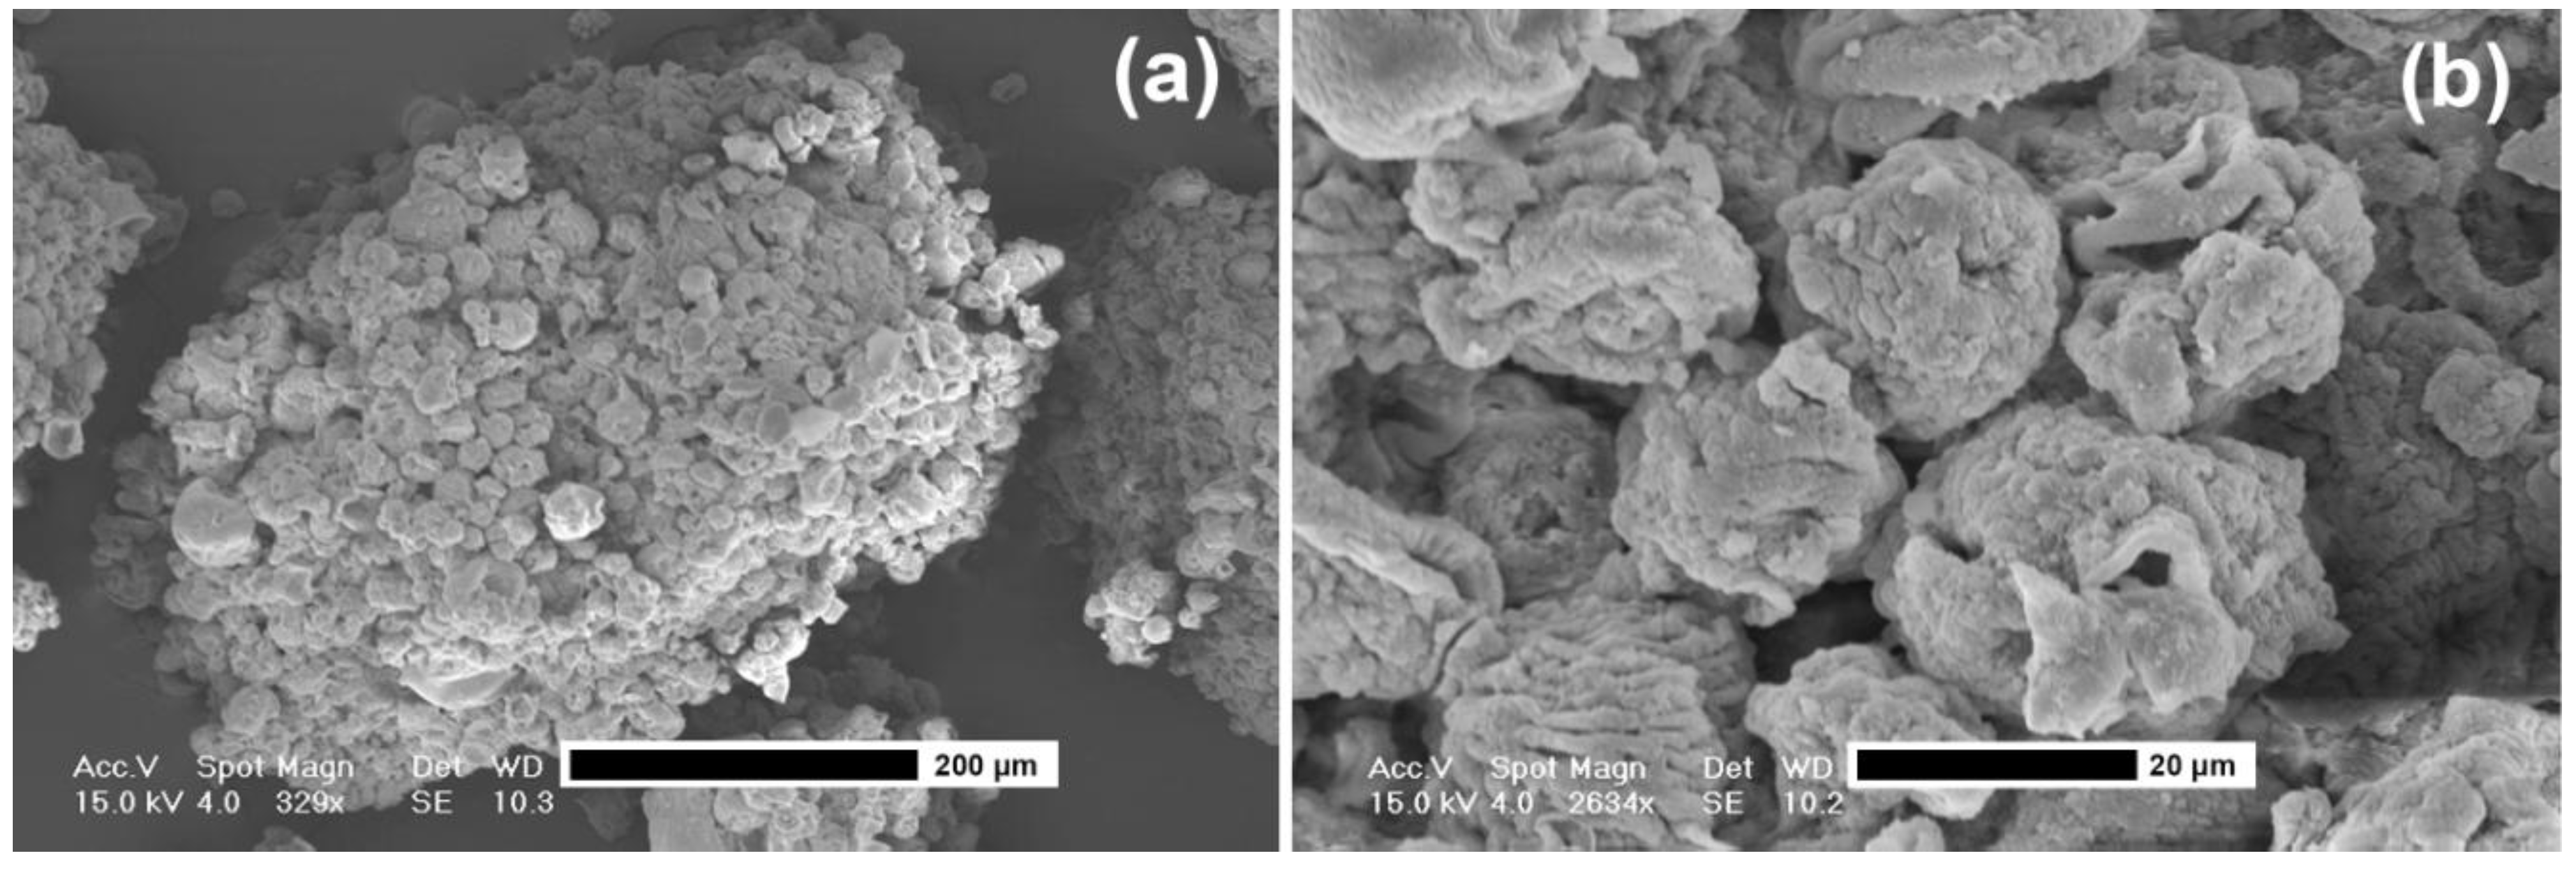
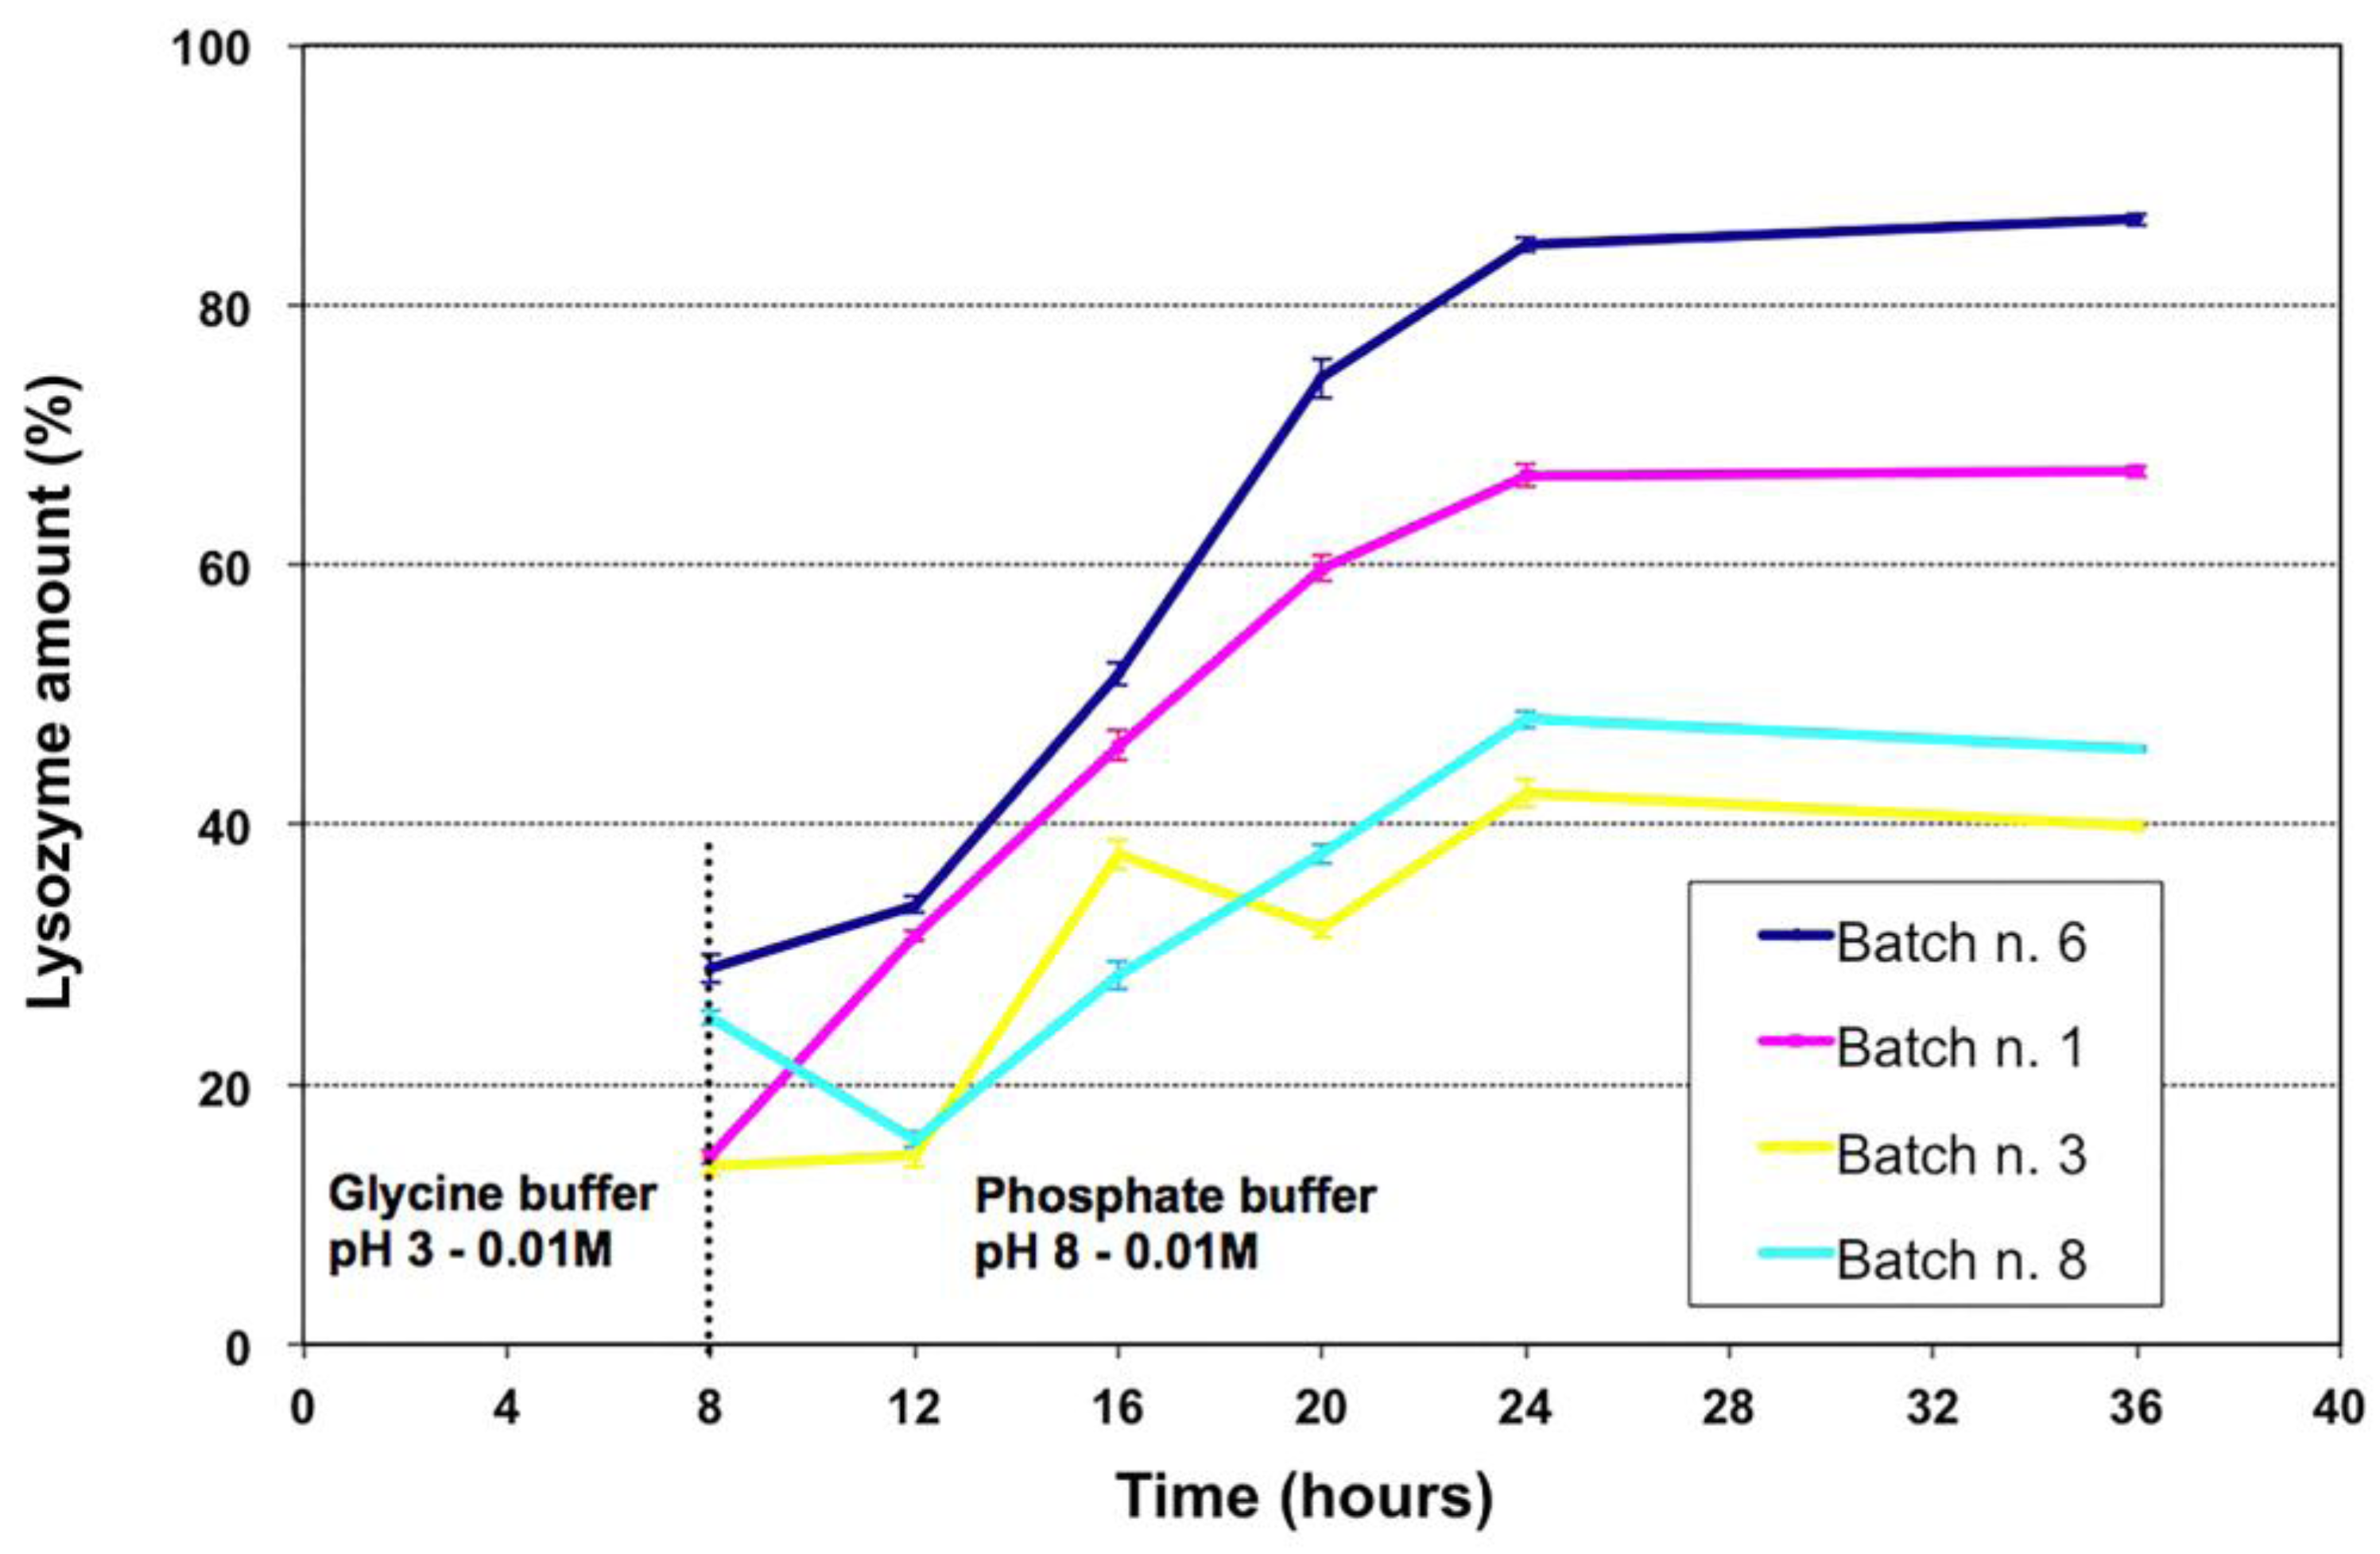
2.5. Microparticle Characterization
| Batch n. | % w/w | Viscosity of FSs: (H, high; L, low) | Nozzle size | ||
|---|---|---|---|---|---|
| Alginate | HPMC | LZ | |||
| 6 | 72.8 | 8.7 | 18.5 | H | Small |
| 1 | 72.8 | 8.7 | 18.5 | Large | |
| 8 | 57.3 | 13.6 | 29.1 | L | Small |
| 3 | 57.3 | 13.6 | 29.1 | Large | |

| Batch n. | Native Vmd (µm) | After swelling in H2O | After swelling in PBS |
|---|---|---|---|
| 1 | 158.7 ± 108.8 | 144.7 ± 105.3 | 153.6 ± 136.3 |
| 3 | 184.5 ± 122.7 | 189.8 ± 123.5 | 274.4 ± 131.7 |
| 6 | 68.9 ± 61.1 | 51.5 ± 45.3 | 137.5 ± 125.5 |
| 8 | 190.8 ± 132.2 | 175.9 ± 125.5 | 199.0 ± 142.0 |
| Measure | Batchn. 1 | Batch n. 3 | Batch n. 6 | Batch n. 8 |
|---|---|---|---|---|
| 1 | 32.62 | 32.21 | 31.80 | 36.87 |
| 2 | 32.21 | 32.21 | 32.21 | 38.31 |
| 3 | 33.02 | 33.42 | 31.38 | 37.23 |
| Mean ± S.D. | 32.6 ± 0.41 | 32.6 ± 0.70 | 31.8 ± 0.42 | 37.5 ± 0.75 |

3. Experimental Section
3.1. Materials
3.2. Instrumentation
3.2.1. Prototype Description
3.2.2. Microparticle Production
3.2.3. Operative Conditions
3.3. Rheology
3.4. Microparticle Preparation and Characterization

4. Conclusions
Acknowledgments
Conflicts of Interest
References
- Microencapsulation Methods and Industrial Applications, 2nd ed.; Benita, S. (Ed.) Taylor and Francis: Boca Raton, FL, USA, 2006.
- Bansode, S.S.; Banarjee, S.K.; Gaikwad, D.D.; Jadhav, S.L.; Thorat, R.M. Microencapsulation: A review. Int. J. Pharm. Sci. Rev. Res. 2010, 1, 38–43. [Google Scholar]
- Shekhar, K.; Madhu, M.N.; Pradeep, B.; Banji, D. A review on microencapsulation. Int. J. Pharm. Sci. Rev. Res. 2010, 5, 58–62. [Google Scholar]
- Zorzin, L.; Cocchietto, M.; Voinovich, D.; Marcuzzi, A.; Filipović-Grčić, J.; Mulloni, C.; Crembiale, G.; Casarsa, G.; Bulla, R.; Sava, G. Lysozyme-containing chitosan-coated alginate microspheres for oral immunization. J. Drug Deliv. Sci. Technol. 2006, 16, 413–420. [Google Scholar]
- Sava, G.; Voinovich, D.; Zorzin, L. Polysaccharide Double-layer Microcapsules as Carriers for Biologically Active Substance Oral Administration. 17 July 2005. Available online: http://patentscope.wipo.int/search/en/WO2005013941 (accessed on 10 November 2013).
- Blasi, P.; Giovagnoli, S.; Schoubben, A.; Ricci, M.; Rossi, C.; Luca, G.; Basta, G.; Calafiore, R. Preparation and in vitro and in vivo characterization of composite microcapsules for cell encapsulation. Int. J. Pharm. 2006, 324, 27–36. [Google Scholar] [CrossRef]
- Chávarri, M.; Marañón, I.; Ares, R.; Ibáñez, F.C.; Marzo, F.; Villarán Mdel, C. Microencapsulation of a probiotic and prebiotic in alginate-chitosan capsules improves survival in simulated gastro-intestinal conditions. Int. J. Food Microbiol. 2010, 142, 185–189. [Google Scholar] [CrossRef]
- Schoubben, A.; Blasi, P.; Giovagnoli, S.; Rossi, C.; Ricci, M. Development of a scalable procedure for fine calcium alginate particle preparation. Chem. Eng. J. 2010, 160, 363–369. [Google Scholar] [CrossRef]
- Cocchietto, M.; Zorzin, L.; Toffoli, B.; Candido, R.; Fabris, B.; Stebel, M.; Sava, G. Orally administered microencapsulated lysozyme downregulates serum AGE and reduces severity of early-stage diabetic nephropathy. Diabetes Metab. 2008, 34, 587–594. [Google Scholar] [CrossRef]
- Cocchietto, M.; Zorzin, L.; Sava, G. Impiego di microcapsule a doppio strato di polisaccaridi veicolanti lisozima per il trattamentodella nefropatia diabetica. (in Italian). Italian Patent No. 0001362735, 25 June 2009. [Google Scholar]
- Paolini, A.; Ridolfi, V.; Zezza, D.; Cocchietto, M.; Musa, M.; Pavone, A.; Conte, A.; Giorgetti, G. Vaccination trial of sea-bass (Dicentrarchus labrax) against pasteurellosis using oral, intraperitoneal and bath administration. Vet. Ital. 2005, 41, 7–14. [Google Scholar]
- Cocchietto, M.; Voinovich, D.; Zorzin, L.; Sava, G. Method and apparatus for preparing micro-particles of polysaccharides. 10 March 2011. Available online: http://patentscope.wipo.int/search/en/WO2011026896 (accessed on 10 November 2013).
- Airless Spray Coating Technology; Graco Inc.: Minneapolis, MN, USA. Available online: http://www.chreed.com/help_pages/airless_guns.pdf (accessed on 15 March 2013).
- Zhong, D.; Huang, X.; Yang, H.; Cheng, R. New insights into viscosity abnormality of sodium alginate aqueous solution. Carbohydr. Polym. 2010, 81, 948–952. [Google Scholar] [CrossRef]
- Zhang, H.; Wang, H.; Wang, J.; Guo, R.; Zhang, Q. The effect of ionic strength on the viscosity of sodium alginate solution. Polym. Adv. Technol. 2001, 12, 740–745. [Google Scholar] [CrossRef]
- Borgogna, M.; Bellich, B.; Zorzin, L.; Lapasin, R.; Cesàro, A. Food microencapsulation of bioactive compounds: Rheological and thermal characterisation of non-conventional gelling system. Food Chem. 2010, 122, 416–423. [Google Scholar] [CrossRef]
- European Directorate for the Quality of Medicines (EDQM). Section 2: Methods of Analysis. In European Pharmacopeia 6.0; European Directorate for the Quality of Medicines (EDQM): Strasbourg, France, 2007; pp. 320–323. [Google Scholar]
- Silva, C.M.; Ribeiro, A.J.; Figueiredo, I.V.; Gonçalves, A.R.; Veiga, F. Alginate microspheres prepared by internal gelation: Development and effect on insulin stability. Int. J. Pharm. 2006, 311, 1–10. [Google Scholar] [CrossRef]
- George, M.; Abraham, T.E. Polyionic hydrocolloids for the intestinal delivery of protein drugs: alginate and chitosan-a review. J. Control. Release 2006, 114, 1–14. [Google Scholar] [CrossRef]
- Yuspiovich, A.I.; Zagubizhenko, M.V.; Levin, G.G.; Plantonova, A.; Parshina, E.Y.; Grygorzcyk, R.; Maksimov, G.V.; Rubin, A.B.; Orlov, S.N. Laser interference microscopy of amphibian erythrocytes: Impact of cell volume and refractive index. J. Microsc. 2011, 244, 223–229. [Google Scholar] [CrossRef]
- Nicoli, D.F.; Wu, J.S.; Chang, Y.J.; McKenzie, D.C.; Hasapidis, K. Automatic, high-resolution particle size analysis by single-particle optical sensing. Am. Lab. 1992, 24, 39–44. [Google Scholar]
- Clausen, R.G. Body temperature of fresh water fishes. Ecology 1934, 15, 139–144. [Google Scholar] [CrossRef]
- Ramadas, M.; Paul, W.; Dileep, K.J.; Anitha, Y.; Sharma, C.P. Lipoinsulin encapsulated alginate-chitosan capsules: Intestinal delivery in diabetic rats. J. Microencapsul. 2000, 17, 405–411. [Google Scholar] [CrossRef]
- Sezer, A.D.; Akbuğa, J. Release characteristics of chitosan treated with alginate beads: I. Sustained release of a macromolecular drug from chitosan treated alginate beads. J. Microencapsul. 1999, 16, 195–203. [Google Scholar] [CrossRef]
- Shibuya, T.; Watanade, Y.; Nalley, K.A.; Fusco, A.; Salafsky, B. The BCA protein determination system: an analysis of several buffers, incubation temperature and protein standards. Tokyo Ika Daigaku Zasshi 1989, 47, 677–682. [Google Scholar]
© 2013 by the authors; licensee MDPI, Basel, Switzerland. This article is an open access article distributed under the terms and conditions of the Creative Commons Attribution license (http://creativecommons.org/licenses/by/3.0/).
Share and Cite
Cocchietto, M.; Blasi, P.; Lapasin, R.; Moro, C.; Gallo, D.; Sava, G. Microencapsulation of Bioactive Principles with an Airless Spray-Gun Suitable for Processing High Viscous Solutions. J. Funct. Biomater. 2013, 4, 312-328. https://doi.org/10.3390/jfb4040312
Cocchietto M, Blasi P, Lapasin R, Moro C, Gallo D, Sava G. Microencapsulation of Bioactive Principles with an Airless Spray-Gun Suitable for Processing High Viscous Solutions. Journal of Functional Biomaterials. 2013; 4(4):312-328. https://doi.org/10.3390/jfb4040312
Chicago/Turabian StyleCocchietto, Moreno, Paolo Blasi, Romano Lapasin, Chiara Moro, Davide Gallo, and Gianni Sava. 2013. "Microencapsulation of Bioactive Principles with an Airless Spray-Gun Suitable for Processing High Viscous Solutions" Journal of Functional Biomaterials 4, no. 4: 312-328. https://doi.org/10.3390/jfb4040312
APA StyleCocchietto, M., Blasi, P., Lapasin, R., Moro, C., Gallo, D., & Sava, G. (2013). Microencapsulation of Bioactive Principles with an Airless Spray-Gun Suitable for Processing High Viscous Solutions. Journal of Functional Biomaterials, 4(4), 312-328. https://doi.org/10.3390/jfb4040312