


Tilapia Fish Skin Treatment of Third-Degree Skin Burns in Murine Model


 ,
,
Abstract

1. Introduction
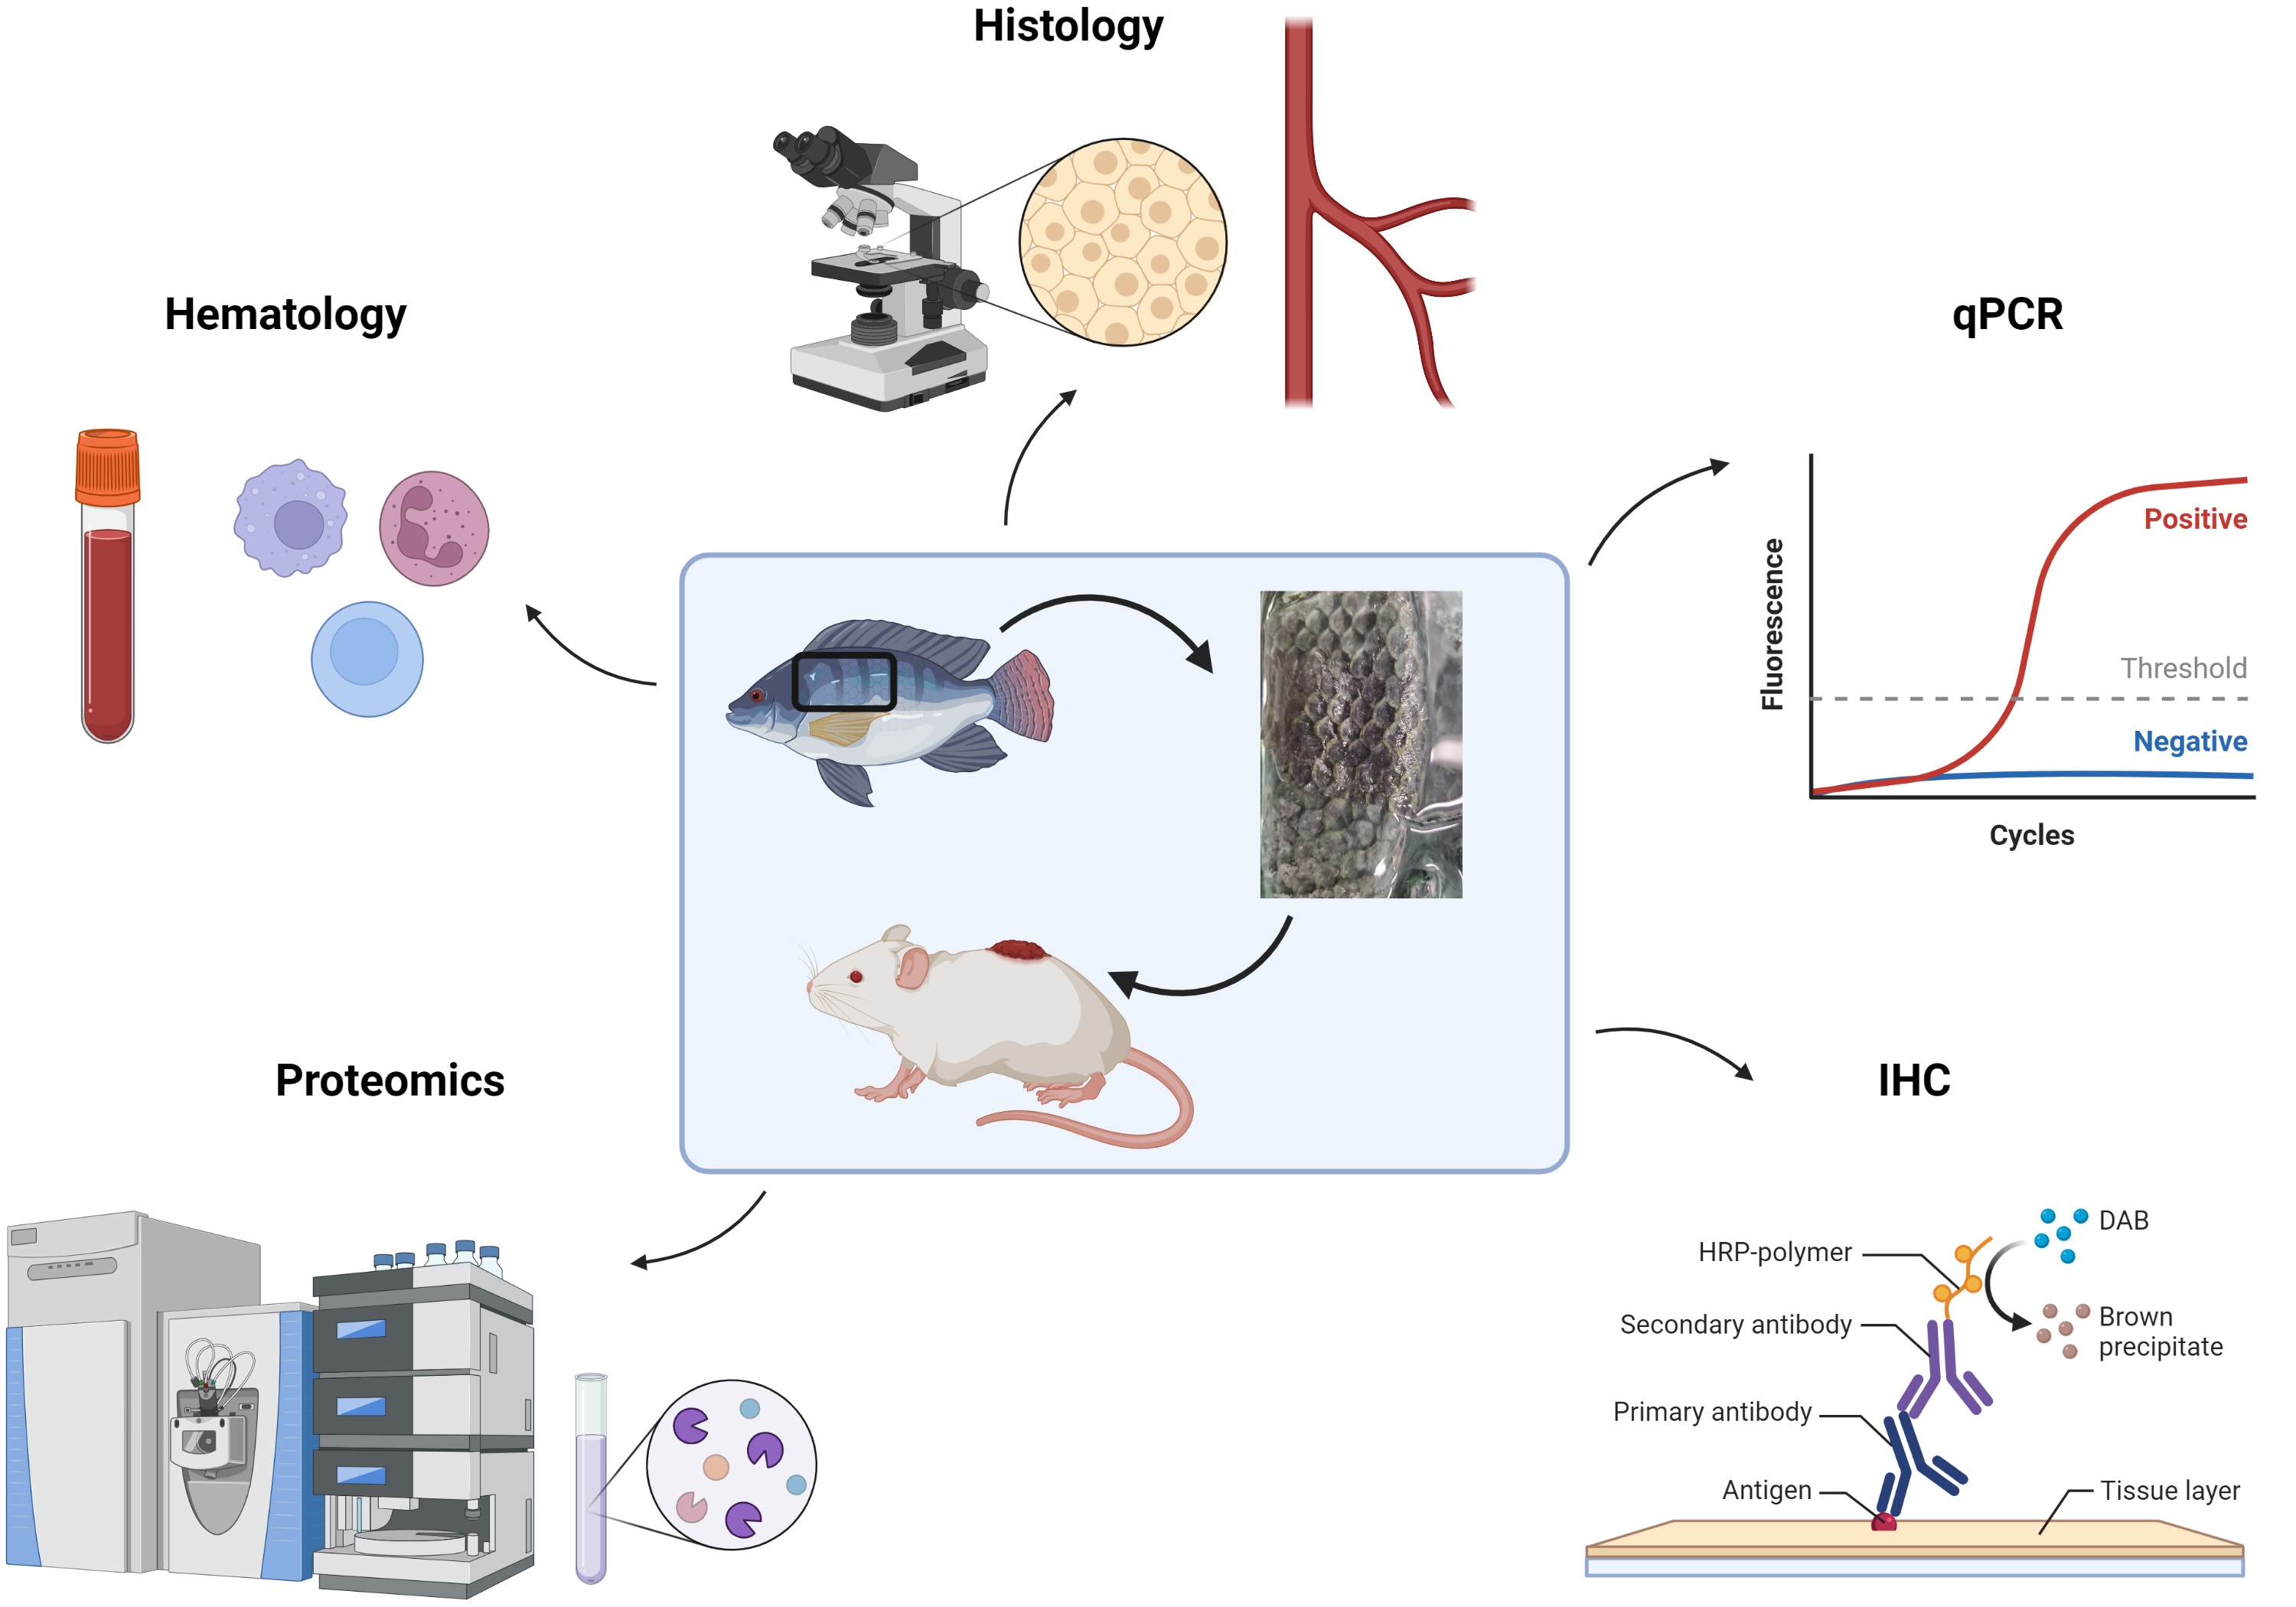
2. Materials and Methods
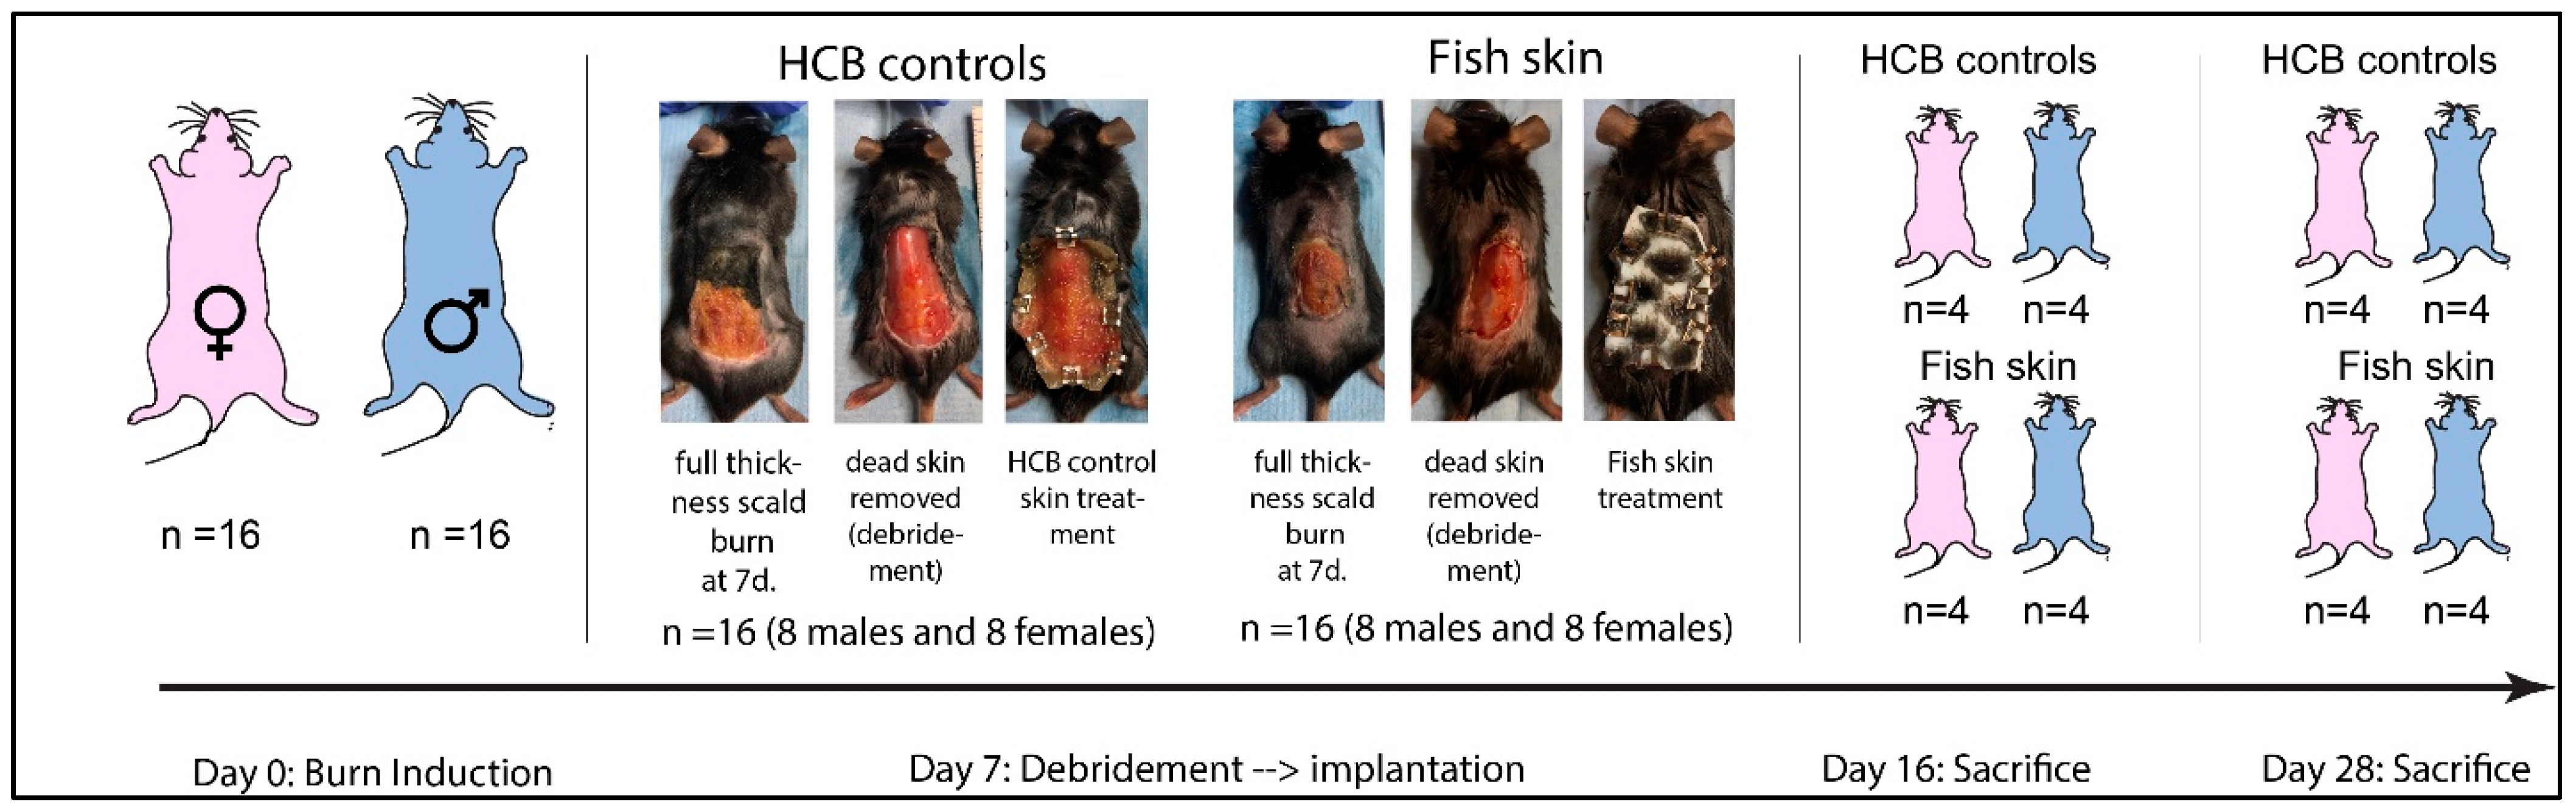
2.1. Animals
2.2. Study Design
2.3. Burn Induction
2.4. Burn Debridement and Treatment
2.5. Sacrifice and Sample Collection
2.6. Fish Skin Preparation
2.7. Wound Size
2.8. Blood Analyses
2.9. PCR Testing
2.10. Proteomics
2.11. Histology
2.12. Immunohistochemistry (IHC)
2.13. Statistical Analysis
3. Results
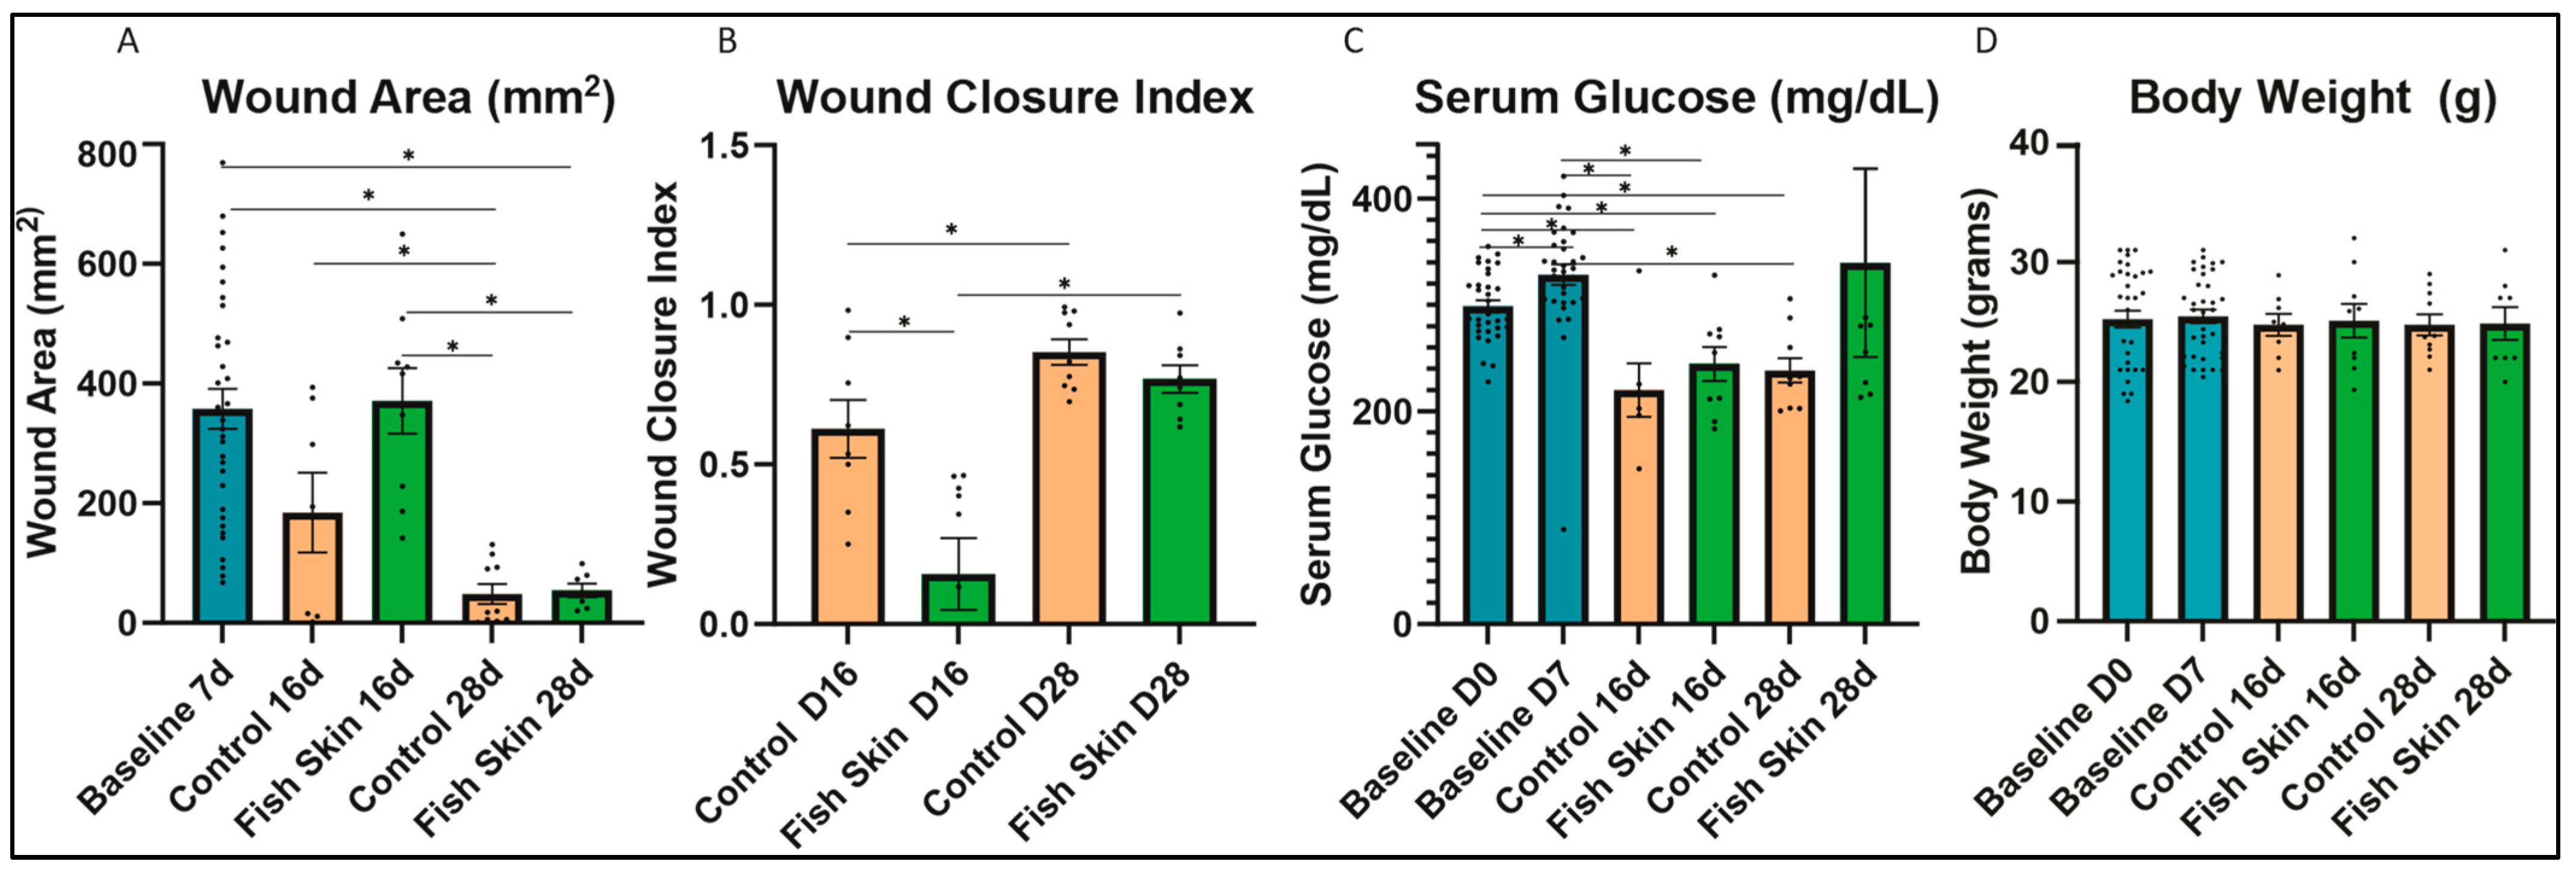
3.1. Wound Size Evaluation and Quantification of Mice Treated with Fish Skin
3.2. Serum Glucose
3.3. Evaluation of Body Weight Changes
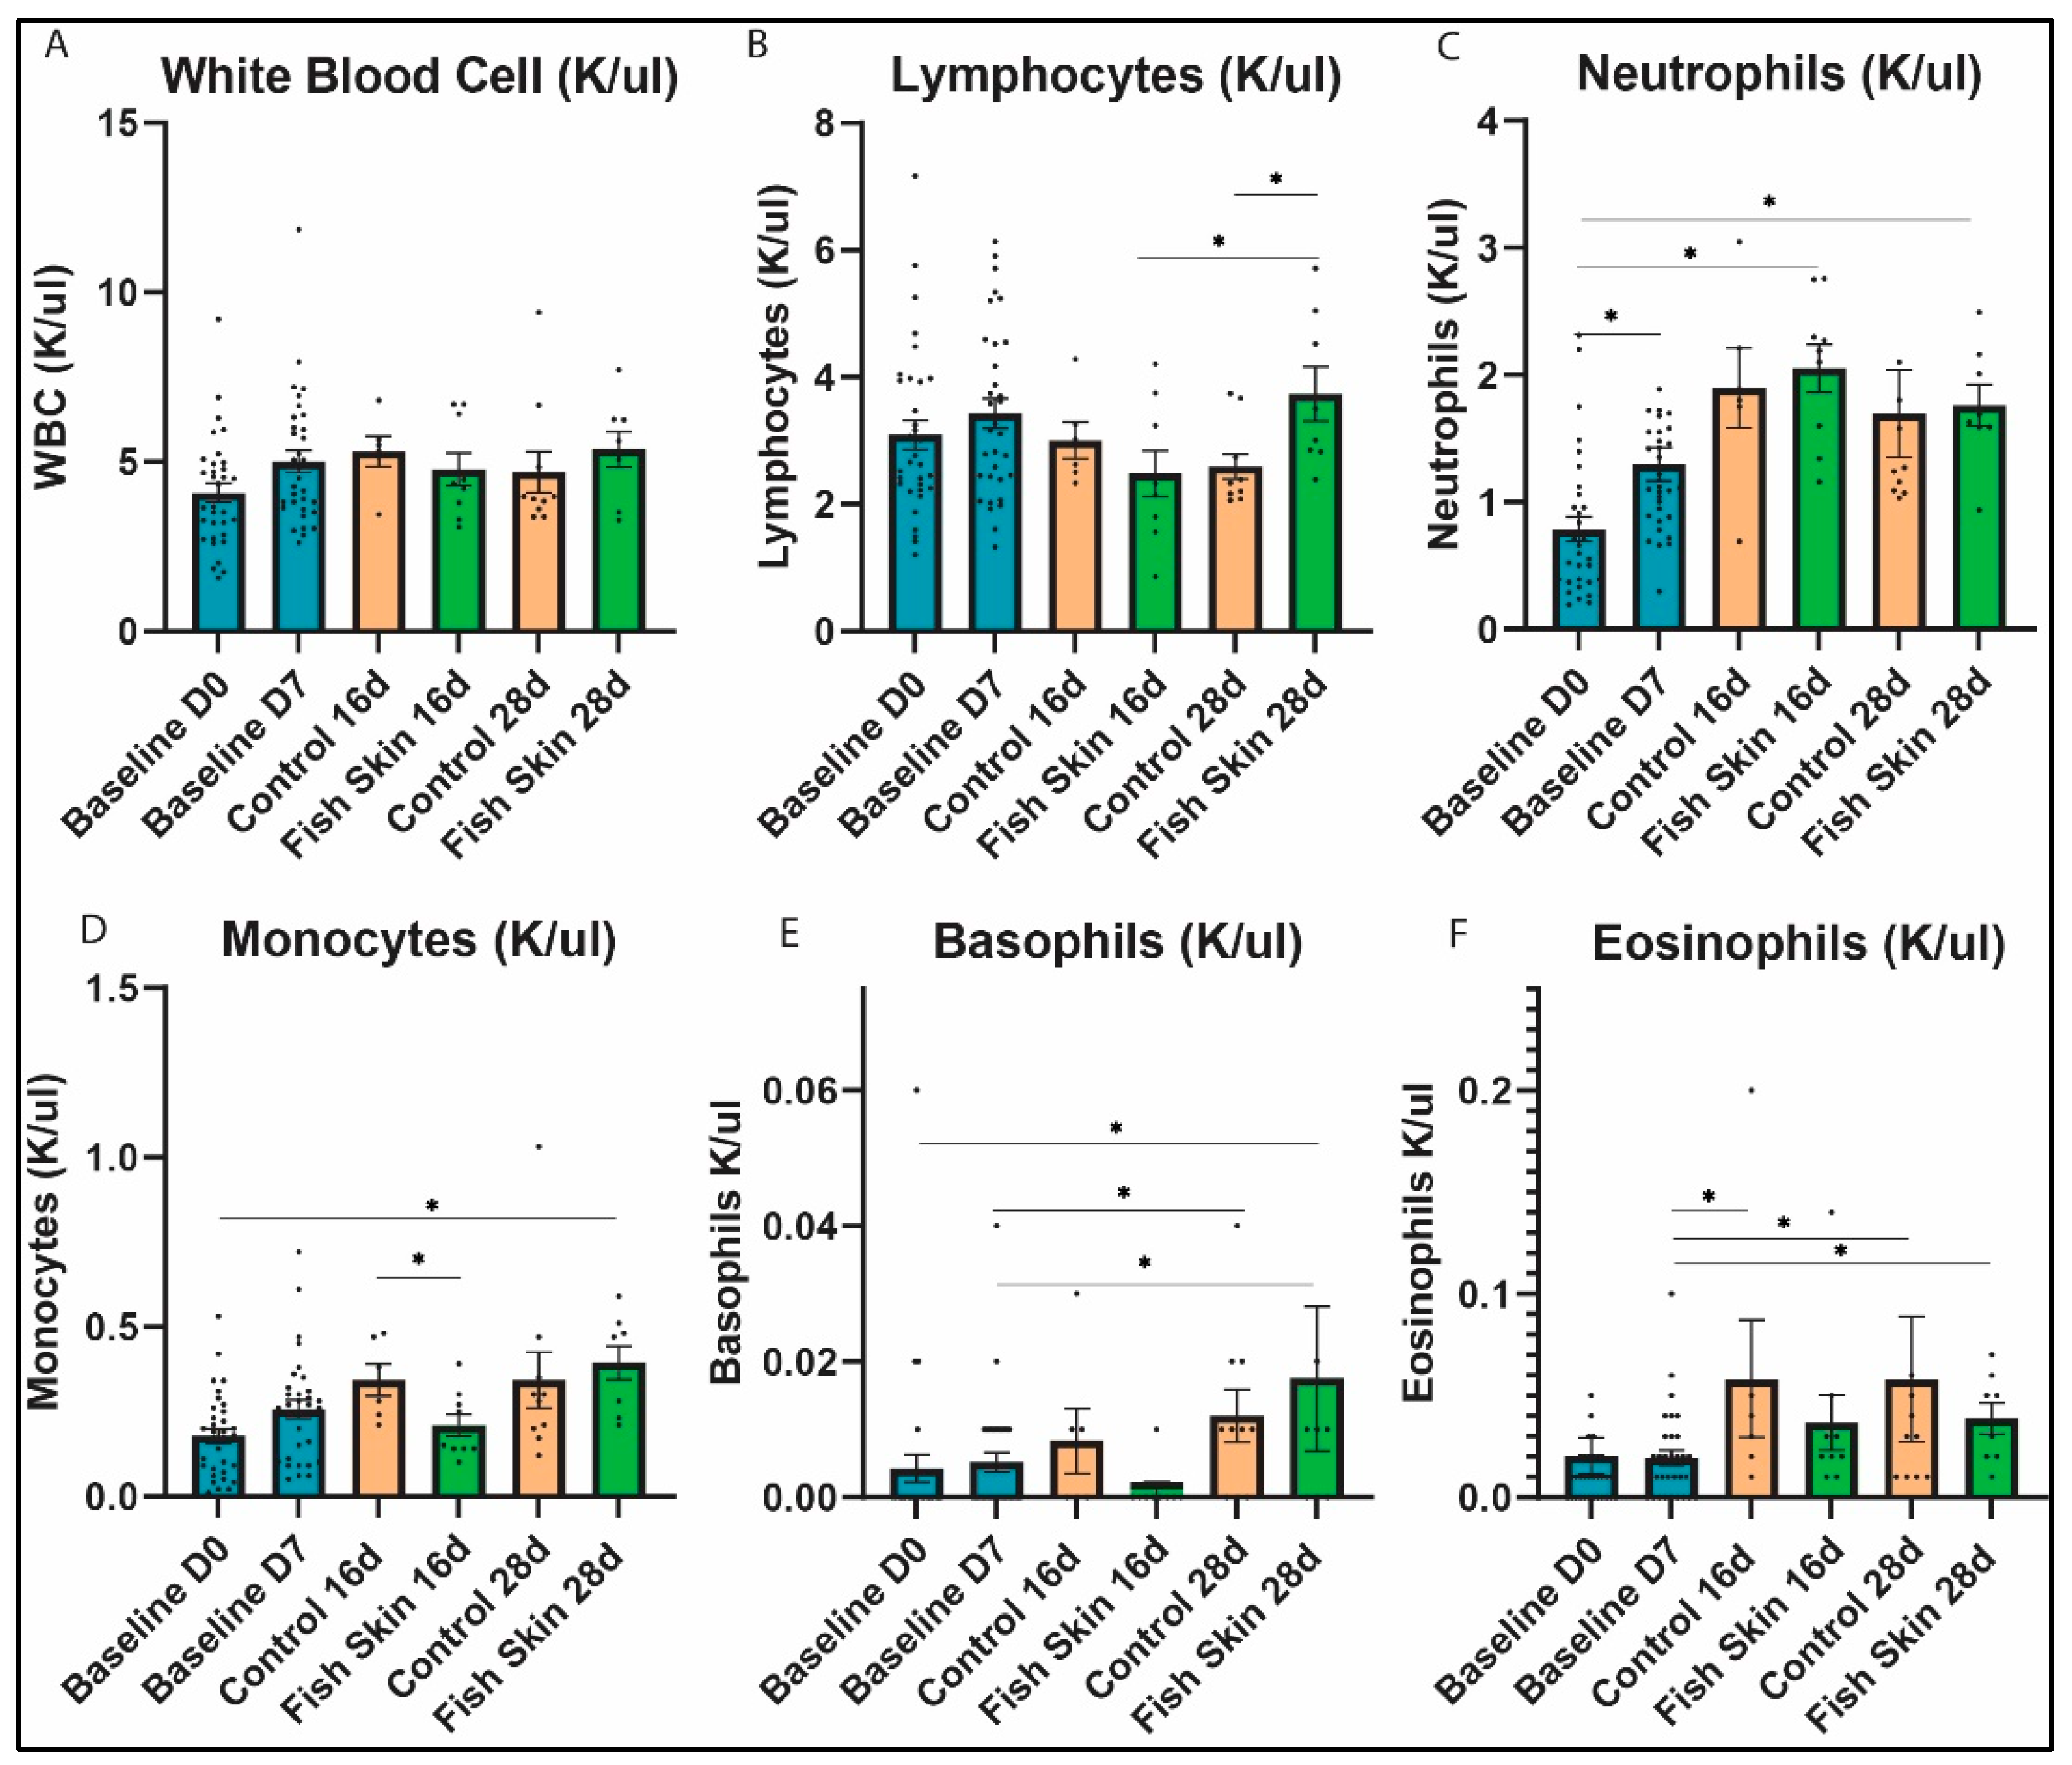
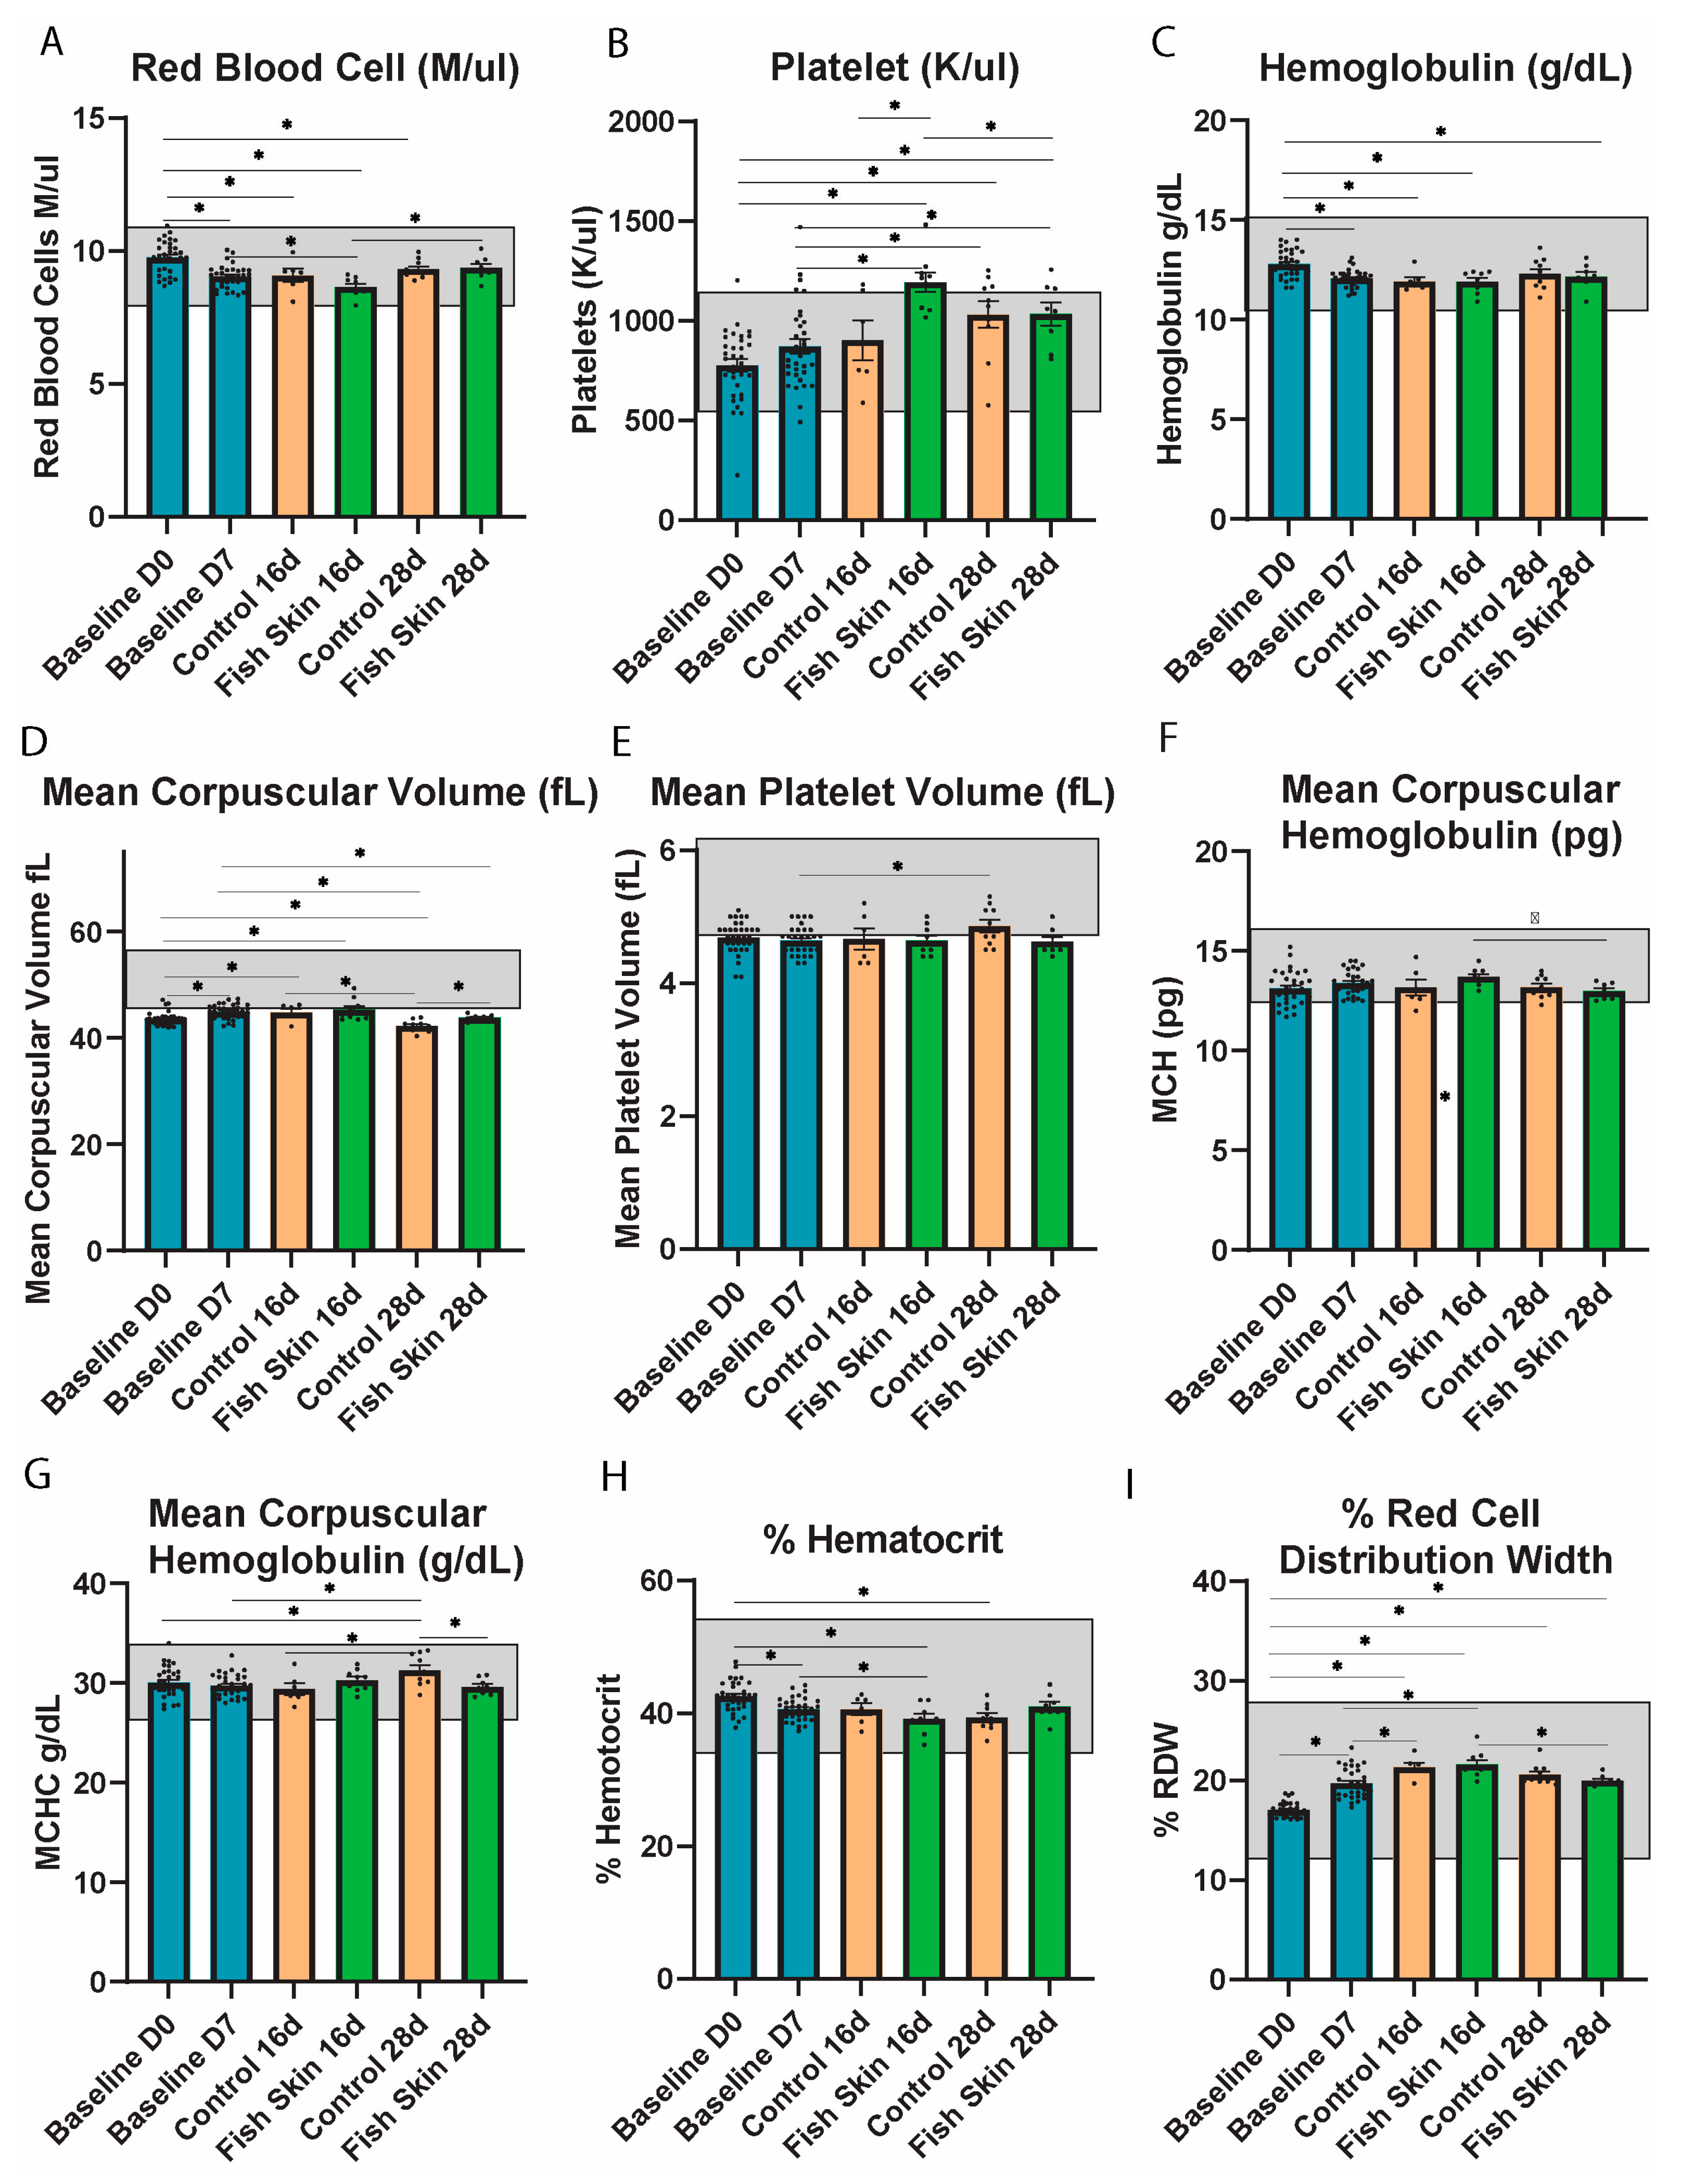
3.4. Complete Blood Count Evaluation
3.4.1. White Blood Cells
3.4.2. Lymphocytes
3.4.3. Neutrophils
3.4.4. Monocytes
3.4.5. Basophils
3.4.6. Eosinophils
3.4.7. Red Blood Cell (RBC) Counts
3.4.8. Platelets
3.4.9. Hemoglobulin
3.4.10. Mean Corpuscular Volume (MCV)
3.4.11. Mean Platelet Volume (MPV)
3.4.12. Mean Corpuscular Hemoglobulin (MCH)
3.4.13. Mean Corpuscular Hemoglobulin Concentration (MCHC)
3.4.14. Percent of Hematocrit
3.4.15. Percent Red Blood Cell Distribution Width (RDW)
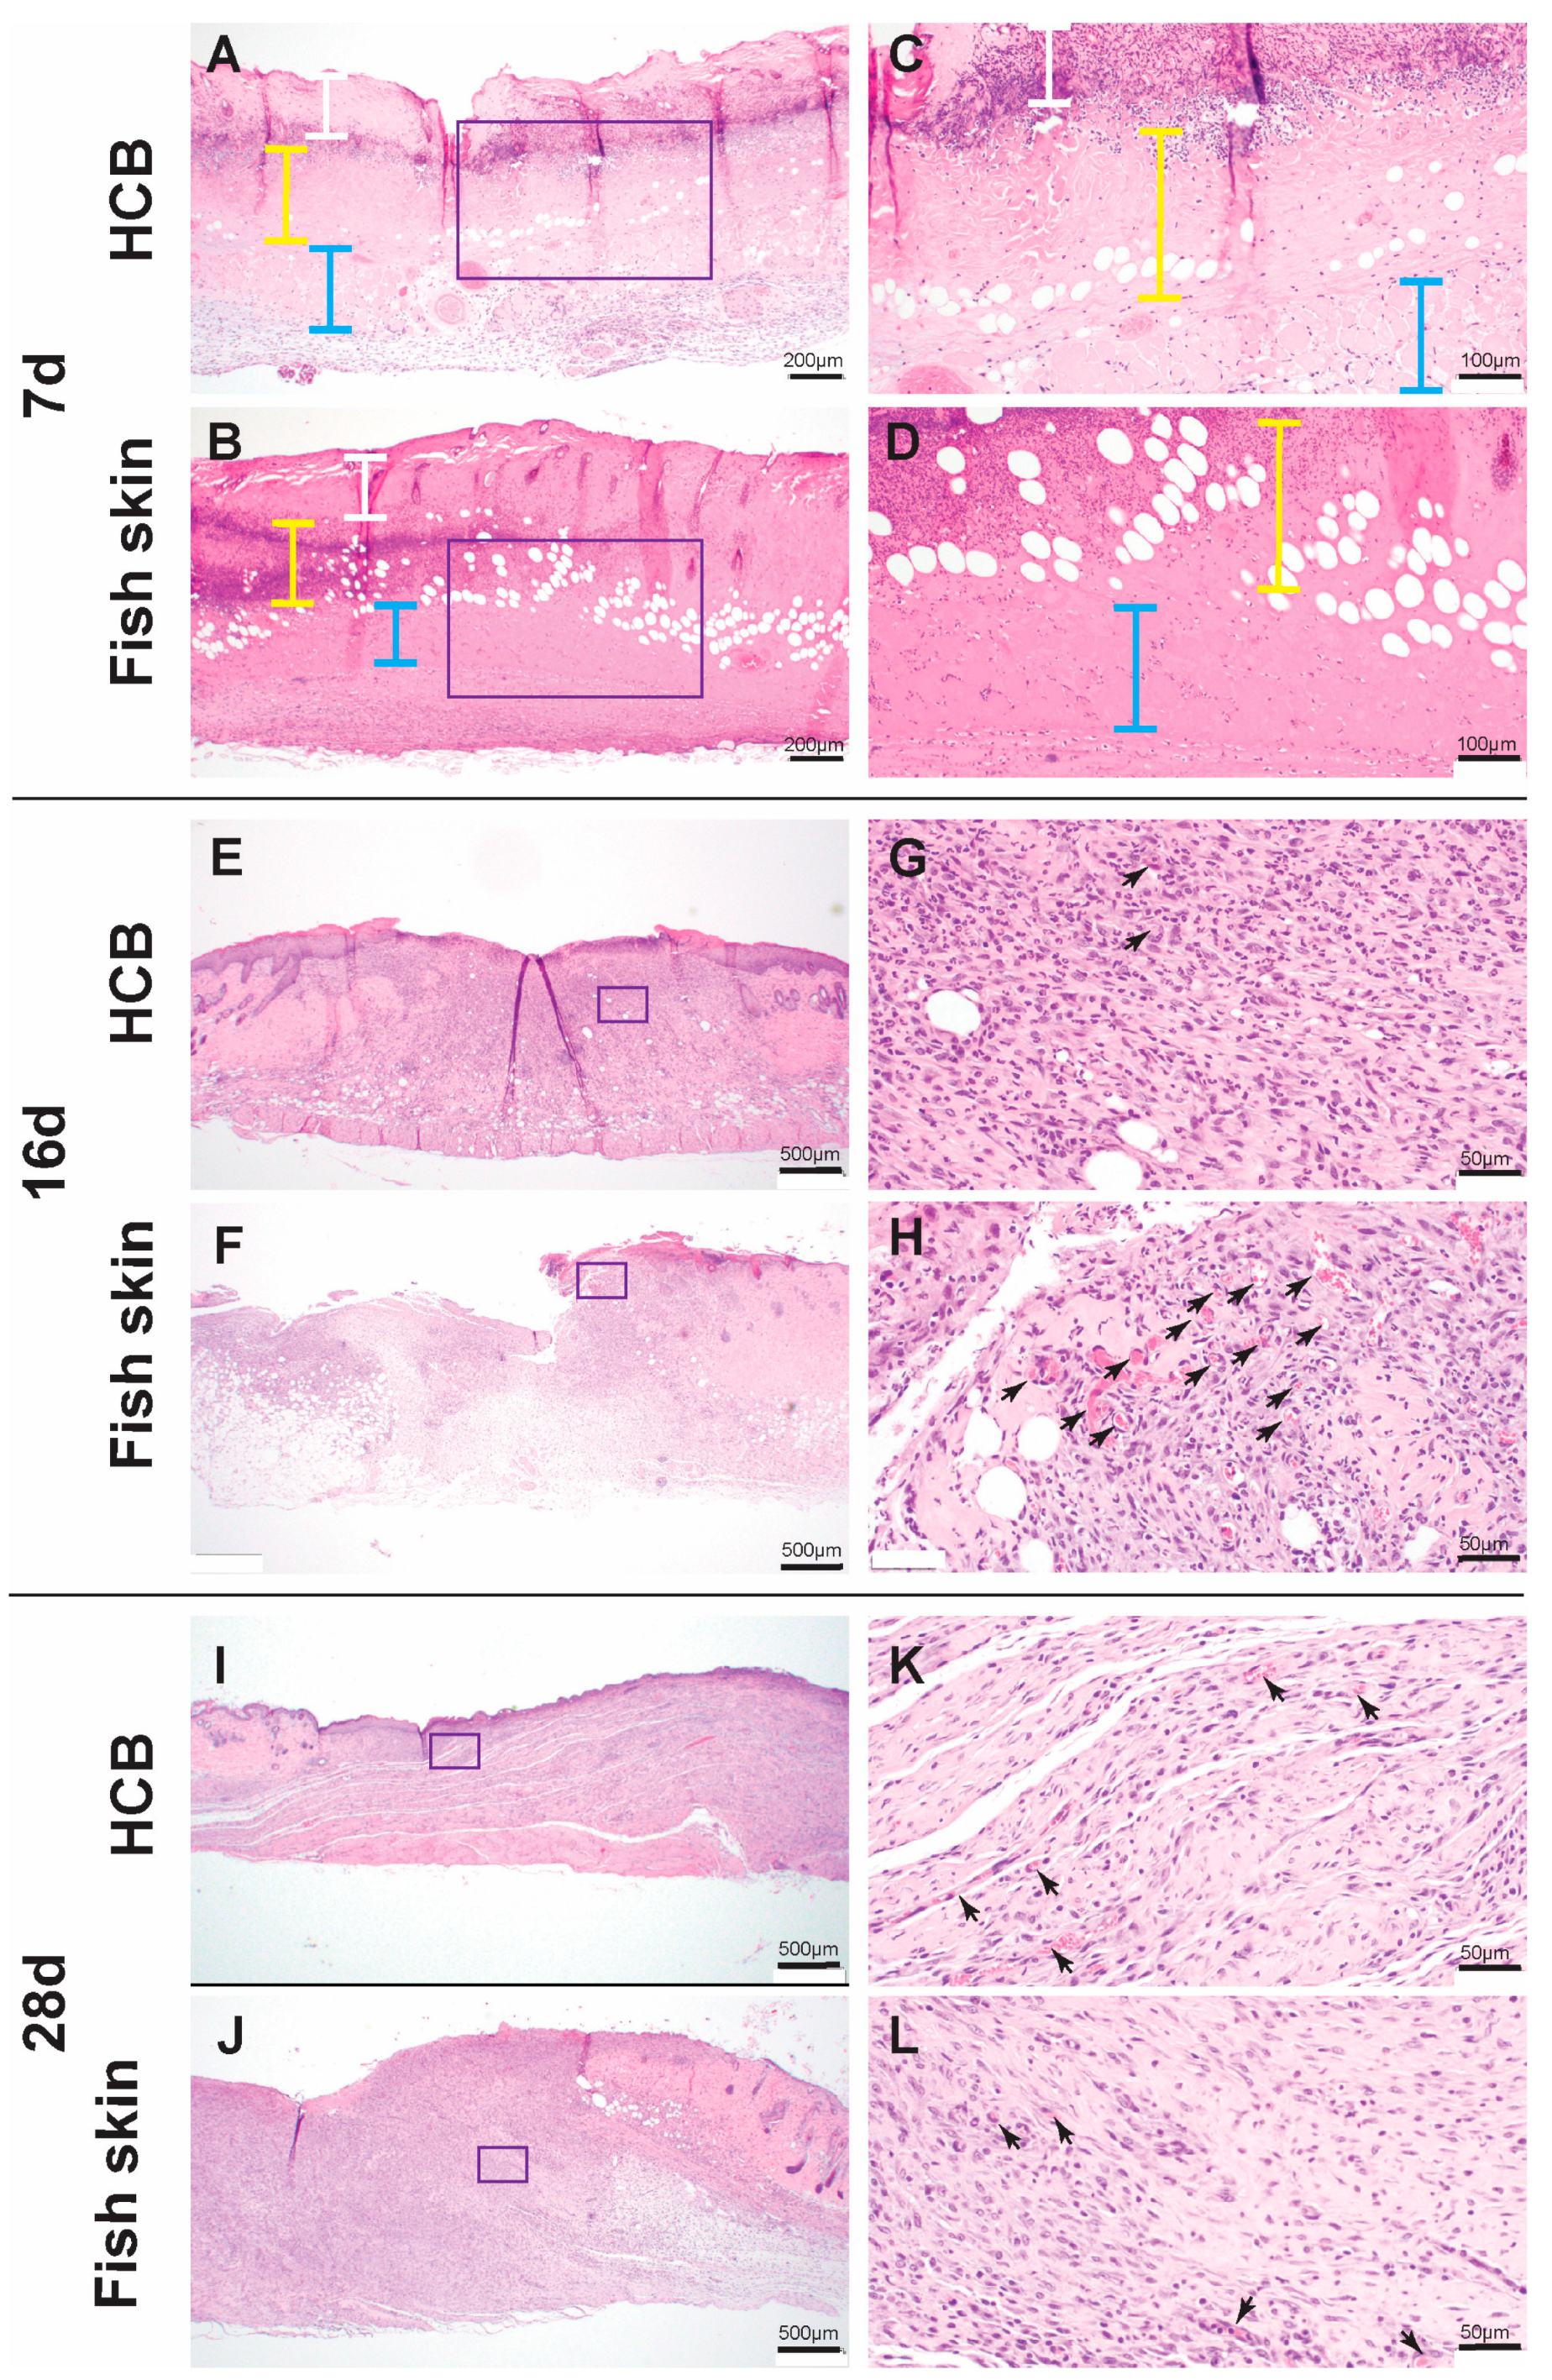
3.5. Histology
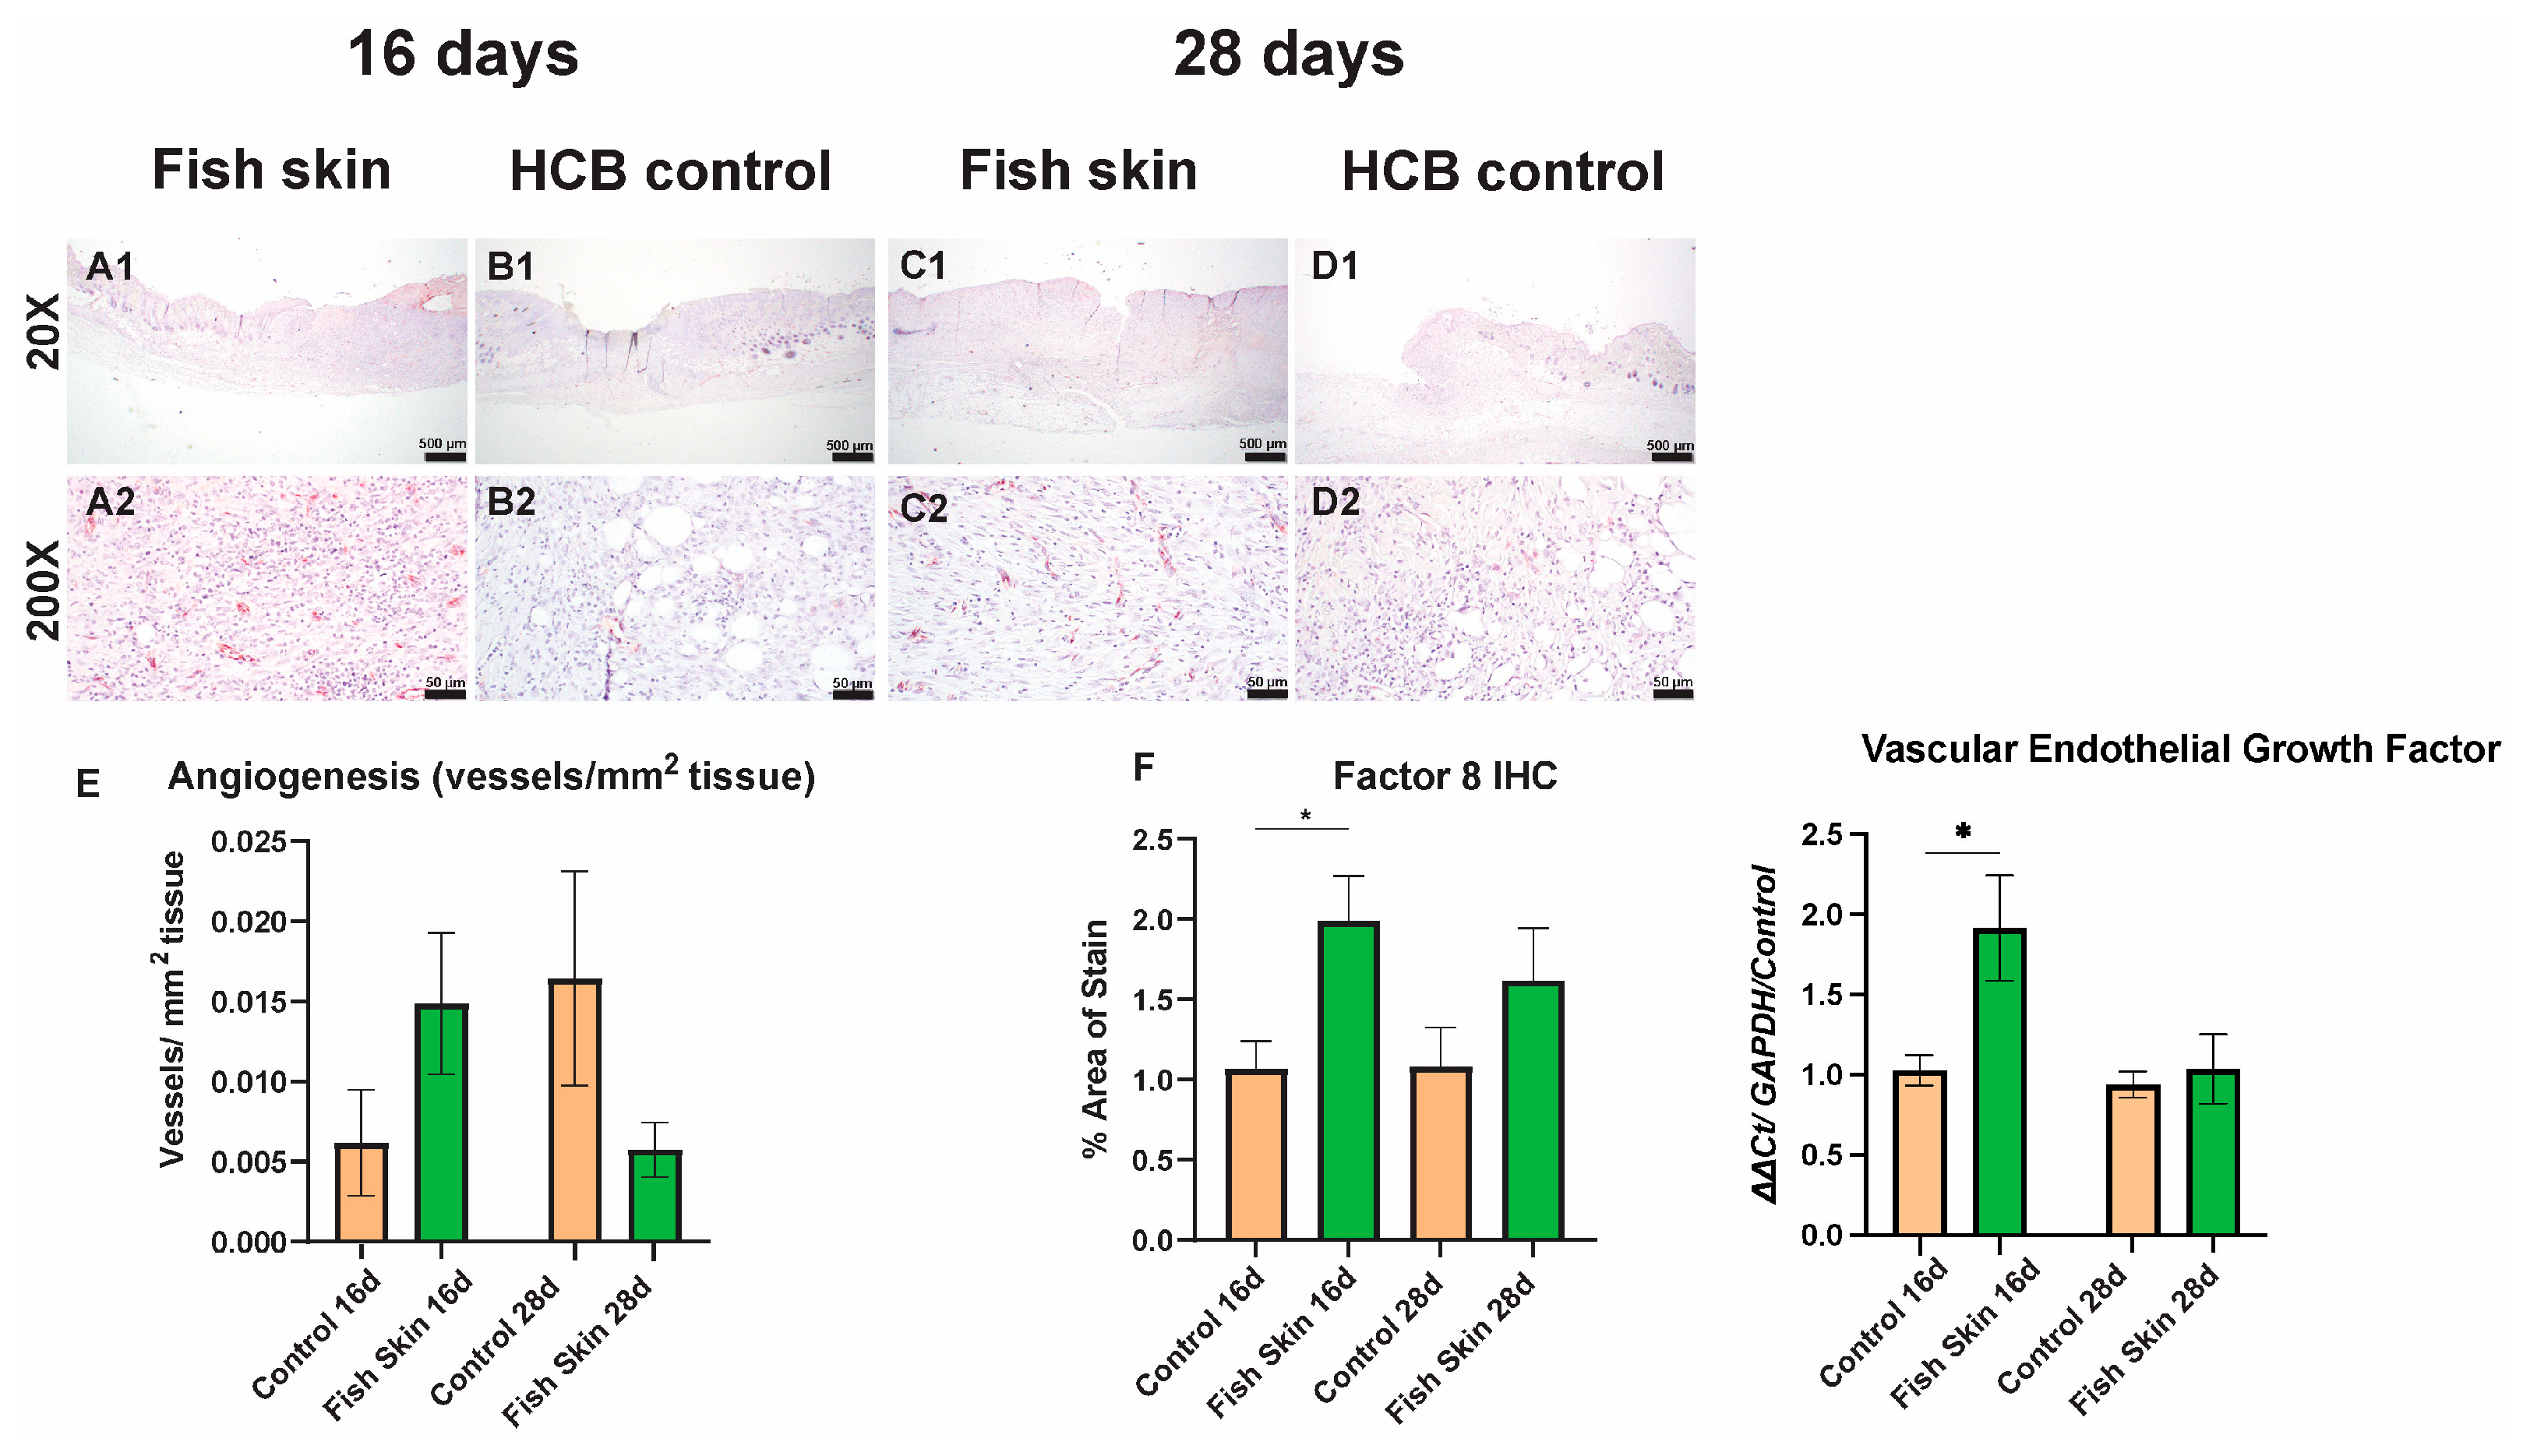
3.6. Immunohistochemistry
3.7. Survival Outcomes
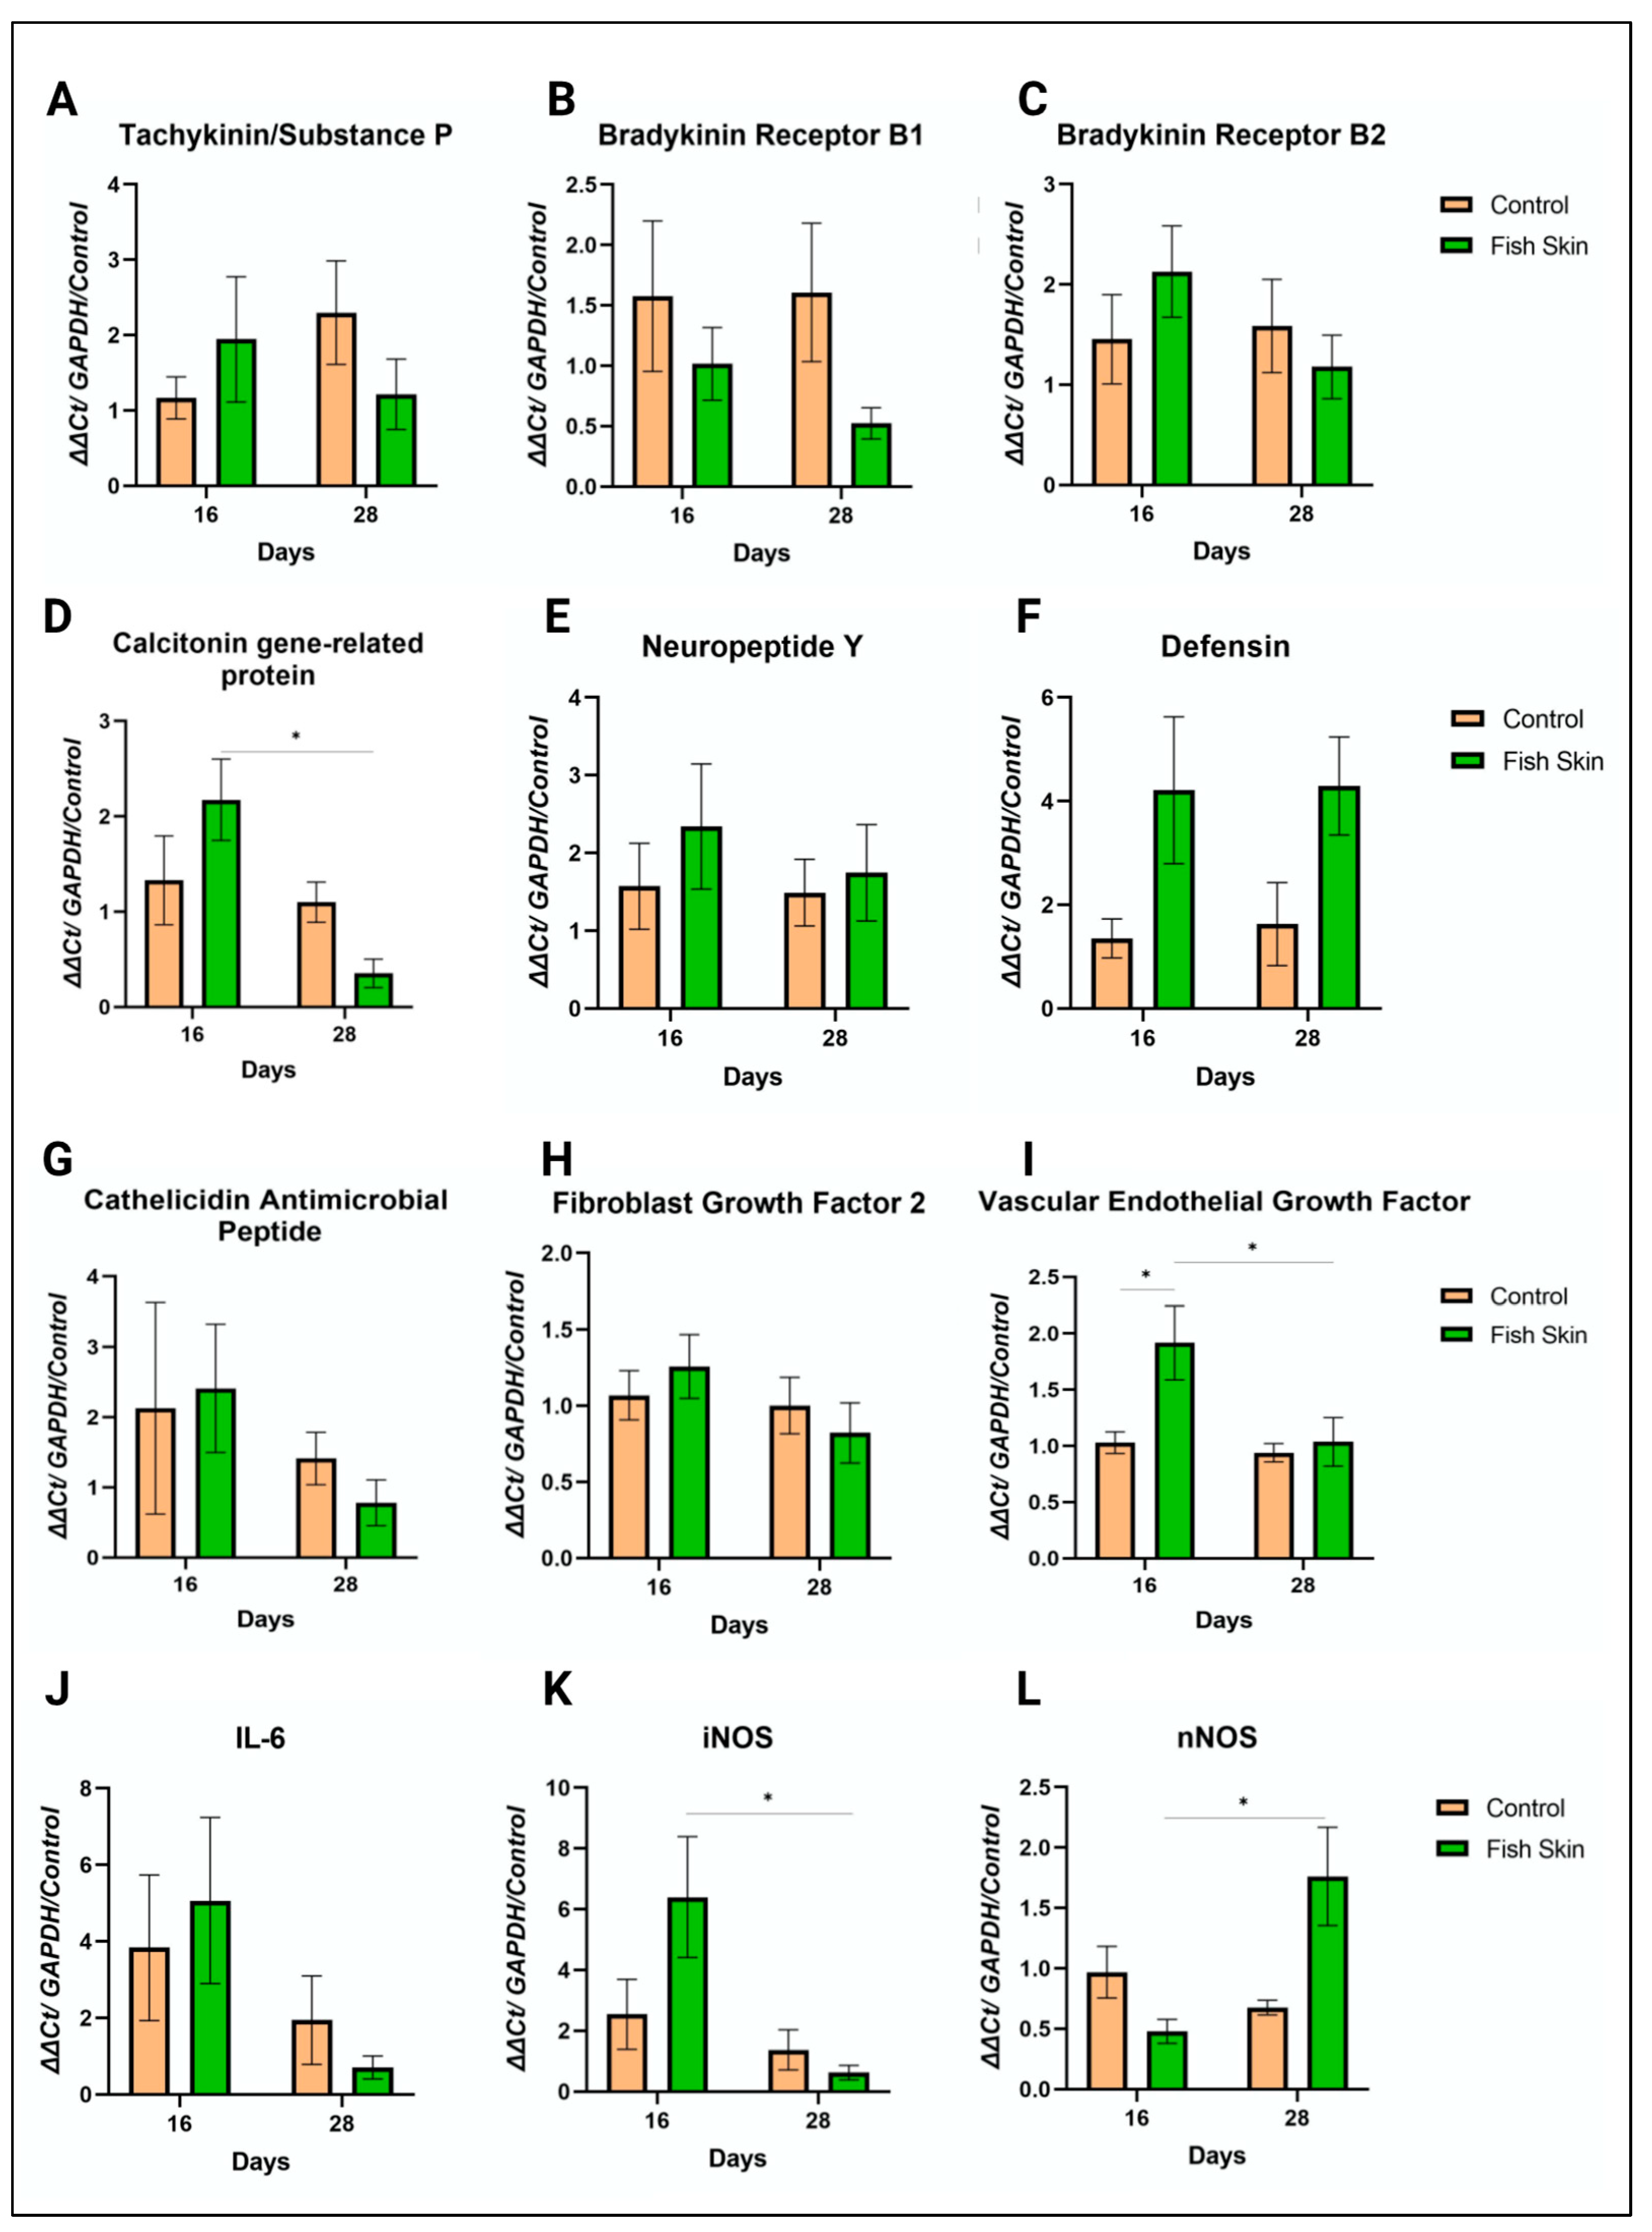
3.8. PCR Results
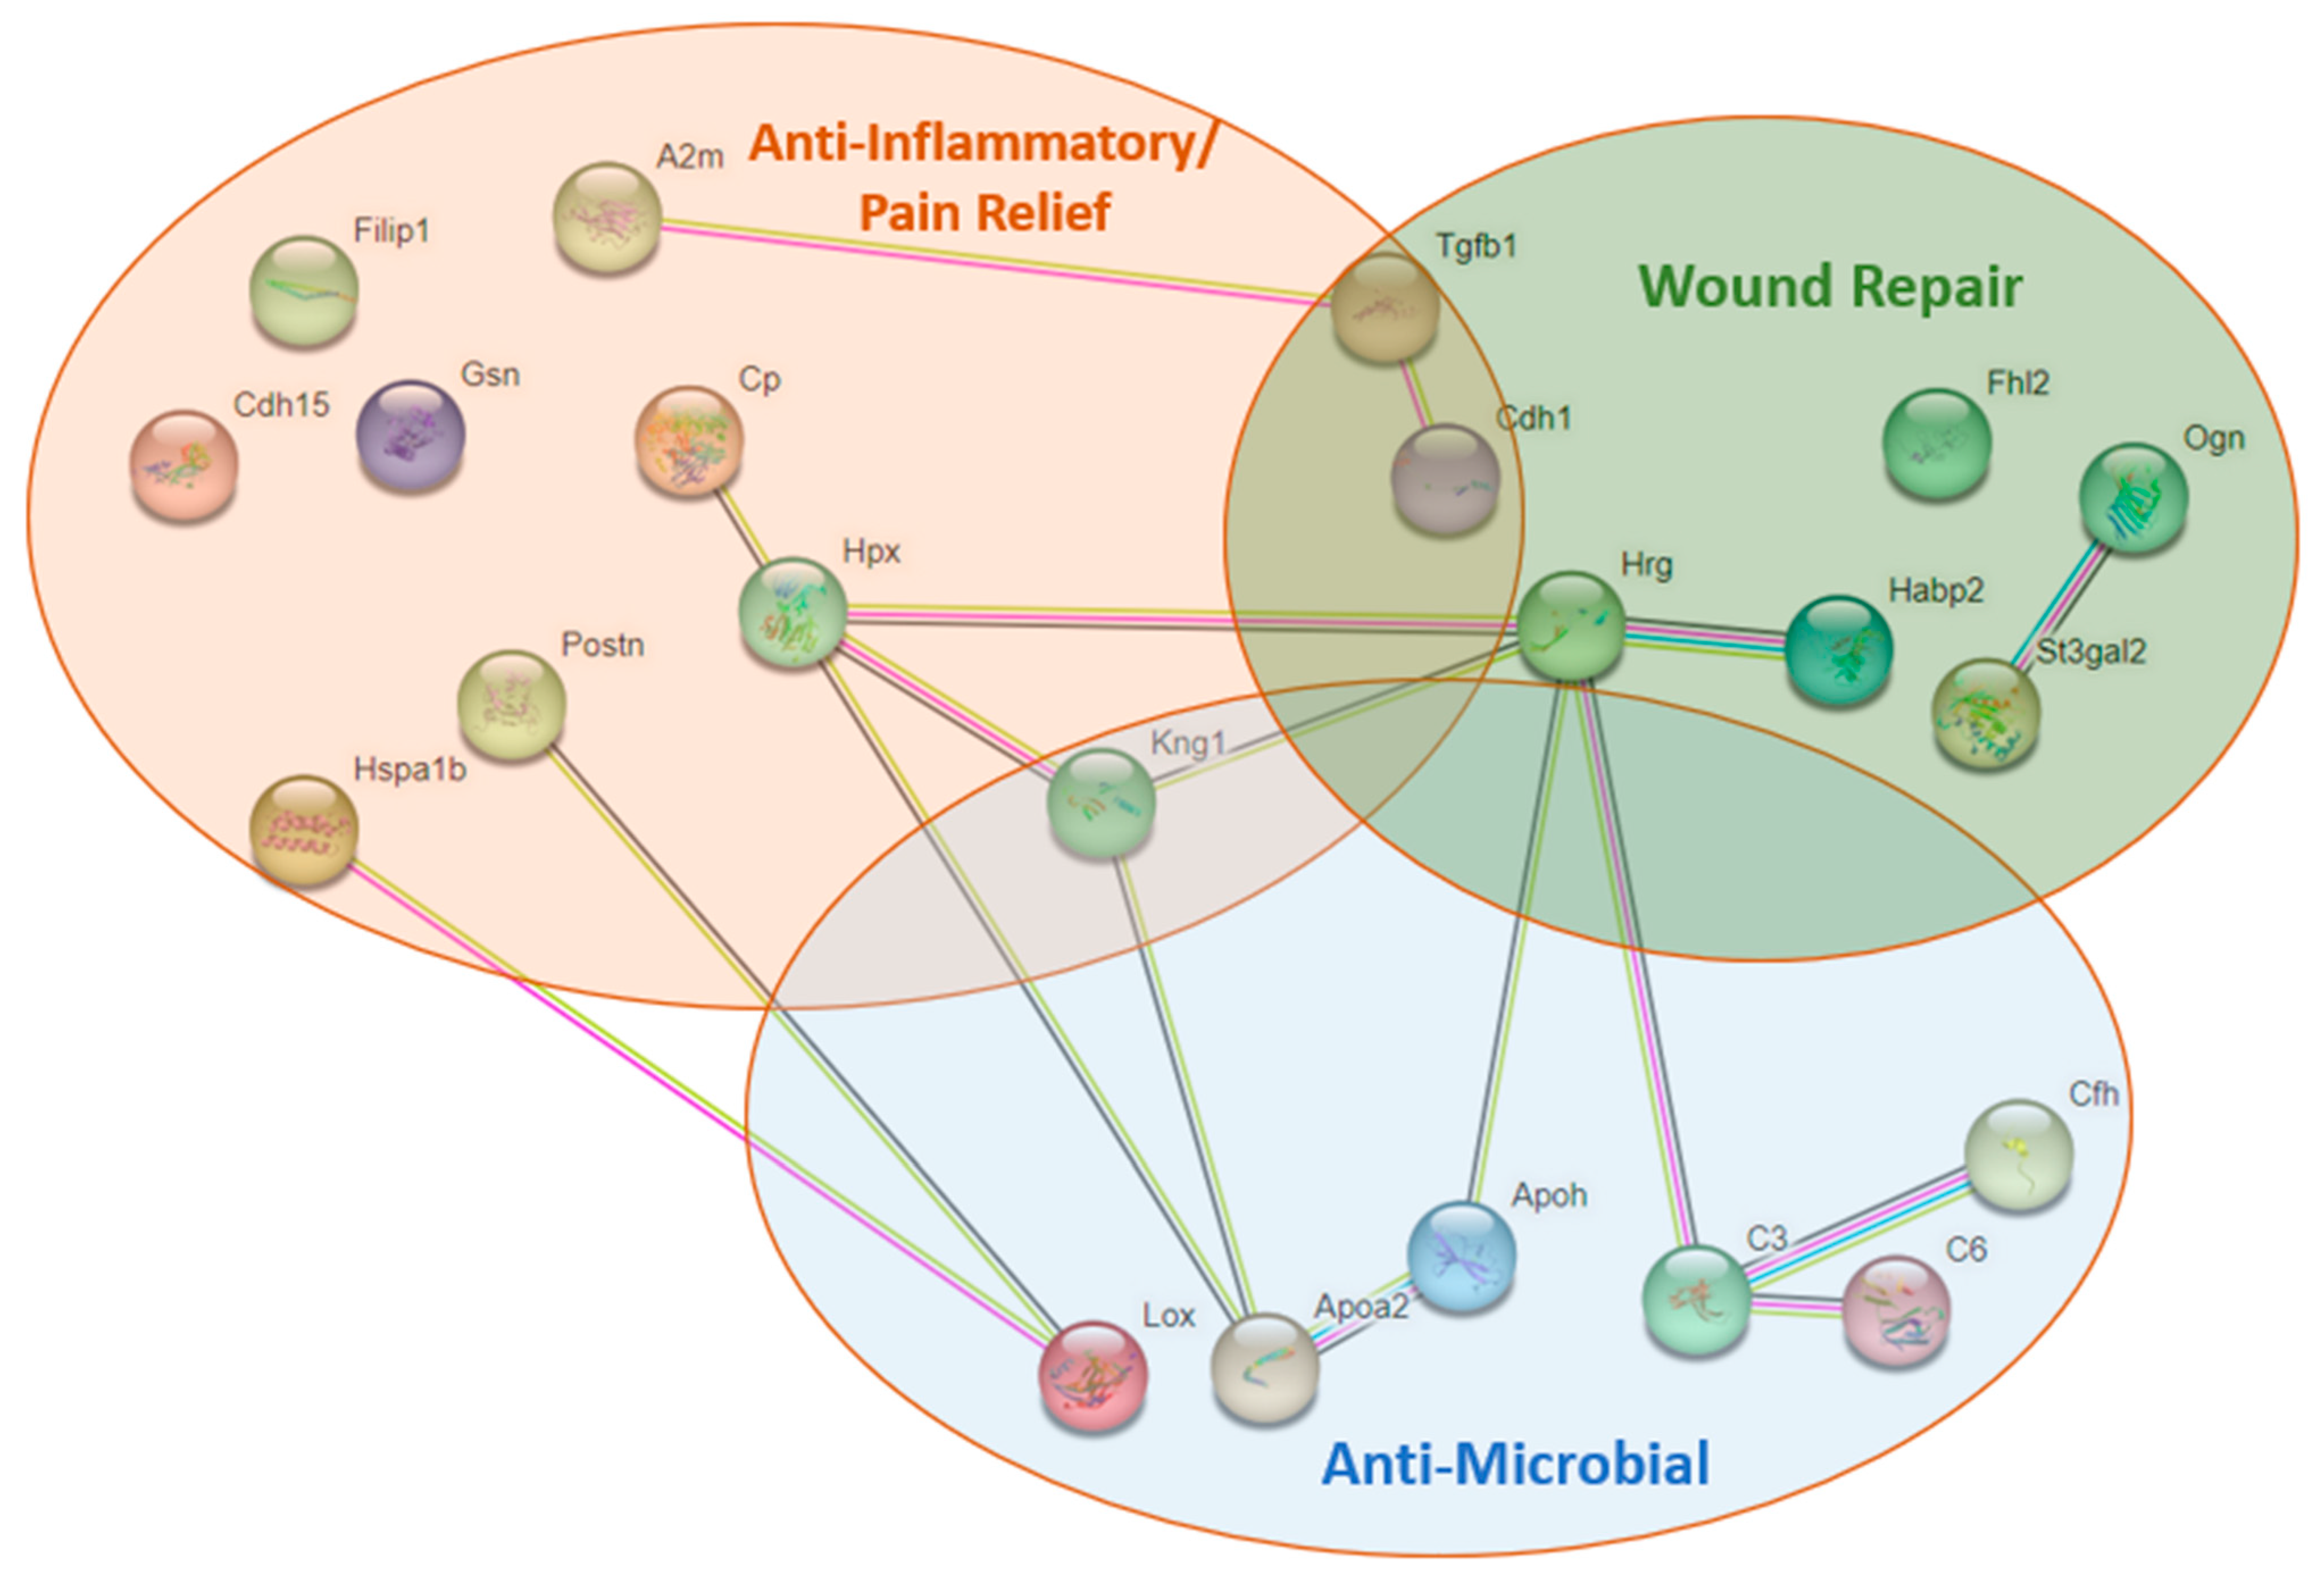
3.9. Proteomics
4. Discussion
Supplementary Materials
Author Contributions
Funding
Institutional Review Board Statement
Informed Consent Statement
Data Availability Statement
Acknowledgments
Conflicts of Interest
References
- Burns. Available online: https://www.who.int/news-room/fact-sheets/detail/burns (accessed on 15 June 2021).
- National Center for Health Statistics. National Hospital Ambulatory Medical Care Survey: 2020 Emergency Department Summary Tables; Center of Disease Control: Atlanta, Georgia, 2020.
- Xu, R.; Yu, P.; Abramson, M.J.; Johnston, F.H.; Samet, J.M.; Bell, M.L.; Haines, A.; Ebi, K.L.; Li, S.; Guo, Y. Wildfires, Global Climate Change, and Human Health. N. Engl. J. Med. 2020, 383, 2173–2181. [Google Scholar] [CrossRef]
- Zuo, K.J.; Medina, A.; Tredget, E.E. Important Developments in Burn Care. Plast. Reconstr. Surg. 2017, 139, 120e–138e. [Google Scholar] [CrossRef] [PubMed]
- Nielson, C.B.; Duethman, N.C.; Howard, J.M.; Moncure, M.; Wood, J.G. Burns: Pathophysiology of Systemic Complications and Current Management. J. Burn. Care Res. 2017, 38, e469–e481. [Google Scholar] [CrossRef]
- Williams, F.N.; Herndon, D.N.; Jeschke, M.G. The hypermetabolic response to burn injury and interventions to modify this response. Clin. Plast Surg. 2009, 36, 583–596. [Google Scholar] [CrossRef] [PubMed]
- Hew, J.J.; Parungao, R.J.; Shi, H.; Tsai, K.H.; Kim, S.; Ma, D.; Malcolm, J.; Li, Z.; Maitz, P.K.; Wang, Y. Mouse models in burns research: Characterisation of the hypermetabolic response to burn injury. Burns 2020, 46, 663–674. [Google Scholar] [CrossRef] [PubMed]
- Ruffolo, R.R., Jr. Spare alpha adrenoceptors in the peripheral circulation: Excitation-contraction coupling. Fed. Proc. 1986, 45, 2341–2346. [Google Scholar] [PubMed]
- Halim, A.S.; Khoo, T.L.; Mohd Yussof, S.J. Biologic and synthetic skin substitutes: An overview. Indian J. Plast. Surg. 2010, 43, S23–S28. [Google Scholar] [CrossRef] [PubMed]
- Lima Júnior, E.M.; De Moraes Filho, M.O.; Costa, B.A.; Rohleder, A.V.P.; Sales Rocha, M.B.; Fechine, F.V.; Forte, A.J.; Alves, A.; Silva Júnior, F.R.; Martins, C.B.; et al. Innovative Burn Treatment Using Tilapia Skin as a Xenograft: A Phase II Randomized Controlled Trial. J. Burn Care Res. 2020, 41, 585–592. [Google Scholar] [CrossRef]
- Hu, Z.; Yang, P.; Zhou, C.; Li, S.; Hong, P. Marine Collagen Peptides from the Skin of Nile Tilapia (Oreochromis niloticus): Characterization and Wound Healing Evaluation. Mar. Drugs 2017, 15, 102. [Google Scholar] [CrossRef]
- Medina, J.L.; Fourcaudot, A.B.; Sebastian, E.A.; Shankar, R.; Brown, A.W.; Leung, K.P. Standardization of deep partial-thickness scald burns in C57BL/6 mice. Int. J. Burn. Trauma 2018, 8, 26–33. [Google Scholar]
- Peyton, J. Fish Skin Biologic Bandage. US11612675B1, 28 March 2023. [Google Scholar]
- Kin, N.W.; Chen, Y.; Stefanov, E.K.; Gallo, R.L.; Kearney, J.F. Cathelin-related antimicrobial peptide differentially regulates T- and B-cell function. Eur. J. Immunol. 2011, 41, 3006–3016. [Google Scholar] [CrossRef] [PubMed]
- Chong, K.T.; Thangavel, R.R.; Tang, X. Enhanced expression of murine beta-defensins (MBD-1, -2,- 3, and -4) in upper and lower airway mucosa of influenza virus infected mice. Virology 2008, 380, 136–143. [Google Scholar] [CrossRef]
- Pinto, F.M.; Pintado, C.O.; Pennefather, J.N.; Patak, E.; Candenas, L. Ovarian steroids regulate tachykinin and tachykinin receptor gene expression in the mouse uterus. Reprod. Biol. Endocrinol. 2009, 7, 77. [Google Scholar] [CrossRef] [PubMed]
- Duchene, J.; Lecomte, F.; Ahmed, S.; Cayla, C.; Pesquero, J.; Bader, M.; Perretti, M.; Ahluwalia, A. A novel inflammatory pathway involved in leukocyte recruitment: Role for the kinin B1 receptor and the chemokine CXCL5. J. Immunol. 2007, 179, 4849–4856. [Google Scholar] [CrossRef]
- Shariat-Madar, Z.; Mahdi, F.; Warnock, M.; Homeister, J.W.; Srikanth, S.; Krijanovski, Y.; Murphey, L.J.; Jaffa, A.A.; Schmaier, A.H. Bradykinin B2 receptor knockout mice are protected from thrombosis by increased nitric oxide and prostacyclin. Blood 2006, 108, 192–199. [Google Scholar] [CrossRef] [PubMed]
- Yin, M.; Li, C.; Peng, X.D.; Zhao, G.Q.; Wu, Y.; Zheng, H.R.; Wang, Q.; Xu, Q.; Jiang, N. Expression and role of calcitonin gene-related peptide in mouse Aspergillus fumigatus keratitis. Int. J. Ophthalmol. 2019, 12, 697–704. [Google Scholar] [CrossRef] [PubMed]
- Du, M.; Butchi, N.B.; Woods, T.; Morgan, T.W.; Peterson, K.E. Neuropeptide Y has a protective role during murine retrovirus-induced neurological disease. J. Virol. 2010, 84, 11076–11088. [Google Scholar] [CrossRef]
- Fang, T.D.; Nacamuli, R.P.; Song, H.M.; Fong, K.D.; Warren, S.M.; Salim, A.; Carano, R.A.; Filvaroff, E.H.; Longaker, M.T. Creation and characterization of a mouse model of mandibular distraction osteogenesis. Bone 2004, 34, 1004–1012. [Google Scholar] [CrossRef]
- Benczik, M.; Gaffen, S.L. The interleukin (IL)-2 family cytokines: Survival and proliferation signaling pathways in T lymphocytes. Immunol. Investig. 2004, 33, 109–142. [Google Scholar] [CrossRef]
- Kultz, D.; Li, J.; Gardell, A.; Sacchi, R. Quantitative molecular phenotyping of gill remodeling in a cichlid fish responding to salinity stress. Mol. Cell. Proteom. MCP 2013, 12, 3962–3975. [Google Scholar] [CrossRef]
- Li, J.; Levitan, B.; Gomez-Jimenez, S.; Kultz, D. Development of a Gill Assay Library for Ecological Proteomics of Threespine Sticklebacks (Gasterosteus aculeatus). Mol. Cell. Proteom. MCP 2018, 17, 2146–2163. [Google Scholar] [CrossRef] [PubMed]
- Root, L.; Campo, A.; MacNiven, L.; Con, P.; Cnaani, A.; Kultz, D. A data-independent acquisition (DIA) assay library for quantitation of environmental effects on the kidney proteome of Oreochromis niloticus. Mol. Ecol. Resour. 2021, 21, 2486–2503. [Google Scholar] [CrossRef]
- Graefe, S.B.; Mohiuddin, S.S. Biochemistry, Substance P. In StatPearls Copyright © 2022; StatPearls Publishing LLC.: Treasure Island, FL, USA, 2022. [Google Scholar]
- Perkins, M.N.; Kelly, D. Induction of bradykinin B1 receptors in vivo in a model of ultra-violet irradiation-induced thermal hyperalgesia in the rat. Br. J. Pharmacol. 1993, 110, 1441–1444. [Google Scholar] [CrossRef] [PubMed]
- Koumbadinga, G.A.; Désormeaux, A.; Adam, A.; Marceau, F. Effect of interferon-γ on inflammatory cytokine-induced bradykinin B1 receptor expression in human vascular cells. Eur. J. Pharmacol. 2010, 647, 117–125. [Google Scholar] [CrossRef]
- Hall, J.M. Bradykinin receptors. Gen. Pharmacol. 1997, 28, 1–6. [Google Scholar] [CrossRef]
- McCulloch, J.; Uddman, R.; Kingman, T.A.; Edvinsson, L. Calcitonin gene-related peptide: Functional role in cerebrovascular regulation. Proc. Natl. Acad. Sci. USA 1986, 83, 5731–5735. [Google Scholar] [CrossRef]
- Brain, S.D.; Williams, T.J.; Tippins, J.R.; Morris, H.R.; MacIntyre, I. Calcitonin gene-related peptide is a potent vasodilator. Nature 1985, 313, 54–56. [Google Scholar] [CrossRef] [PubMed]
- Chromek, M.; Slamová, Z.; Bergman, P.; Kovács, L.; Podracká, L.; Ehrén, I.; Hökfelt, T.; Gudmundsson, G.H.; Gallo, R.L.; Agerberth, B.; et al. The antimicrobial peptide cathelicidin protects the urinary tract against invasive bacterial infection. Nat. Med. 2006, 12, 636–641. [Google Scholar] [CrossRef]
- Chen, M.; Bao, L.; Zhao, M.; Cao, J.; Zheng, H. Progress in Research on the Role of FGF in the Formation and Treatment of Corneal Neovascularization. Front. Pharmacol. 2020, 11, 111. [Google Scholar] [CrossRef]
- Yun, Y.R.; Won, J.E.; Jeon, E.; Lee, S.; Kang, W.; Jo, H.; Jang, J.H.; Shin, U.S.; Kim, H.W. Fibroblast growth factors: Biology, function, and application for tissue regeneration. J. Tissue Eng. 2010, 2010, 218142. [Google Scholar] [CrossRef]
- Ibrahim, A.; Soliman, M.; Kotb, S.; Ali, M.M. Evaluation of fish skin as a biological dressing for metacarpal wounds in donkeys. BMC Vet. Res. 2020, 16, 472. [Google Scholar] [CrossRef] [PubMed]
- Hartwell, S.W. surgical wounds in human beings: A histologic study of healing with practical applications: I. Epithelial healing. Arch. Surg. 1929, 19, 835–847. [Google Scholar] [CrossRef]
- Wang, X.; Ge, J.; Tredget, E.E.; Wu, Y. The mouse excisional wound splinting model, including applications for stem cell transplantation. Nat. Protoc. 2013, 8, 302–309. [Google Scholar] [CrossRef] [PubMed]
- Dunn, L.; Prosser, H.C.; Tan, J.T.; Vanags, L.Z.; Ng, M.K.; Bursill, C.A. Murine model of wound healing. J. Vis. Exp. 2013, 75, e50265. [Google Scholar] [CrossRef]
- Naldaiz-Gastesi, N.; Bahri, O.A.; López de Munain, A.; McCullagh, K.J.A.; Izeta, A. The panniculus carnosus muscle: An evolutionary enigma at the intersection of distinct research fields. J. Anat. 2018, 233, 275–288. [Google Scholar] [CrossRef] [PubMed]
- Seswandhana, R.; Anzhari, S.; Ghozali, A.; Dachlan, I.; Wirohadidjojo, Y.W.; Aryandono, T. A Modified Method To Create A Porcine Deep Dermal Burn Model. Ann. Burn. Fire Disasters 2021, 34, 187–191. [Google Scholar]
- Jeschke, M.G.; Mlcak, R.P.; Finnerty, C.C.; Norbury, W.B.; Gauglitz, G.G.; Kulp, G.A.; Herndon, D.N. Burn size determines the inflammatory and hypermetabolic response. Crit. Care 2007, 11, R90. [Google Scholar] [CrossRef]
- Jeschke, M.G.; Gauglitz, G.G.; Kulp, G.A.; Finnerty, C.C.; Williams, F.N.; Kraft, R.; Suman, O.E.; Mlcak, R.P.; Herndon, D.N. Long-term persistance of the pathophysiologic response to severe burn injury. PLoS ONE 2011, 6, e21245. [Google Scholar] [CrossRef]
- Jeschke, M.G.; Chinkes, D.L.; Finnerty, C.C.; Kulp, G.; Suman, O.E.; Norbury, W.B.; Branski, L.K.; Gauglitz, G.G.; Mlcak, R.P.; Herndon, D.N. Pathophysiologic response to severe burn injury. Ann. Surg. 2008, 248, 387–401. [Google Scholar] [CrossRef]
- Laggner, M.; Lingitz, M.T.; Copic, D.; Direder, M.; Klas, K.; Bormann, D.; Gugerell, A.; Moser, B.; Radtke, C.; Hacker, S.; et al. Severity of thermal burn injury is associated with systemic neutrophil activation. Sci. Rep. 2022, 12, 1654. [Google Scholar] [CrossRef]
- Mulder, P.P.G.; Vlig, M.; Boekema, B.; Stoop, M.M.; Pijpe, A.; van Zuijlen, P.P.M.; de Jong, E.; van Cranenbroek, B.; Joosten, I.; Koenen, H.; et al. Persistent Systemic Inflammation in Patients With Severe Burn Injury Is Accompanied by Influx of Immature Neutrophils and Shifts in T Cell Subsets and Cytokine Profiles. Front. Immunol. 2020, 11, 621222. [Google Scholar] [CrossRef] [PubMed]
- Kawasaki, T.; Nakamura, K.; Jeschke, M.G.; Kogiso, M.; Kobayashi, M.; Herndon, D.N.; Suzuki, F. Impaired ability of burn patient neutrophils to stimulate β-defensin production by keratinocytes. Immunol. Cell. Biol. 2012, 90, 796–801. [Google Scholar] [CrossRef]
- Italiani, P.; Boraschi, D. From Monocytes to M1/M2 Macrophages: Phenotypical vs. Functional Differentiation. Front. Immunol. 2014, 5, 514. [Google Scholar] [CrossRef] [PubMed]
- Panaro, M.A.; Brandonisio, O.; Acquafredda, A.; Sisto, M.; Mitolo, V. Evidences for iNOS expression and nitric oxide production in the human macrophages. Curr. Drug Targets Immune Endocr. Metabol. Disord. 2003, 3, 210–221. [Google Scholar] [CrossRef] [PubMed]
- Bogdan, C. Regulation of lymphocytes by nitric oxide. Methods Mol. Biol. 2011, 677, 375–393. [Google Scholar] [CrossRef]
- Guo, Y.; You, Y.; Lv, D.; Yan, J.; Shang, F.F.; Wang, X.; Zhang, C.; Fan, Q.; Luo, S. Inducible nitric oxide synthase contributes to insulin resistance and cardiac dysfunction after burn injury in mice. Life Sci. 2019, 239, 116912. [Google Scholar] [CrossRef]
- Latimer, K.S. Duncan and Prasse's Veterinary Laboratory Medicine: Clinical Pathology; Wiley: Hoboken, NJ, USA, 2011. [Google Scholar]
- Hettiaratchy, S.; Dziewulski, P. ABC of burns: Pathophysiology and types of burns. BMJ 2004, 328, 1427–1429. [Google Scholar] [CrossRef] [PubMed]
- Tan, J.Q.; Zhang, H.H.; Lei, Z.J.; Ren, P.; Deng, C.; Li, X.Y.; Chen, S.Z. The roles of autophagy and apoptosis in burn wound progression in rats. Burns 2013, 39, 1551–1556. [Google Scholar] [CrossRef]
- Poindexter, B.J.; Bhat, S.; Buja, L.M.; Bick, R.J.; Milner, S.M. Localization of antimicrobial peptides in normal and burned skin. Burns 2006, 32, 402–407. [Google Scholar] [CrossRef]
- Kolar, S.S.; Baidouri, H.; Hanlon, S.; McDermott, A.M. Protective role of murine β-defensins 3 and 4 and cathelin-related antimicrobial peptide in Fusarium solani keratitis. Infect. Immun. 2013, 81, 2669–2677. [Google Scholar] [CrossRef]
- Wixler, V. The role of FHL2 in wound healing and inflammation. Faseb. J. 2019, 33, 7799–7809. [Google Scholar] [CrossRef] [PubMed]
- Gordts, S.C.; Muthuramu, I.; Amin, R.; Jacobs, F.; De Geest, B. The Impact of Lipoproteins on Wound Healing: Topical HDL Therapy Corrects Delayed Wound Healing in Apolipoprotein E Deficient Mice. Pharmaceuticals 2014, 7, 419–432. [Google Scholar] [CrossRef] [PubMed]
- Beck, W.H.; Adams, C.P.; Biglang-Awa, I.M.; Patel, A.B.; Vincent, H.; Haas-Stapleton, E.J.; Weers, P.M. Apolipoprotein A-I binding to anionic vesicles and lipopolysaccharides: Role for lysine residues in antimicrobial properties. Biochim. Biophys. Acta 2013, 1828, 1503–1510. [Google Scholar] [CrossRef] [PubMed][Green Version]
- Ontsuka, K.; Kotobuki, Y.; Shiraishi, H.; Serada, S.; Ohta, S.; Tanemura, A.; Yang, L.; Fujimoto, M.; Arima, K.; Suzuki, S.; et al. Periostin, a matricellular protein, accelerates cutaneous wound repair by activating dermal fibroblasts. Exp. Dermatol. 2012, 21, 331–336. [Google Scholar] [CrossRef]
- Evdokiou, A.; Kanisicak, O.; Gierek, S.; Barry, A.; Ivey, M.J.; Zhang, X.; Bodnar, R.J.; Satish, L. Characterization of Burn Eschar Pericytes. J. Clin. Med. 2020, 9, 606. [Google Scholar] [CrossRef] [PubMed]
- Yin, H.L. Gelsolin: Calcium- and polyphosphoinositide-regulated actin-modulating protein. Bioessays 1987, 7, 176–179. [Google Scholar] [CrossRef]
- Vaid, B.; Chopra, B.S.; Raut, S.; Sagar, A.; Badmalia, M.D.; Ashish; Khatri, N. Antioxidant and Wound Healing Property of Gelsolin in 3T3-L1 Cells. Oxid. Med. Cell Longev. 2020, 2020, 4045365. [Google Scholar] [CrossRef] [PubMed]
- Xianhui, L.; Pinglian, L.; Xiaojuan, W.; Wei, C.; Yong, Y.; Feng, R.; Peng, S.; Gang, X. The association between plasma gelsolin level and prognosis of burn patients. Burn. J. Int. Soc. Burn. Inj. 2014, 40, 1552–1555. [Google Scholar] [CrossRef]


| Target Gene | Forward Primer 5′→3′ | Reverse Primer 5′→3′ | Reference |
|---|---|---|---|
| Cathelicidin antimicrobial peptide (CRAMP) | CCTAGACACCAATCTCTACC | GTCTCCTTCACTCGGAACC | [14] |
| β-defensin 1 | CCAGATGGAGCCAGGTGTTG | AGCTGGAGCGGAGACAGAATCC | [15] |
| Substance P = Protachykinin-1 (Tac1) | CCAGATCTCTCACAAAAGGC | TTTCGTAGTTCTGCATCGCGC | [16] |
| Bradykinin receptor B1 (BDKRB1) | TGGAGTTGAACGTTTTGGGTTT | GTGAGGATCAGCCCCATTGT | [17] |
| Bradykinin receptor B2 (BDKRB2) | CTGGGTGTTTGGAGAGGTGT | ACGAGCATCAGGAAGCAGAT | [18] |
| Calcitonin gene-related protein (CGRP) | GGACTTGGAGACAAACCACCA | GAGAGCAACCAGAGAGGAACTACA | [19] |
| Neuropeptide Y | AGGCTTGAAGACCCTTCCAT | ACAGGCAGACTGGTTTCAGG | [20] |
| Vascular endothelial growth factor (VEGF) | GCAGAAGTCCCATGAAGTGAT | GTCTCAATTGGACGGCAGTAG | [21] |
| Fibroblast growth factor (FGF2) | GTCACGGAAATACTCCAGTTGGT | CCCGTTTTGGATCCGAGTTT | [21] |
| GAPDH | CATCACTGCCACCCAGAAGACTG | ATGCCAGTGAGCTTCCCGTTCAG | [21] |
| Interleukin 6 (IL-6) | CAAAGCCAGAGTCCTTCAGA | GATGGTCTTGGTCCTTAGCC | [22] |
| Inducible nitric oxide synthase (iNOS) | CAG CTG GGC TGT ACA AAC CTT | CAT TGG AAG TGA AGC GGT TCG | |
| Neuronal nitric oxide synthase (nNOS) | ACTGACACCCTGCACCTGAAGA | GGAAGTCAGAAGATGTCCGCAC |
| Group Number | Treatment Plan | Male | Female | Total |
|---|---|---|---|---|
| 1 | FS/16 | 5 | 4 | 9 |
| 2 | CR/16 | 5 | 3 | 8 |
| 3 | FS/28 | 4 | 4 | 8 |
| 4 | CR/28 | 5 | 5 | 10 |
Disclaimer/Publisher’s Note: The statements, opinions and data contained in all publications are solely those of the individual author(s) and contributor(s) and not of MDPI and/or the editor(s). MDPI and/or the editor(s) disclaim responsibility for any injury to people or property resulting from any ideas, methods, instructions or products referred to in the content. |
© 2023 by the authors. Licensee MDPI, Basel, Switzerland. This article is an open access article distributed under the terms and conditions of the Creative Commons Attribution (CC BY) license (https://creativecommons.org/licenses/by/4.0/).
Share and Cite
Garrity, C.; Garcia-Rovetta, C.; Rivas, I.; Delatorre, U.; Wong, A.; Kültz, D.; Peyton, J.; Arzi, B.; Vapniarsky, N. Tilapia Fish Skin Treatment of Third-Degree Skin Burns in Murine Model. J. Funct. Biomater. 2023, 14, 512. https://doi.org/10.3390/jfb14100512
Garrity C, Garcia-Rovetta C, Rivas I, Delatorre U, Wong A, Kültz D, Peyton J, Arzi B, Vapniarsky N. Tilapia Fish Skin Treatment of Third-Degree Skin Burns in Murine Model. Journal of Functional Biomaterials. 2023; 14(10):512. https://doi.org/10.3390/jfb14100512
Chicago/Turabian StyleGarrity, Carissa, Christina Garcia-Rovetta, Iris Rivas, Ubaldo Delatorre, Alice Wong, Dietmar Kültz, Jamie Peyton, Boaz Arzi, and Natalia Vapniarsky. 2023. "Tilapia Fish Skin Treatment of Third-Degree Skin Burns in Murine Model" Journal of Functional Biomaterials 14, no. 10: 512. https://doi.org/10.3390/jfb14100512
APA StyleGarrity, C., Garcia-Rovetta, C., Rivas, I., Delatorre, U., Wong, A., Kültz, D., Peyton, J., Arzi, B., & Vapniarsky, N. (2023). Tilapia Fish Skin Treatment of Third-Degree Skin Burns in Murine Model. Journal of Functional Biomaterials, 14(10), 512. https://doi.org/10.3390/jfb14100512