1. Introduction
Raven’s Advanced Progressive Matrices (
Raven et al. 1998) have been developed to measure reasoning ability and, thereby, a core aspect of general intelligence (
Raven 2000;
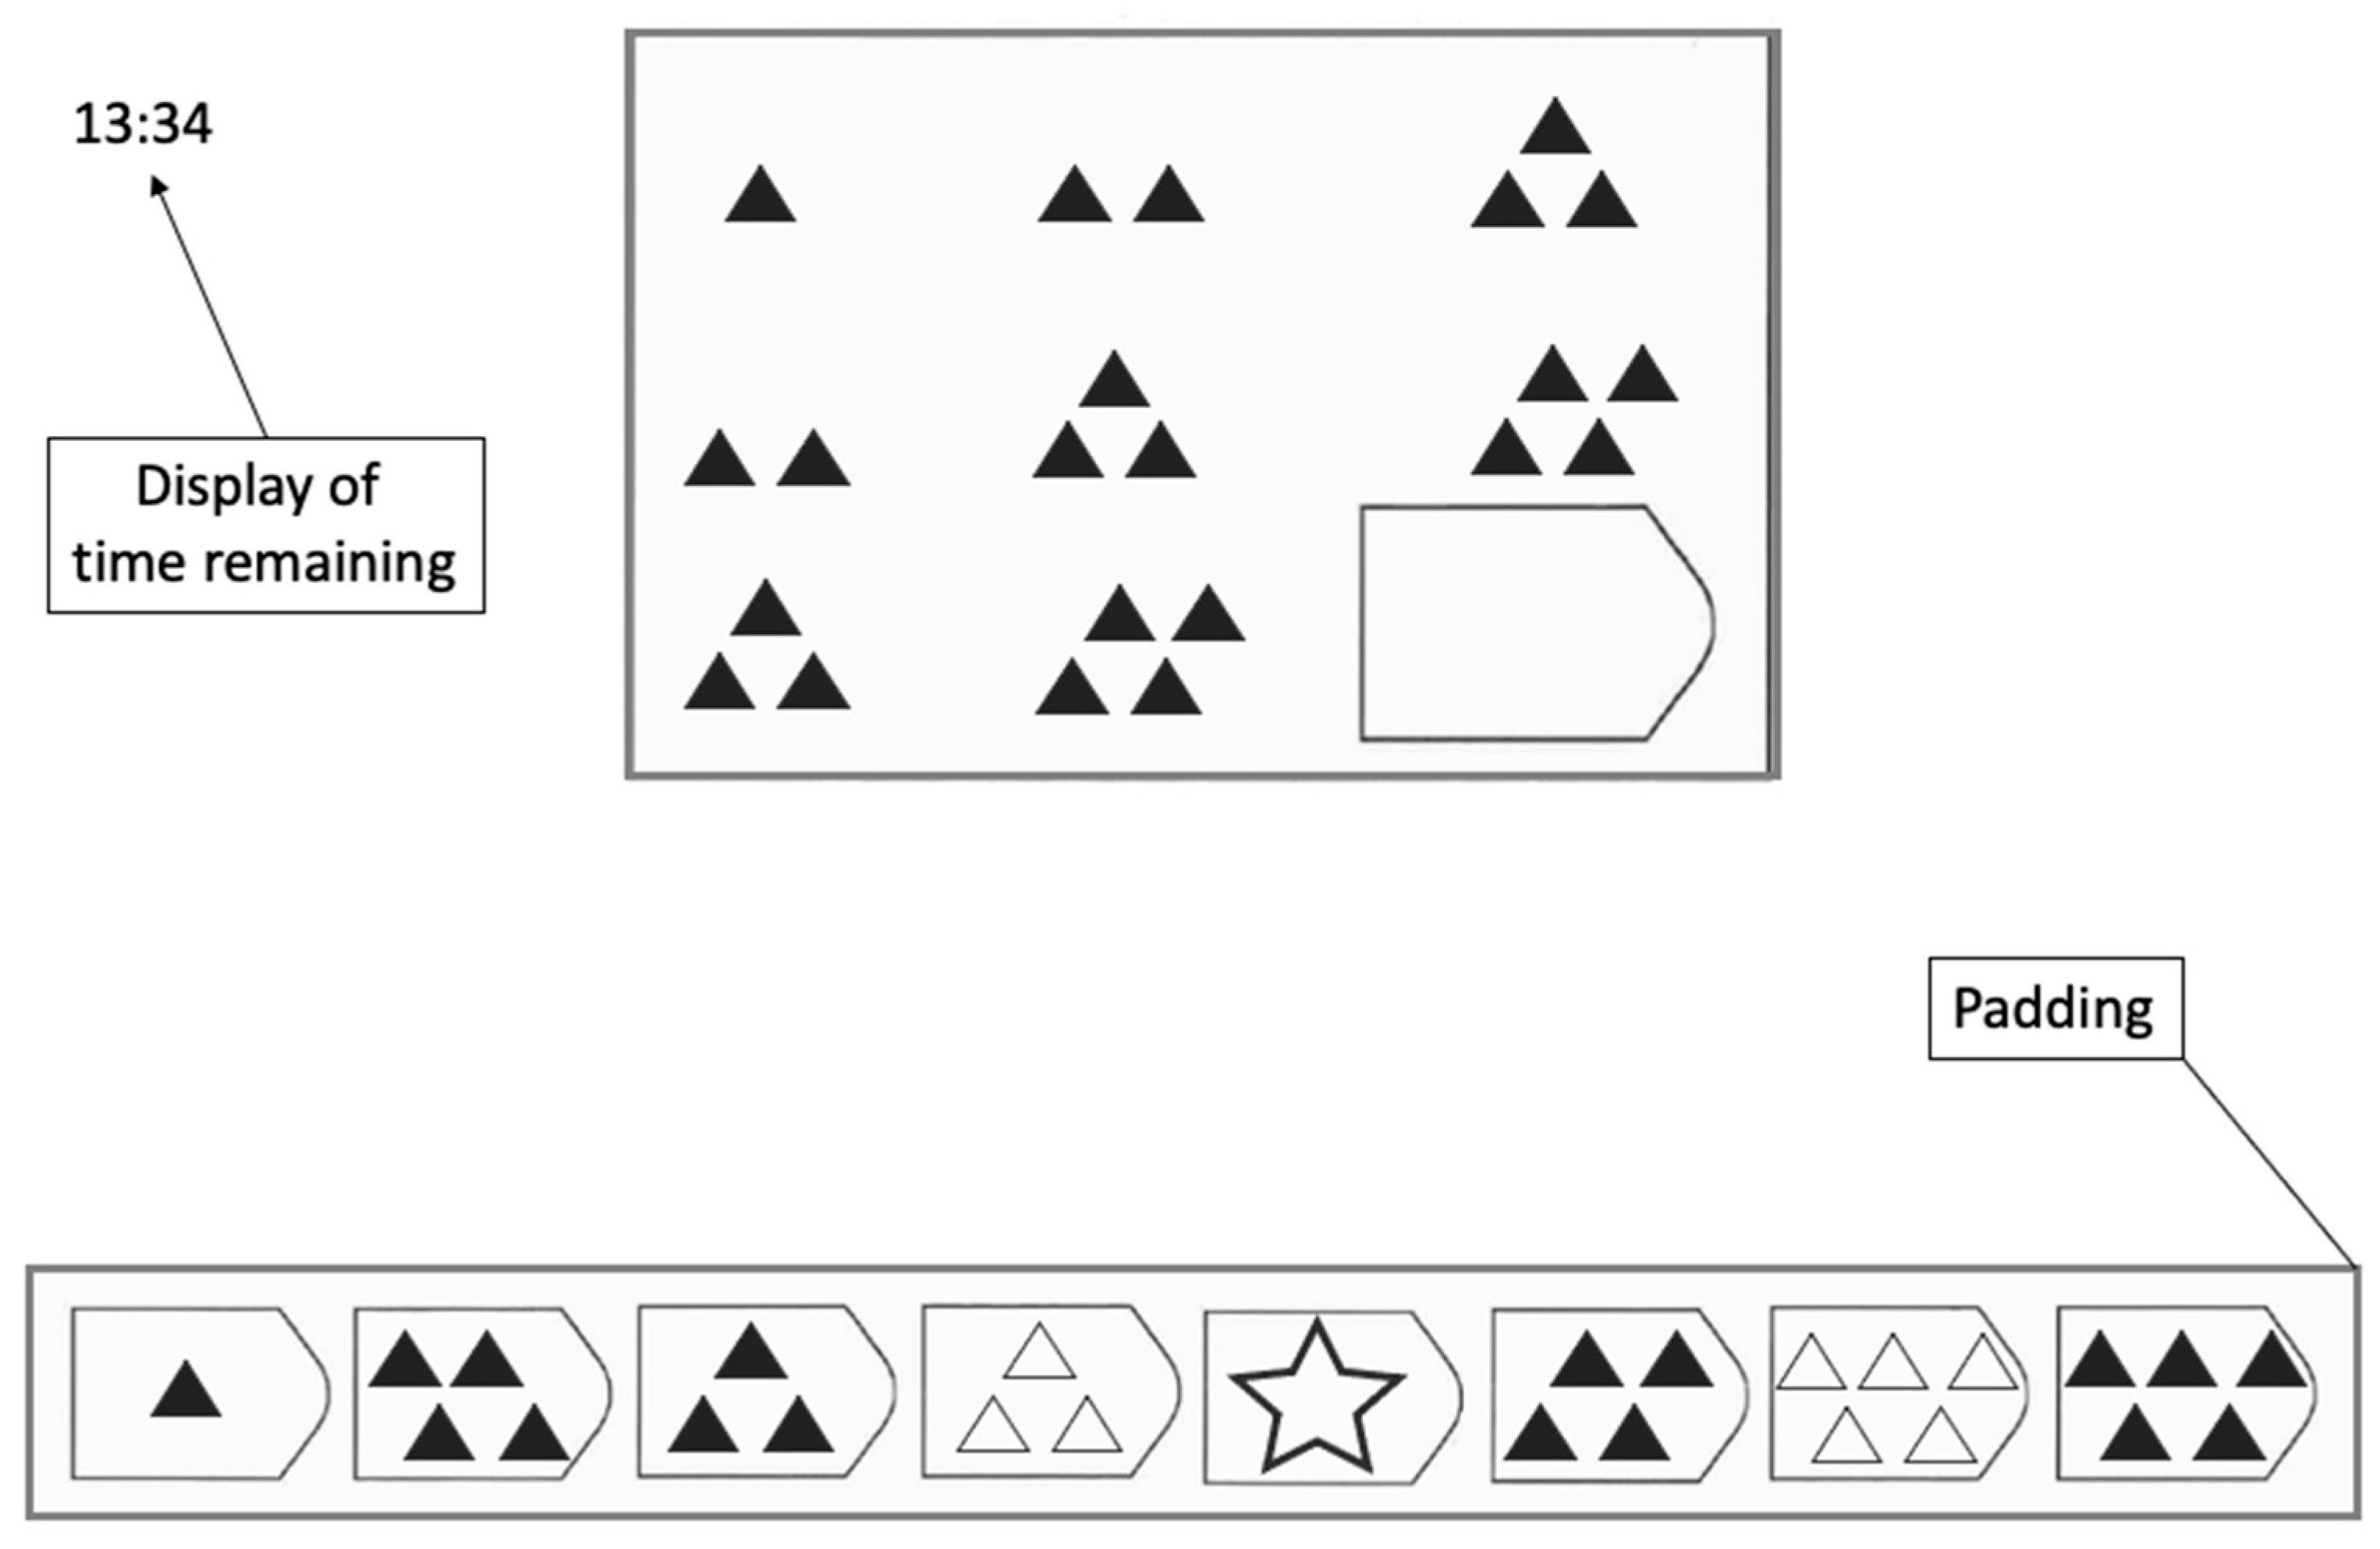
Spearman 1927). Each APM item is composed of a 3 × 3 matrix with figural stimuli in eight of the nine entries, while the bottom right entry is missing (see
Figure 1 for an illustrative example). The participant’s task is to identify the rule(s) connecting the stimuli within each row or column to infer what the missing entry should look like and to select the correct option out of eight response alternatives. Although the relationship between APM test scores and general intelligence seems to be weaker than commonly assumed (
Gignac 2015), empirical findings support the substantial relationship between APM test scores and general intelligence (e.g.,
Marshalek et al. 1983). This led to the frequent administration of the APM in research when general intelligence was assessed by a single test instead of a comprehensive test battery. As a result, many insights into the correlates of intelligence (for example, cognitive and neural) are based on the APM.
When individuals apply the constructive matching strategy, they spend much of the time on the matrix, identifying the underlying rules, constructing the missing entry, to then selecting the matching entry from the response alternatives. With the response elimination strategy, individuals eliminate step-by-step, non-viable solutions from the response alternatives until the correct solution is found. These strategies were investigated and identified in the APM by means of eye-tracking data (
Vigneau et al. 2006), verbal protocols (
Jarosz et al. 2019), and questionnaires (
Gonthier and Thomassin 2015). Independent of how the strategy was assessed, constructive matching was associated with higher test scores compared to response elimination (e.g.,
Gonthier and Roulin 2020;
Jastrzębski et al. 2018).
Eye tracking is an objective instrument used to assess strategy use, and test takers are not asked about their problem-solving behavior while completing the test. Self-report questions or think-aloud protocols after each item can sometimes lead to a change in problem-solving behavior (i.e., reactivity). Despite an abundance of information on eye-tracking metrics offered on every item for every individual (
Vigneau et al. 2006;
Hayes et al. 2015;
Laurence et al. 2018), they do not provide insight into other possible cognitive processes (e.g., verbal rehearsals). Hence, eye tracking provides only information about strategy use that translates directly to eye movements. Three of the frequently used metrics are the toggle rate, proportional time on the matrix, and latency to the first fixation on response alternatives (
Laurence and Macedo 2023).
To quantify the toggle rate, the fixations an individual makes while solving an item are assessed and divided by item latency. A toggle occurs when an individual first shows a fixation on the matrix, followed by a fixation on the response alternatives, or vice versa. Constructive matching leads to few toggles since most of the time is spent on the problem matrix to analyze the rules and to mentally construct a solution. Using response elimination, however, necessitates frequently alternating between the matrix and the response alternatives to check whether a response alternative fits the empty entry in the matrix. This results in a high number of toggles. Thus, constructive matching and response elimination differ in the frequency of toggles made while solving the item. Since more time spent on an item provides more opportunities to toggle, the absolute number of toggles is divided by the item’s latency.
The proportional time spent inspecting the problem matrix is another frequently used metric for strategy use within eye tracking (e.g.,
Li et al. 2022). It is calculated using the time a participant spends inspecting the problem matrix of an item divided by the total amount of time a participant spends on the said item. Since the constructive matching strategy includes a systematic analysis of the problem matrix to construct a possible answer, this strategy involves much time spent on the problem matrix in relation to the total time spent on an item. Hence, a larger value in this metric is indicative of constructive matching. In comparison, a smaller value indicates that participants spent proportionally more time looking at response alternatives, which is typical for response elimination.
Latency to first fixation on response alternatives can also be used to distinguish between the two strategies (e.g.,
Vigneau et al. 2006). When a participant spends only a small amount of time on the problem matrix before switching to the response alternatives, it is seen as an indicator of response elimination. On the contrary, higher latency to first fixation on response alternatives indicates constructive matching since more time passes before the participant inspects the possible response alternatives.
Why different strategies are used and why they lead to different results is an ongoing debate. However, there is some evidence that test demands (e.g.,
Raden and Jarosz 2022) and available mental capacities (
Gonthier and Thomassin 2015;
Jarosz et al. 2019;
Li et al. 2022) influence what strategy an individual applies to an item. Summarized, strategy use is influenced by the interrelationship of the mental resources of an individual and perceived item properties. Additionally,
Bethell-Fox et al. (
1984) and
Snow (
1980) found that individuals switched from constructive matching to response elimination as a fallback strategy when their capacity to hold rules and manipulate objects in their minds was exceeded.
Hence, according to
Bethell-Fox et al. (
1984) and
Snow (
1980), a shift towards more response elimination should be observed in a test with increasing item difficulty as the likelihood increases that item demands exceed the test takers’ capacity.
Gonthier and Roulin (
2020) reported such a shift in test-taking strategies in the APM based on an analysis of self-report questionnaires. Their participants progressively engaged in more response elimination as the items became more difficult. This shift in strategy was mediated by working memory capacity, as individuals with a higher working memory capacity used constructive matching for more items as the test progressed compared to individuals with a lower working memory capacity. This is in line with the assumptions made by
Bethell-Fox et al. (
1984) and
Snow (
1980) since individuals with a higher working memory capacity should be better able to handle increasing item difficulty (e.g., the simultaneous processing of several rules). Hence, they can use constructive matching on more items and more difficult items.
Jarosz et al. (
2019) also observed a shift towards less constructive matching with increasing item difficulty. As the test progressed, individuals used less and less constructive matching. Further analyses revealed that both working memory capacity and item difficulty influenced the likelihood of using constructive matching from item to item, although their interaction was not significant. Another noteworthy observation by
Jarosz et al. (
2019) was that individuals with a high working memory capacity were more likely to attempt the first APM item using constructive matching compared to individuals with a low working memory capacity. These results suggest that, with increasing item difficulty, strategy use generally shifts towards less constructive matching. Simultaneously, a high working memory capacity enables more constructive matching.
Furthermore,
Perret and Dauvier (
2018) found, in a sample of children, that the ability to adapt one’s response latency was specifically linked to performance. In their reasoning ability test, performance increased not only as the children grew older but especially for those children who showed the largest adaptation in response times between easy and difficult items. In a test with increasing item difficulty, such as the APM, this would translate to progressively longer response times as the test progresses, especially for participants with higher reasoning abilities. Along this line,
Gonthier et al. (
2024) found that older children used more constructive matching on difficult items compared to younger children. Hence, a higher ability came with better adaptability regarding strategy use for difficult items. This would mean a shift towards more constructive matching within the APM since item difficulty increases throughout the test.
Summarized, there is evidence for adaptability or change in test-taking strategies, yet there is not enough evidence to understand what impacts strategy use and the possible changes occurring therein, especially results regarding the direction of the shift in strategy use diverge (an increase in response elimination (
Snow 1980) or an increase in constructive matching (
Gonthier et al. 2024)).
Regardless of the direction, such changes in strategy use during a test likely lead to a systematic increase in variance regarding the response behavior from item to item. This corresponds to a well-replicated finding in structural investigations of the APM, namely, the item-position effect (
Lozano 2015;
Ren et al. 2014,
2017b;
Schweizer et al. 2009,
2021;
Zeller et al. 2017). An item-position effect in reasoning tests can be assumed when the quality of a response to an item is not only influenced by the test takers’ reasoning ability but also by the position at which the item is presented. Studies found that data description improved when, in addition to reasoning ability, a second latent variable was introduced to a measurement model (
Ren et al. 2014,
2017b;
Schweizer et al. 2009,
2021), specifically when this second latent variable had its factor loadings monotonically increase (linearly or quadratically) from item to item. This indicates that, in addition to reasoning ability, a second source explained a significant amount of variance in response behavior, with its relevance increasing from item to item and, therefore, is referred to as the item-position effect.
Current Study
The main objective of the present study was to examine whether there is a systematic relationship between the item-position effect and a shift in strategy use. To investigate this objective, a number of preconditions must be met. In particular, an item-position effect must be detectable in the data, and eye-tracking metrics must reveal a shift in strategy use.
Hence, the first analysis investigated the presence of an item-position effect in the APM responses. For this purpose, different models were fit to the APM responses to discern whether the better-fitting model included an item-position effect. Due to the consistent finding of an item-position effect in the APM items (e.g.,
Schweizer et al. 2012;
Zeller et al. 2017), we expected to obtain a better data description when a latent item-position variable was added to a latent reasoning variable in a bifactor model.
This analysis was followed by investigating individual differences in the applied test-taking strategy. More specifically, we investigated whether individual differences in the toggle rate, proportional time on matrix, and latency to first fixation on response alternatives were constant across the APM items (one-factor model) or showed a systematic shift (bifactor model). For this purpose, the bifactor model consisted of a basic latent variable (with estimated factor loadings for the eye-tracking metric) and a latent variable with factor loadings fixed to a linear or quadratic increase, from the first to the last item. This statistical approach allowed for the representation of basic individual differences in the strategy applied (as in
Vigneau et al. 2006) but also for a shift in strategy from the first to the last item (as in
Gonthier and Roulin 2020).
Regarding the toggle rate, the second latent variable describes that individuals increasingly differ in the number of toggles made in relation to item latency as the test progresses. In other words, the latent variable depicting the change in toggle rate would indicate to what extent participants differ in adapting their toggle rate as the test progresses.
Similarly, in the model fit to the proportional time spent on the problem matrix, the second latent variable depicts the change in proportional time spent on the problem matrix. This variable informs about whether the time participants allocate to inspect the problem matrix grows increasingly differently between participants. If, for the proportional time to the first fixation on the response alternatives, a bifactor model describes the data well, the latent variable with increasing factor loadings depicts an increasing difference between participants as to when they first look at the response alternatives in the given item.
The main objective was then to examine the interplay among the latent variables extracted from the APM responses and the eye-tracking metrics. We expected that the general tendency to use constructive matching (rather than response elimination) was related to reasoning ability, as previously reported (e.g.,
Jarosz et al. 2019). We also expected that if a strategy shift in the eye-tracking metrics could be identified, this shift would be related to the item-position effect in APM responses.
3. Results
Seven participants had faulty eye-tracking data that were caused by a recording failure. Hence, only 210 participants had complete data. With the strict time limit implemented in this study, not all participants managed to complete all 36 items. Only 164 participants completed all items, indicating that the results toward the end were clearly influenced by the implemented time limit. However, all 210 participants completed the first 22 items.
To only include 22 items in the analysis would increase the risk of not detecting a shift in strategy, as observed by
Gonthier and Roulin (
2020), or the item-position effect, and only including participants who completed all 36 items comes at the cost of power and a potential bias towards individuals working through reasoning items at a faster pace. With no optimal solution, we decided to report the results of all 36 items (excluding the participants who did not complete all 36 items, resulting in
n = 164) in detail and mention any noteworthy differences from 22-item (
N = 210), 27-item (
n = 206), and 33-item (
n = 185) analyses. Additionally, we included the analyses of data with the other cut-offs in the
Supplementary Materials. The overall pattern of results remains the same.
The means and standard deviations (
SD) of correct responses to the APM items for the 164 participants who completed all 36 items are presented in
Figure 3. Item difficulty and
SD increased throughout the test. The mean accuracy across all 36 items of the sample was 20.65, with a standard deviation of 7.49. McDonald’s Omega for the APM responses in the analyzed sample was good (ω = 0.91). The mean test score of the current sample is comparable with the results by
Hamel and Schmittmann (
2006), where the participants completed all 36 items with a time limit of 20 min (mean = 20.52,
SD = 3.87).
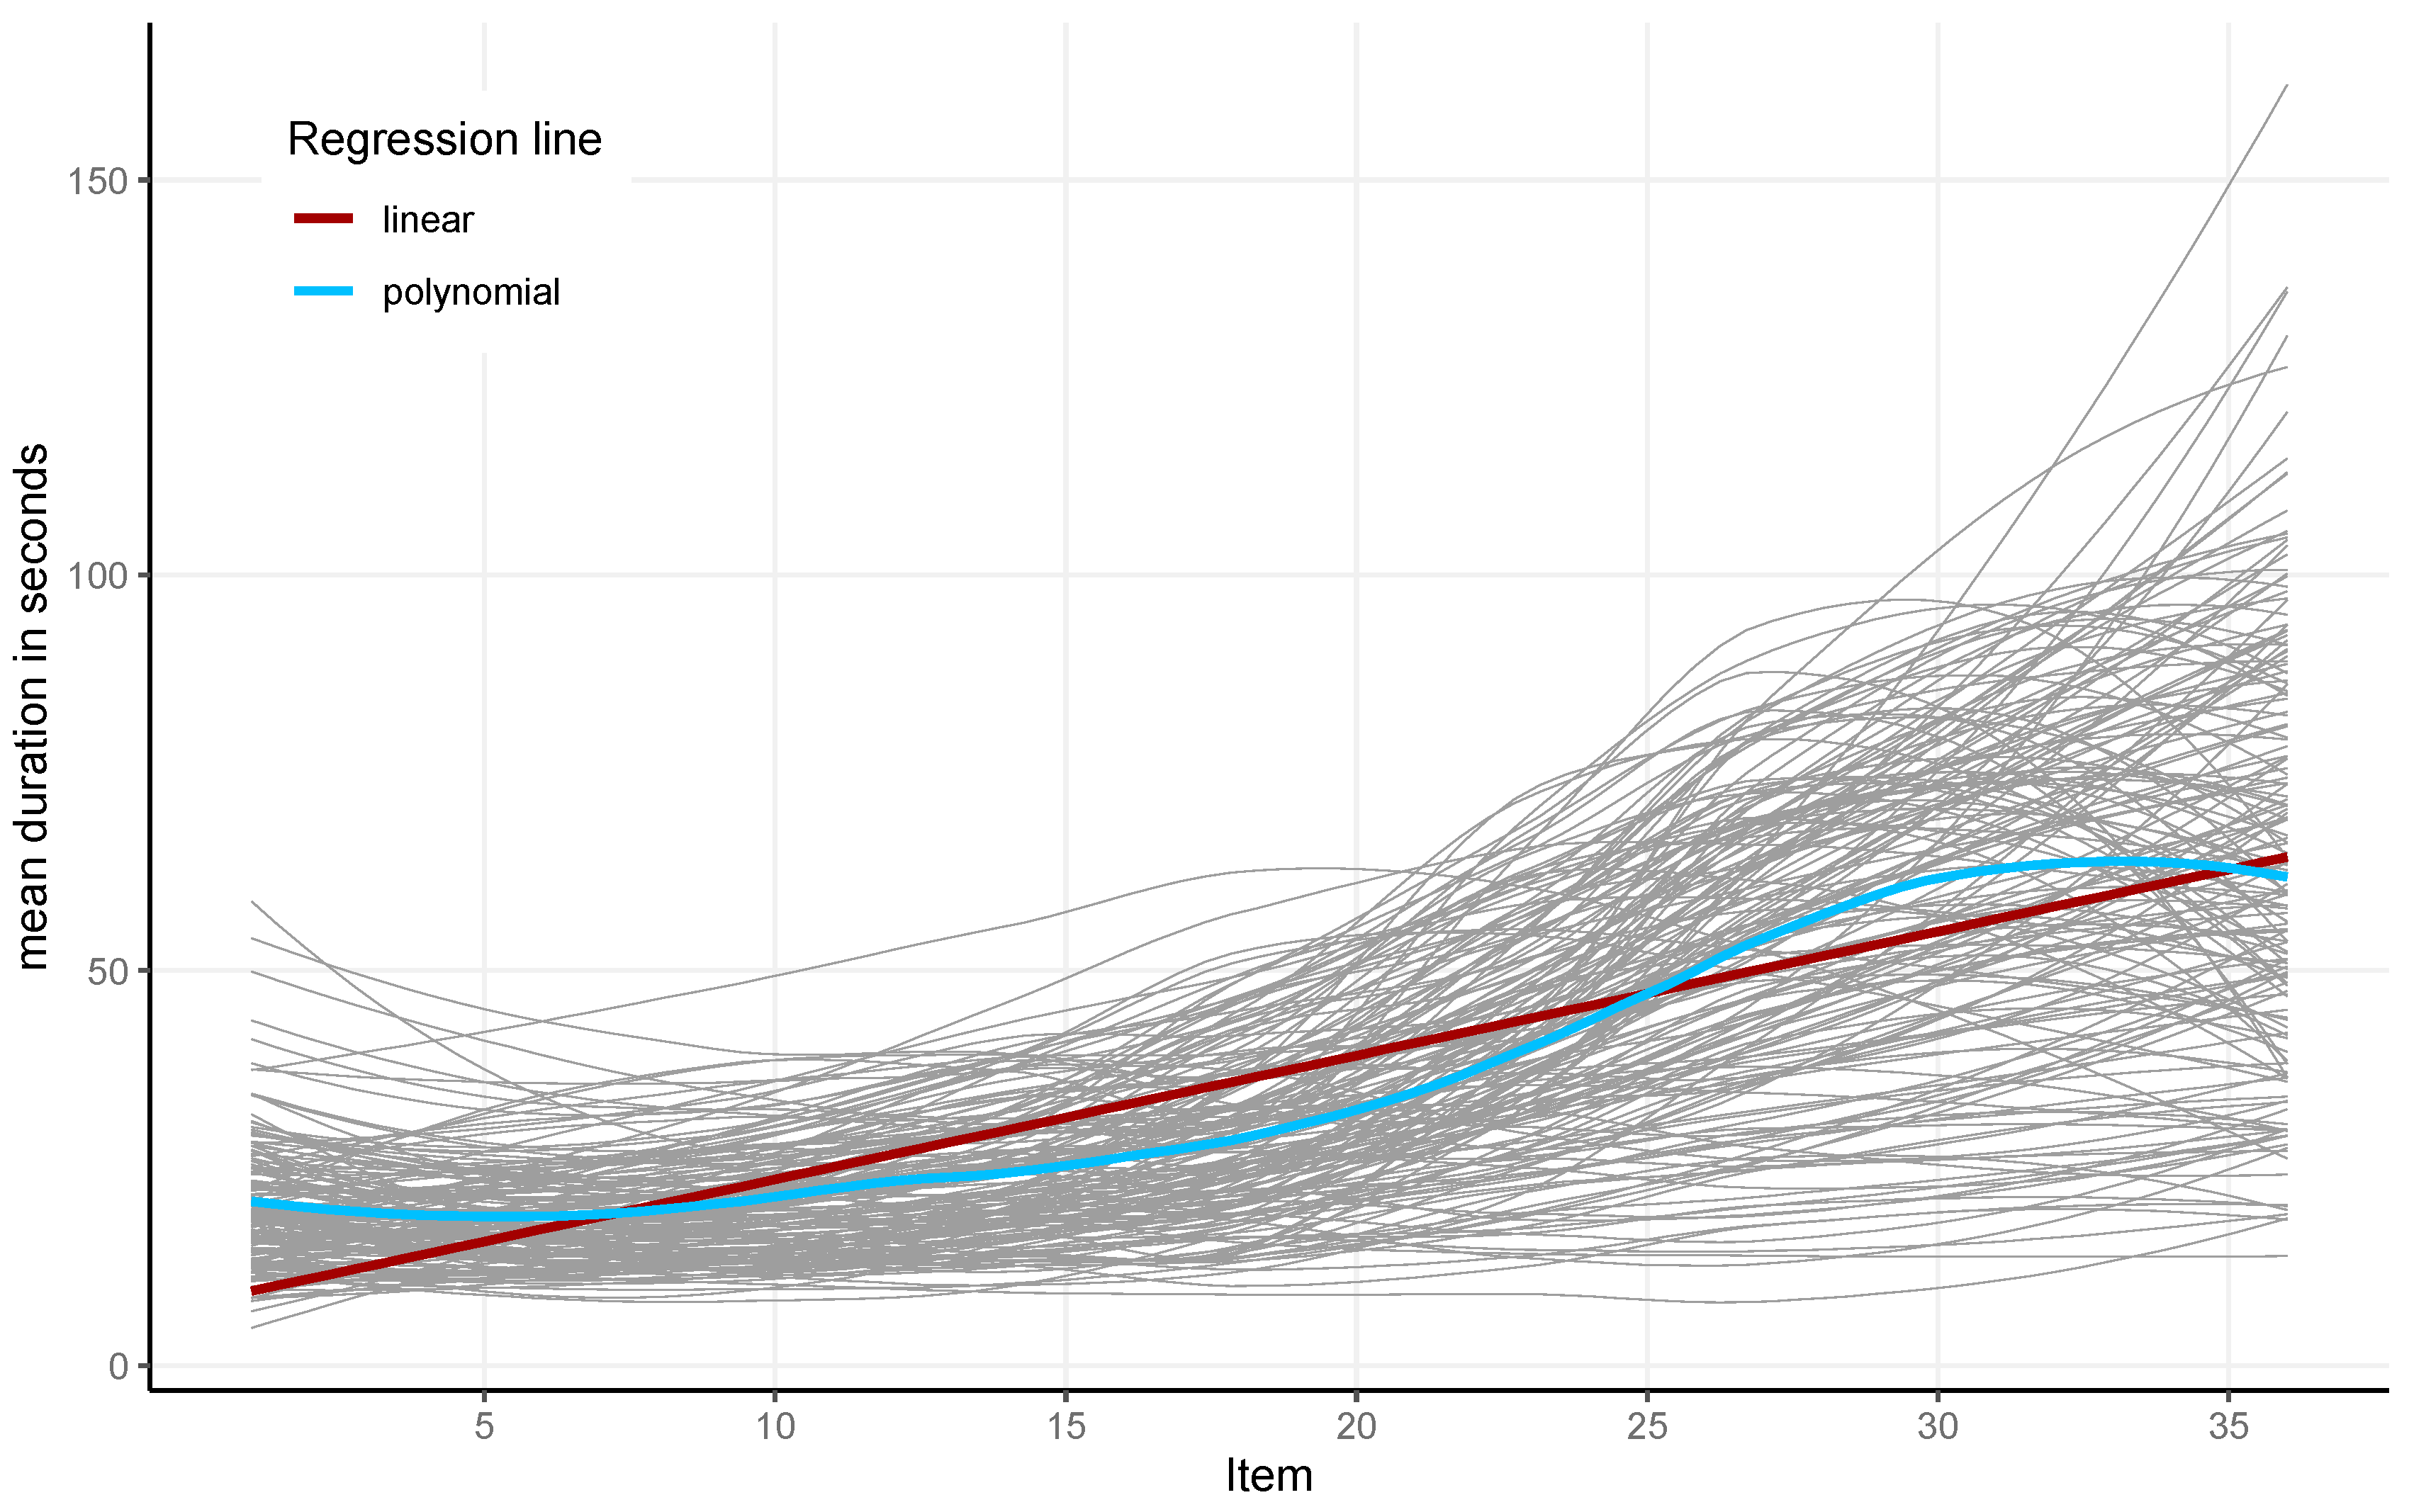
On average, participants responded to the 36 items within 16.38 min (
SD = 4.02 min), indicating that most participants finished the 36 items clearly below the set time limit of 30 min. Item latencies increased from the first to the twenty-seventh item (red line in
Figure 4). Fitting a local polynomial regression (blue line) showed stable latencies for the first items and then an increase around approximately Item 12. This increase in item latencies somewhat flattened out around Item 30, and they even decreased for the last few items.
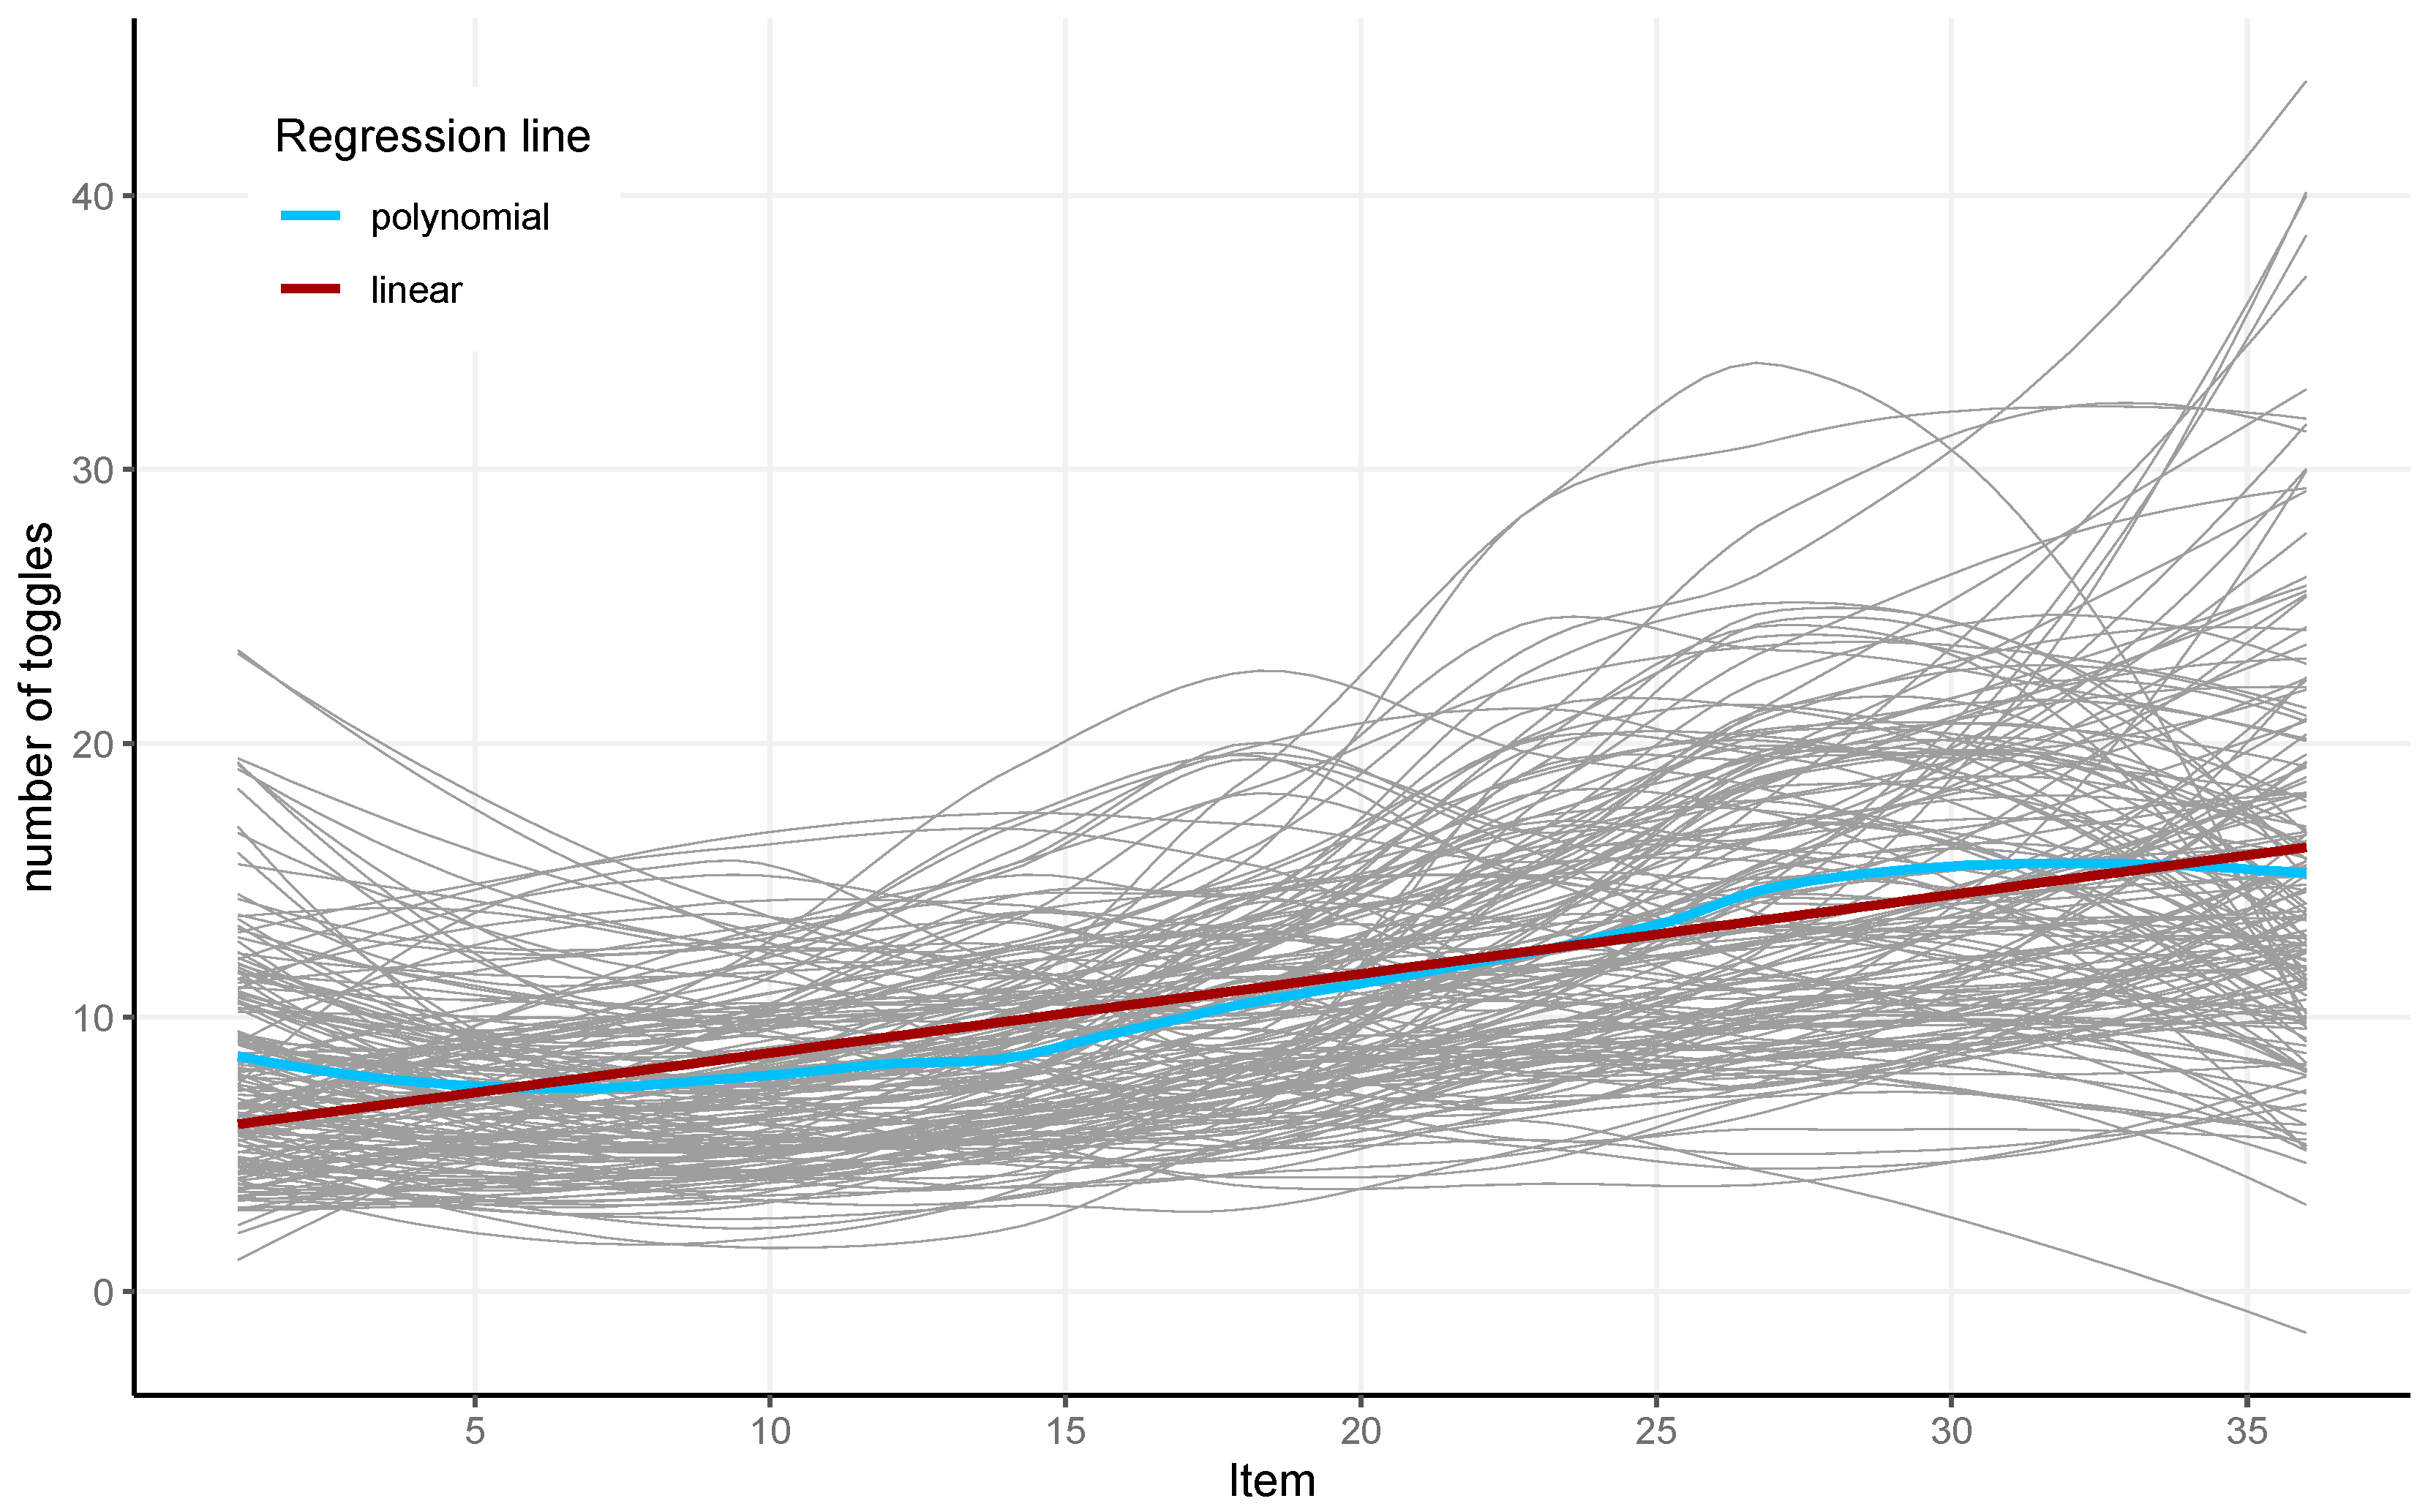
The absolute number of toggles increased from item to item, as depicted by the linear regression (in red) in
Figure 5. The local polynomial regression (in blue) showed a slight drop in absolute numbers of toggles for the last few items.
The absolute number of toggles divided by the respective item latency resulted in the analyzed toggle rate. A slight decrease in the toggle rate during test completion was observed (see
Figure 6). A decrease in toggle rate suggests less response elimination and more constructive matching towards the end of the test. The toggle rate had high reliability (McDonald’s Omega = 0.97).
The proportional time on the problem matrix was calculated by dividing the summarized duration of all fixations on the problem matrix by the total time a participant spent on the respective item. Throughout the completion of the APM, a slight increase in the proportional time on the problem matrix was observed (see
Figure 7). This indicates that participants spent more time inspecting the problem matrix as the test progressed. Spending proportionally more time on the problem matrix compared to the total item latency is in line with more constructive matching. The proportional time on the problem matrix had high reliability (McDonald’s Omega = 0.97).
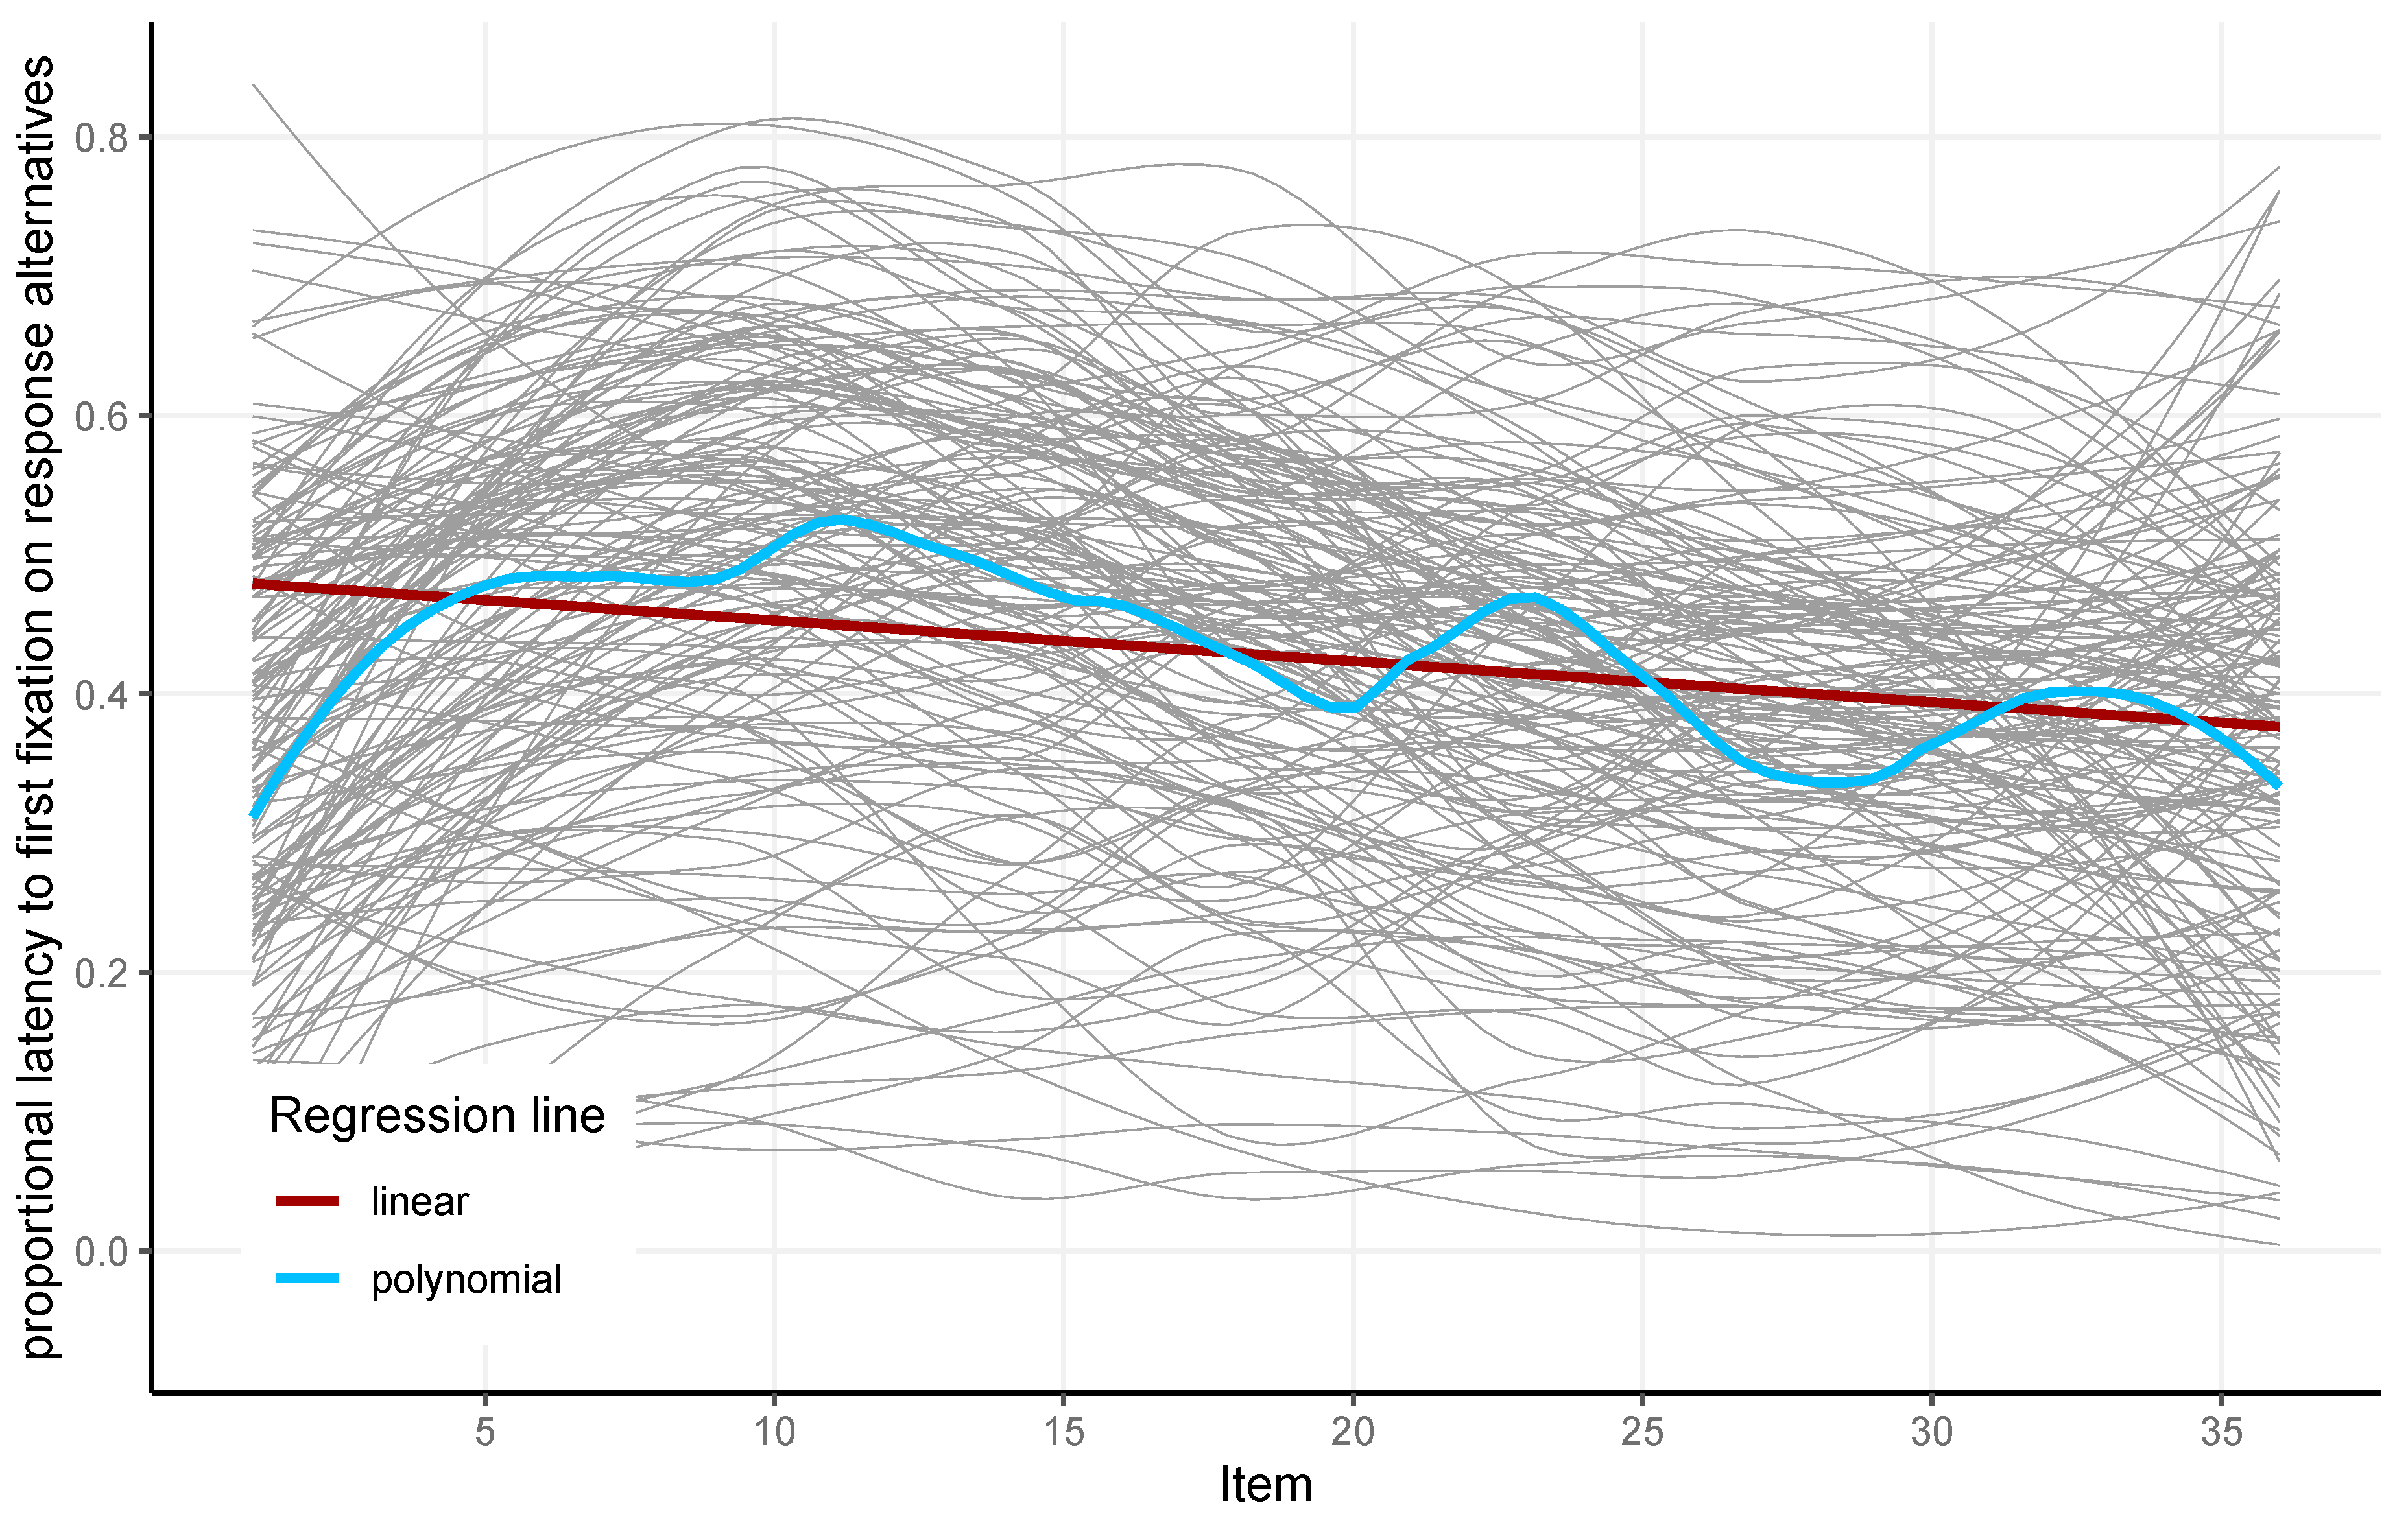
The proportional time to the first fixation on response alternatives refers to the time point of the first fixation a participant made on the response alternatives while solving an item, divided by item latency.
Figure 8 shows that, in relation to item latency, this point in time came earlier and earlier as the test progressed. This indicated that participants spent less time looking at the problem matrix as the test progressed before looking at the response alternatives, which is indicative of less constructive matching from item to item. The proportional time to the first fixation on response alternatives had high reliability (McDonald’s Omega = 0.94). For all the eye-tracking metrics presented and the APM scores, a correlation matrix is given in
Table 1.
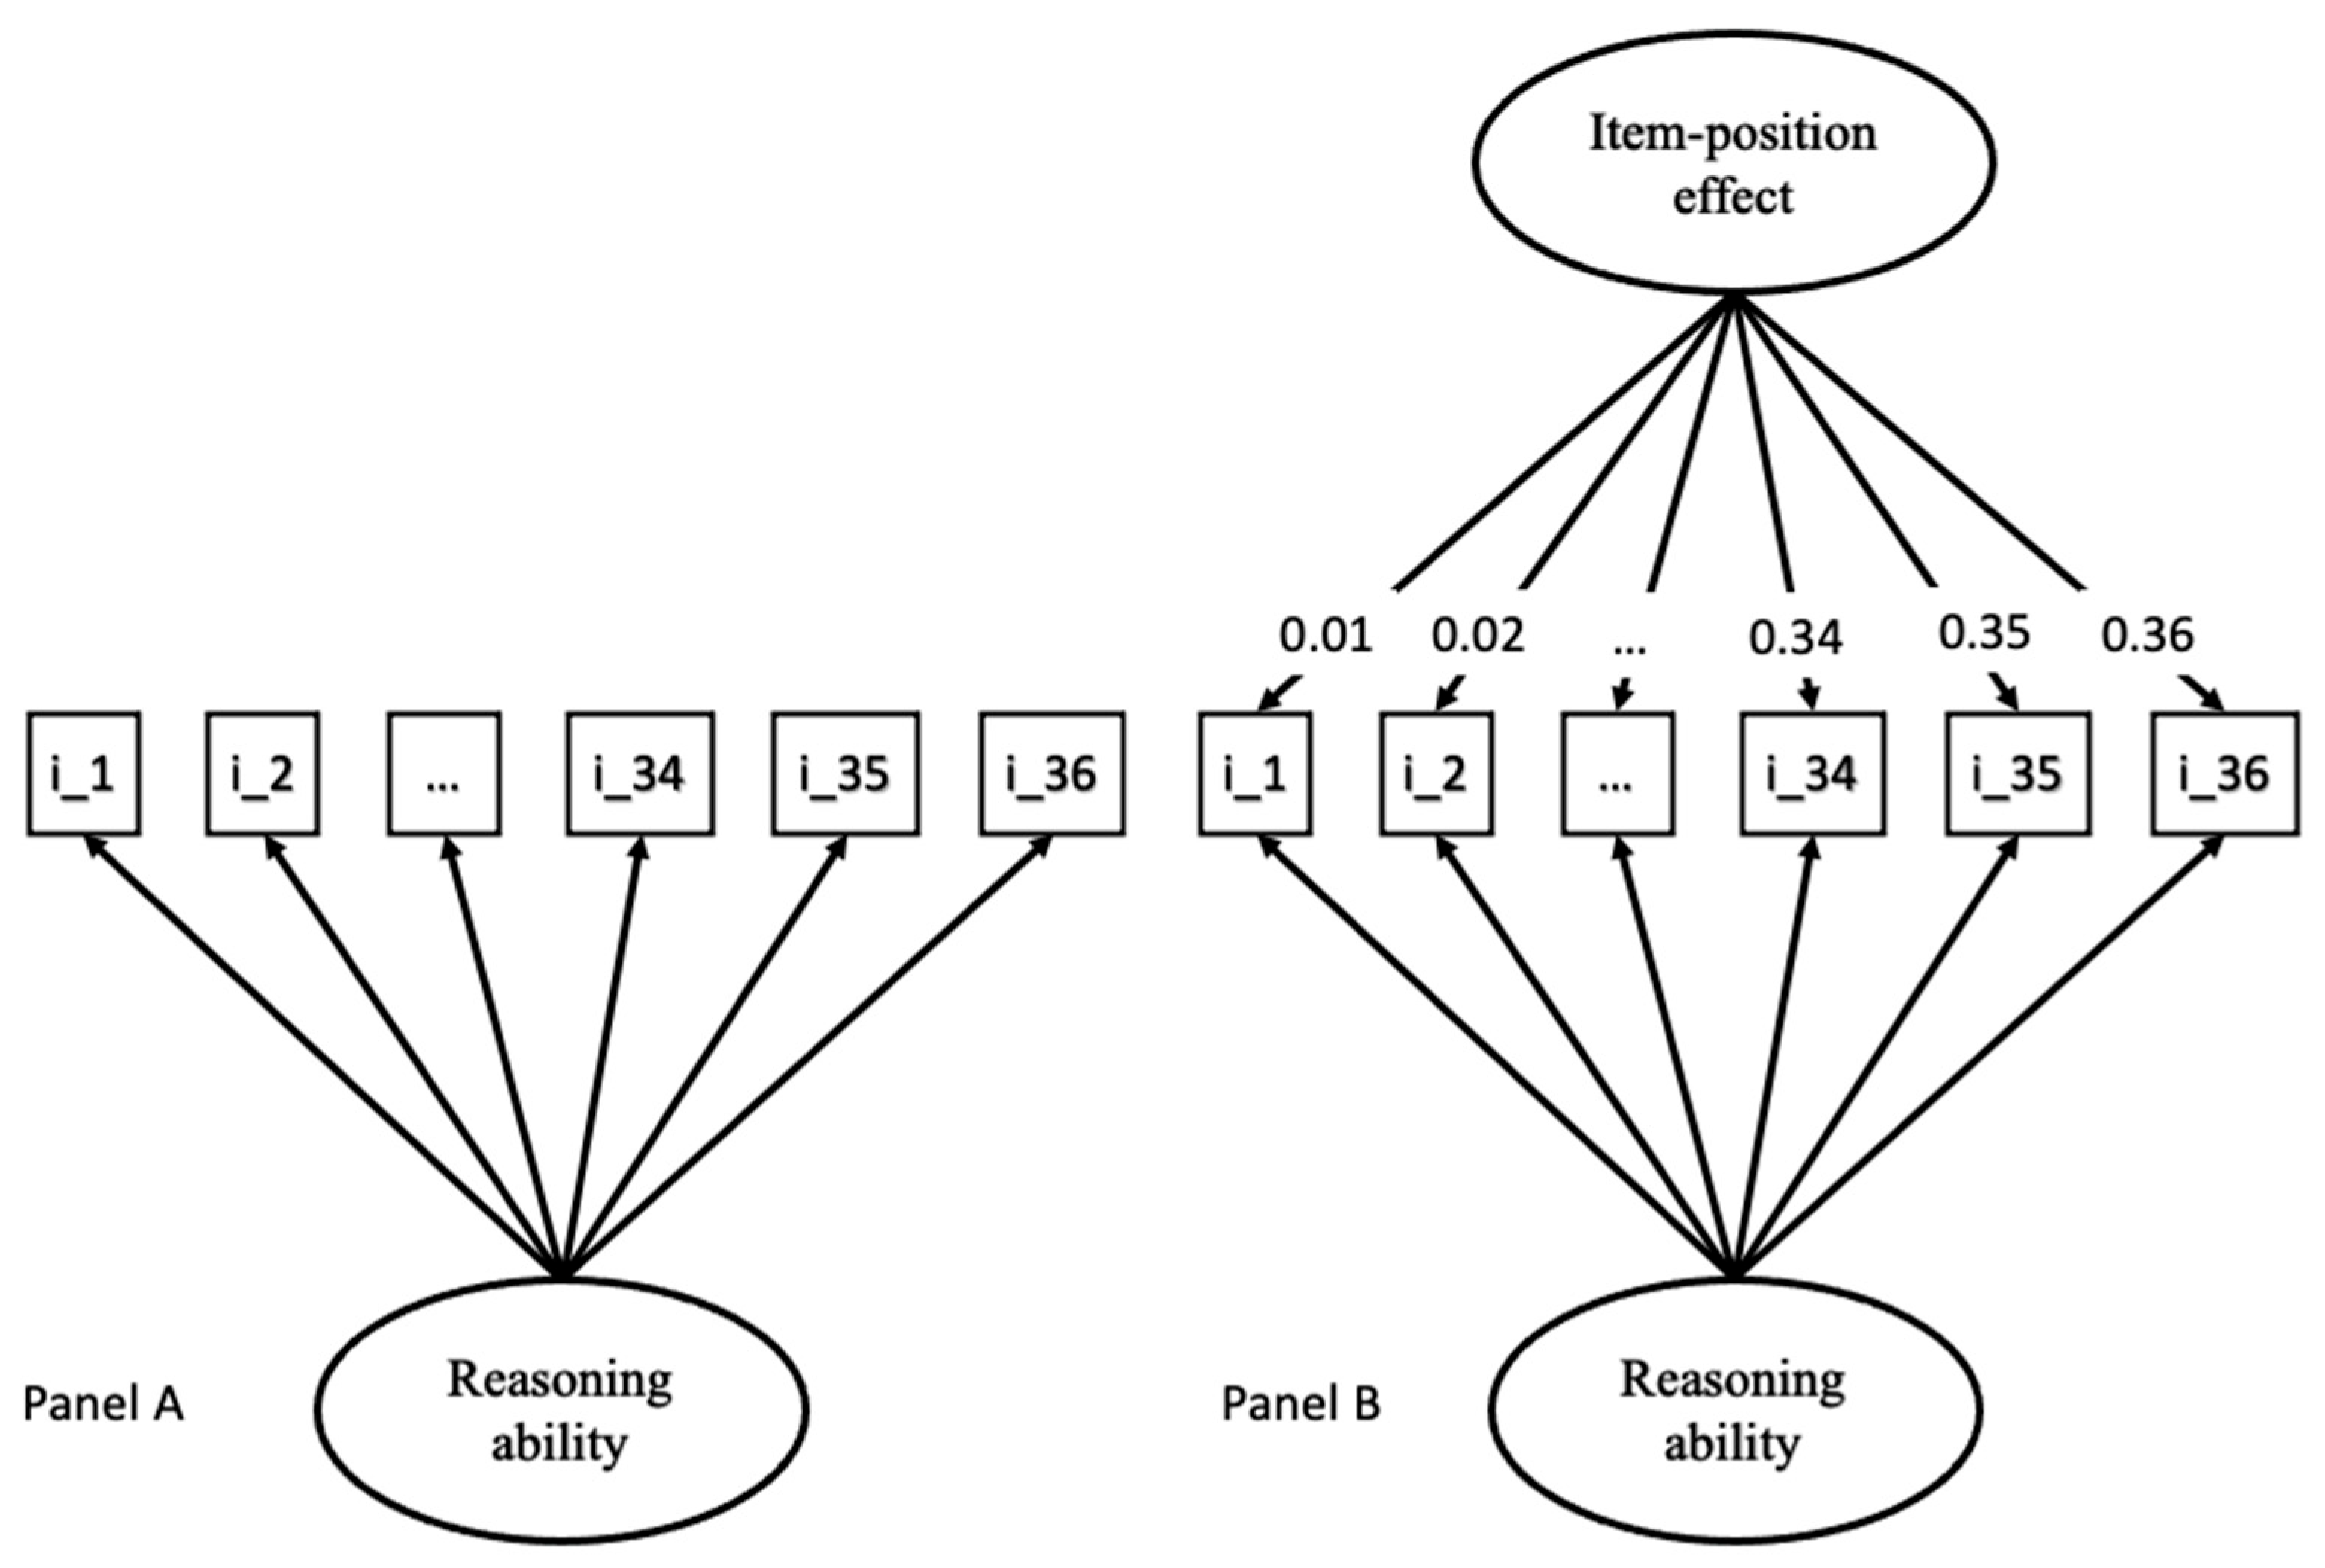
All of the calculated models that were used to determine a good measurement model for the toggle rate, proportional time on the problem matrix, latency to first fixation, and APM responses are summarized in
Table 2. The one-factor model and a bifactor model with a linear increase for the second latent variable reflecting the item-position effect are also illustrated in
Figure 2.
To investigate whether an item-position effect was present in the APM responses, three different models were fit to the data: a one-factor model (Model A); a bifactor model, where one latent variable depicted reasoning ability and the second latent variable with linearly (Model B); or quadratically (Model C) increasing factor loadings, depicting the item-position effect.
Comparing the respective models in
Table 2, the bifactor model for the APM responses with a linear increase for the item-position effect (Model B) showed a better fit compared to the one-factor model (smaller AIC and larger CFI). The AIC was smaller for Model B compared to Model C. Therefore, Model B exhibited a better fit for the APM responses. Both latent variables explained a significant portion of variance (reasoning: φ = 0.315,
z = 3.276,
p = 0.001; item-position effect: φ = 0.397,
z = 4.929,
p < 0.001). The reliability was good for the reasoning (ω = 0.87) and mediocre for the item-position effect latent variable (ω = 0.65).
To investigate individual differences in the applied test-taking strategy, the same three measurement models were fit to the eye-tracking metrics. For all three eye-tracking metrics, the one-factor model led to an acceptable data description (except for the CFIs of the models for the toggle rate and the proportional time to first fixation on response alternatives), but the bifactor models described the data better, as indicated by the lower AIC and a notably higher CFI.
Among the bifactor models for the toggle rate and proportional time in the problem matrix, Model C, with the quadratically increasing factor loadings, had a lower AIC and a higher CFI than Model B, indicating that Model C described the data better. Both latent variables in Model C explained a significant portion of variance (basic toggle rate: φ = 0.011, z = 2.449, p = 0.014; change in toggle rate: φ = 0.003, z = 3.656, p < 0.001; basic proportional time on matrix: φ = 0.011, z = 2.449, p = 0.014; change in proportional time on matrix: φ = 0.003, z = 3.656, p < 0.001). Reliability was good for the basic toggle rate (ω = 0.96) and low for the change in toggle rate (ω = 0.40). Reliability for the latent variable depicting the basic proportional time on the problem matrix was good (ω = 0.96) and mediocre for the change in proportional time on the problem matrix (ω = 0.69).
For the proportional time to the first fixation on response alternatives, Model B, with linearly increasing factor loadings, described the data better, as indicated by a lower AIC and higher CFI. Both latent variables in Model B explained a significant portion of variance (basic proportional time to first fixation on response alternatives: φ = 0.011, z = 3.494, p < 0.001; change in proportional time to first fixation on response alternatives: φ = 0.045, z = 4.961, p < 0.001). Reliability for the latent variable depicting the basic proportional time to first fixation on response alternatives was good (ω = 0.91) and acceptable for changes in proportional time to first fixation on response alternatives (ω = 0.71).
To investigate the interplay of latent variables extracted from the APM responses and the latent variables extracted from the eye-tracking metrics, the better-fitting measurement models from each were combined, respectively (last three rows in
Table 2). This included Model B for APM responses and proportional time to the first fixation on response alternatives and Model C for the toggle rate and the proportional time on the problem matrix.
All models showed an acceptable fit except for the CFI. According to
Kenny et al. (
2015), the CFI is not informative when the RMSEA of the baseline model is <0.158. This was the case for all three models (toggle rate, 0.110; proportional time on matrix, 0.111; proportional time to first fixation on response alternatives, 0.088). Hence, the CFI was not further used to determine the model’s fit.
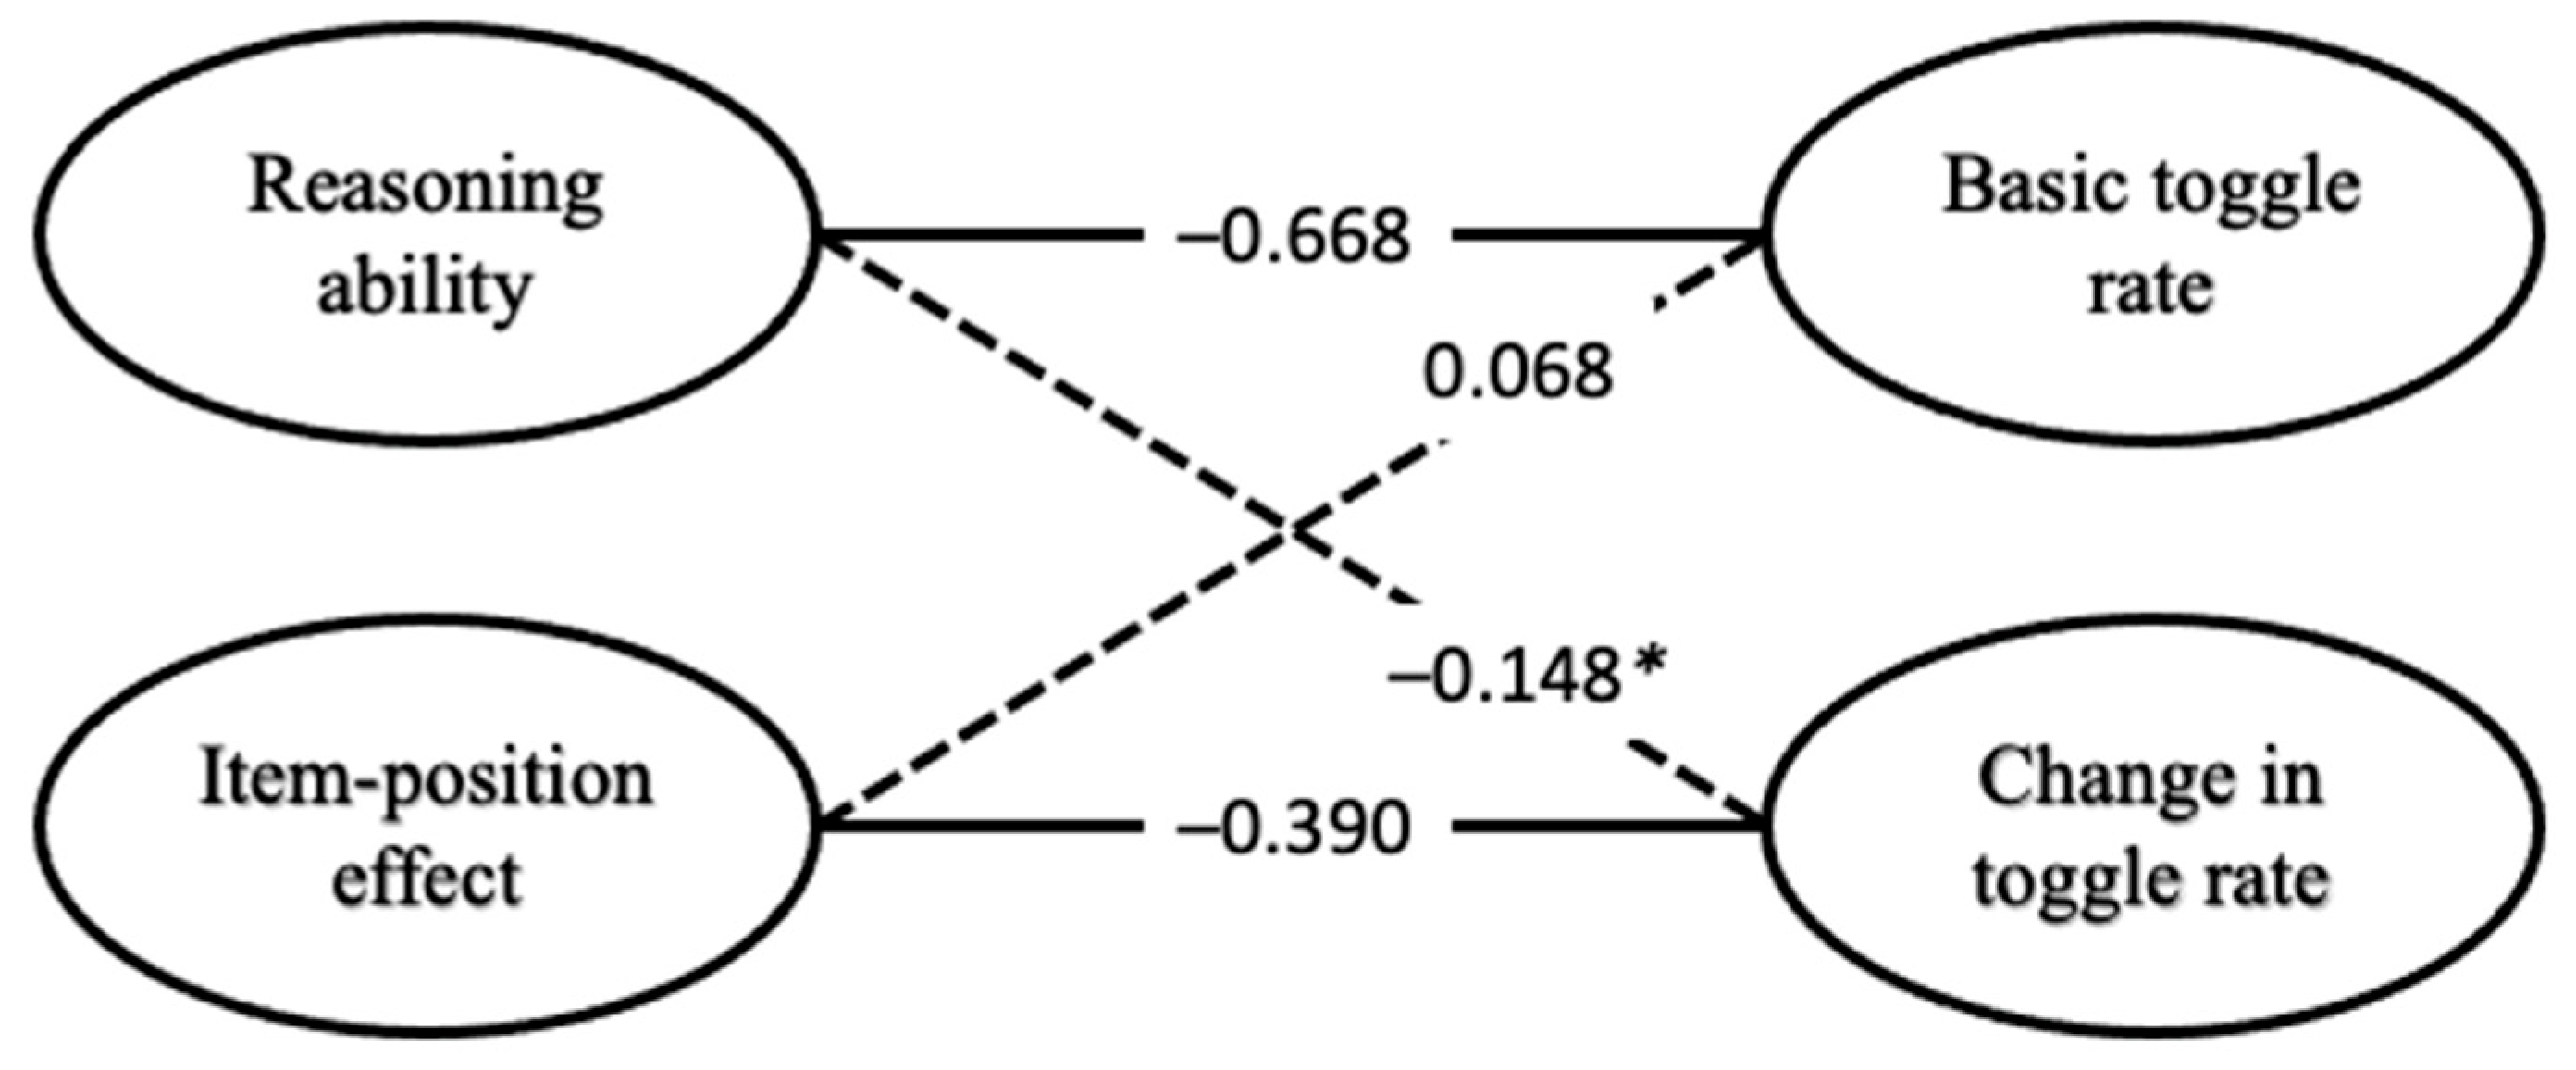
Correlations of the latent variables of the full model containing APM responses and toggle rate are depicted in
Figure 9. The latent variable for reasoning ability was correlated with the latent variable representing the basic toggle rate (
r = −0.668,
p = 0.003) but not with the latent variable representing the change in toggle rate (
r = −0.148,
p = 0.193). The item-position effect in APM responses was significantly correlated with the latent variable representing the change in toggle rate (
r = −0.390,
p = 0.012) but not with the latent variable representing the basic toggle rate (
r = −0.068,
p = 0.414).
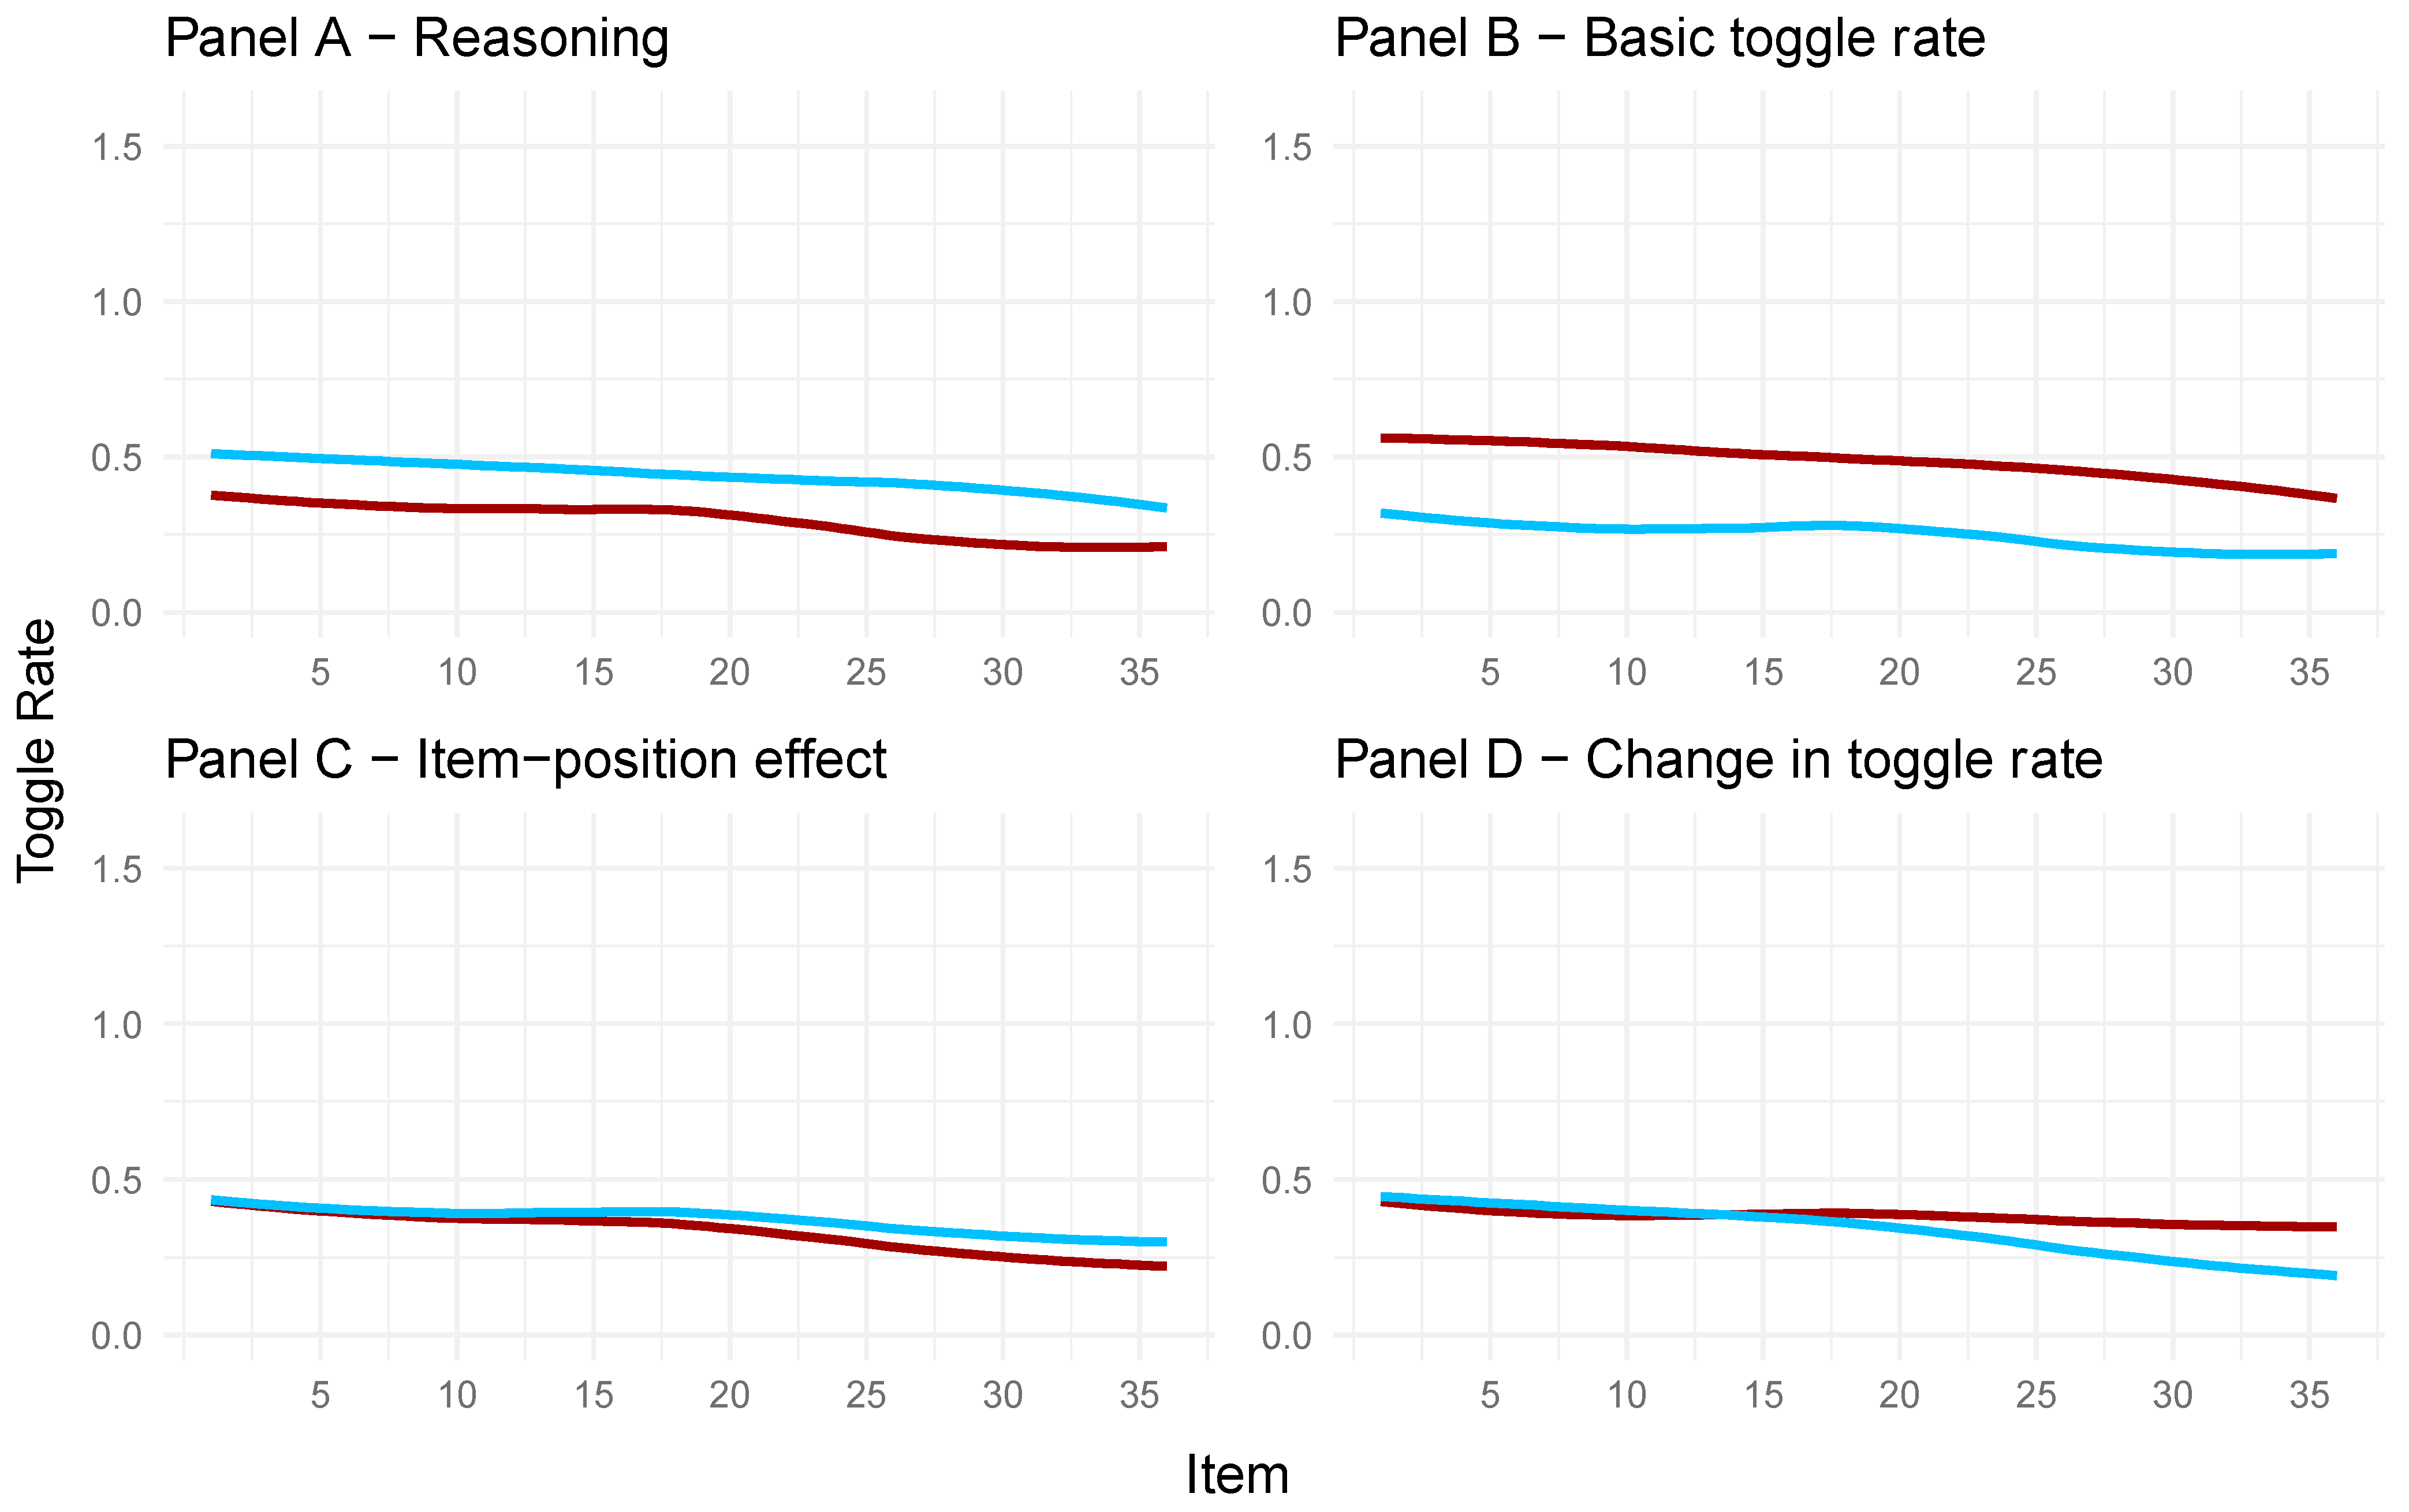
To illustrate and better understand these relations, descriptive graphics were created (see
Figure 10). For the four panels in
Figure 10, the factor scores of the full model regarding the toggle rate and APM responses were extracted. For each panel and the respective latent variable (Panels A to D), the 50 highest and 50 lowest factor scores were taken to create the distinction between participants with high and low manifestations on the latent variable. Therefore, the toggle rate throughout the test is illustrated in the graphs, with separate polynomial regression lines used for low and high manifestations on the given latent variable.
In Panel A of
Figure 10, the observed toggle rates for participants with high factor scores on the latent variable of reasoning ability (red line) and participants with low factor scores on reasoning ability (blue line) are depicted. Participants with higher factor scores on the reasoning ability variable showed a lower toggle rate for each item compared to participants with low reasoning ability factor scores. This means participants rather engaged in response elimination when their reasoning ability was low. This is in line with
Vigneau et al.’s (
2006) conclusion.
Panel B in
Figure 10 shows that the observed toggle rate in the APM items was higher for participants with high factor scores on the latent variable representing the basic toggle rate (red line) compared to participants with low factor scores (blue line). This underlines that the latent variable for the basic toggle rate indeed reflects a general toggle rate for each participant throughout the test.
As can be taken from Panel C in
Figure 10, participants with low (blue line) and high (red line) factor scores on the item-position effect in the APM responses reduced their toggle rate throughout the APM, reflecting a change in strategy. This change seemed larger for participants with high factor scores on the item-position effect
1, indicating that participants with a more pronounced item-position effect adapt their strategy more during test taking and shift to making fewer toggles; that is, less response elimination and more constructive matching compared to participants with a less pronounced item-position effect.
Participants with high factor scores (red line) on the change in toggle rate (Panel D,
Figure 10) showed no explicit change in their overall toggle rate. Participants with low values (blue line), on the other hand, showed a decrease in their overall toggle rate throughout the test. This means that a low manifestation on the latent variable depicting the change in toggle rate is indicative of a decrease in toggle rate, i.e., more constructive matching as the test progresses.
These results are also reflected in the correlations of the full model, albeit less descriptive (
Figure 9). Low values in the change in toggle rate were related to high values on the item-position effect in the APM responses. Low values in reasoning ability were related to high values in the basic toggle rate.
In the model combining the models regarding proportional time on the problem matrix and the APM responses (
Figure 11), a higher reasoning ability was significantly correlated with the latent variable representing the basic time spent on the problem matrix (
r = 0.593,
p = 0.001). This is in line with the previous findings of higher reasoning ability being related to constructive matching (e.g.,
Jastrzębski et al. 2018), as proportionally, more time spent on the problem matrix is the basis for more constructive matching. The correlation between the latent variable depicting the item-position effect and the change in proportional time on the problem matrix was not significant (
r = 0.190,
p = 0.133).
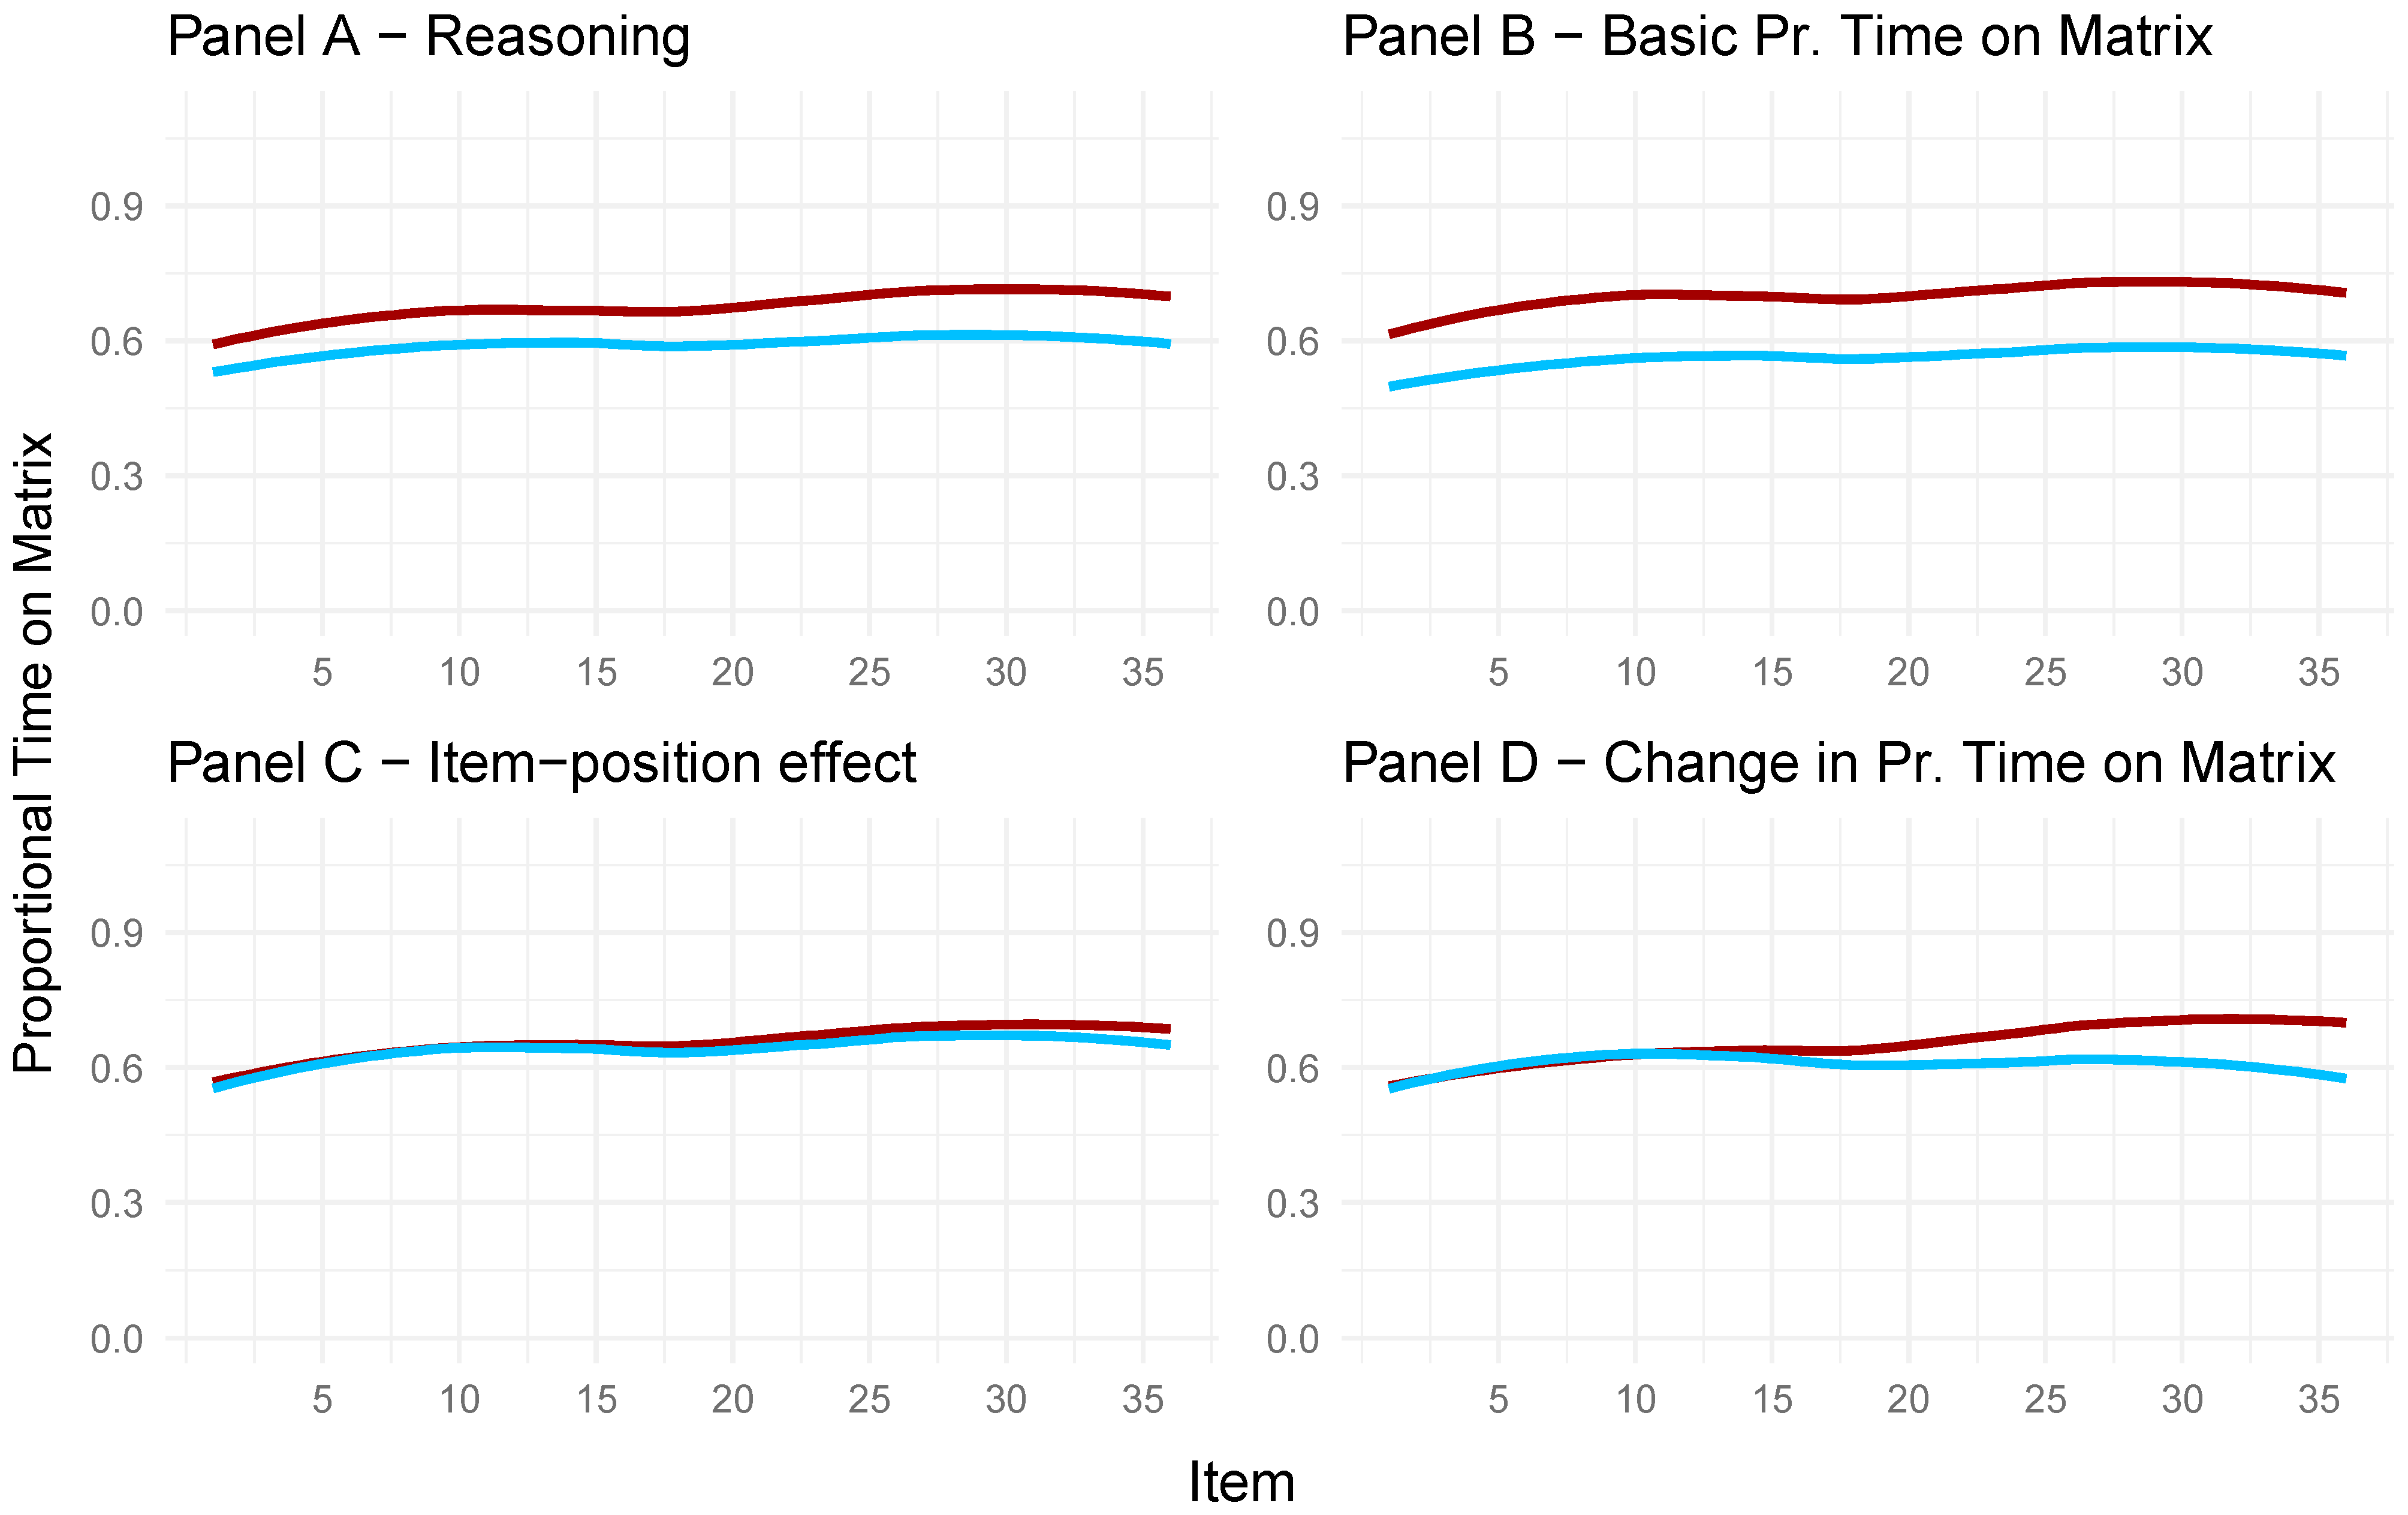
The panels in
Figure 12 were created to display the proportional time spent on the problem matrix for participants with high (red lines) and low (blue lines) factor scores on the respective latent variables depicted separately in each panel. Panel A in
Figure 12 depicts the proportional time spent on the problem matrix for individuals with high (red) and low (blue) factor scores on the latent reasoning variable. In line with previous research, more time spent on the problem matrix (i.e., constructive matching) coincided with a higher reasoning ability.
Panel B shows that participants with high factor scores on the latent variable depicting the basic proportional time on the matrix spent proportionally more time on the problem matrix compared to the participants with low factor scores on the latent variable. Hence, proportionally, more time spent on the problem matrix coincides with high factor scores on the latent variable, depicting basic proportional time on the matrix (Panel B) and high factor scores on the latent reasoning variable (Panel A). This is reflected in the strong positive correlation between the two latent variables, depicting reasoning ability and basic time on the problem matrix (
Figure 11).
In Panel C, no differences between individuals with high and low factor scores on the latent variable reflecting the item-position effect can be seen, as participants with high (red) and low (blue) factor scores on the item-position effect of the APM responses did not differ regarding the proportional time spent on the problem matrix.
In Panel D of
Figure 12, the difference between participants with high (red) and low (blue) factor scores on the latent variable for the change in proportional time spent on the problem matrix is visible for the last 10 items. This indicated that participants with high factor scores on the latent variable depicting the change in proportional time spent on the problem matrix spent more time on the problem matrix for the last 15 items compared to the participants with low factor scores on the said latent variable.
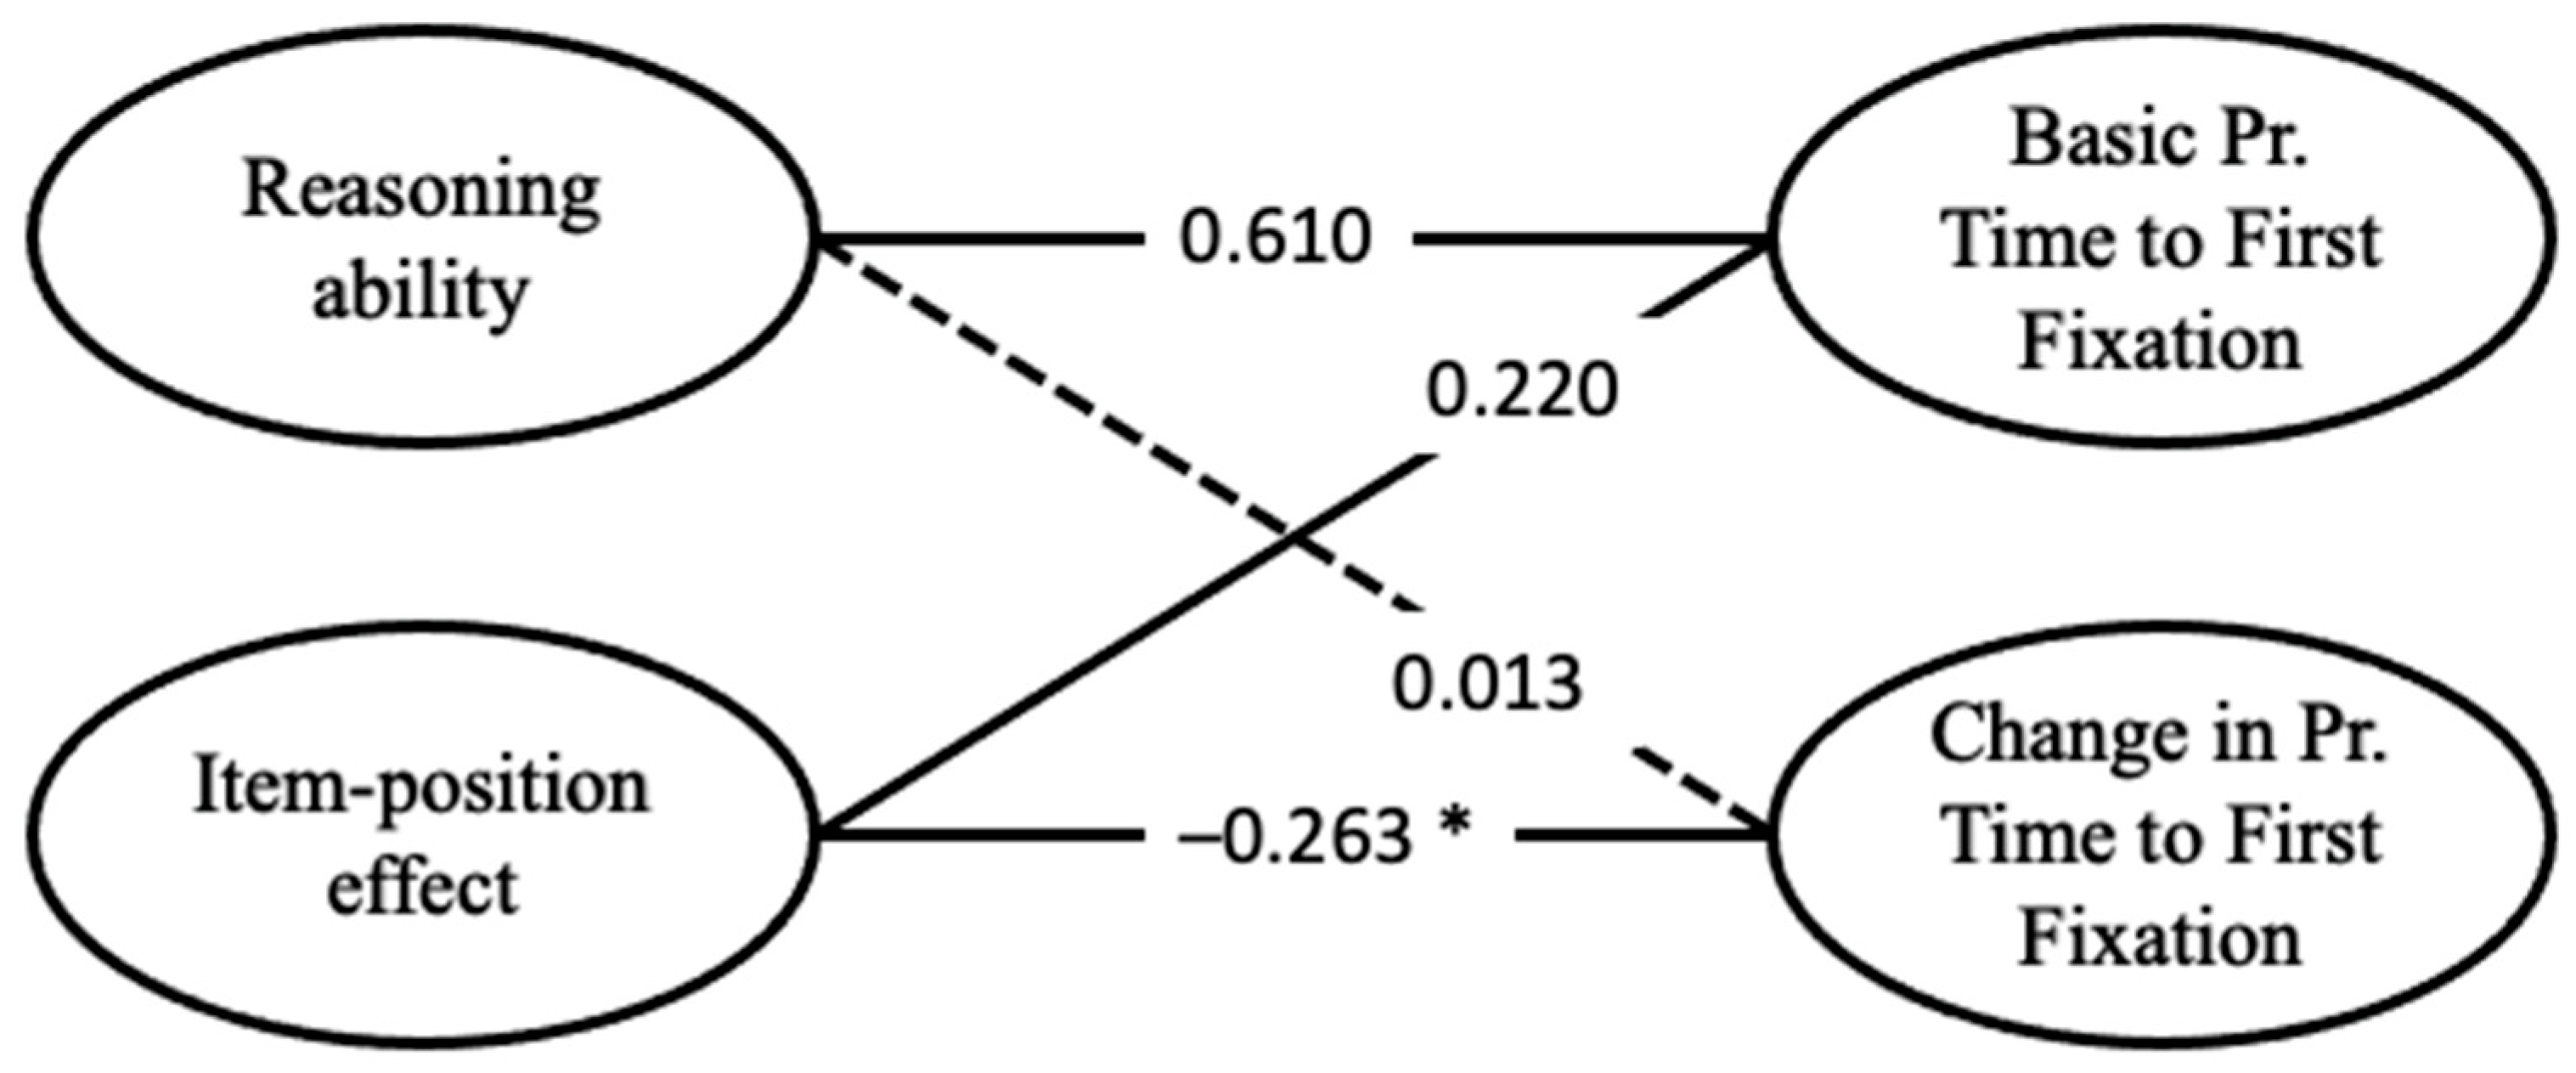
Regarding the full model, including the APM responses and the proportional time to the first fixation on response alternatives, correlations are given in
Figure 13. As with the other two eye-tracking metrics, the latent reasoning variable exhibited a noteworthy positive correlation, with the latent variable capturing the basic proportional time to first fixation on the response alternatives (
r = 0.610,
p < 0.001). Further, the item-position effect was negatively associated with the change in this eye-tracking metric during test-taking (
r = −0.263,
p = 0.019). The negative correlation indicated that a pronounced item-position effect coincided with low factor scores on the latent variable, depicting the change in proportional time to the first fixation on response alternatives. Additionally, the latent variable depicting the basic proportional time to first fixation on response alternatives showed a small correlation with the latent variable of the item-position effect (
r = 0.220,
p = 0.029). This indicates that participants with a pronounced item-position effect also show high values in basic proportional time to the first fixation on response alternatives. Hence, these individuals spent more time investigating the problem matrix before turning to the response alternatives, indicative of constructive matching.
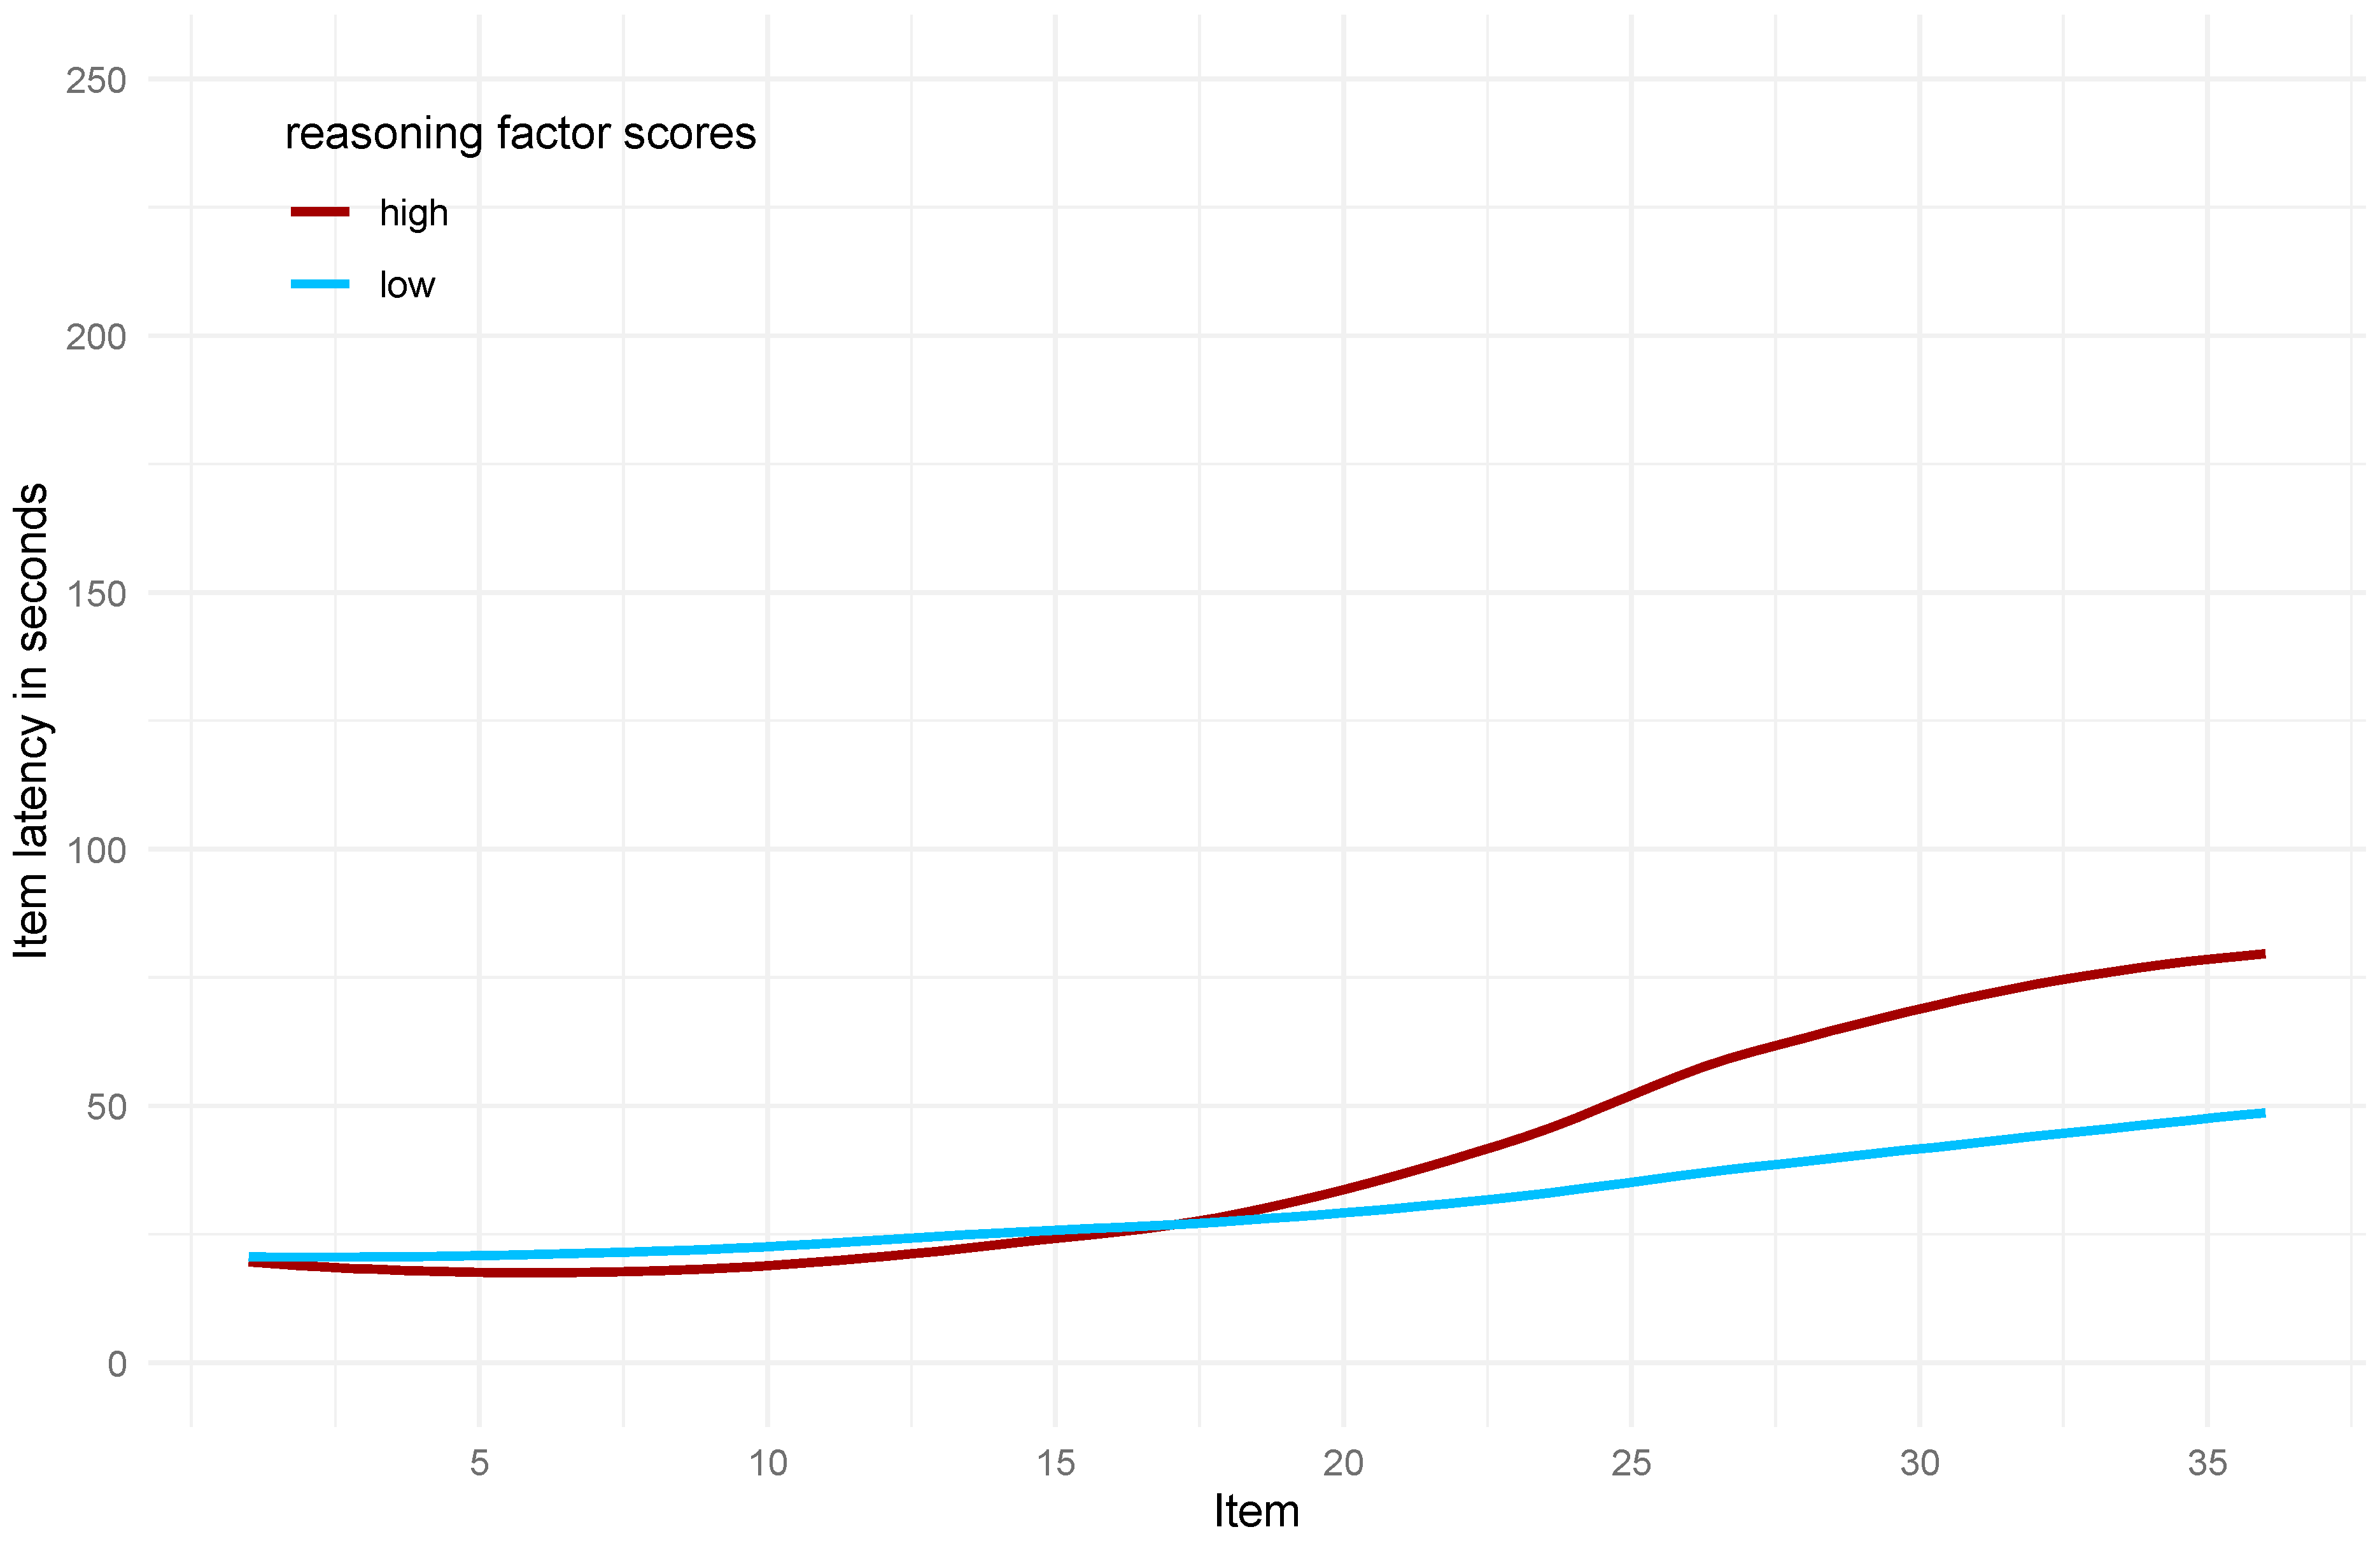
The proportional time to the first fixation on response alternatives is illustrated in more detail regarding the different latent variables in the full model in
Figure 14. The proportional time to first fixation on response alternatives is displayed for participants with the 50 highest (red line) and 50 lowest (blue line) factor scores on the respective latent variable. Panel A shows that participants with the highest factor scores on the latent reasoning variable had a longer proportional time to their first fixation on response alternatives than the participants with the lowest factor scores on the latent reasoning variable. Hence, participants with a higher reasoning ability spent proportionally more time investigating the problem matrix before turning to the response alternatives compared to the participants with a lower reasoning ability. However, this difference became smaller from item to item and disappeared for the last few items.
Panel B shows a similar picture. The difference in proportional time to first fixation on response alternatives between participants with the 50 highest and 50 lowest factor scores on the latent variable depicting the basic proportional time to first fixation on response alternatives became smaller as the test progressed.
Regarding the latent variable depicting the item-position effect, Panel C in
Figure 14 shows that the 50 participants with particularly high factor scores cannot be distinguished from the 50 participants with low factor scores on the latent item-position effect variable regarding their proportional time to first fixation on response alternatives.
Panel D highlights that participants with high factor scores in the latent variable depicting a change in proportional time to the first fixation on response alternatives did not change their proportional time to their first fixation on the response alternatives as the test progressed. Participants with low factor scores, on the contrary, exhibited decreasing values, hence progressively engaged in less constructive matching as the test progressed, since they spent proportionally less time investigating the problem matrix before inspecting the response alternatives.
4. Discussion
The present study had three primary objectives. The first was to investigate the presence of an item-position effect in APM responses. Consistent with prior research (e.g.,
Ren et al. 2014;
Schweizer et al. 2012), a bifactor model—accounting for both reasoning ability and an item-position effect—provided a superior fit to the present data compared to a one-factor model. This confirms the notion that as individuals progress through the APM, additional variance emerges that cannot be attributed solely to reasoning ability.
The second objective was to explore whether individual differences in strategy use and any shifts therein could be captured at a latent level using eye-tracking metrics within a bifactor modeling framework. All three eye-tracking indicators—toggle rate, proportional time on the problem matrix, and proportional time to first fixation on response alternatives—showed a substantial change from the first to the last item, as illustrated in
Figure 6,
Figure 7 and
Figure 8. However, the toggle rate decreased, and the proportional time on the problem matrix increased during the test, indicating that participants adapted their strategy use to more constructive matching. The decreasing proportional time to first fixation on response alternatives, however, suggested that participants used more response elimination as the test progressed.
Given the change in all three eye-tracking metrics, it was not surprising that individual differences could be better explained by bifactor models rather than one-factor models. Such bifactor models account for rather static individual differences across the test (e.g., a basic toggle rate) and a statistically separable increase in differences between individuals as the test progresses (e.g., a change in the toggle rate). More specifically, the latent variables with increasing factor loadings depict increasing individual differences from the first to the last item, indicating that differences between individuals grow from item to item regarding their strategy use. The individual differences in the changes observed in
Figure 6,
Figure 7 and
Figure 8 are represented in these latent variables.
The third objective investigated whether reasoning ability and the item-position effect were related to strategy use and changes therein. Across all eye-tracking metrics, a higher reasoning ability was associated with more constructive matching. This aligns with prior findings that link a higher cognitive ability with (more) constructive matching (
Gonthier and Roulin 2020;
Jastrzębski et al. 2018;
Vigneau et al. 2006). However, reasoning ability did not correlate with the latent variables representing a change in the eye-tracking metrics during test taking
2. This result suggests that the tendency to adopt the strategy used during test taking is independent of reasoning ability.
The results regarding the relationship between the item-position effect and changes in strategy use were somewhat heterogeneous and depended on the operationalization of strategy use. The item-position effect correlated positively with the change in toggle rate but negatively with the change in the proportional time to the first fixation on response alternatives. This indicates that the item-position effect came along with an increase in constructive matching when operationalized by the toggle rate, but with a decrease in constructive matching when operationalized by the proportional time to first fixation on response alternatives. For the proportional time on the problem matrix, no systematic relationship with the item-position effect could be observed. (It should be noted, however, that a positive correlation between the item-position effect and the change in the proportional time spent on the problem matrix emerged for the cut-off at item 27; see
Supplementary Materials).
These results seem to contradict but foremost highlight the possibility that there could be different stages in problem-solving behavior. The contemporary interpretation of a continuous spectrum of strategy use ranging from response elimination towards constructive matching is likely ill-equipped to account for such nuanced problem-solving behavior. This is emphasized by the finding that the toggle rate in the current data indicated an increase, while proportional time to first fixation on response alternatives indicated a decrease in constructive matching as the test progressed. Early fixation on response alternatives focuses on the early stages of problem-solving behavior and possibly captures the individual trying to obtain an overview of the broader problem before investigating the problem matrix in more detail. Therefore, it is possible that, while the proportional time to the first fixation on response alternatives especially accounts for the early processing stage, the toggle rate covers the whole problem-solving behavior, including the first to the last fixation on response alternatives. Hence, the toggle rate includes behavior possibly specific to early stages of problem-solving behavior (e.g., trying to obtain an overview of the problem), actual problem-solving behavior, and possibly an additional final stage of problem-solving behavior (e.g., double-checking the answer before submitting a response). Hence, the discovered discrepancies between the results of the current study highlight the possibility of different stages within problem-solving behavior. Future studies could attempt to account for the specific sequence of eye movement, as in, for example,
Hayes et al. (
2015), and then investigate whether a specific pattern is more likely to lead to an adaption in solving behavior on difficult items.
Another unexpected finding was a significant correlation between the item-position effect and the basic level of proportional time to first fixation on response alternatives—a pattern not mirrored in the other eye-tracking metrics. This metric also showed no correlation with item latency despite all three metrics being adjusted for latency. Prior to adjustment, the three metrics shared different degrees of variance with item latency (
Table 1: the toggle rate showed the weakest relationship (
r = 0.415), time on the problem matrix was the strongest (
r = 0.951), and the time to first fixation on response alternatives fell in between (
r = 0.567)). These differences may also point to different stages in problem-solving behavior and could explain the inconsistent results across metrics and warrant further examination of item latency effects.
Visualization of item latency patterns revealed that participants with higher reasoning ability showed a steeper increase in response time for the more difficult items (from item 17 onwards) compared to those with lower ability (
Figure 15). This divergence persisted until the final items. These findings replicate the results of
Cheyette and Piantadosi (
2024), who reported that, on difficult APM items, the best-performing participants spent about three times as long as the lowest-performing participants. Their results indicate that with increasing reasoning ability, participants modulated their item latencies to a larger degree for difficult items. According to
Perret and Dauvier (
2018), this is also the case in children. In
Cheyette and Piantadosi (
2024), this modulation was gradually smaller in individuals with a lower reasoning ability. Participants with the lowest reasoning scores even seemed to spend less time on difficult items compared to easy items.
Time pressure may play a critical role in shaping such response patterns.
Gonthier (
2023) showed that high-ability individuals modulate item latency less under high time pressure, whereas low or no pressure permits more adaptive timing. In the current study, the three unadjusted eye-tracking metrics exhibited different correlations with the APM test score (number of toggles,
r = −0.159; time on matrix,
r = 0.634; latency to first fixation on response alternatives,
r = 0.440). This highlights that while the three metrics can be used as indicators of strategy use, they seem to be connected differently to reasoning ability, supporting the interpretation that strategy use, item latency, and reasoning ability interact in complex ways. Additionally, the results of
Gonthier (
2023) highlight how time limits differentially impact participants depending on the item’s difficulty and individual reasoning capacity. Hence, it is unclear to what extent the implemented time limit might have influenced item latencies and strategy use in the current study. This limits the generalizability of the present results to reasoning tests administered without a time limit.
Nevertheless, it is interesting that around item 17—the same point at which item latencies began to diverge between ability groups—differences in strategy use also emerged. Participants with strong item-position effects reduced the toggling rate but also showed a proportionally earlier fixation on response alternatives, suggesting a shift in strategy. In contrast, those with weaker item-position effects showed no adaptation.
Liu et al. (
2023) found that high-ability participants increased their use of constructive matching on difficult items, while medium-ability participants maintained a stable level, and low-ability participants decreased their use. They also reported that item difficulty alone did not predict constructive matching, but its interaction with reasoning ability did. By contrast,
Jarosz et al. (
2019), using think-aloud protocols, observed a general decline in constructive matching as item difficulty increased. However, the interaction effect of working memory capacity and item difficulty was not significant in their study. Nevertheless, they found that a higher working memory capacity predicted a higher likelihood of employing constructive matching at the beginning of the test, possibly explaining the mediating role of strategy use regarding working memory capacity and APM performance.
Gonthier and Roulin (
2020), using questionnaire data, similarly reported a decrease in constructive matching as the test progressed, modulated by working memory capacity and motivational factors such as the need for cognition. Their findings imply that individuals with higher cognitive and motivational resources were more likely to maintain constructive matching on difficult items, while others shifted toward less demanding strategies.
These varying results illustrate the difficulty in theorizing about strategy shifts. Differences in methodology (e.g., eye-tracking, self-reports, verbal protocols), APM implementations (e.g., full vs. short versions), and testing conditions (e.g., time limits) may all contribute. Notably,
Liu et al. (
2023) reported an interaction between ability and item difficulty, while
Jarosz et al. (
2019) found no such interaction. The current study also suggests that strategy adaptation may be more strongly tied to the item-position effect than to reasoning ability per se, as no significant correlations were found between reasoning ability and changes in the eye-tracking metrics.
This interpretation aligns with findings that constructive matching can be enhanced through intervention (
Gonthier and Thomassin 2015) and is associated with rule knowledge (
Loesche et al. 2015). Studies show that participants apply constructive matching more often when they are familiar with item rules, suggesting that rule learning facilitates this strategy. As most reasoning tests rely on a limited number of rule types (
Carpenter et al. 1990), mastery of these rules would enable more efficient problem-solving.
Supporting this, studies have linked the item-position effect in reasoning ability measures with rule learning (
Ren et al. 2014;
Schweizer et al. 2021). Experimental work by
von Gugelberg et al. (
2025) showed that introducing new rules after repeated exposure disrupted the item-position effect, further substantiating the rule-learning hypothesis regarding the item-position effect.
Constructive matching requires deeper engagement with the problem matrix, involving systematic rule analysis (e.g.,
Snow 1978). This process likely promotes rule acquisition and supports the continued use of constructive matching. Thus, the observed negative correlation between the item-position effect and change in toggle rate may reflect this interplay between rule learning and strategy adaptation.
However, when analyzing the proportional time to the first fixation on response alternatives, the fixation on response alternatives happened earlier and earlier as the test progressed for participants with a strong manifestation of the item-position effect. This translates to participants spending less time investigating the problem matrix before consulting the response alternatives, as would be typical for response elimination. Hence, in the full model regarding the toggle rate, the item-position effect is associated with behavior assumed to depict more constructive matching, while in the full model regarding proportional time to first fixation on response alternatives with solving behavior is presumably related to less constructive matching. Therefore, it seems likely that the different eye-tracking metrics capture different aspects of the solving process and possibly tap into different abilities and other factors impacting solving behavior to a different degree as item difficulty increases throughout the test.
Unfortunately, the current study design does not allow for a clear distinction between item-position effect and item difficulty, as the APM items are arranged in ascending order of difficulty. While prior studies have shown these effects to be distinct (e.g.,
Schweizer and Troche 2018;
Zeller et al. 2017), their overlap in the current data makes disentanglement difficult. Future research should consider presenting APM items in a pseudo-random order to isolate these factors.
Such designs could also help clarify inconsistent findings regarding constructive matching. While in
Liu et al. (
2023), an increase was observed, other studies reported a decrease as the test progressed (
Jarosz et al. 2019;
Gonthier and Roulin 2020), and the current study found both. It remains unclear whether motivation, disengagement (e.g.,
Nagy et al. 2023), or cognitive resources drive these divergent patterns. These variables may interact with both item difficulty and the item-position effect.
Another issue involves the shape of change captured by the second latent variable in the bifactor models. There is no clear consensus on whether a linear or quadratic function better describes these changes in reasoning ability measures (
Schweizer et al. 2009). In this study, a linear increase provided a better fit for the APM responses across all cut-offs. For eye-tracking metrics, the trajectory varied: the proportional time to first fixation on response alternatives was better modeled linearly, while the toggle rate and time on the matrix followed a quadratic pattern. This suggests the former captures smaller individual differences in later test items, possibly due to its reliance on a single time-based value per item and constraints imposed by the time limit. Future research should explore different functional forms in bifactor models and seek to experimentally elicit specific patterns.
Finally, this study cannot fully untangle the complex relationships between reasoning ability, strategy use, and item characteristics. Previous studies reported different directions regarding changes in strategy use in the APM, with reasoning ability being a valid predictor of constructive matching (
Laurence et al. 2018). Further personality factors, such as the need for cognition (
Gonthier and Roulin 2020) or narcissism (
Birney et al. 2017), could be mediating factors regarding a possible interaction of ability and item difficulty. With the rule-based nature of APM items, it also seems plausible that the ability to learn rules impacts strategy use, yet an experimental design to directly test the assumption will be needed to draw more solid conclusions.
Limitations and Outlook
Although time limits are generally deemed acceptable for maintaining test validity (
Hamel and Schmittmann 2006), evidence from
Gonthier (
2023) suggests that such constraints can bias both item latency and strategy use. In his study, the 10-min time limit reduced constructive matching across all items but not for the 20-min time limit version compared to the untimed version. Further, all versions showed a rather similar decline in constructive matching as the test progressed (the decline for the 20-min version was slightly smaller compared to the other versions). In contrast, the current study observed increasing constructive matching as the test progressed, but additionally, a decrease in proportional time to first fixation on response alternatives. Whether this pattern would persist under stricter time constraints or without a time limit remains unknown. This further highlights the need for a replication of results in an untimed test setting.
It is also important to mention that although constructive matching and response elimination are the most distinct strategies, some studies have identified a third strategy in questionnaire data (
Li et al. 2022) or think-aloud protocols (
Jarosz et al. 2019). It is likely that this third strategy is somewhat of a mix of the two. Nevertheless, it highlights that the strategies assessed here are better understood as continuous dimensions describing the extent or degree of a participant engaging in a strategy rather than binary categories.
To better understand strategy use, future research could integrate cognitive measures such as planning ability (
Laurence and Macedo 2023) or cognitive control (
Braver 2012;
von Gugelberg et al. 2021). Motivational factors should also be considered, as they are known to affect performance, even in low-stakes testing contexts. For example, a detailed investigation of disengagement and rapid guessing (e.g.,
Nagy et al. 2023) could be an interesting avenue to explore. Moreover, the need for cognition could also moderate strategy use and should be assessed alongside other individual differences (
Gonthier and Roulin 2020).
Finally, the meta-reasoning framework (
Ackerman and Thompson 2017) may offer an additional and valuable perspective. It posits that individuals may strategically opt out of answering when problem-solving seems unfeasible.
Law et al. (
2022) found factorial stability for such giving-up or opting-out tendencies. While the tendency to give up showed a moderate correlation with reasoning ability in
Law et al. (
2022), it would be interesting to investigate the effects of such tendencies on item latencies, strategy use, and whether this adaptive behavior is related to the item-position effect.
In summary, this study reinforces the view that performance in reasoning tests not only reflects reasoning ability but also dynamic processes, including individual differences in ad-hoc learning, strategy adaptation, or even different stages within problem-solving behavior. The item-position effect may serve as a valuable marker of such processes and deserves closer theoretical and empirical attention, as in the current study, changes in strategy use during test taking were more consistently related to the item-position effect than reasoning ability itself. Integrating psychometric modeling with methods like eye tracking, augmented by, for example, think-aloud protocols, offers a promising avenue for uncovering the cognitive mechanisms underlying problem-solving behavior and reasoning test performance.


