Article

Analysing the Influential Parameters on the Monopile Foundation of an Offshore Wind Turbine

by
Adrien Jacomet
1,2,
Ali Khosravifardshirazi
1,
Iman Sahafnejad-Mohammadi
3,
Mahdieh Dibaj
1,
Akbar A. Javadi
1 and
Mohammad Akrami
1,*
1
Department of Engineering, University of Exeter, Exeter EX4 4QF, UK
2
École Nationale Supérieure de Mécanique et d’Aérotechnique (ENSMA), 86360 Chasseneuil-du-Poitou, France
3
Department of Engineering, Science and Research Branch, Azad University, Tehran 1477893855, Iran
*
Author to whom correspondence should be addressed.
Computation 2021, 9(6), 71; https://doi.org/10.3390/computation9060071
Submission received: 6 April 2021 / Revised: 19 May 2021 / Accepted: 9 June 2021 / Published: 12 June 2021
(This article belongs to the Section Computational Engineering)

Abstract

:
Countries around the world generate electricity from renewable resources to decarbonise their societies and reduce global warming. Some countries have already outlined their wishes to produce a part of their total energy consumption from renewable sources in the coming years and gradually reduce the use of nuclear energy and fossil fuel in favour of cleaner fuels. While renewable energies are significant factors in tackling climate change, the parameters that can influence their performance should be analysed in detail during the design process. One of these parameters is the foundation of an offshore wind turbine. Offshore wind turbines allow more energy to be produced than an onshore installation, and do not have any harmful effects on human beings, while their geotechnical aspects need to be clearly determined in advance. In this study, the influential parameters such as soil type, the number of bolts in the design, and the size of the structure were analysed using the finite element method for three different designs. The simulations showed that some soil properties, such as cohesion, do not influence the results, while Young’s modulus has a large influence on the designs. Additionally, the results of this study showed that the maximum stress concentrations are at the bolts and connection joints where they are too close to the steel’s yield stress. It also proves that the non-elastic behaviour of the soil does not require to be assigned for such analyses and it can be simplified only with its elastic behaviour. The embedded length affects the lateral displacement, while the number of bolts influences the structure’s resistance to external loads.

1. Introduction

The last decade has seen increasing use of renewable energy globally [1]. Power production in some countries is mostly provided by green energy to have a sustainable development [2] using solar panels, hydropower, wind turbines, etc. One of these sources of energy is wind. Usually, an offshore wind turbine is designed for a lifetime of 20 or 30 years [3]. During that period, the structure is subjected to several extreme conditions, including weather conditions (such as waves, currents, wind), earthquakes, and loads due to the rotation of blades. The principal difference between an offshore and onshore construction is the combination of wind and wave loads on the structure, which implies a higher level of constraints, especially for extreme weather conditions. The choice of the type of foundation and the design process is a complex task because it strongly depends on the geographical location and soil properties.
The foundation of an offshore wind turbine is the structure whose primary function is to sustain the tower and transfer loads to the surrounding soil. Due to the huge forces that can be applied to both wind turbine and foundation, a detailed design of the foundation is necessary to avoid the failure of structures and ensure the wind turbine operates correctly. However, resistance to loads is not the only design criterion. The natural frequency of the whole assembly is another significant parameter [4] because it is very close to the rotor, blade-passing, wave, and wind frequencies, and it must never be equal to any of these [5], in which case, resonance may occur, causing severe consequences, up to the failure of the structure. Over the last 30 years, several studies have been carried out on foundations under lateral loads [6,7,8,9,10,11,12,13,14,15,16,17].
There are a few different types of design for wind turbine foundations. Aside from their design, not all of those foundations can be used in the same water depth [18]. Additionally, the depth of the seabed is usually a limiting parameter in the installation of offshore wind turbines. The two main types of foundations are fixed [10,19] and floating ones [20,21]. Conventional turbines used in offshore power farms should be installed at a fixed depth of fewer than 40 m [22]. In most areas, the installation of these turbines cannot be more than 30 km from the beach [23], but this is different for floating turbines [24]. Not only the costs of the infrastructure and foundations of floating principles are high, but also there is a high total charge differential between floating and fixed offshore wind plans. Therefore, the most common foundation is the fixed one [19], but research about floating structures has improved over the last decade [11,25,26,27,28,29]. In terms of structure, there are several types of foundation structures [30]: gravity [31], monopile [32,33,34], tripod [35,36,37], jacket/lattice structure [38,39,40], tension leg with suction buckets [41] and buoy with suction anchor [42,43].
The gravity foundation is a large ballast-filled concrete directly lying on the seabed [44]. As this foundation ensures the stability of the wind turbine with its weight, it can only be used in water up to 15–20 m depth [45], and environmental loads [4] (such as wind and wave loads) must be small. Although it is easy to build the support structures for gravity foundation turbines, these supports have relatively low resistance against the forces [24]. It is worth mentioning that gravity-based turbines need adequate load-bearing capability to carry the self-weight, environmental loads, and service bars operating on the base of constructions [24] and its interaction with soil. Furthermore, the large size of these foundations implies a manufacturing cost higher than other types of foundation [46].
The monopile is simpler than the gravity base. It is a cylindrical pipe with a constant large diameter that is drilled or driven into the soil. The foundation can be divided into two parts: the foundation, which is the region embedded in the soil, and the substructure that corresponds to the part above the seabed. The aerodynamic and hydrodynamic loads (essentially due to waves and wind) are transferred as bending moments [47] and shear loads to the whole structure, and are then transferred as lateral loads to the soil. A monopile foundation uses a transition piece that connects the tower of the wind turbine and the monopile. This transition piece, and especially the way it is connected to the monopile, is mentioned in a few studies [48,49]. The monopile can be used in water depths up to 30 m [50]. Monopile foundations are the simplest ones to manufacture and install, and also their efficiency and conformable constructions have been proven [51]. It is also possible to cut the pile into different parts to change the length and adapt the foundation to the soil type. Thus, the monopile foundation allows high flexibility in terms of maintenance. It is also possible to use extra-large (XL) monopiles [52], which are foundations with a larger diameter than normal monopiles, but the cost of these XL monopiles is prohibitive. These XL foundations have a diameter exceeding 7 m [52]. However, monopiles also have a few disadvantages. First of all, the mass to stiffness ratio is fairly high, which might result in a natural frequency close to the rotor speed frequency [5], leading to some fatigue issues. Furthermore, this type of foundation provides a more prominent maximum deflection at the top of the wind turbine than other foundations. As it is a cylindrical structure, it is also sensitive to hydrodynamic loads, especially XL monopiles due to their larger diameter. Although this foundation structure has been used extensively for offshore wind farms [53], nevertheless, further accurate design techniques are required to decrease the weight and needed embedment of the monopile base [24].
A suction buckets type foundation does not require any heavy equipment for piling or installation. It is an economical foundation technique because it can be installed very quickly with a simple procedure, but the ultimate capacity of this foundation is sensitive to the skirt length of it.
One of the most common foundations is the tripod. It is better attuned to the monopile because it is made of three monopile foundations. The difference between it and a simple monopile is that it can be used in deeper water [4] (up to 40–45 m) and it offers a lower tower deflection [13]. Even though it offers better results than the monopile, this kind of structure is more expensive to build and its installation is more complex. Multipod (tripod and jacket) can provide the required strength and stiffness, but tripod and jacket structures are effective in transitional water depths with relative short penetration length. Jacket’s structure is used in very deep water (45–50 m) and is also used when monopiles provide huge deflection [54]. The geometry is more complicated as it is a truss structure [8,55]. However, the cost of this structure is much higher than the monopile, mainly because it uses more materials and the installation time is longer.
The foundation of a wind turbine is more complex in deeper water. For shallow water up to 30 m depth, structures are relatively simple because special structural reinforcements to support loads are not required [44].

2. Materials and Methods

2.1. Design Criteria of Wind Turbine

In this study, the influential parameters such as soil type, number of bolts in the design and the size of the embedded structure on the offshore wind turbine’s monopole foundations are analysed by developing finite element models using ABAQUS software (SIMULIA, Providence, RI, USA) in three different types of design (see Table 1).
This study is divided into two main parts: A first simple model assumes that the monopile and the transition piece are a single part, made of the same material, and a more complex model includes a more detailed design of the transition piece and the connection with the monopile and the tower. To ensure the proper functioning of the wind turbine and to avoid excessive displacement, the deflection at the top of the tower should not exceed a limiting value. This value is limited to 1.5% of the height above the seabed, which is 1.65 m in this study. Furthermore, structural behaviour should be in the elastic domain of the material. This means that the maximum stresses throughout the whole structure must be less than the yield stress of the steel to avoid any permanent deformation.
During the operating time of the wind turbine, its structure is subject to millions of cyclic loads, so they should be well designed in order to have a natural frequency of the tower that matches with a specific range of use. Indeed, this frequency must not be equal to certain values to avoid the occurrence of the resonance phenomenon, which could have catastrophic consequences for the structure. The natural frequency should never be equal to the wave or wind frequencies, but these are not the most important frequencies. When the wind turbine is functioning, the blades are rotated at a specific velocity, which implies a gyroscopic effect. This effect causes a frequency called rotor frequency (usually called 1P) [56]. Furthermore, the turbine causes other excitation due to the blades passing the tower, with a frequency three times larger than the rotor frequency, thus 3P [57]. These two frequencies are critical criteria for structural stability designing of an offshore wind turbine [58].
Generally, three different types of design are now possible:
  • The natural frequency is less than the 1P frequency. This range is called the soft–soft field [59]. In this case, the structure is too flexible, and in this range, the frequency might be closer to the waves’ frequency and consequently lead to resonance.
  • The natural frequency is higher than the frequency of the 3P blade. This is a stiff–stiff range. This situation leads to a structure that is too rigid. This is unfeasible because the tower would be too heavy and too expensive.
  • The natural frequency is between the 1P and 3P frequencies. This is a soft–stiff range. This range is the best design case. The frequency is fairly far from the wave and wind frequencies, and will lead to the best design.
The natural frequency highly depends on the structural design and the material properties, and the soil’s properties have effects on the foundation design. Therefore, they can give a logical estimate of the foundation stiffness. The type of soil into which the foundation is driven is a significant parameter that may have consequences on the tower deflection and the fundamental frequency.

2.2. Geographical Location

The wind turbine location chosen for this study is station 44,012 located in the New Jersey offshore area. This specific location has been chosen due to the public data being fully available. Those data are collected by the National Data Buoy Center, which is the first source of meteorological and oceanographic measurements for the marine environment.
The wind speed was assumed at the height of 13.8 m above the sea surface level and is an average of the velocity for eight minutes. The data obtained for waves (period, significant height, etc.) are an average of every wave for 20 min. All these data were collected for a ten-year return period. Two different situations are considered: the normal operation state, which is related to the average over ten years, and the extreme sea state, which corresponds to the highest values obtained during these ten years. These two phases are shown in two conditions in Table 2.

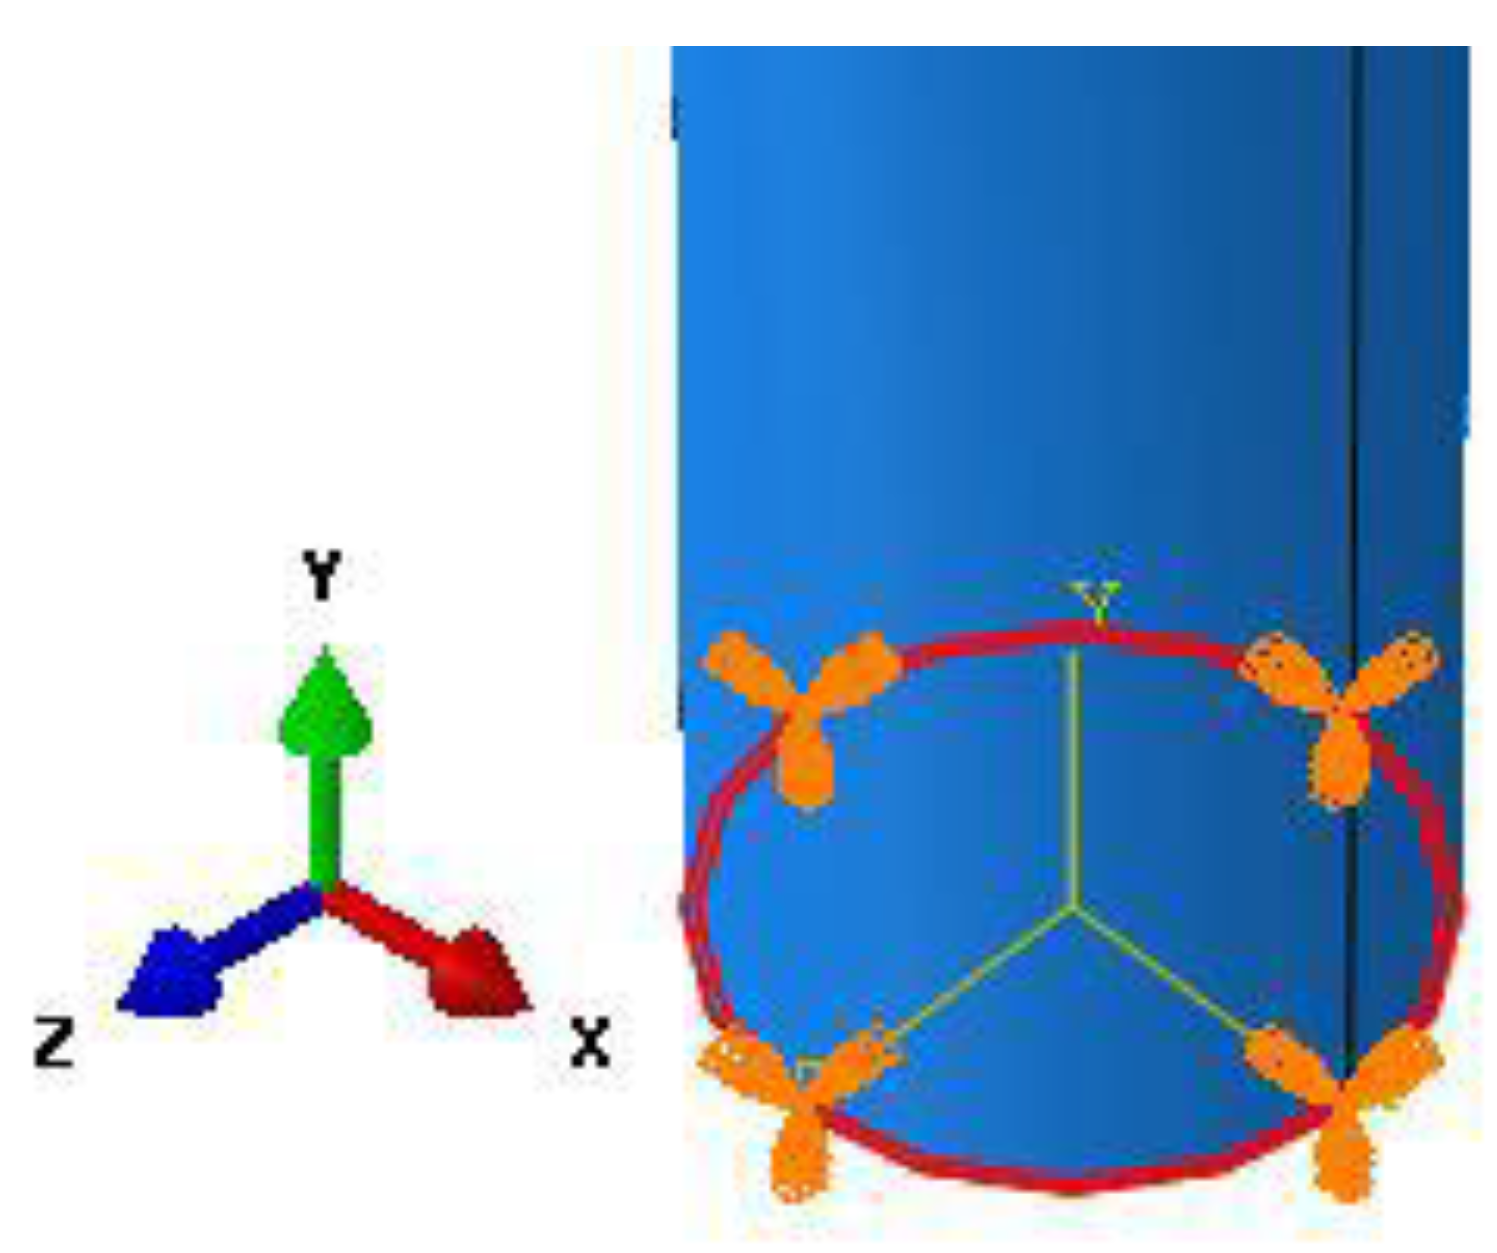
2.3. Loads on the Structure

Two main types of load were assigned on an offshore structure: dead loads and environmental loads. Dead loads are loads due to the weight of the structure and have a constant value during the operating life of the structure. Environmental loads are due to climatic conditions. The most important environmental loads are wind, wave, and current force. However, some other loads may be added, such as impact from a boat or an iceberg, but these are rare events and will not be taken into account in this study.

2.3.1. Aerodynamic Loads

When modelling the effect of the wind on a structure, two velocity profiles are commonly used: logarithmic profile and a power-law. It has been proven that results are quite similar in both of these profiles [60], so a power-law will be used. This law only requires knowledge of the wind velocity at a specific height z0 [61]:
V_wind (z) = VG (z/zG)
where V_wind (z) is the mean wind speed at height z, VG is the gradient-wind velocity and zG and α = 0.14 [62] are related to ground roughness.
When the wind passes through the wind turbine, blades are rotated, which creates a thrust force at the hub. Assuming a stationary and incompressible airflow and using Froude’s theory, the thrust force can be approximated by the following equation [62,63]:
F _ rotor = 2   ρ air   S _ rotor   U 2   a ( a 1 )
where a = 1 3 is the induction axial factor, ρ air is air mass density S_rotor = πR2 _rotor and U is the mean wind speed at Z h u b = 90   m (hub height) in this study.
When the wind speed is greater than 25 m/s, the mechanical breaks will stop the blades to avoid the failure of the rotor [64]. In this case, the rotor force can be expressed using the blade shape equation:
F _ rotor = 0.5   ρ air   S _ rotor   U 2   C b
where C b = 0.3 is the blade shape coefficient.
Note that the rotor force will be larger in the situation where blades are not rotated.
Furthermore, the wind also acts on the tower structure of the wind turbine. As the wind intensity varies with height, this load is not a concentrated force like the rotor force, but a distributed load (force per unit length) along the tower [65]:
F _ tower z = 0.5   ρ air   A   U 2   C d
where A is the surface area of the body with Cd the coefficient of drag of a circular section, which depends on the Reynolds number and is set to 0.7 according to the international accredited registrar and classification society (DNV-GL) recommended practice for marine operations [66].

2.3.2. Hydrodynamic Loads

Another very important load when studying offshore structures is the wave load [67,68]. In extreme conditions, the waves’ strength may be very high, and it can induce a significant force on the structure. It is well known that the sea state is fluctuating all the time, and generally hydrodynamic loads on a cylinder are applied in each direction (X, Y and Z). In order to simplify the model, it has been assumed that wave load is only along the X-direction. The Morison equation is used to evaluate this force acting on submerged structures [69]. To apply this equation, the diameter of the monopile should respect specific conditions. Indeed, the diameter D P of the foundation should be less than 0.2λ, with λ being the wavelength. Assuming that the wave propagates in the x-direction, in a sea of a constant depth, the velocity of the wave can be expressed by the following equation [70]:
U w a v e ( z , t ) = H ω 2 cosh   ( k ( z + d ) ) sinh   ( k d )
where H is the maximum wave height, ω = k g tanh   ( k d ) [71] is the pulsation of the wave, k = 2 π / λ is the wave number, g is the acceleration of gravity, and d is the water depth. Then, considering a small element of thickness dz, the Morison equation is:
d F = [ 0.5 C d D p ρ w a t e r   U   ( z , t ) | U   ( z , t ) | + C m ρ w a t e r π   D p 2 4   Ů   ( z , t ) ] d z
where Dp is the cylinder diameter, ρ w a t e r = 1025   kg / m 3 is the density of water, Ů(z,t) is the acceleration of water [72],   U ( z , t ) = U w a v e   ( z , t ) + U c u r r e n t is the velocity of the fluid, and U c u r r e n t = 1   m / s is the current speed which is considered constant in this study. Finally, C m = 2 is the inertial coefficient and C d = 1 is the drag coefficient: these values are deterministic values [71,73]. Note that this equation is the sum of two components: the first one is a drag force whereas the second component is an inertial force. However, the wave force will be used as a force per unit length along the foundation, and by using the expression of the wave’s velocity in the Morison equation, the wave load per unit length is described by the following equation:
f w a v e ( z , t ) = 0.5 C d ρ w a t e r D p H 2 ω 2 4 sinh   ( k d ) 2 cosh ( k ( z + d ) ) 2 cos ( ω t ) | cos   ( ω t ) | C m ρ w a t e r π D P 2 H ω 2 8 sinh ( k d ) cosh ( k ( z + d ) ) sin ( ω t )
As in every study of a complex structure, some simplifying assumptions must be made in order to obtain numerical results within a reasonable simulation time. Obviously, these are assumed in order to obtain accurate results. In the first case, it has been assumed that the monopile and the transition piece are as one piece. Additionally, the connection between the foundation and tower has been simplified to a simple continuity of both cross-sections. All the equipment on the structure, such as work-platform, external tubes, ladders or bolts, have been omitted. The rotor and nacelle assembly is not designed. It has been replaced by its equivalent pressure load operating at the top of the tower. The following study is divided into two parts: the first model does not take the soil into account, while a more realistic model takes the soil into account.

2.4. Geometric Features

Even if foundation and transition pieces are considered as one part, this model can also be divided into two parts: the first part is a cylindrical pipe with constant diameter extending up to the sea surface, and the second part is a cylindrical pipe with a variable cross-section which is used to connect the monopile and the tower. The bottom section of this transition part corresponds to the monopile cross-section and the top section corresponds to the bottom section of the tower.
The water depth is considered 20 m in all cases. The diameter of the monopile is chosen to be equal to 7 m. This is a relevant choice due to the chosen wind turbine in this study (more details in the next subsection). Once the diameter is chosen, the wall thickness of the pile can be expressed as a function of this diameter, according to the following equation [74]:
t p 6.35 + D p 100
where Dp is the pile diameter in cm. Therefore, in this case, the wall thickness must be greater than 6.42 cm. Due to the wind turbine chosen, the wall thickness has been chosen to be equal to 13 cm, to ensure a better stability of the structure under extreme conditions.
Both tower and foundation are made of steel S550, which is a high yield stress steel. The Young’s modulus E is 210 GPa and Poisson’s ratio ν is 0.3. For the monopile, the density ρ of the steel is 7800 kg/m3. It has been decided to use a density of 8500 kg/m3 for the tower to account for bolts and nuts that are not designed but still present in reality. The yield stress Re of this steel is 550 MPa.

2.5. The NREL 5MW Turbine

The National Renewable Energy Laboratory’s (NREL) 5MW baseline wind turbine has been chosen for the whole study. This is a conceptual wind turbine created by the NREL [75,76] to be used as a reference model for research teams throughout the world. It is a 3-blade wind turbine, with a power of 5MW. The radius of each blade is 63 m, and the rotor height is 90 m above the sea surface level.
To ensure the safety of the tower and all the components of the structure, the wind turbine cuts off when the wind speed exceeds 25 m/s. Table 3 summarises the main characteristics of the wind turbine.

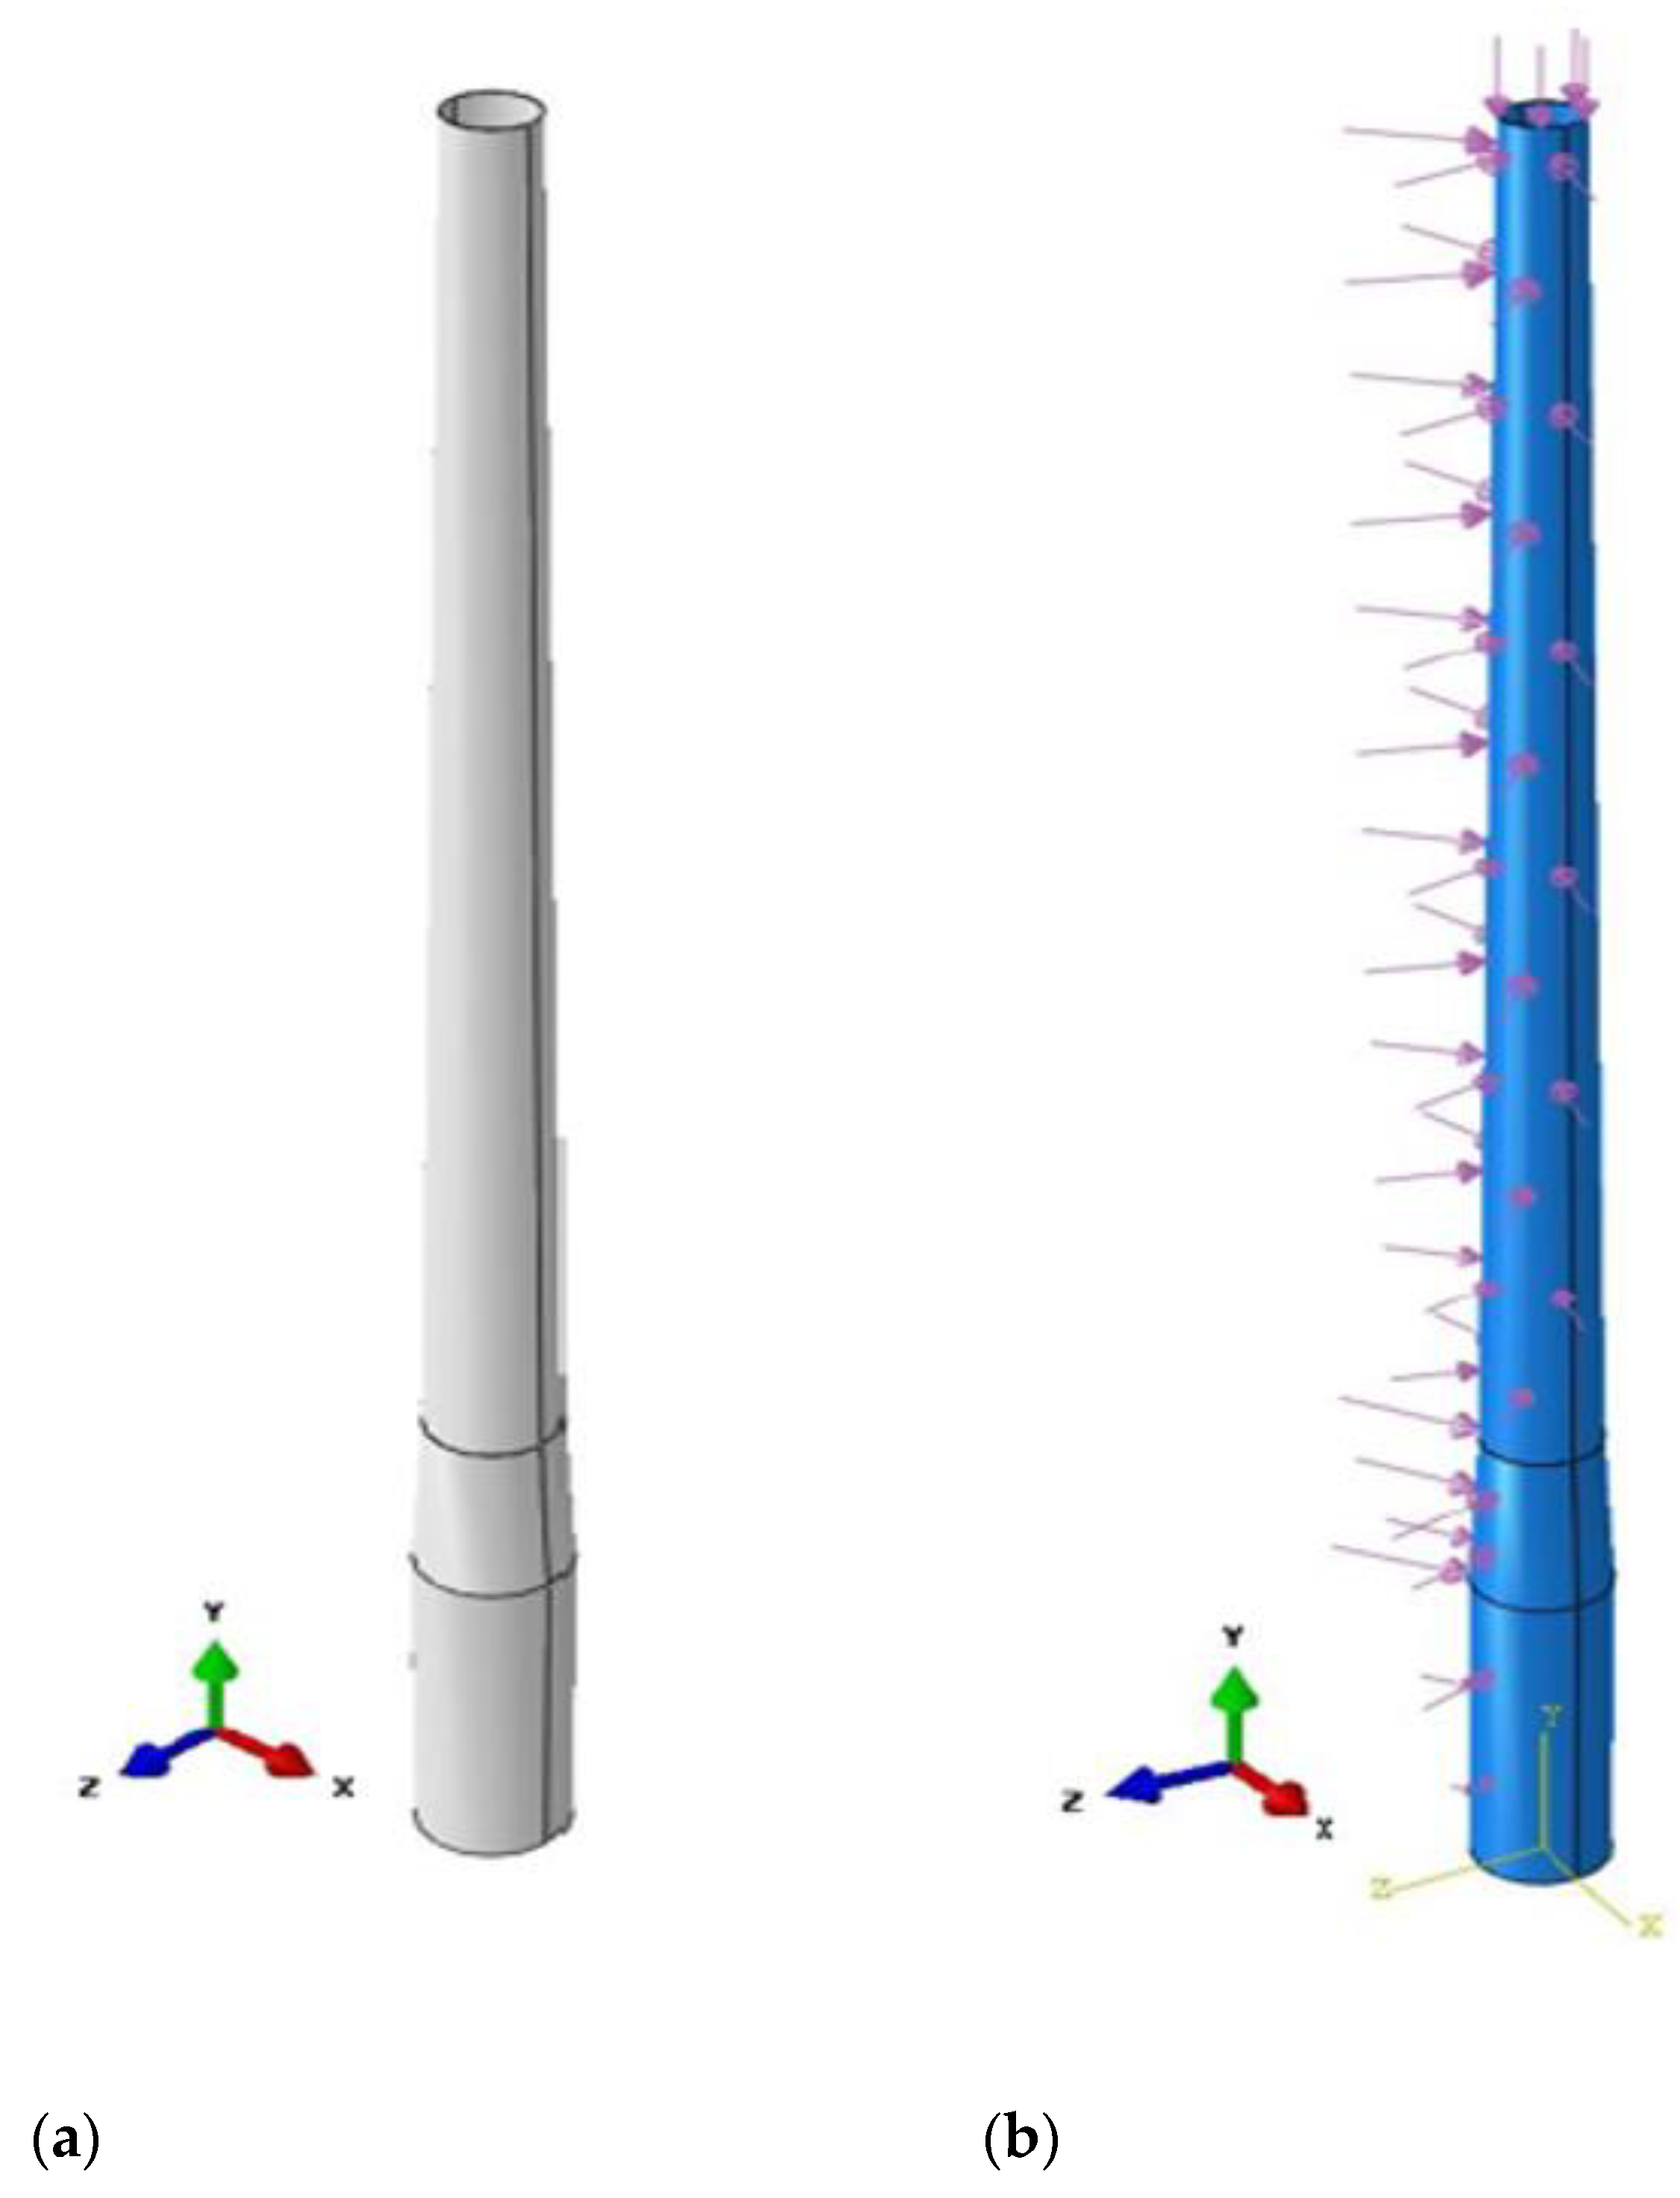
2.6. Design 1: 3D Design without Modelling the Soil

The entire numerical analysis has been carried out using the finite element software ABAQUS. The model created with ABAQUS is shown in Figure 1.
The different loads (wave, weight and nacelle weight) have been applied as pressure loads to the relevant surface. The rotor force has been modelled as a concentrated force applied at the top of the tower. To model this force, a reference point was created and “tied” to the top surface of the tower. The weight of the structure has also been modelled, as a gravity load in ABAQUS. Furthermore, the lateral loads (due to waves and wind) are applied on only half of the structure and oriented in the opposite direction of the Z-axis.
As the soil is not modelled in this part, the bottom face of the monopile is embedded, which means it has no degrees of freedom, as shown in Figure 2.
One of the most important parts when conducting a finite element analysis is the mesh with the choice of the element type. The size of the mesh also has a significant impact on the accuracy of the results. Indeed, the smaller the mesh, the better the results. To ensure the results are sufficiently accurate and to avoid an overly long simulation time, a mesh convergence analysis was carried out to choose the mesh size. Finally, the selected value of the global mesh size for the whole model was 0.75 m. The element type is C3D8, and this is an 8-node linear element.

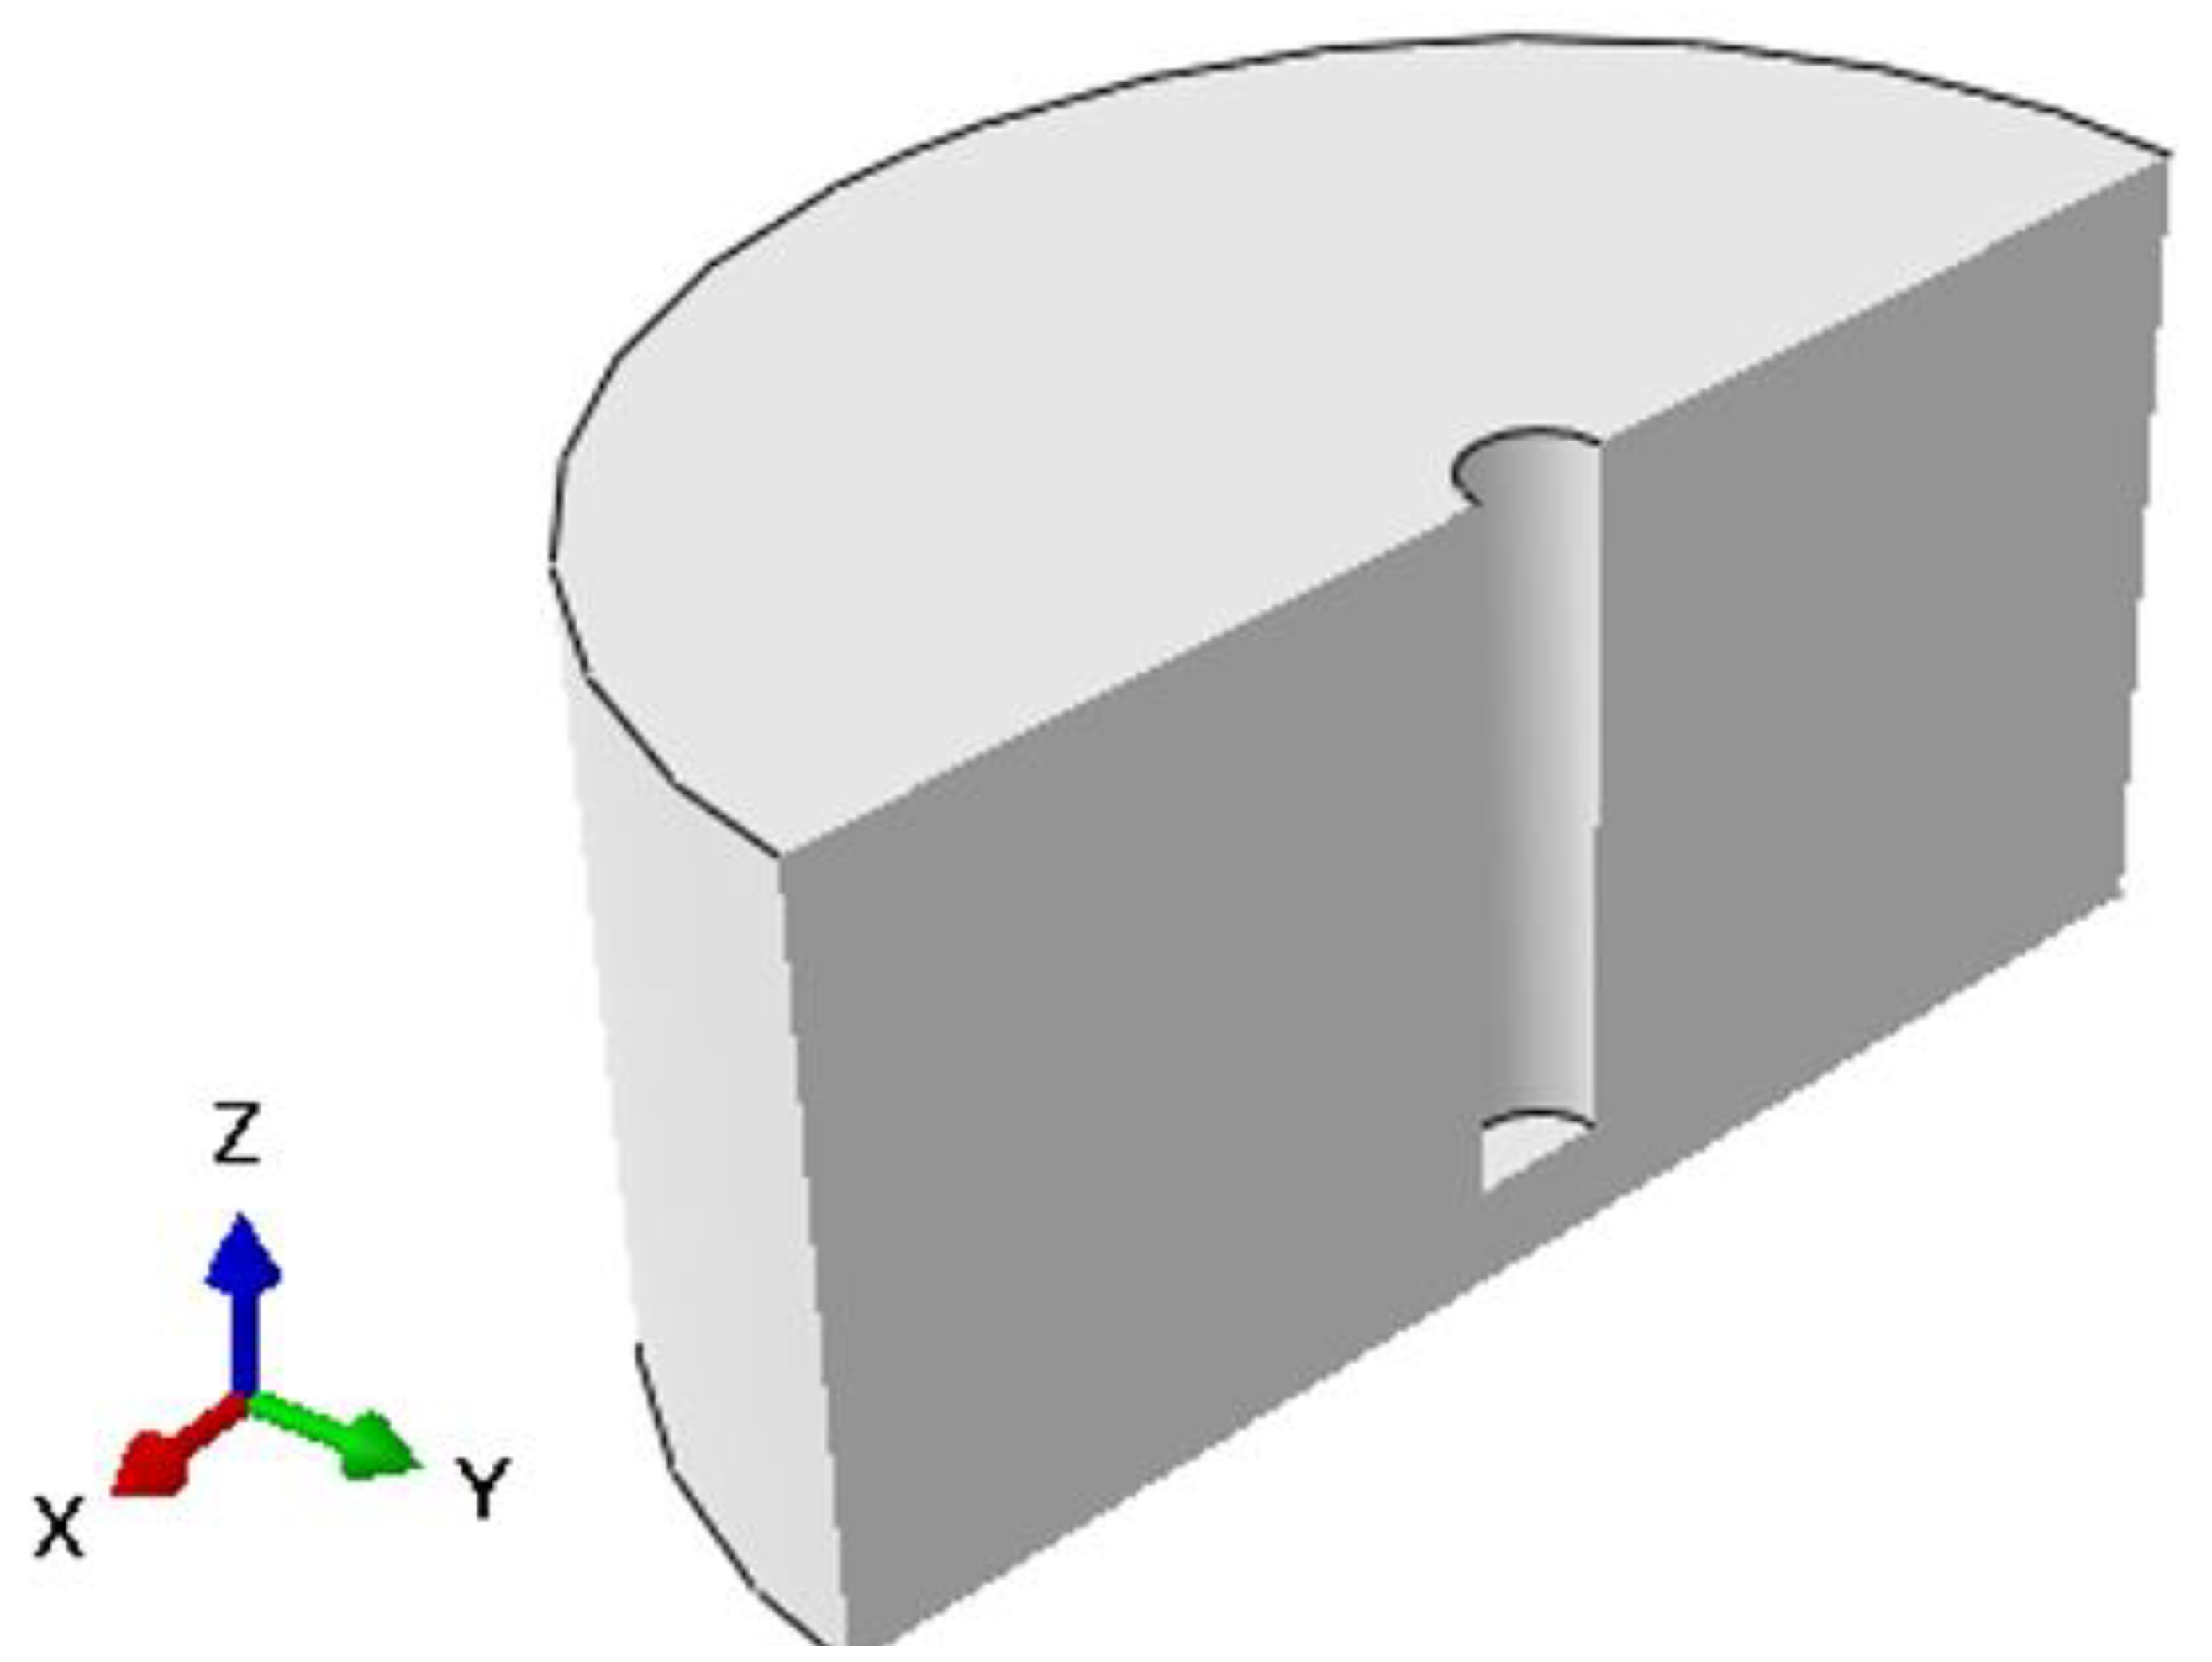
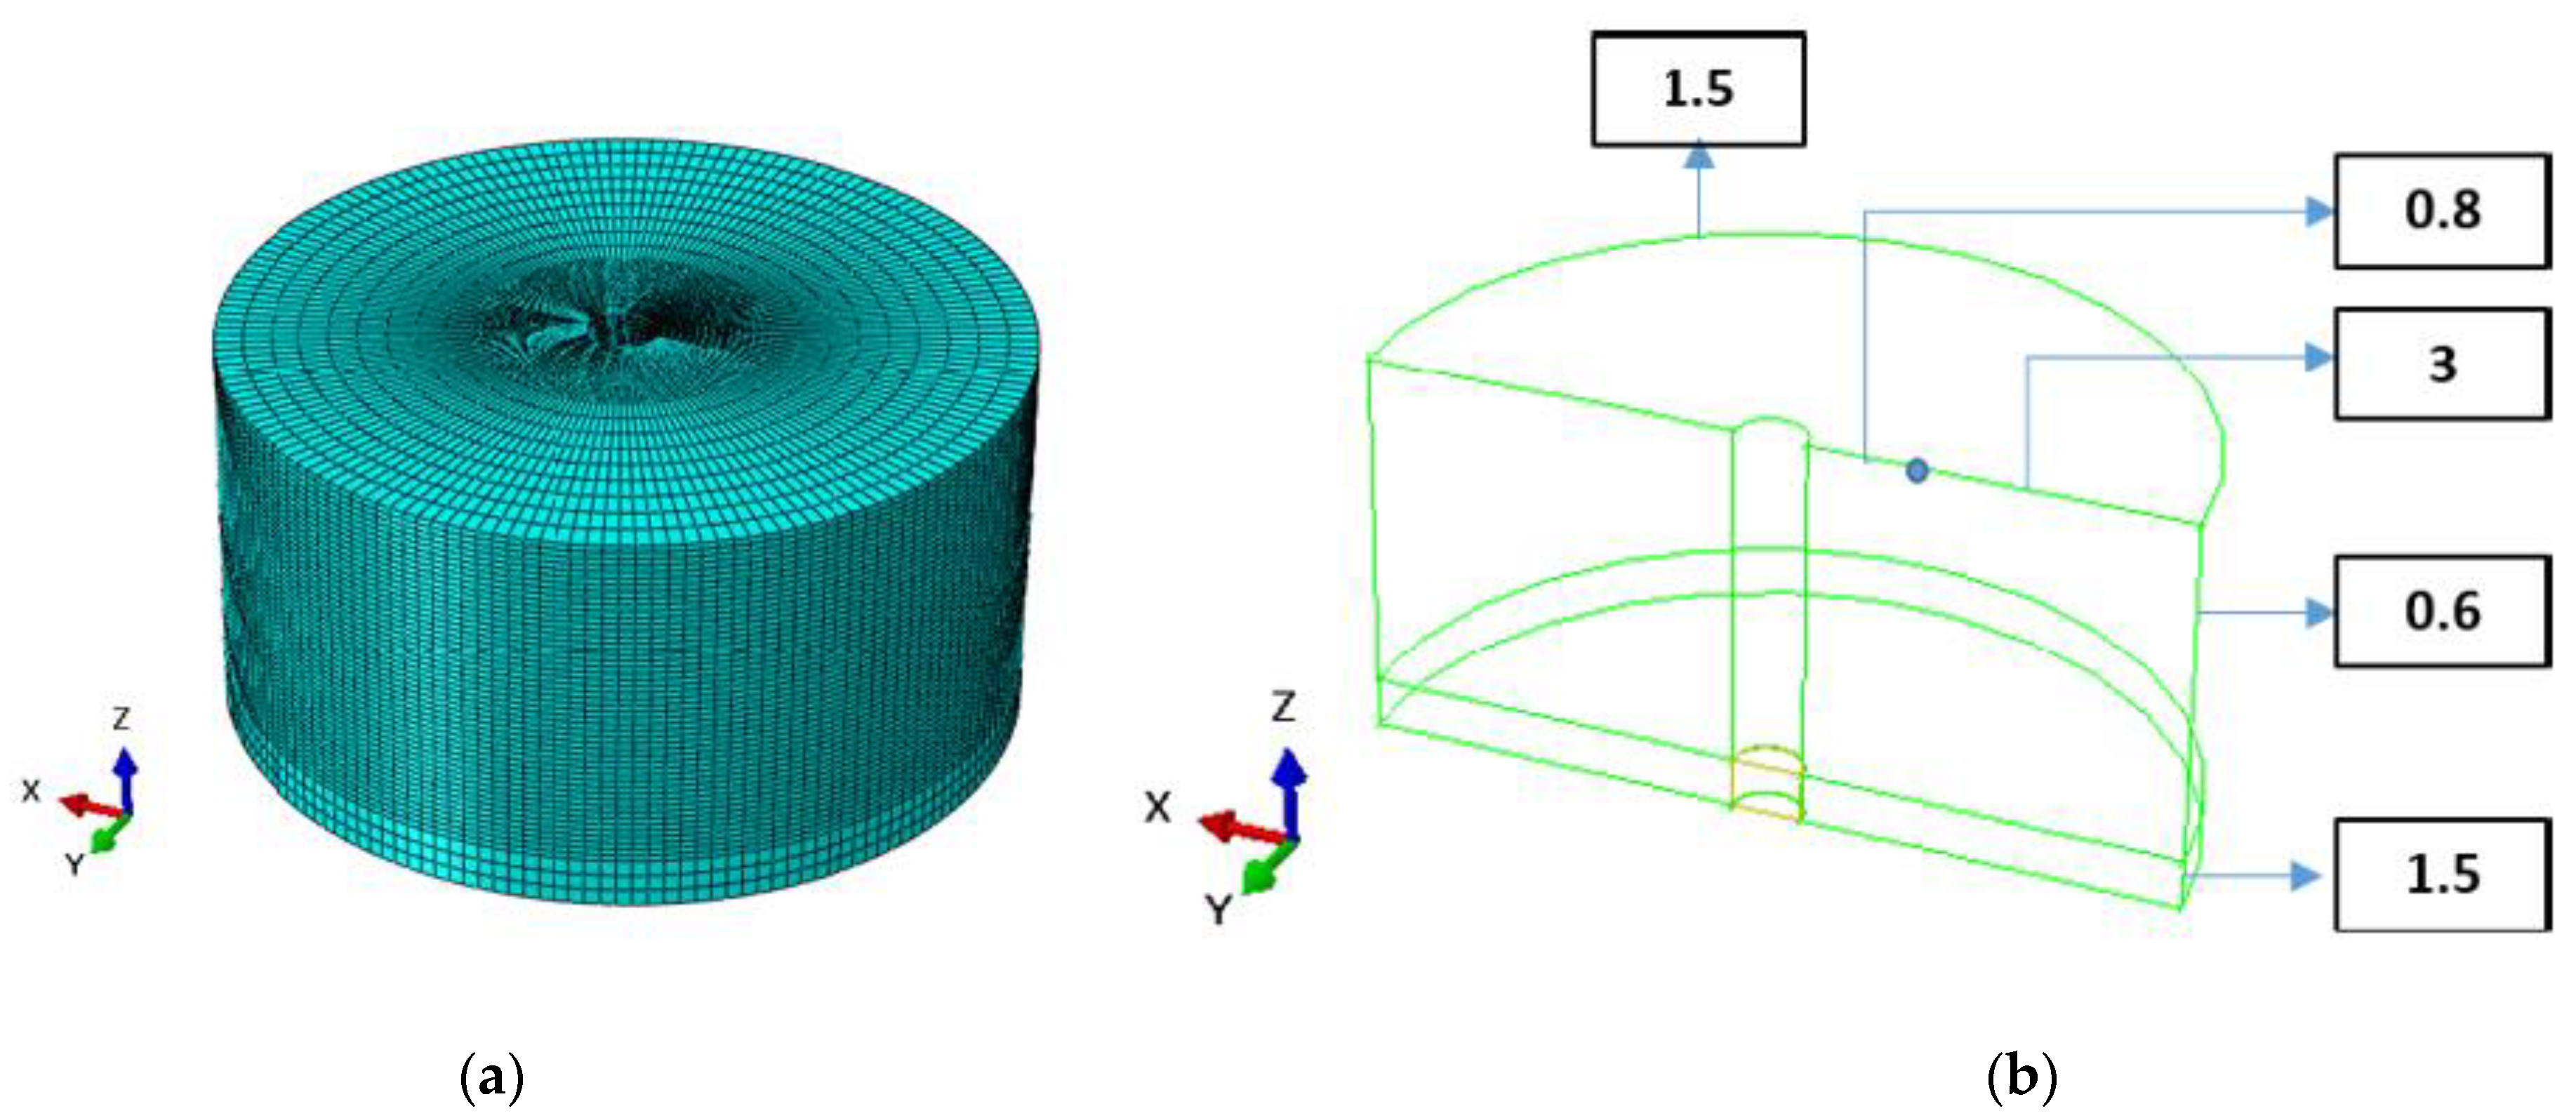
2.7. Design 2: 3D Design with Modelling of the Soil

In order to have a model that is closer to reality, the soil has to be modelled. Indeed, the interaction between the soil and the structure is very important and may have consequences for the results. Generally, soil behaves differently to solid structures made of steel or concrete. Most of the time, the behaviour of soil is non-linear and some plastic deformations may occur under loading. Additionally, soils are generally non-homogeneous and anisotropic.
The type of soil and its properties are very important and may have huge effects on the accuracy of the results. In this paper, only clay and sand soil are studied. The soil parameters used are presented in Table 4.
The embedded length of the monopile in the soil has been set to 35 m according to the literature review for this type of foundation. The soil is modelled as a cylinder with a radius of 40 m and a depth of 40 m below the seabed. In order to avoid any adverse boundary effects, the radius of the soil should be more than 10 or 11 times the radius of the monopile: so, greater than 35 m in this case. In the middle, there is a hole with a radius of 3.5 m radius and a length of 35 m to model the space where the monopile will be driven into the soil.
Two different boundary conditions have been applied to the soil. The bottom has been embedded, and so no degrees of freedom are free. On the sides, only displacement conditions along the Y-direction and X-direction (U1 = U2 = 0 in ABAQUS) were considered. Then, the contact between the soil and the foundation was defined as a surface-to-surface interaction and the friction has to be taken into account in the model. Two areas are in contact, the first being the side of the monopile with the surrounding soil and the second concerning the bottom of the soil. For both contacts, normal and tangential behaviour must be defined in ABAQUS (Figure 3).
For the side interaction, the normal behaviour has been used as “hard” contact and the separation after contact (when loads are applied) is allowed. A cohesive behaviour has also been defined for the monopile. The tangential behaviour is used as a penalty, and a friction coefficient of 0.5 has been used [77]. A small sliding formulation has also been used. For the second interaction, the normal behaviour is still used as “hard” contact but the tangential is used as frictionless and a finite-sliding formulation is used. It has been decided to “tie” the bottom of the monopile with the soil.
Note that for both interactions, a surface-to-surface discretisation has been used. The soil was used as a slave surface and the monopile as a master surface. The element type for the structure is still C3D8. Otherwise, the soil was modelled with the C3D8P element, which is an 8-node brick element including pore pressure degree of freedom.
As contact is defined, the mesh size is more important here. The global size for the structure was set to 0.75. As shown in Figure 4, the soil is divided into three parts. The first is the area close to the pile, where the mesh is finer (size of 0.8), then the far field has a larger mesh (size of 3) because there are no interactions defined in this area and the mesh along the 35 m below the seabed is also smaller than the monopile’s mesh and set to 0.6. Finally, the bottom has a bigger mesh too, with only 3 elements along the height. It is important to have a finer mesh on the slave surface than on the master surface, so as to obtain the relevant stresses values at this interface. At a given depth, the number of elements for the soil part in contact with the monopile is 168, whereas there are only 30 for the foundation, as the soil’s mesh is finer.
Soft clay: The Young’s modulus E of soft clay is 20 MPa, and the Poisson’s ratio υ is 0.45. The void ratio e is 0.66 and the permeability k is 10 6   cm / s . The density ρ is 1150 kg . m 3 . Stiff clay: The Young’s modulus E of stiff clay is 100 MPa, and the Poisson’s ratio υ is 0.45. The void ratio e is 0.428 and the permeability k is 10 6   cm / s . The density ρ is 1350 kg . m 3 . The properties for the layered soil are shown in Table 4.
First, the soil was modelled with an elastic model. Furthermore, in the FE analysis, all normal stresses σxx, σyy and σzz for the soil are effective stresses. Four steps are defined in this model. The first is a soil step to model the behaviour of the soil by defining two predefined fields: one for the effective stresses, which is a geostatic field, and the other one to set the distribution of the pore pressure, which is defined as a pore pressure field. The three other steps are gravity loads (of soil, structure), loads in normal conditions and loads in extreme conditions, respectively.

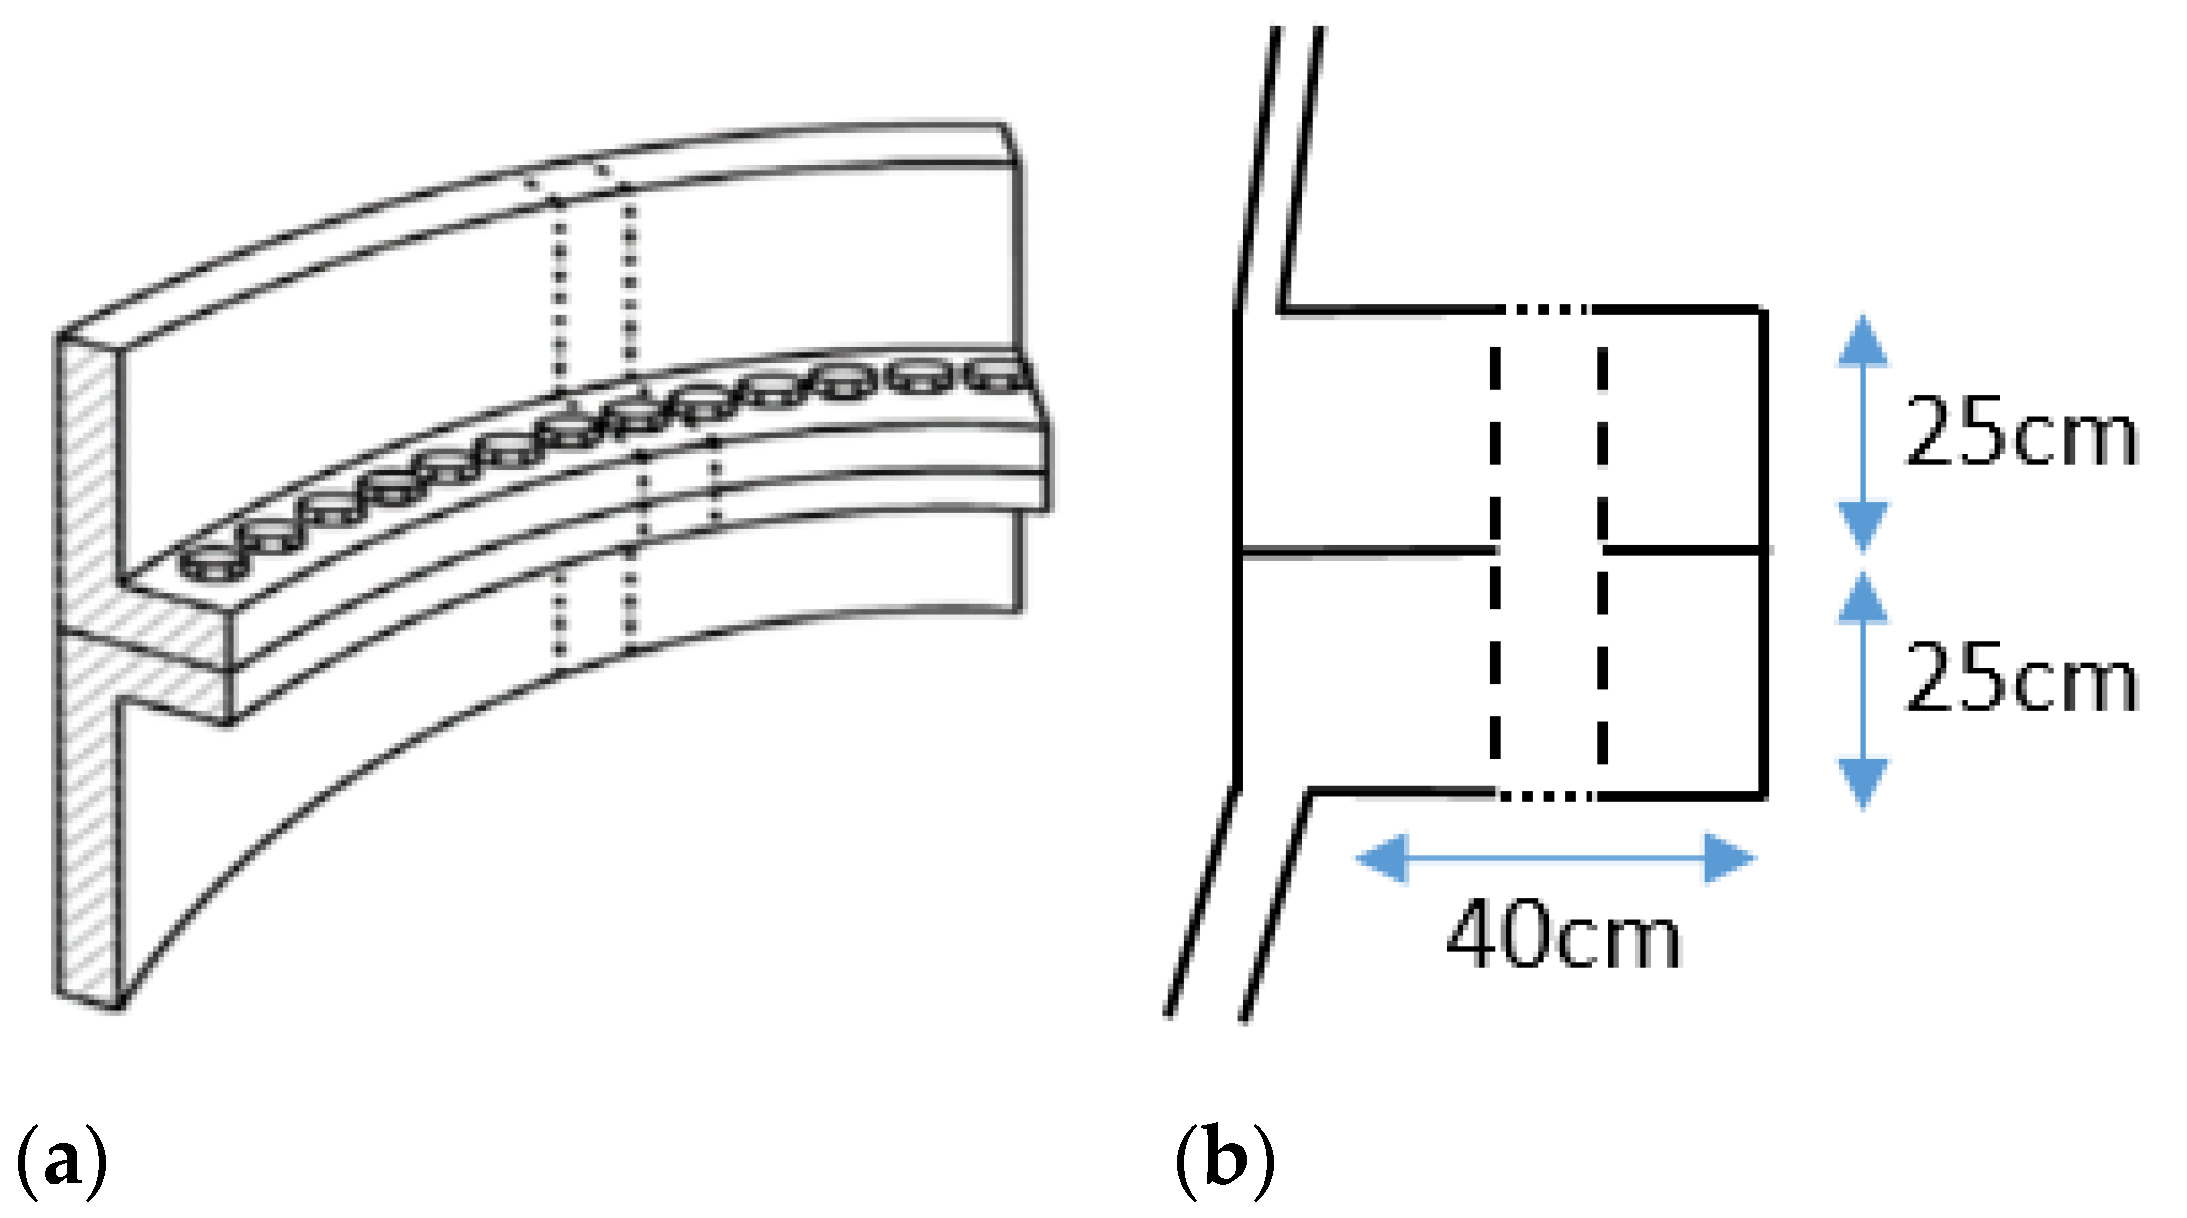
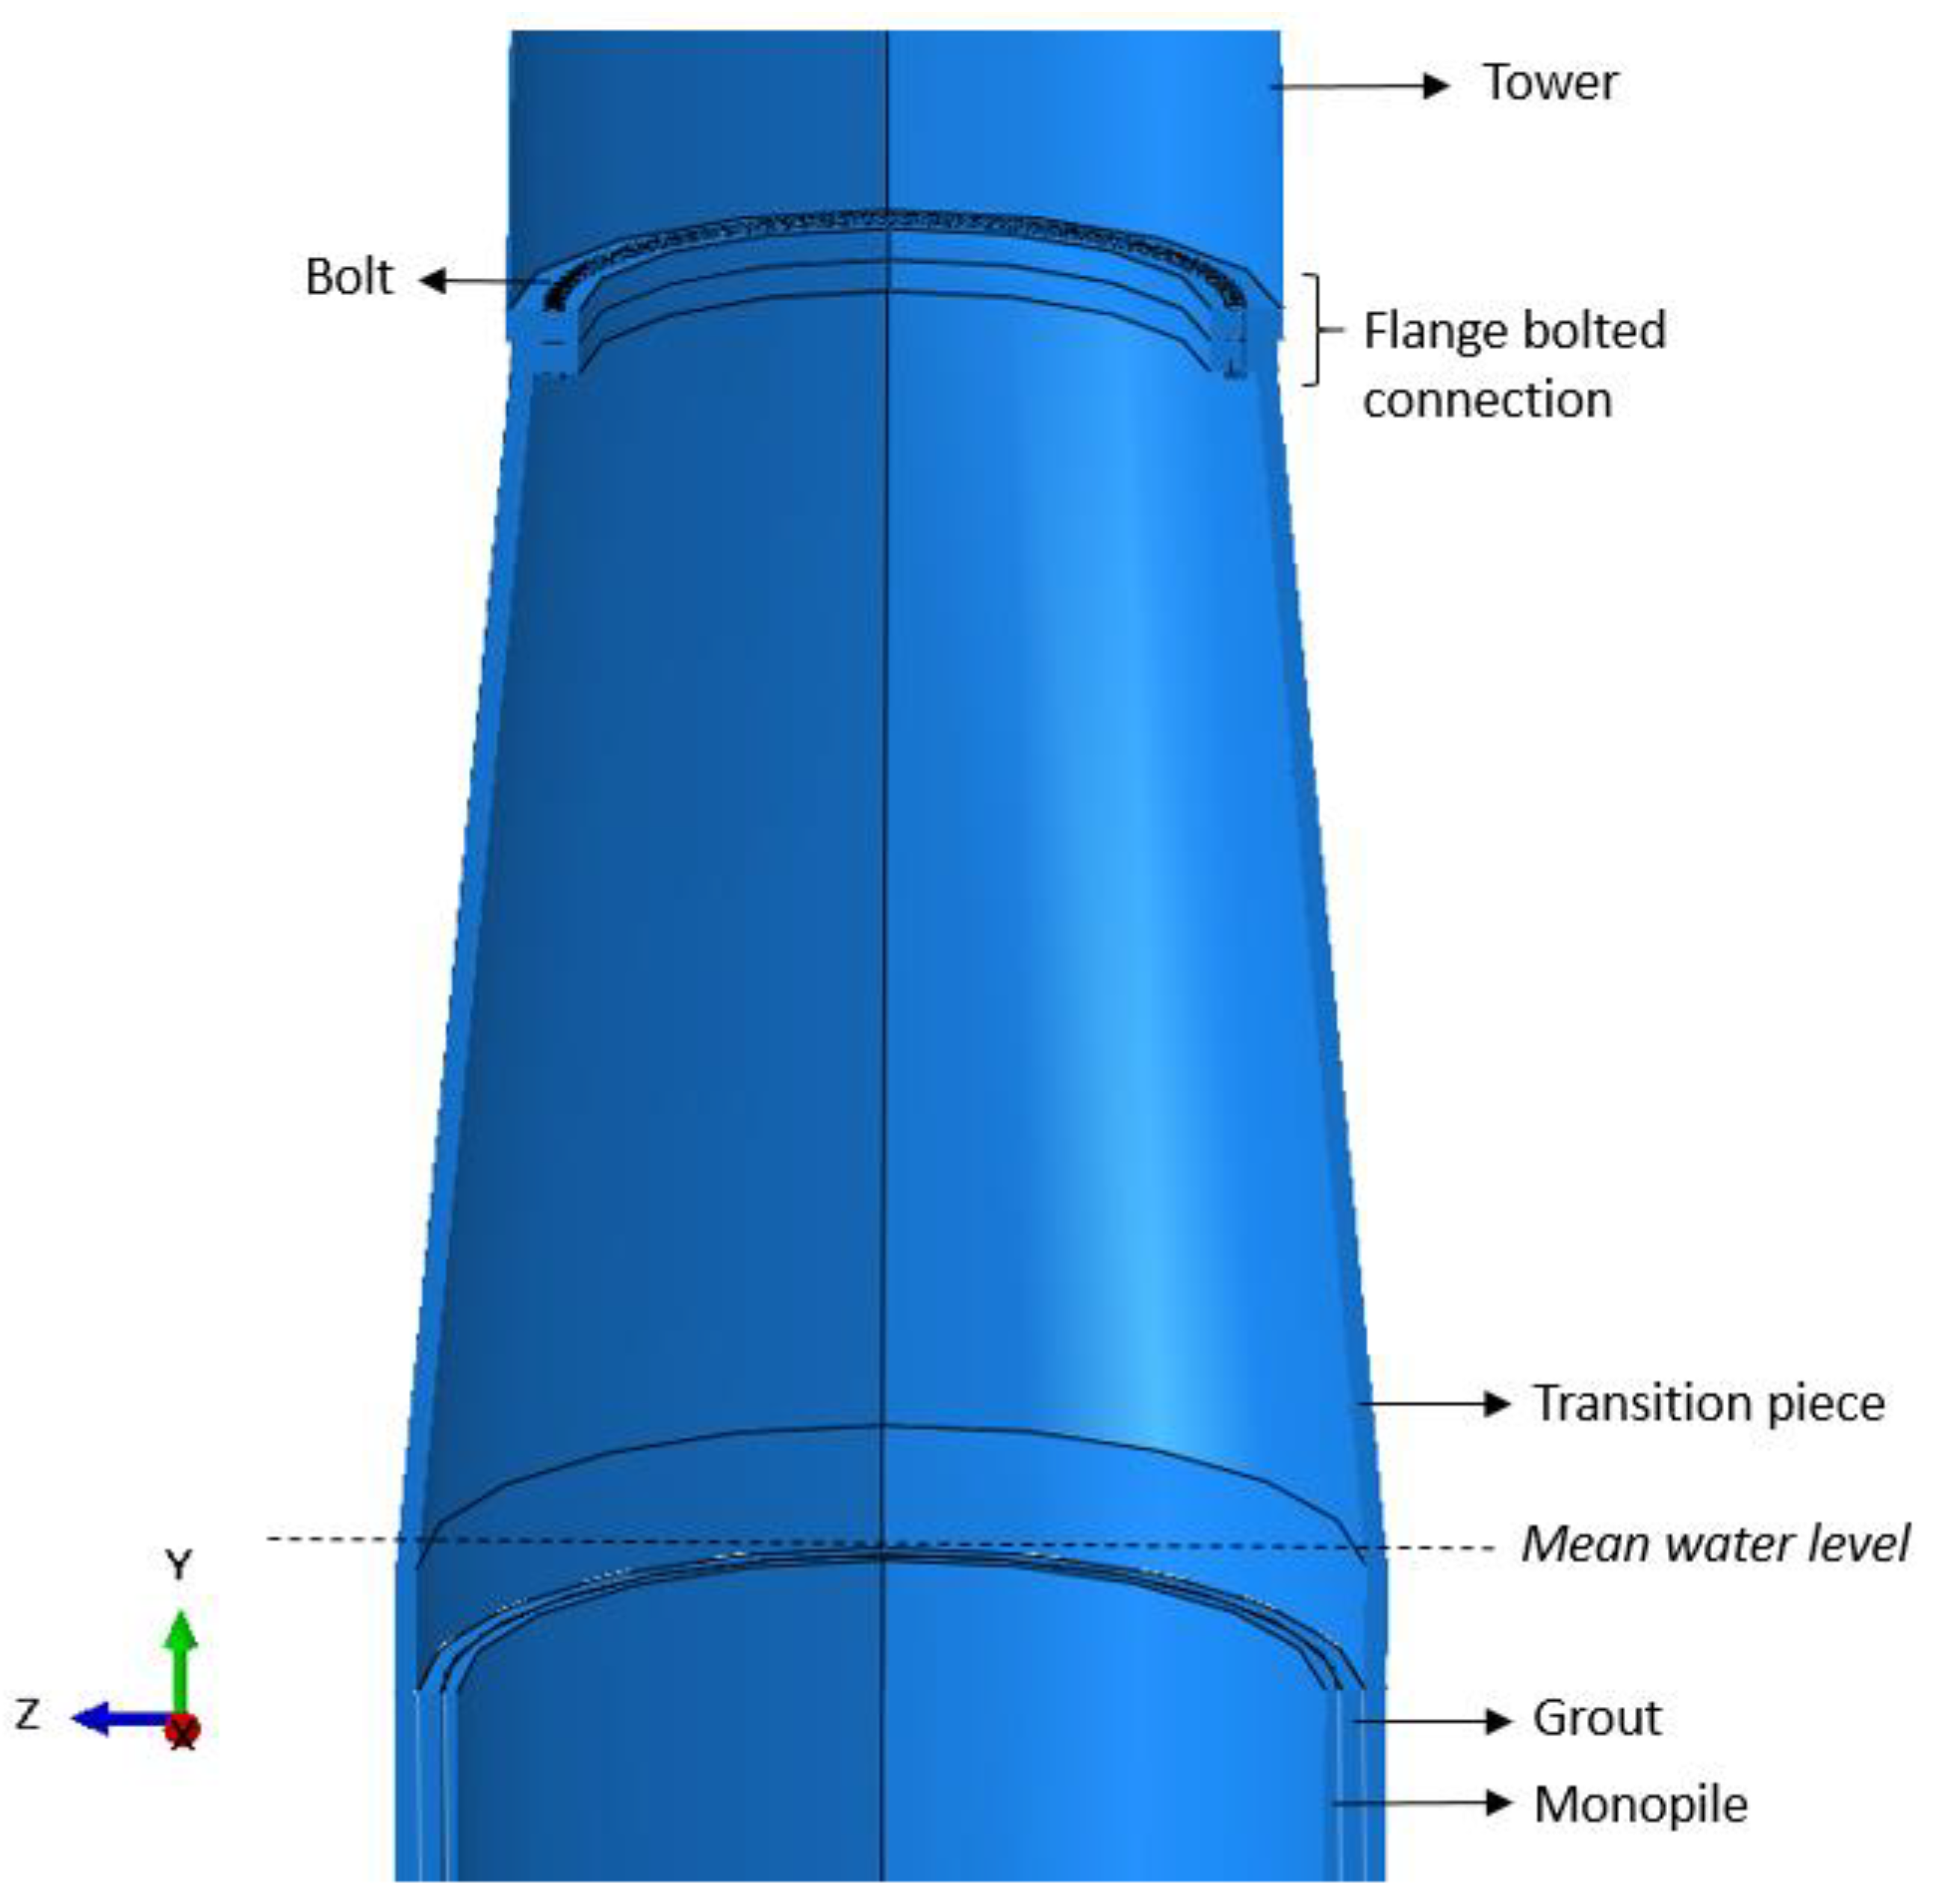
2.8. Design 3: Monopile Detailed Model

For this design, the geometry of the foundation has been improved to be the closest to reality. The transition piece is now modelled as well as the grout that links the monopile and the transition piece. Furthermore, the connection between the tower and the transition is modelled using a bolted flange connection, as shown in Figure 5 and Figure 6.
The grout has been modelled as a cylindrical pipe with constant radius, like the monopile. The transition piece is also a cylindrical pipe but with a variable cross-section: the part that is in contact with the grout has a constant radius (up to the mean sea level) and then the outer diameter decreases up to the flange connection; note that the thickness is constant along the transition piece. The design of this model is shown in Figure 6. The geometric characteristics are shown in Table 5.
M100 bolts, with a length of 0.5 m, were used with the head of the bolt having a diameter of 0.11 m and a thickness of 0.04 m. One hundred bolts were used in this model. Every part is made of the same material (steel S550) except the grout, and the density ρ of the steel for the tower is still 8500 kg . m 3 , whereas it is 7850 kg . m 3 for the bolts, monopile and transition piece. The grout connection is made of concrete, and more precisely of Ducorit D4, with presented properties in Table 6.
Different surface-to-surface interactions were defined in this model. Firstly, a cohesive surface-to-surface interaction was required to connect the grout with the monopile and the transition piece. The normal behaviour is set as “hard” contact, whereas the tangential behaviour is set as “penalty” with a coefficient of friction of 0.5. The grout was set as the slave surface and the monopile and transition piece as the master surface. The small sliding formulation has been chosen. Then, the connection between bolts and tower and transition was divided into two interactions: one interaction for the sides of the bolts and another one for the contact with the head of the bolt. Both of those contacts were set as a cohesive surface-to-surface contact, with a normal behaviour as hard” contact and a tangential behaviour as frictionless. Bolts were defined as the master surface and both the tower and transition piece as the slave surface. Finally, the last interaction is the surface-to-surface contact between the tower and the transition piece, which was set as frictionless contact. Due to the different interactions defined in this model, the mesh is more complicated than the previous designs. First, around the holes the number of elements is 20. For the flange connection, there are 15 elements along the height of this flange. Then, for both the tower and transition piece, the size along the height is 0.5, whereas the size for the circumferential edges is 0.1. As for the monopile, the global size is 0.4. Finally, for the grout, the size along the height is 0.27, and for the circumferential edges it is 0.05. The mesh for the bolts is coarser, and only 10 elements are used along the height and for the heads of the bolts. Furthermore, the element type is still a linear element C3D8 without reduced integration.

3. Results and Discussion

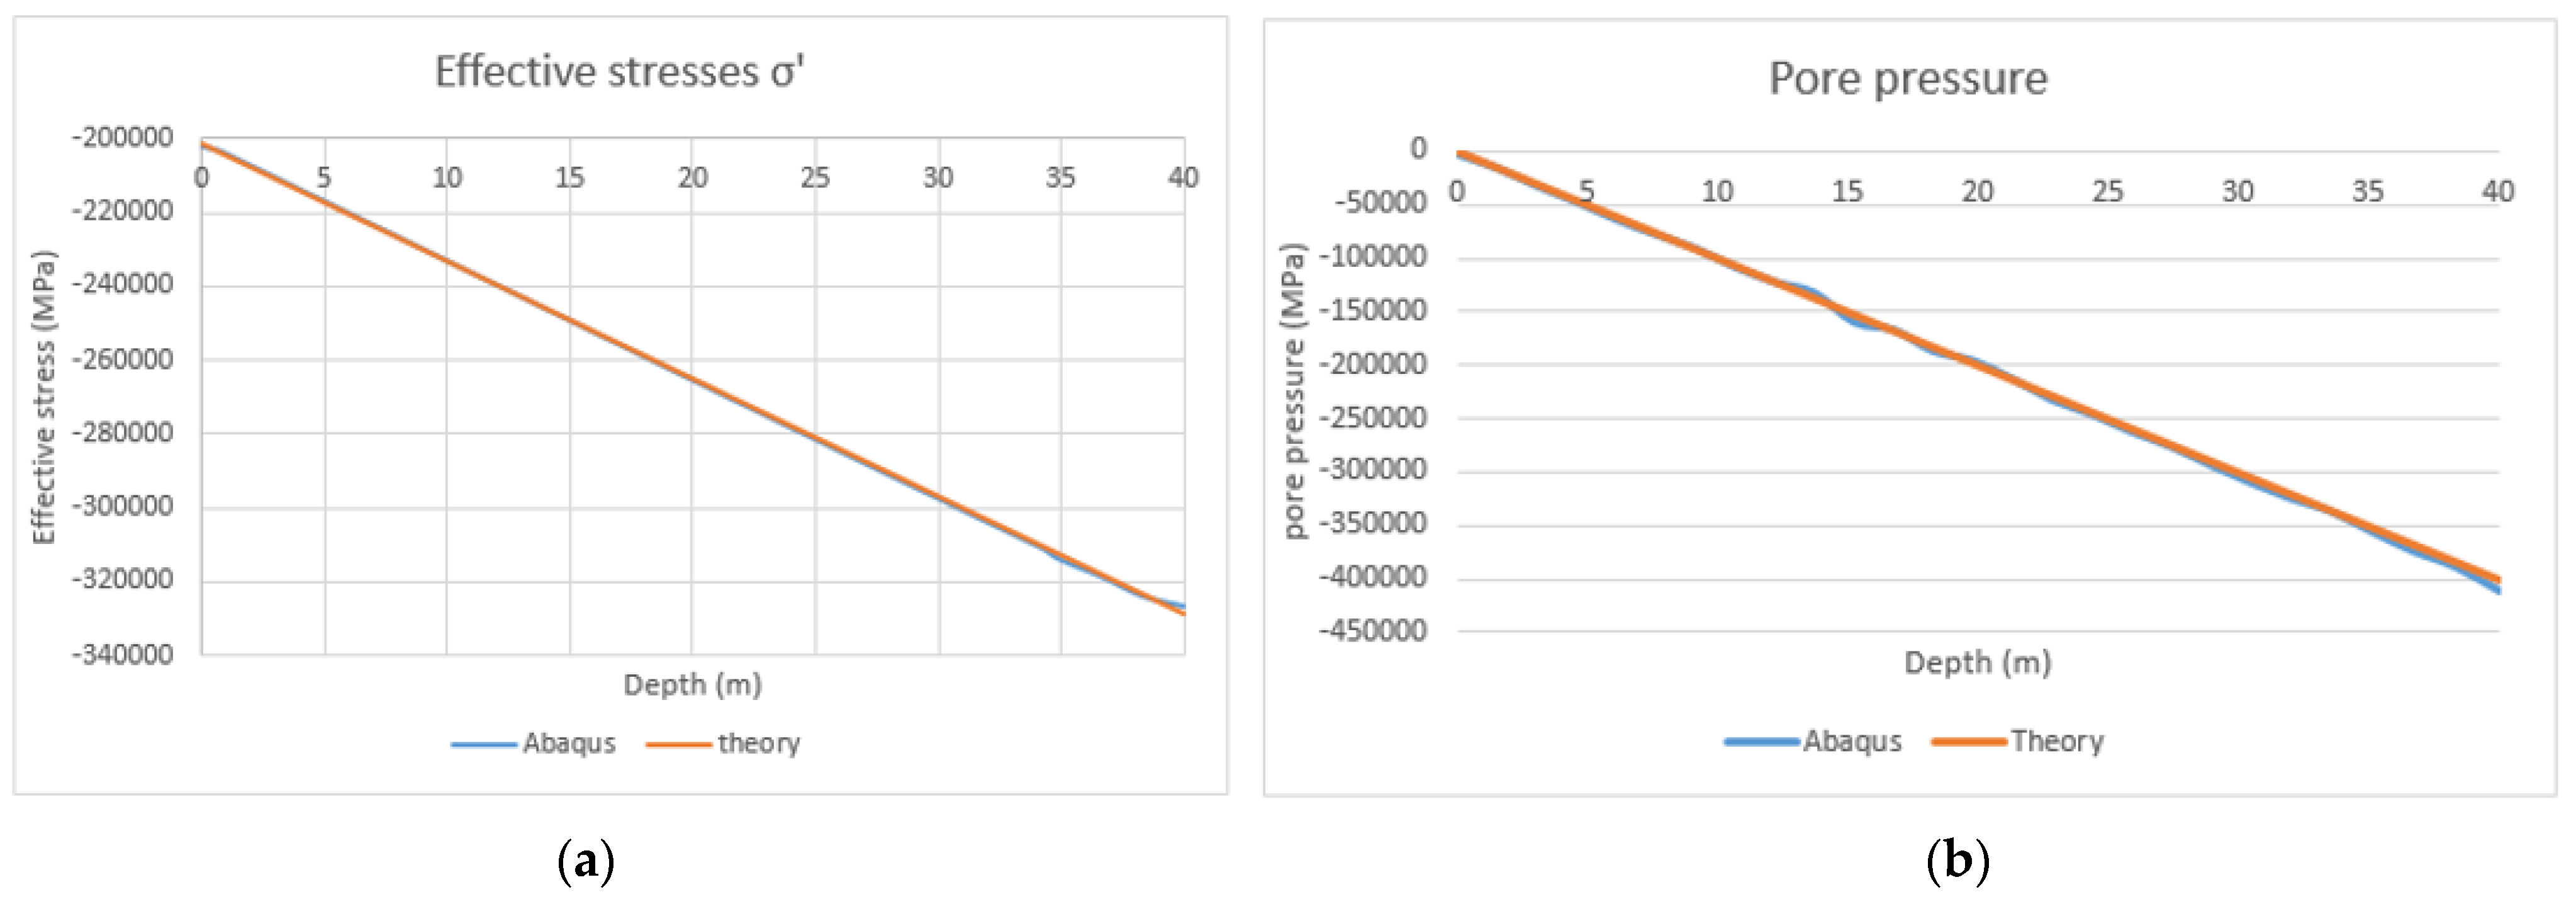
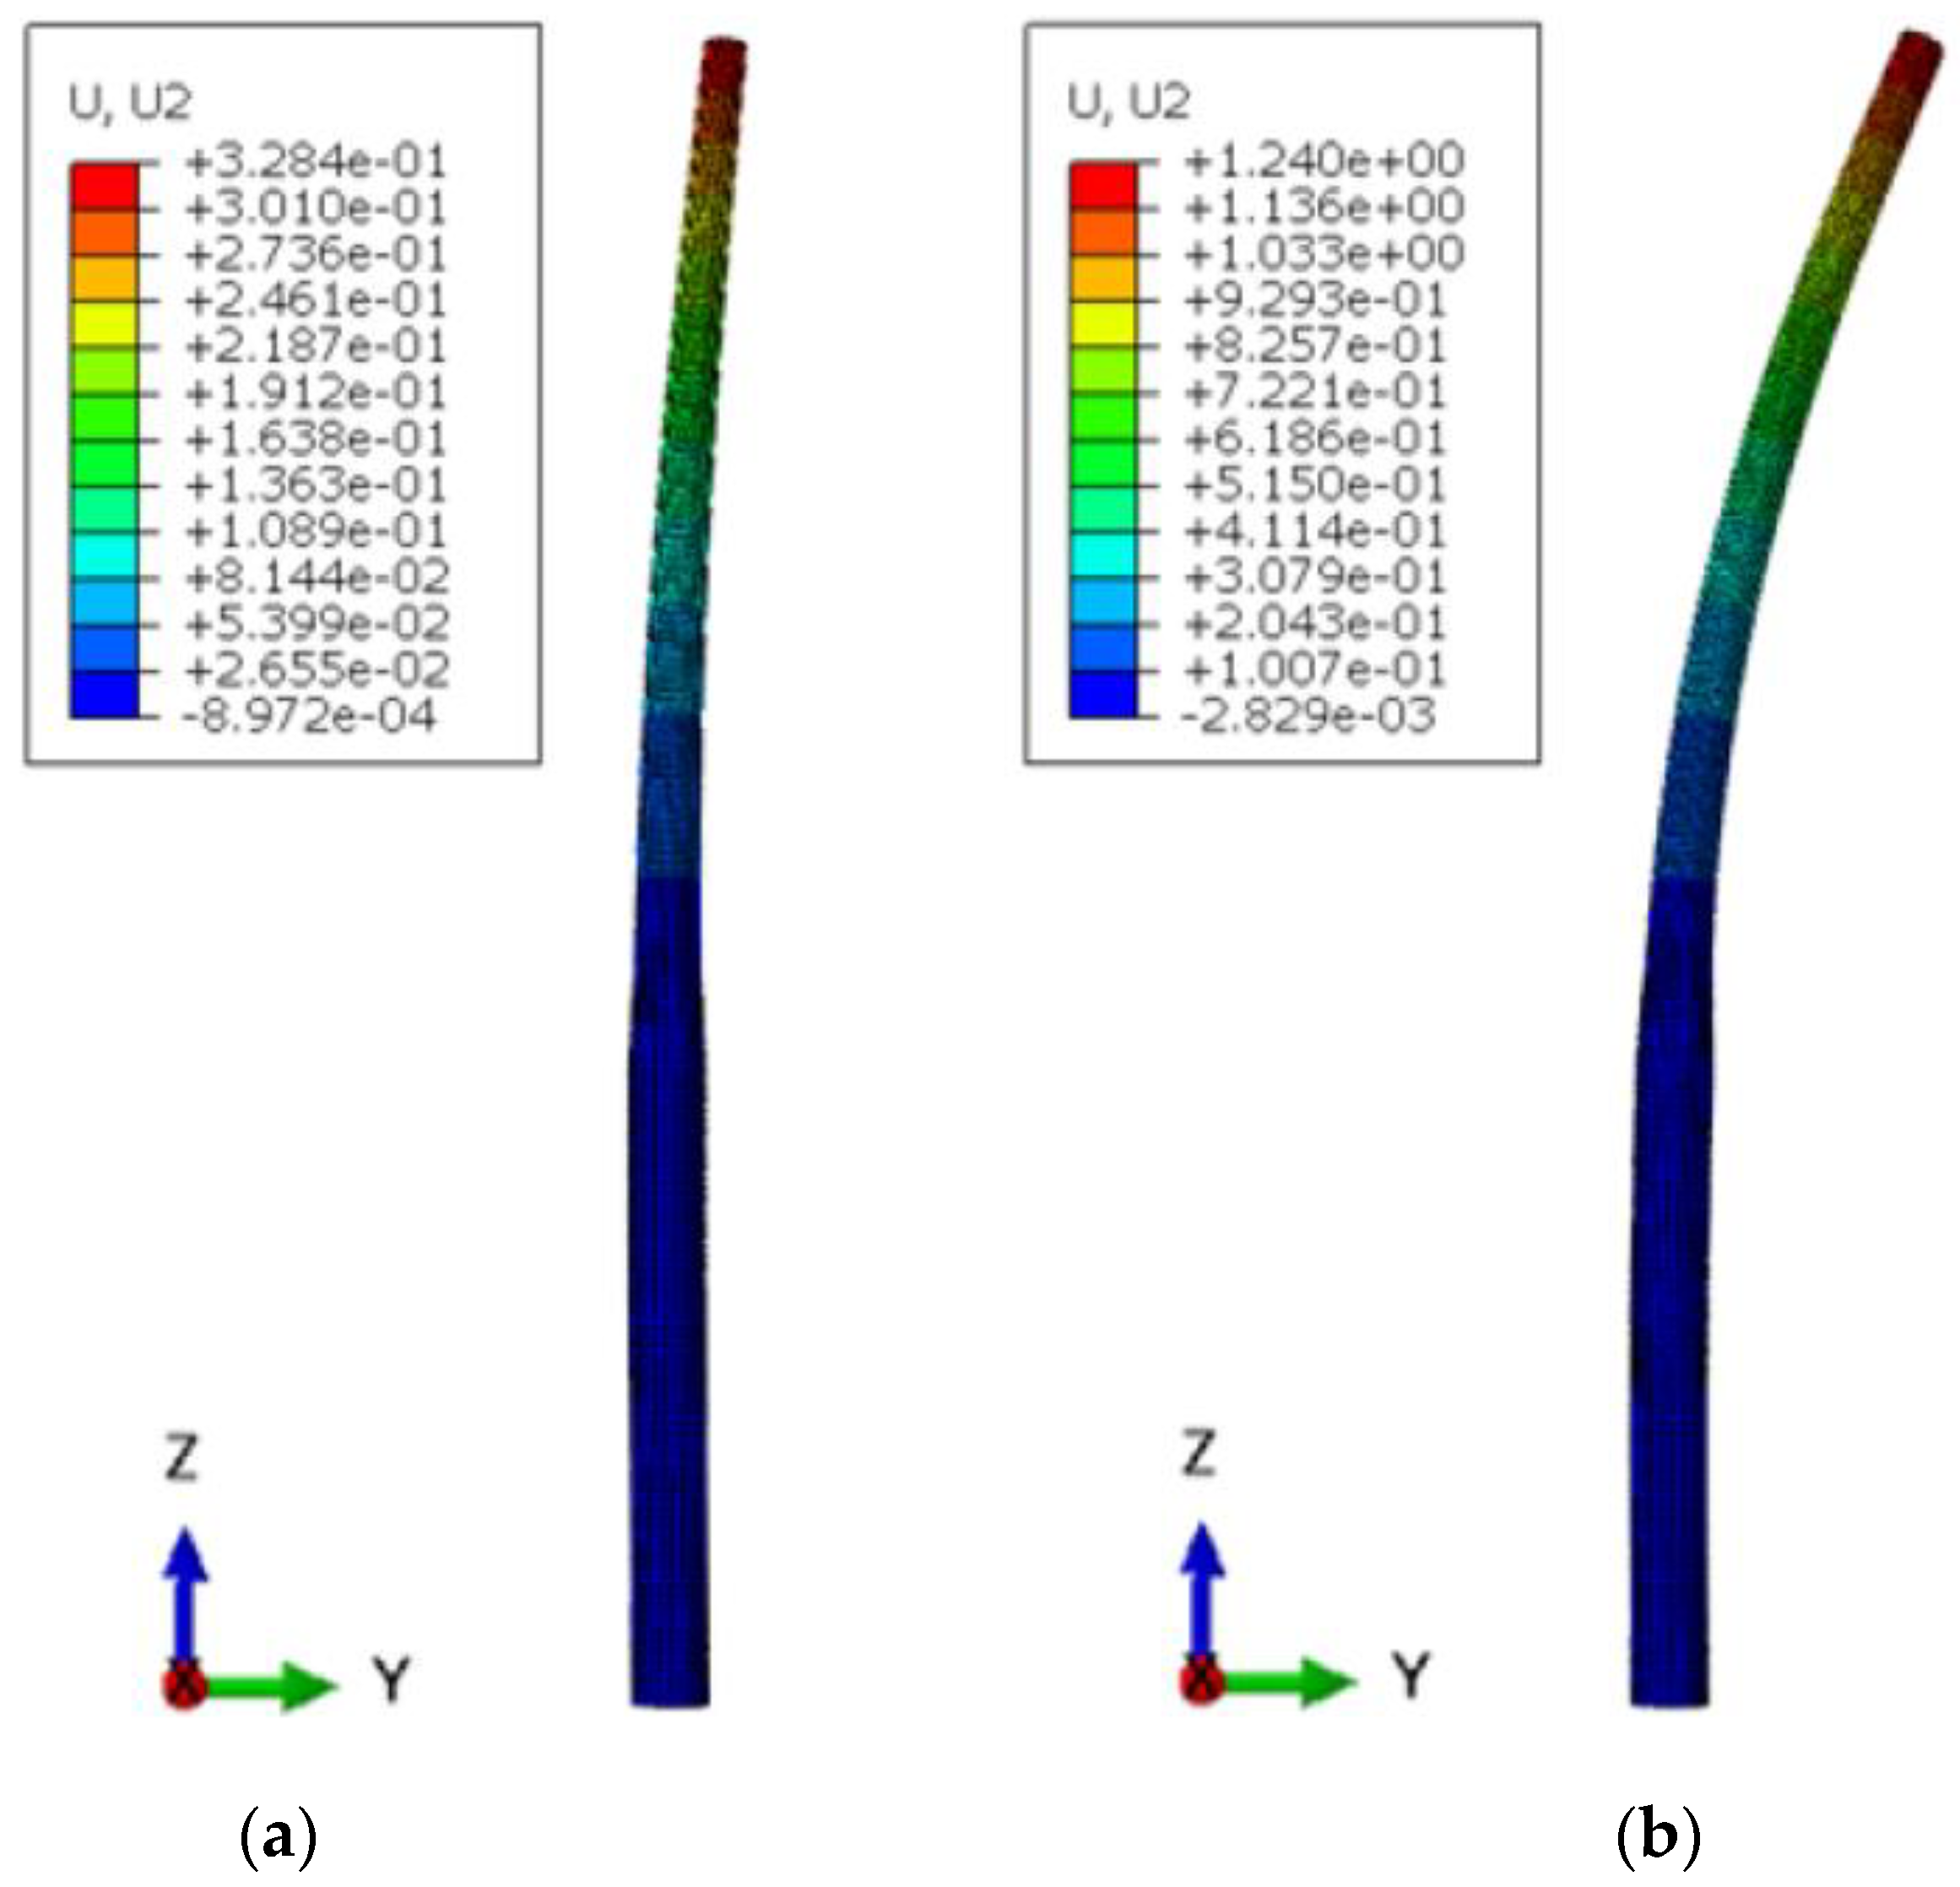
3.1. Design 1 Results

The most relevant outputs of the simulation are the displacements and the different types of stresses in the structure. The maximum deflection in both situations is located at the top of the tower, as expected for a structure that is mainly subjected to bending (see Figure 7). Under extreme conditions, the maximum lateral displacement at the top of the tower is 1.097 m, whereas in normal conditions it is only 29.14 cm. Therefore, the deflection is almost four times larger in the extreme sea conditions. Note that in both conditions, the displacement is less than the allowed value of 1.65 m.
To check the strength of the structure, the value of the maximum von Mises stress was evaluated. As shown in Figure 8, the maximum von Mises stress for normal conditions is 58.61 MPa, whereas it is 189.3 MPa for extreme conditions. Those values are both less than the yield stress of the steel, which is 550 MPa, so the material maintains an elastic behaviour under loading and consequently no structural failure occurs.
To study the structure under lateral and also vertical loads (due to the weight of different parts), the vertical stresses (σyy or S22 in ABAQUS) were also analysed (Figure 9).
It can be seen that the vertical stresses do not have the same sign along the structure. The stresses are positive on the face where loads are applied, which corresponds to a tension area. The stresses on the opposite face are negative, which corresponds to a compression area. This change of sign is due to the fact that the structure is subject to bending. In this situation, the half-left face of the monopile is a tension face and the other half face of it is a compression face. However, when studying an embedded beam, generally the maximum vertical stress values are located at the embedded region, which is not the case here. This is mainly due to the fact that the cross-section is not constant throughout the structure. Figure 9 shows that the maximum stresses occur around 30 m, which is 10 m above the sea surface level. This location corresponds to the transition area between the foundation and the tower. Moreover, the stresses are a bit larger on the bottom face of the transition piece than on the top face of it. In a frequency analysis, no loads are applied on the structure. Only the rotor and nacelle assembly is modelled as inertia at the top of the tower. The value of the natural frequency is 0.31051 Hz. This is a good value for the frequency because it is between the 1P and 3P range and it is also close to the theoretical value, which is 0.3240 Hz. The relative error is 4.16%, which is relatively small. Note that the deformation scale factor is set to 20 in every result shown.

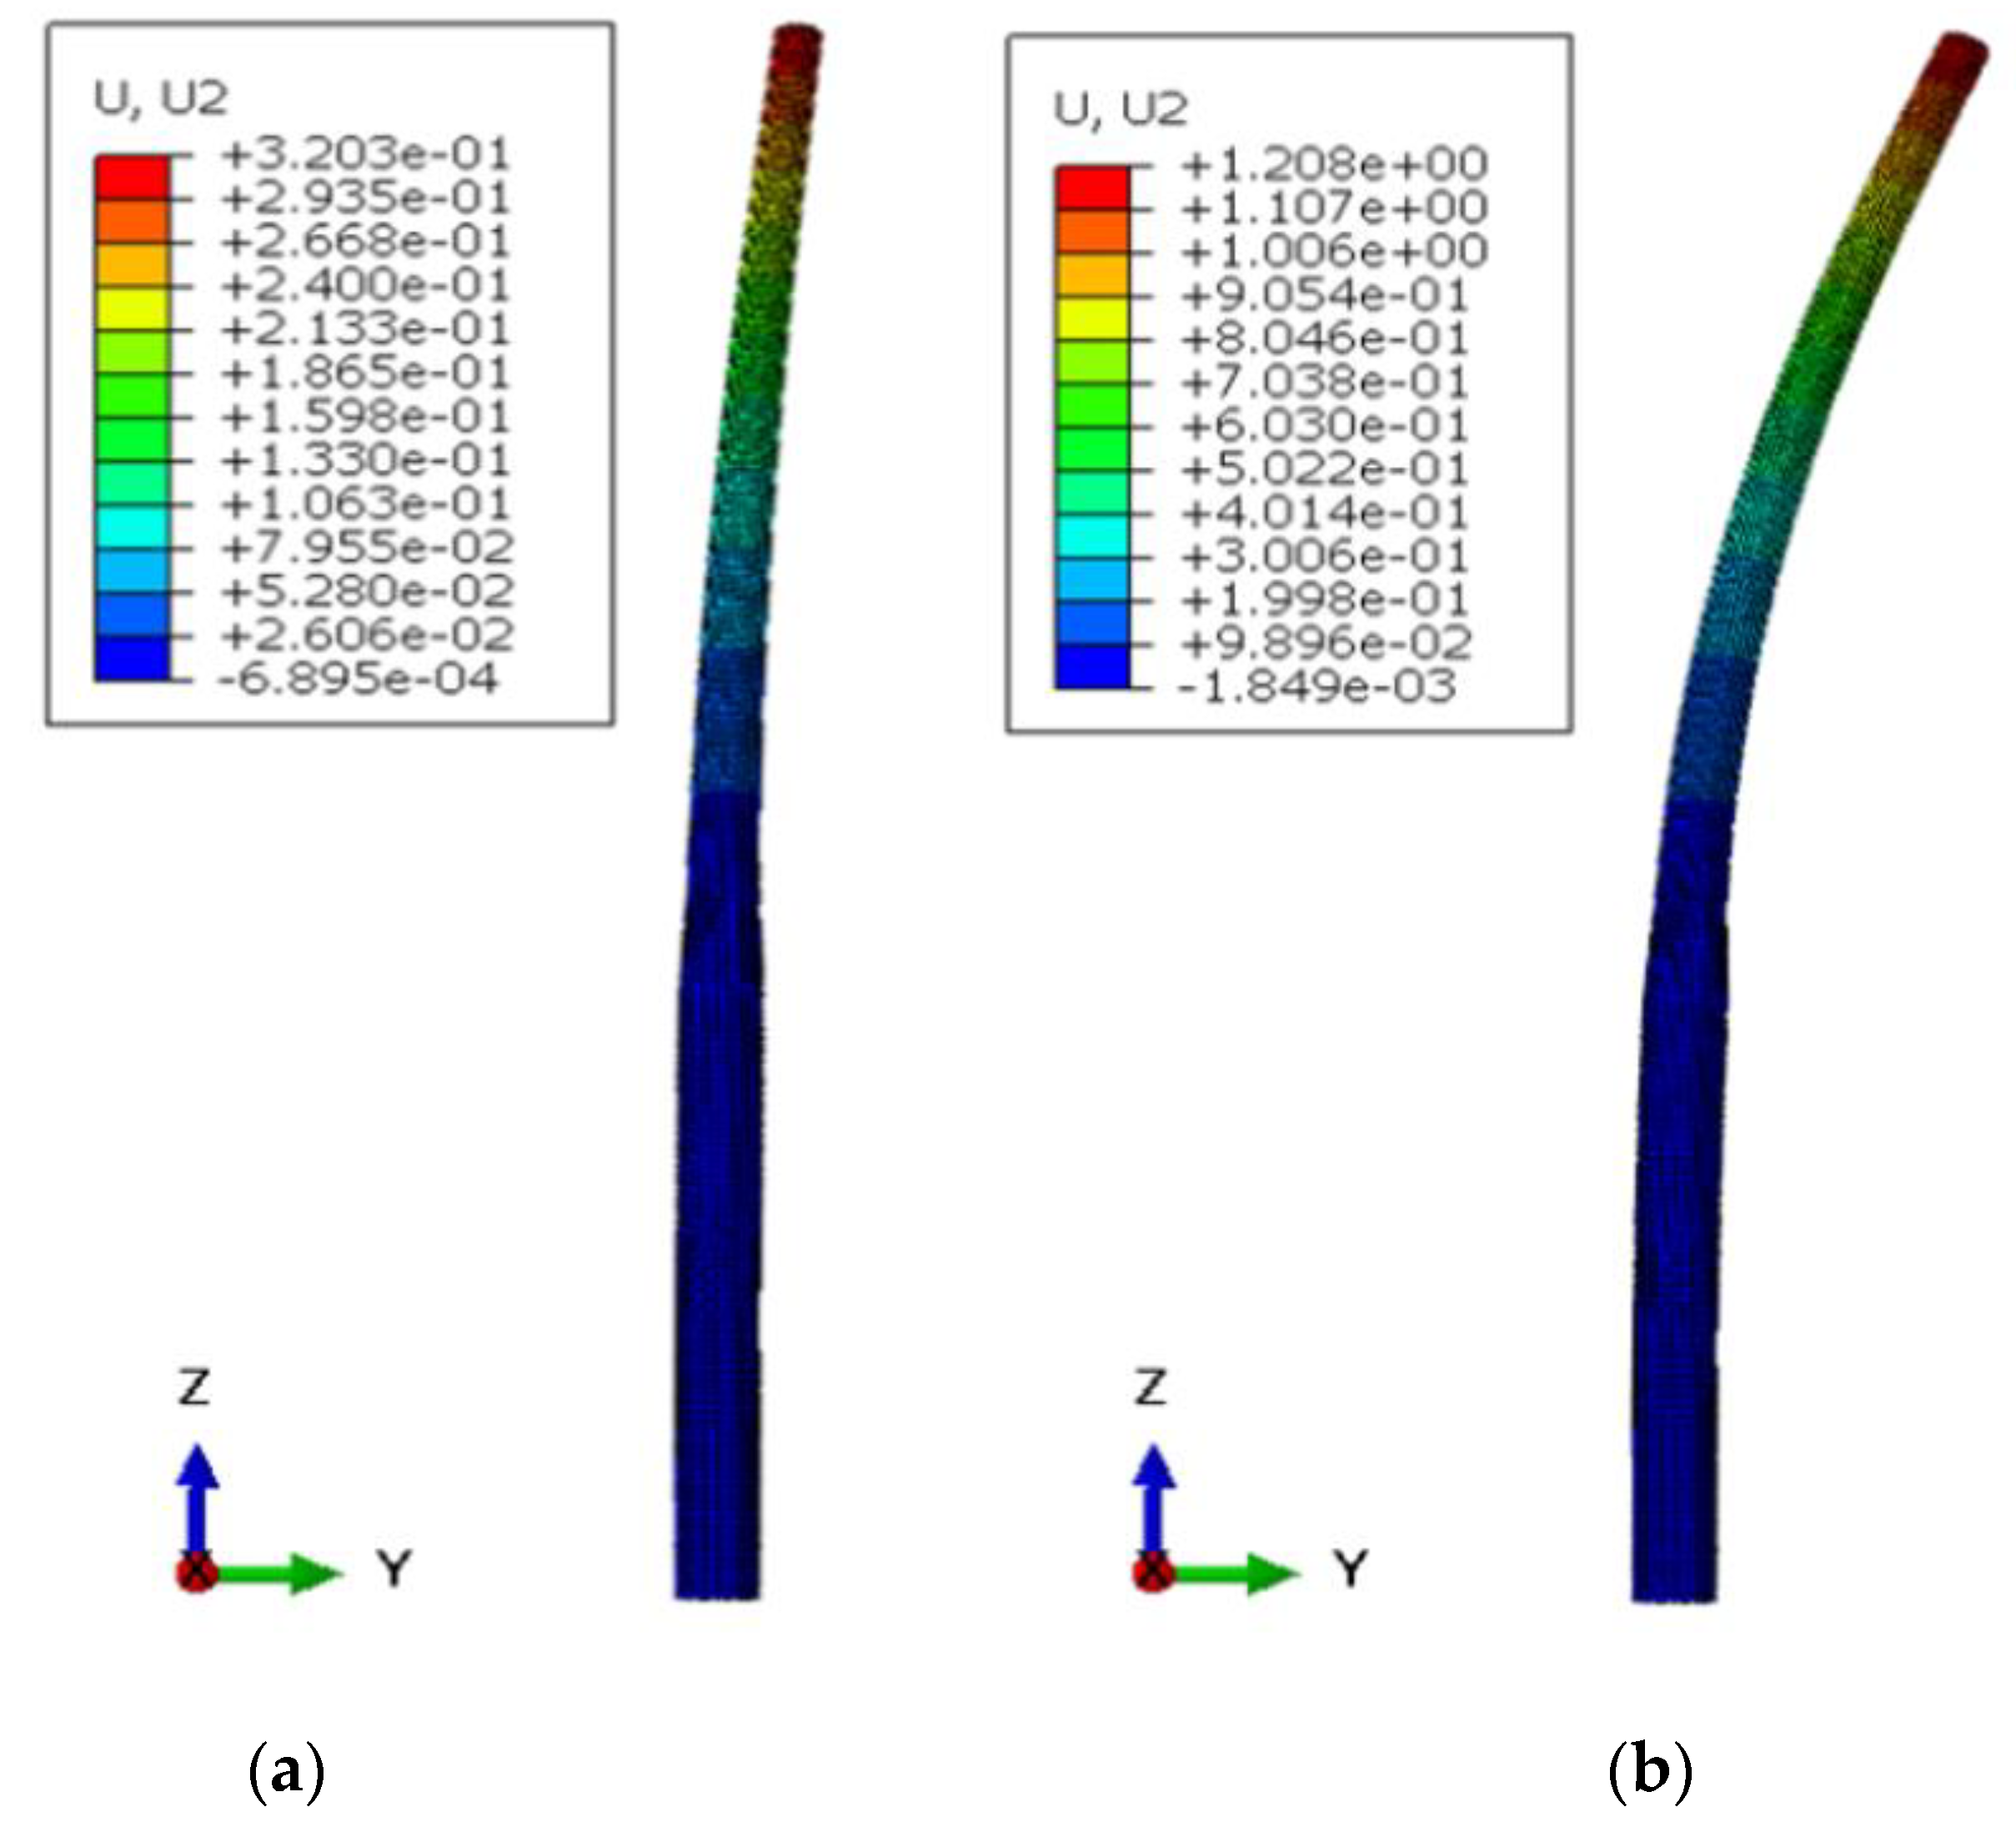
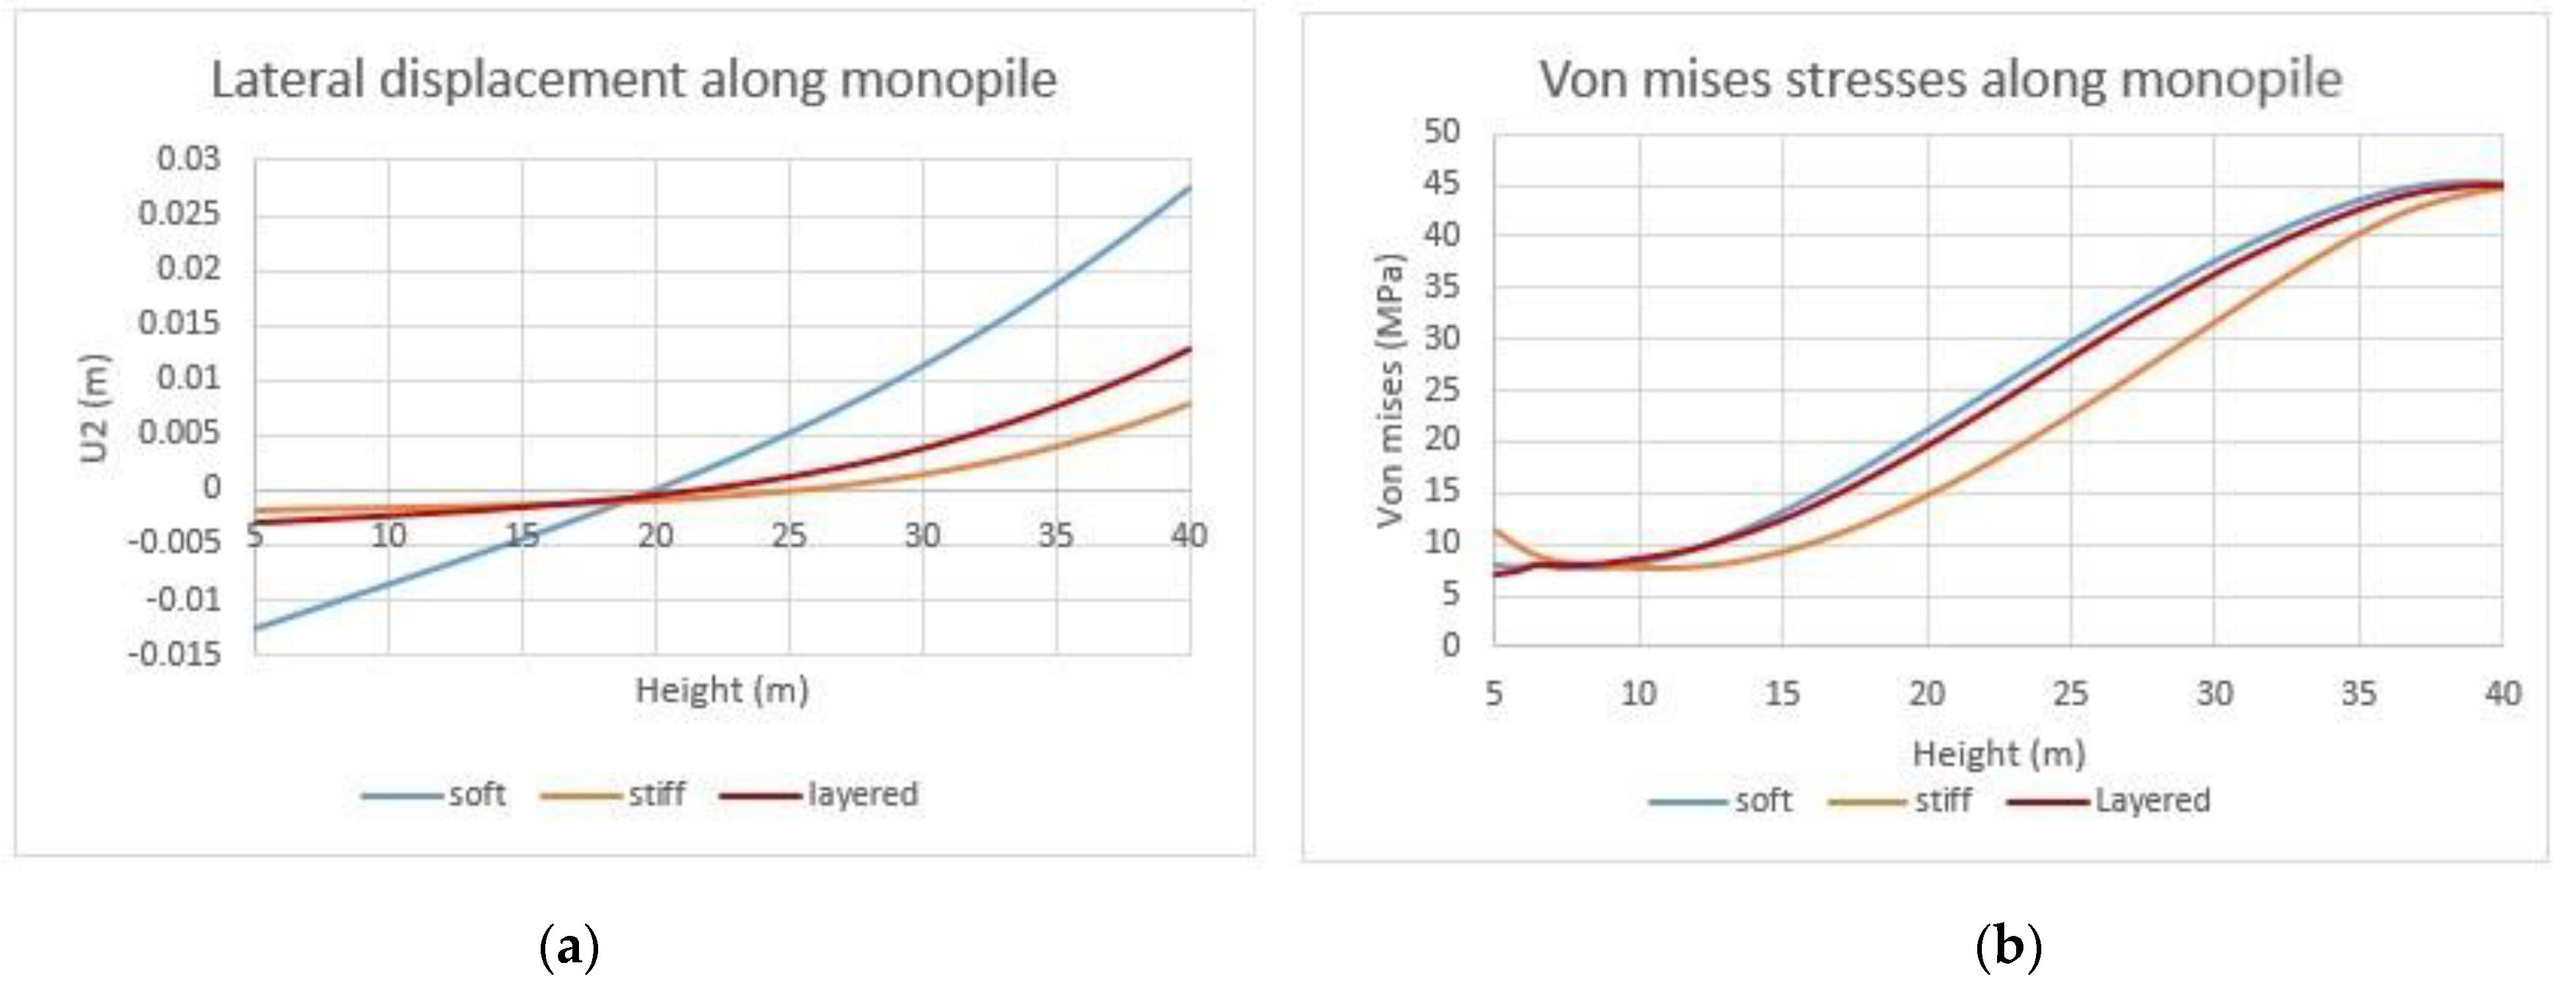
3.2. Design 2 Results

As explained above, three different types of soil will be studied in this section: two homogeneous soils and a layered soil.
Stiff clay
The first one is a homogeneous stiff clay. The vertical stress σzz is the same as without the soil and its distribution along the tower is the same (the bottom face is still a compression area whereas the top face is a tension area). However, the lateral displacement has been impacted, as shown in Figure 10.
The maximum deflection in normal conditions is now 0.3203 m versus 0.2914 m without soil, but a more significant difference is observed under extreme conditions because the largest deflection is 1.208 m versus 1.097 m without soil; a rise of 11.1 cm. This is expected because the monopile is no longer fully fixed at its bottom, and so this part is allowed to move, which implies a larger displacement at the top of the tower. Commonly, the water and air in the voids of a component of soil will be under pressure, either because of the physical location of the soil or as a cause of external forces, and will be determined by Mw and Ma, respectively. This pressure is the pore pressure. Effective stress (σ’) is associated with three stresses σ, Mw and Ma and for saturated soils, which is illustrated by Terzaghi’s theory (σ’= σ − Mw) [78].
As shown in Figure 11, whether it is the effective stress or the pore pressure, both are very close to the theory [79].
Soft clay
The second soil is a soft clay. As shown in Figure 12, the maximum deflection is 0.3529 m in normal conditions and 1.335 m in extreme conditions. We can note that those values are larger than those for stiff clay, which is expected as the soft clay is less stiff and will deform more.
Furthermore, as for the stiff clay, the maximum von Mises stress is the same as the model without soil, so the behaviour of the structure stays in the elastic range and no failure occurs. The natural frequency with the soft clay is 0.28330 Hz.
Layered soil
In reality, soils are rarely homogeneous. Soils are usually composed of different layers. According to the New Jersey Geological Survey, the stratigraphic information in the location of the wind farm shows that the soil is mainly composed of sand and clay. To simplify the composition of soil, only stiff/soft clay and medium sand will be modelled. According to Figure 13, the displacement at the top of the tower is 0.3284 m in normal conditions and 1.24 m in extreme conditions. This is expected, as the soil is made of different stiff and soft clay, but also of medium sand that is stiffer than the soft clay, so the maximum deflection should be between the values obtained with homogeneous stiff and soft clay. The natural frequency with the layered soil is 0.29371 Hz.
Finally, the natural frequency is slightly different in the three cases but is still within the 1P to 3P range. It can be noted that those values are lower than the theoretical value of 0.3240 Hz, and the largest difference is that for the soft clay, with a relative error of 12.56%. Different practical studies have shown that the most important parameter when studying soil–structure interaction under lateral loading is the rotational stiffness. Indeed, soil properties may have a significant impact on the rotational stiffness and therefore on the natural frequency [80].
Obviously, the first of these parameters is the types of soil that were defined above. To study the influence of the interaction of the soil with the embedded structure, the lateral displacement and the von Mises stresses were plotted along an edge of the monopile (along the outer diameter).
As shown in Figure 14, the stiffness of the soil has an impact on the lateral displacement of the pile. As shown in Figure 14a, a soft clay soil with a low stiffness implies more displacement of the monopile at the seabed level, and also at the bottom. For example, the displacement at the bottom of the monopile is −12.58 mm in the soft clay, whereas it is −1.85 mm and −2.83 mm in the stiff clay and the layered soil, respectively, and it is up to 6.5 times larger in the case of soft clay. Consequently, a larger displacement at the bottom implies a larger displacement at the top. The von Mises stress is greater in the soft soil as well. As shown in Figure 14b, in the three cases, the values of the stress at the bottom and at the seabed level are the same; however, the stress along the pile is around 5–6 MPa greater in soft clay and layered soil than in stiff clay.
Another parameter that has a huge influence is the embedded length. The previous results were shown with an embedded length of 35 m. The analysis was repeated with different embedded lengths of 5, 10, 15, 20, 25 m. The results show that the embedded length does not have any influence on the maximum von Mises stress: it is still the same as without soil. However, as expected, the natural frequency and the displacement at the top of the tower are affected, as shown in Figure 15.
As expected, the maximum displacement is widely impacted by the embedded length. Indeed, the smaller this length, the greater the displacement of the tower. As only the soil restricts the monopile’s movement, if the embedded length of the monopile is not enough, the displacement of the tower will be too high. However, we can also note that the natural frequency decreases as the embedded length decreases. In every case, the natural frequency is within the 1P to 3P range, but with a small embedded length this frequency gets closer to the 1P frequency, and this situation has to be avoided as much as possible. In addition, the effects of Young’s modulus (E) are investigated in Figure 16.
As the soil is only modelled as an elastic medium, the Young’s modulus of the soil is the parameter that has the most impact on results. As shown above with the different types of soil, when the Young’s modulus is small (around 20–30 MPa), the soil has a lower stiffness and consequently the top deflection of the tower is greater. Additionally, the natural frequency decreases slightly as the Young’s modulus decreases. All these analyses were performed with an embedded length of 35 m in this part.
The results also show that the embedded length has more influence on the lateral displacement of the structure than the Young’s modulus of soil. The most commonly used model in geotechnical studies is the Mohr–Coulomb model. The Mohr–Coulomb model has been implemented for the stiff clay soil. The values of the internal friction angle Φ and the dilation angle ψ are assumed both equal to 0 ° and the cohesion of the soil C is set to 50–150 kPa for undrained soil. The results have shown that there is no significant difference between this and the elastic model. Indeed, the von Mises stress and the lateral displacement have the same distribution along the monopile.
As shown in Figure 17, cohesion does not really have a huge impact on the von Mises stresses along the monopile, but a low amount of cohesion leads to larger displacement of the monopile and consequently the maximum displacement at the top of the tower will also increase.

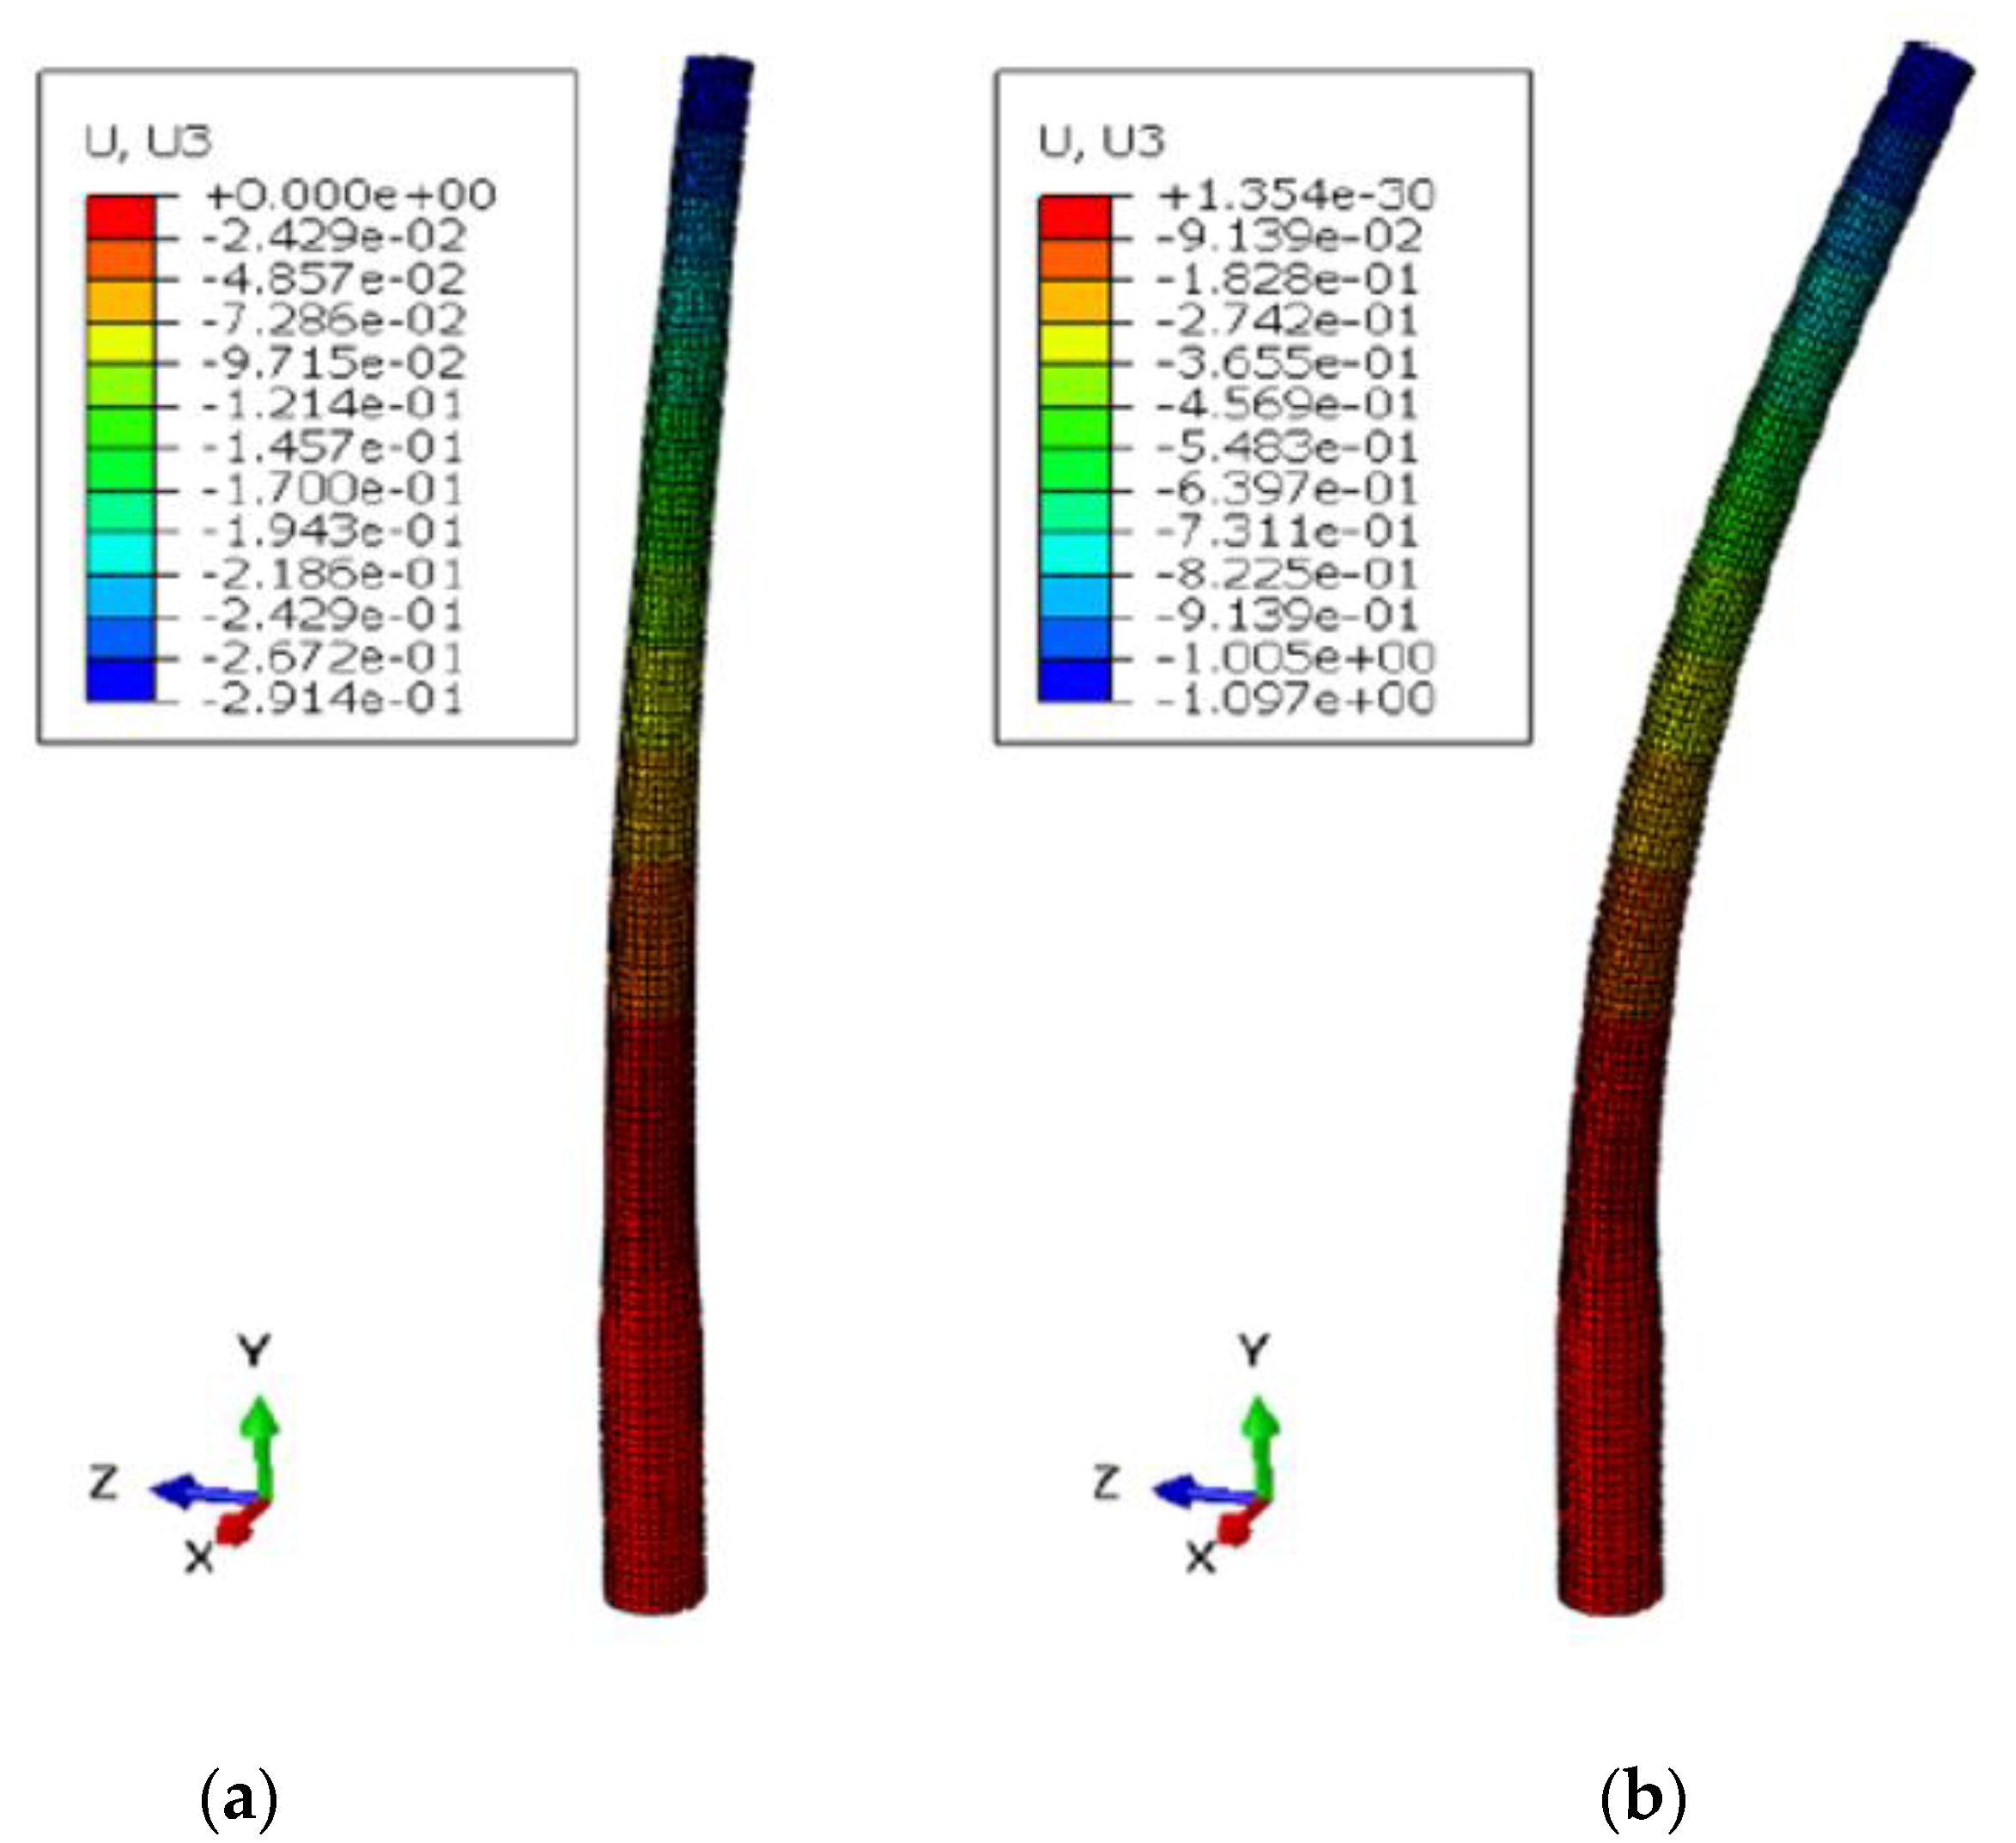
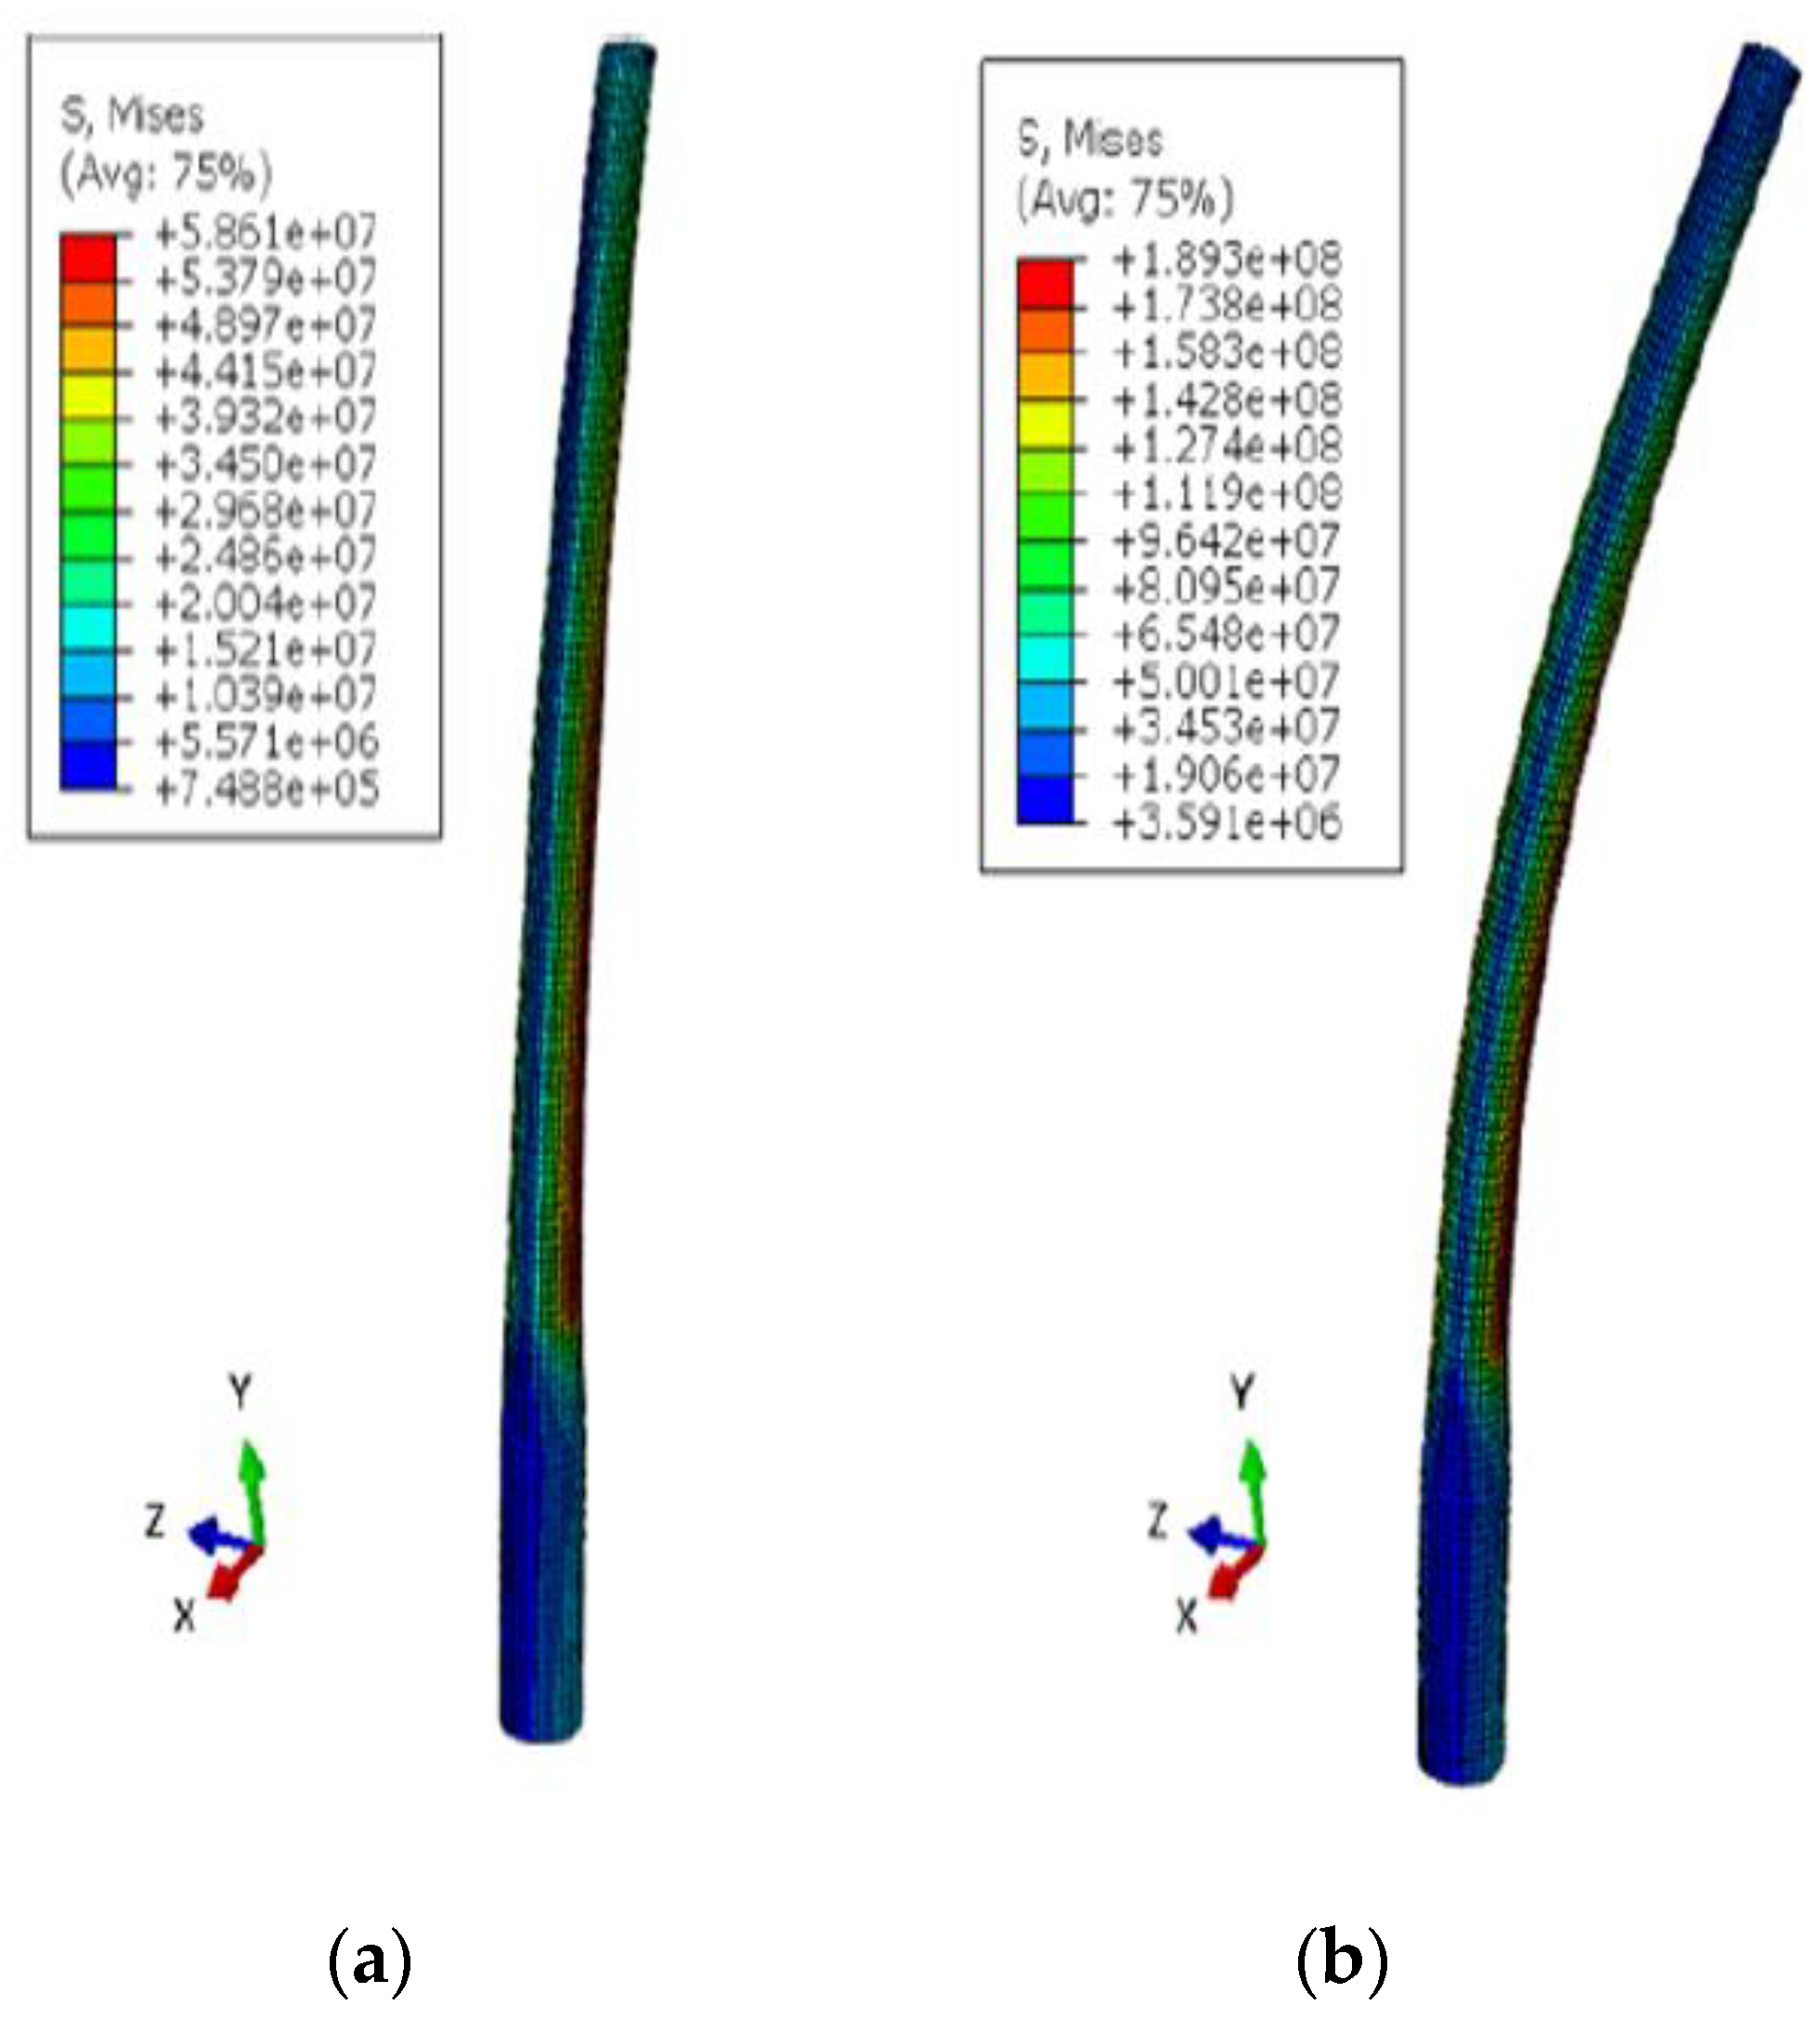
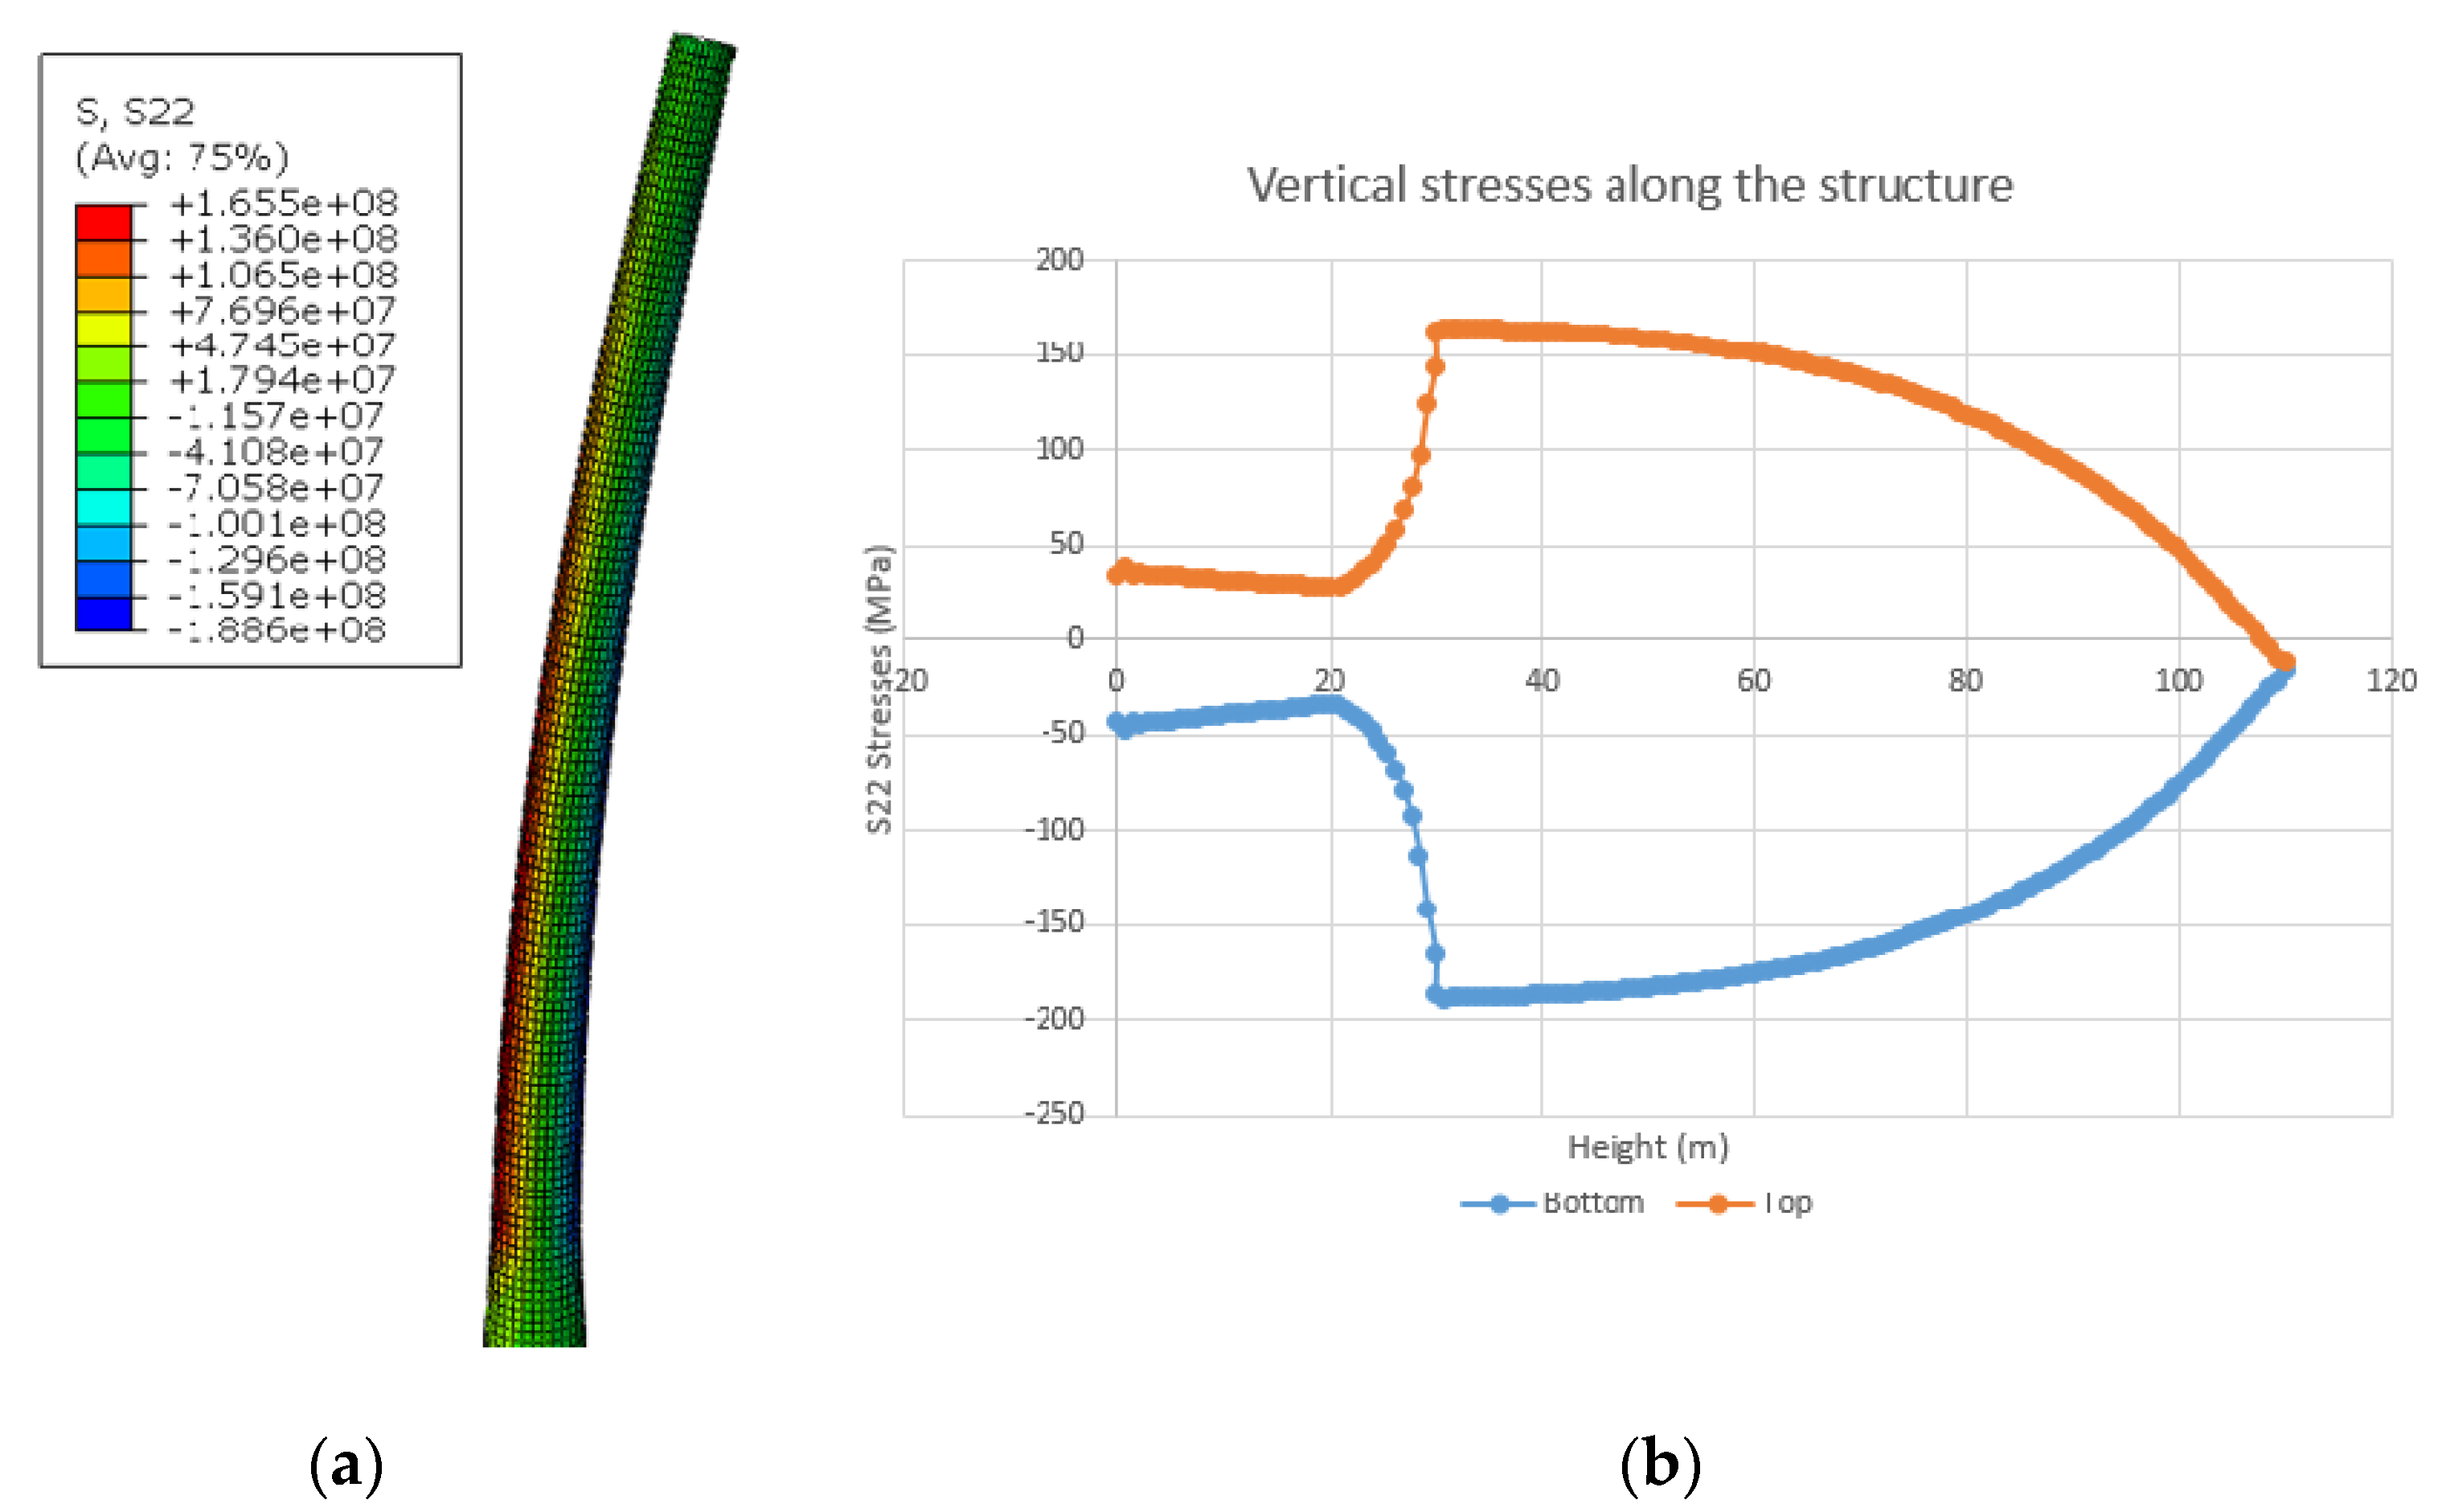
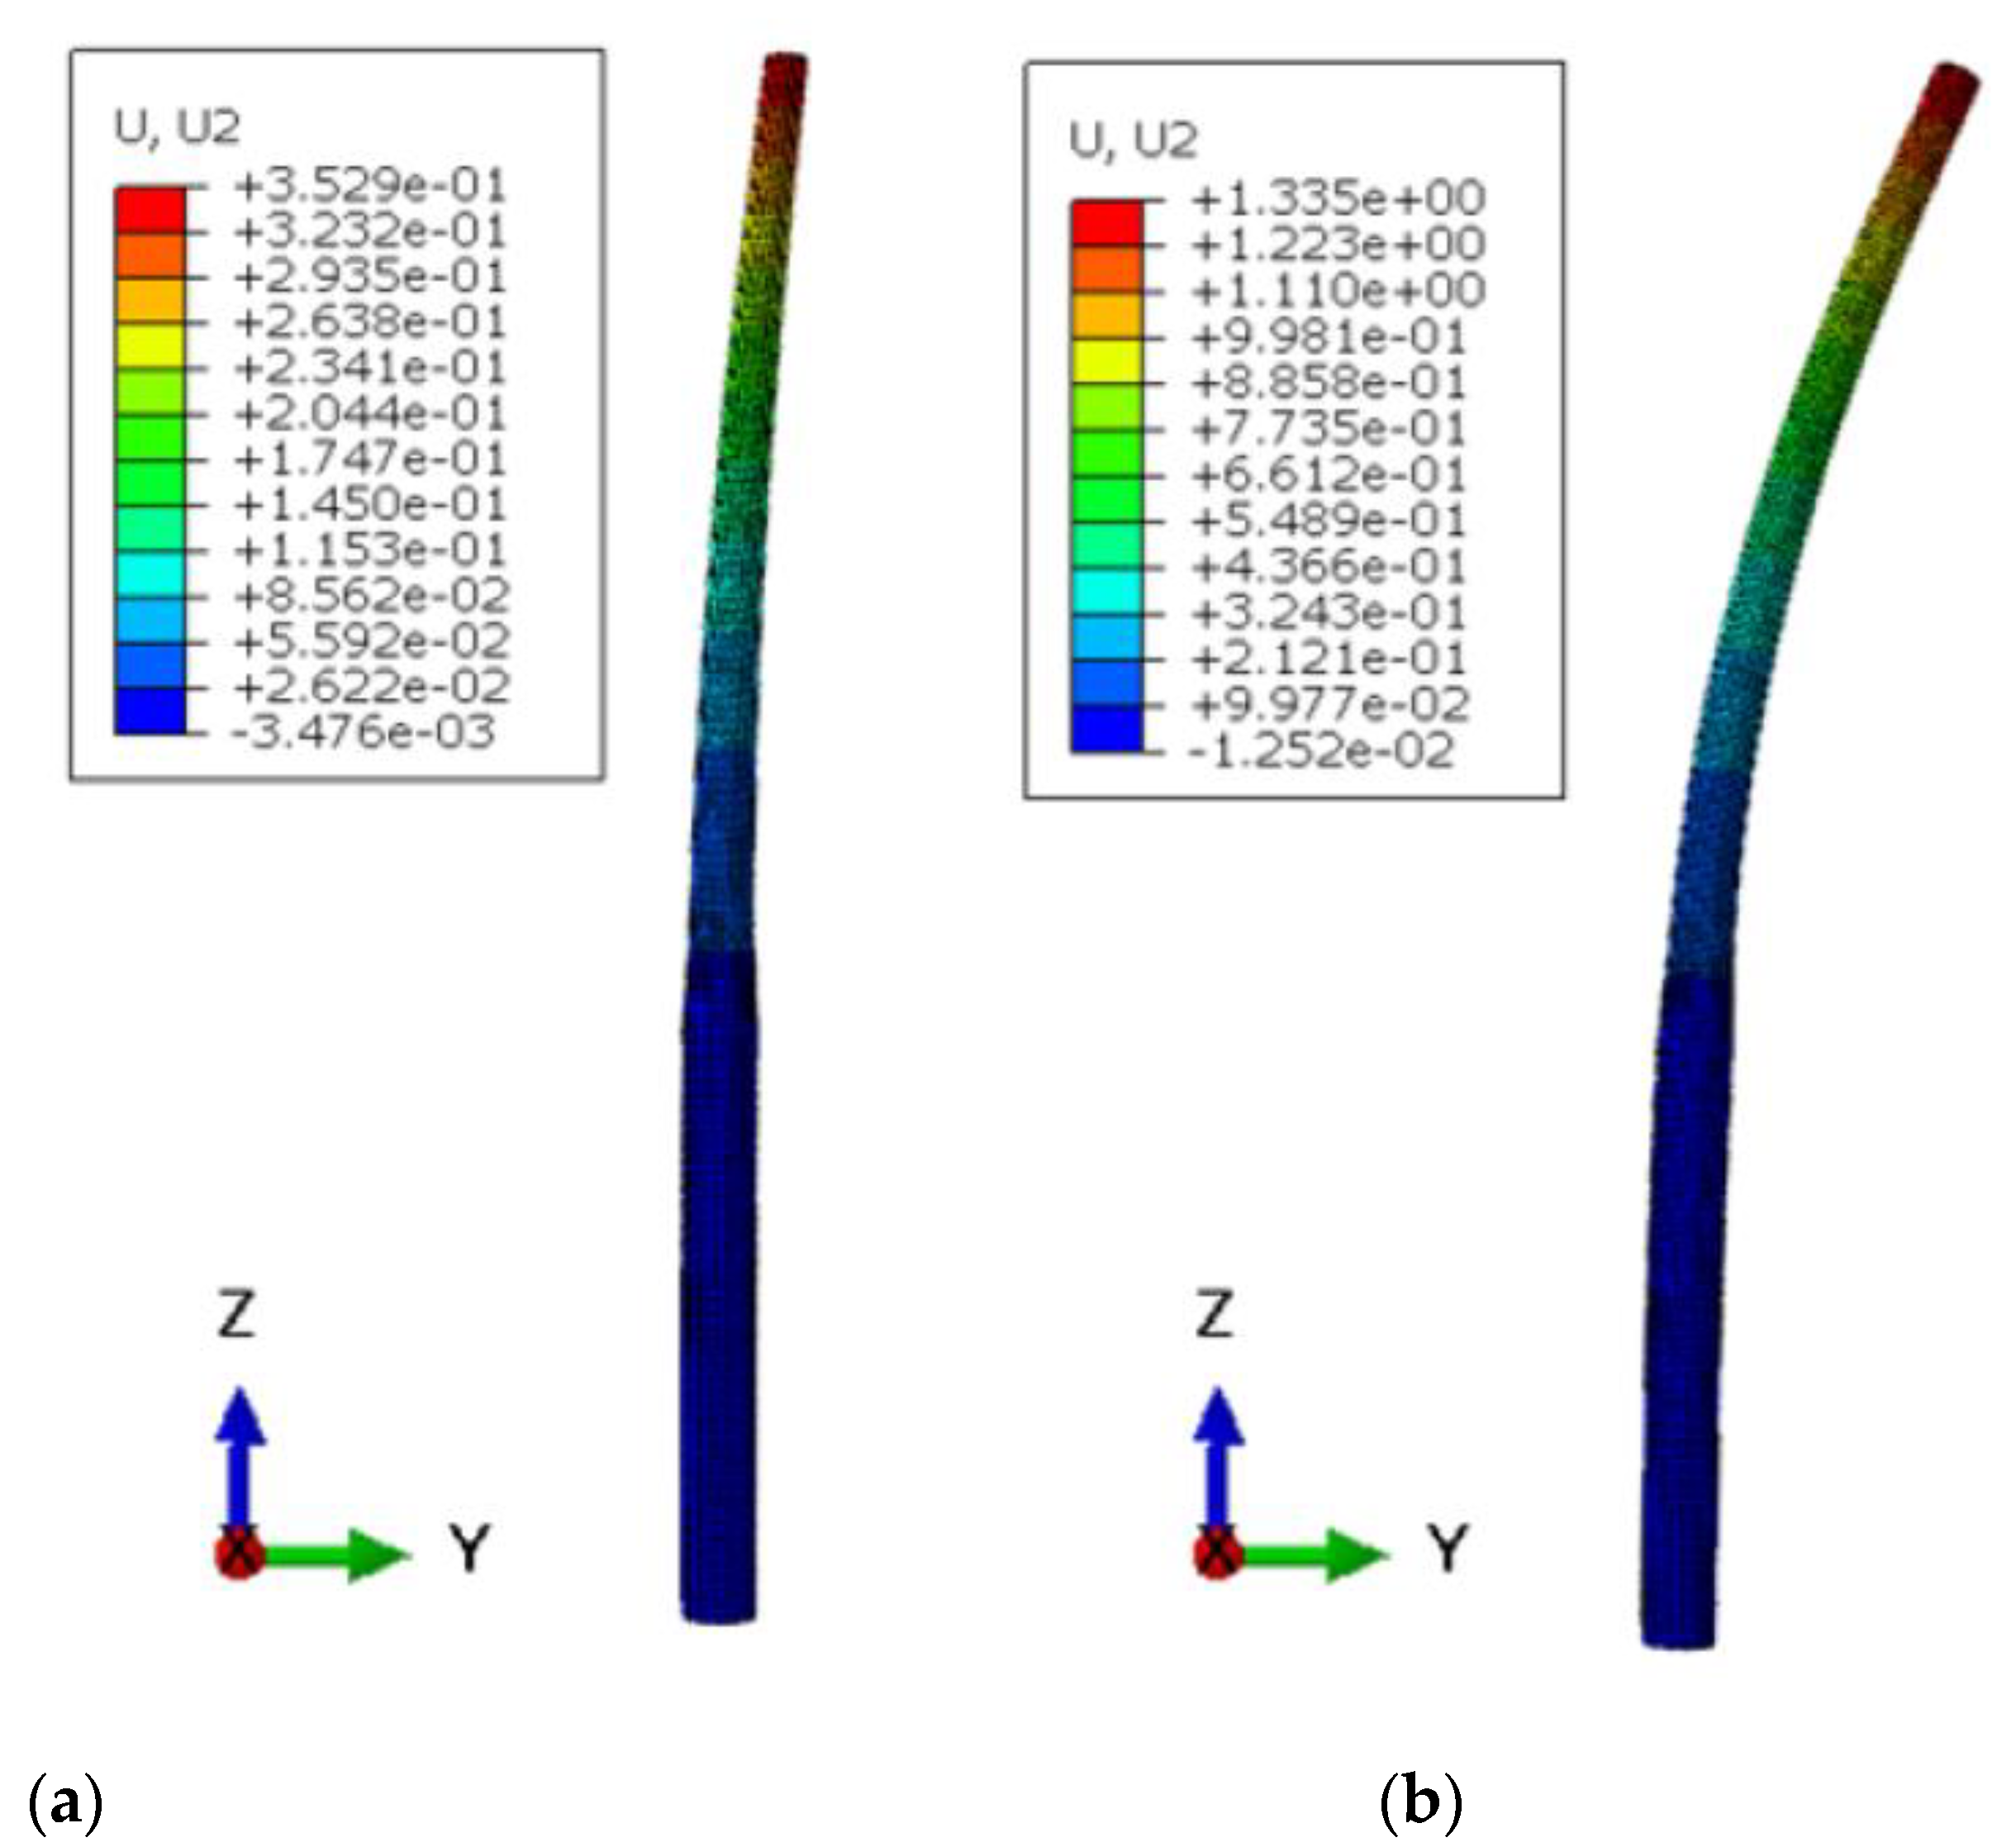
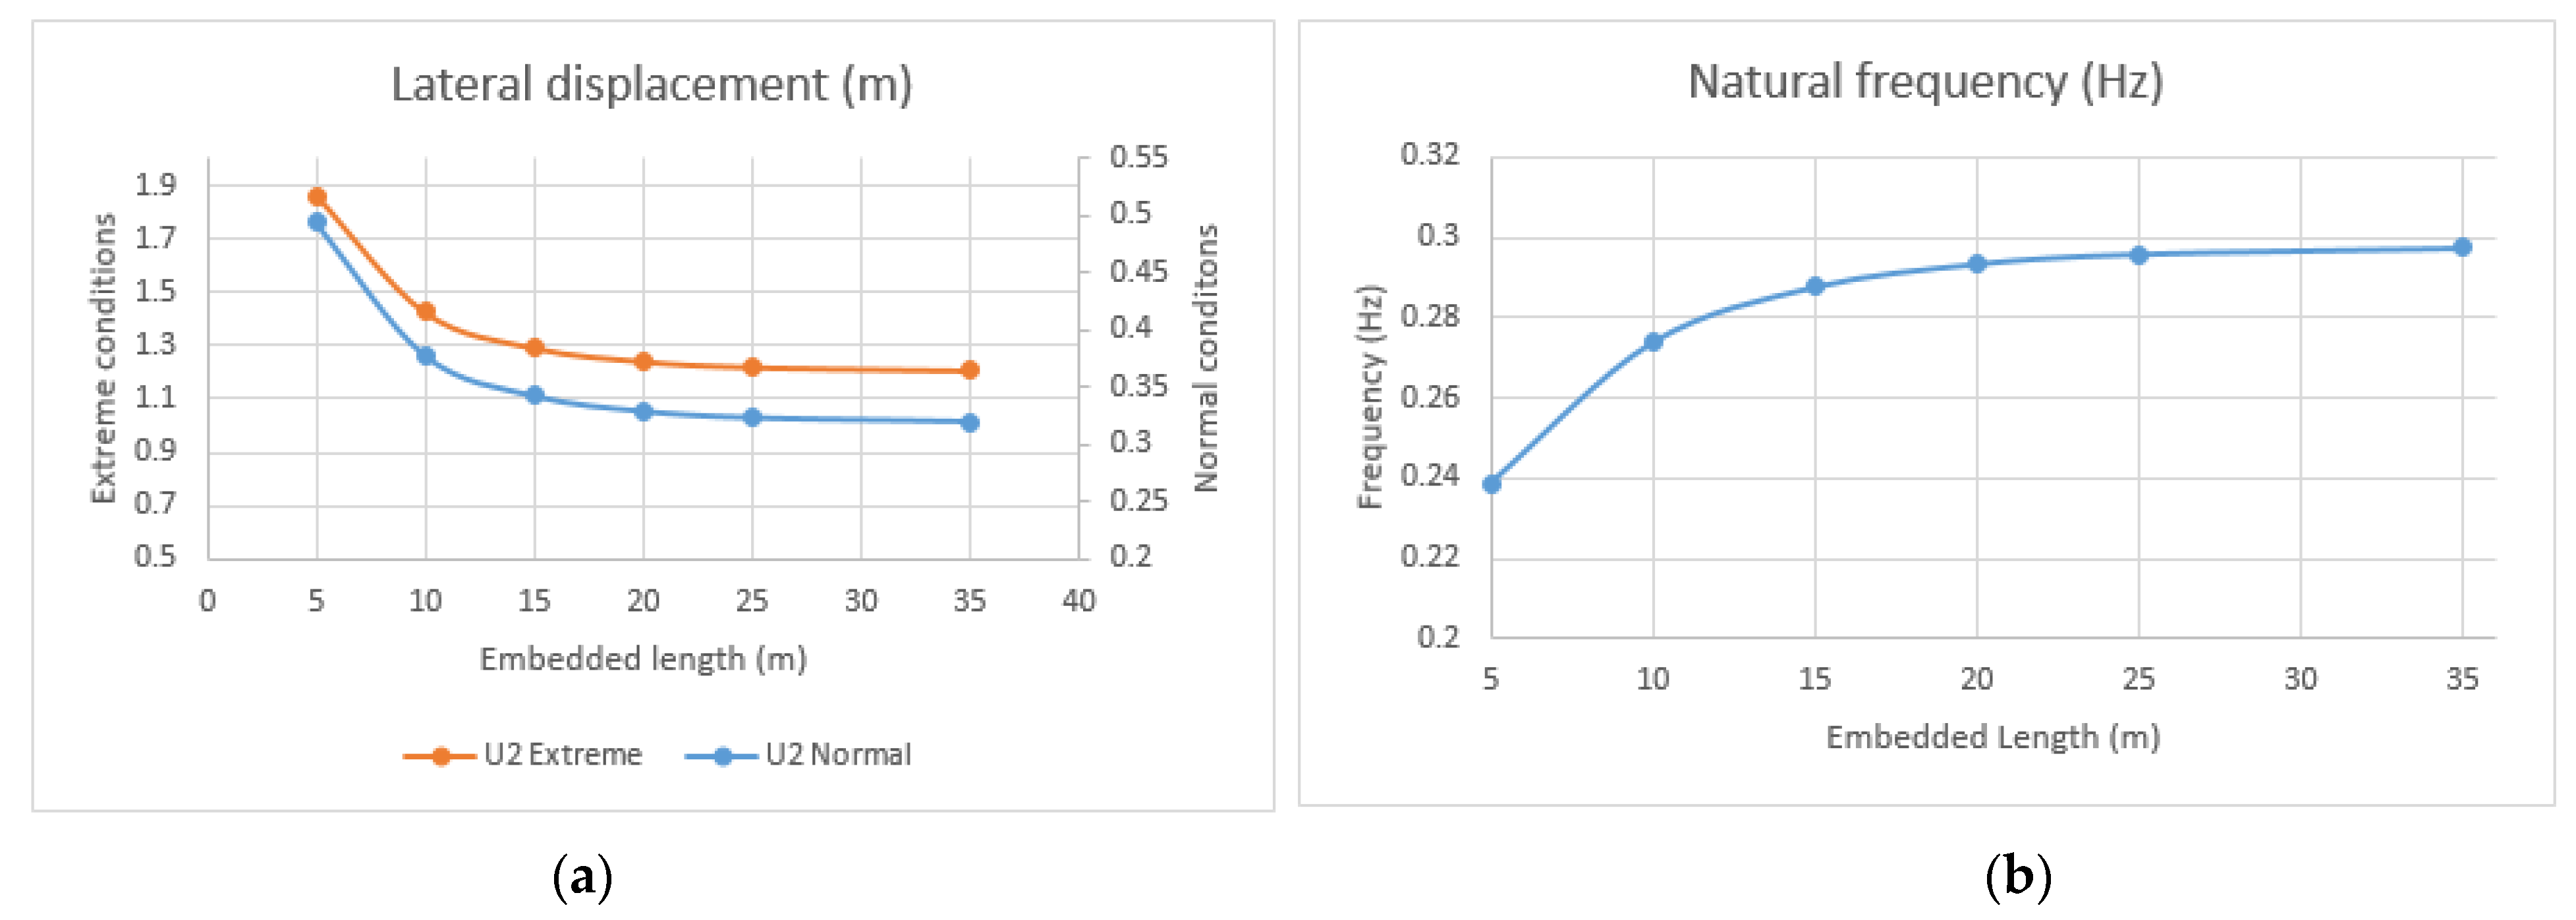
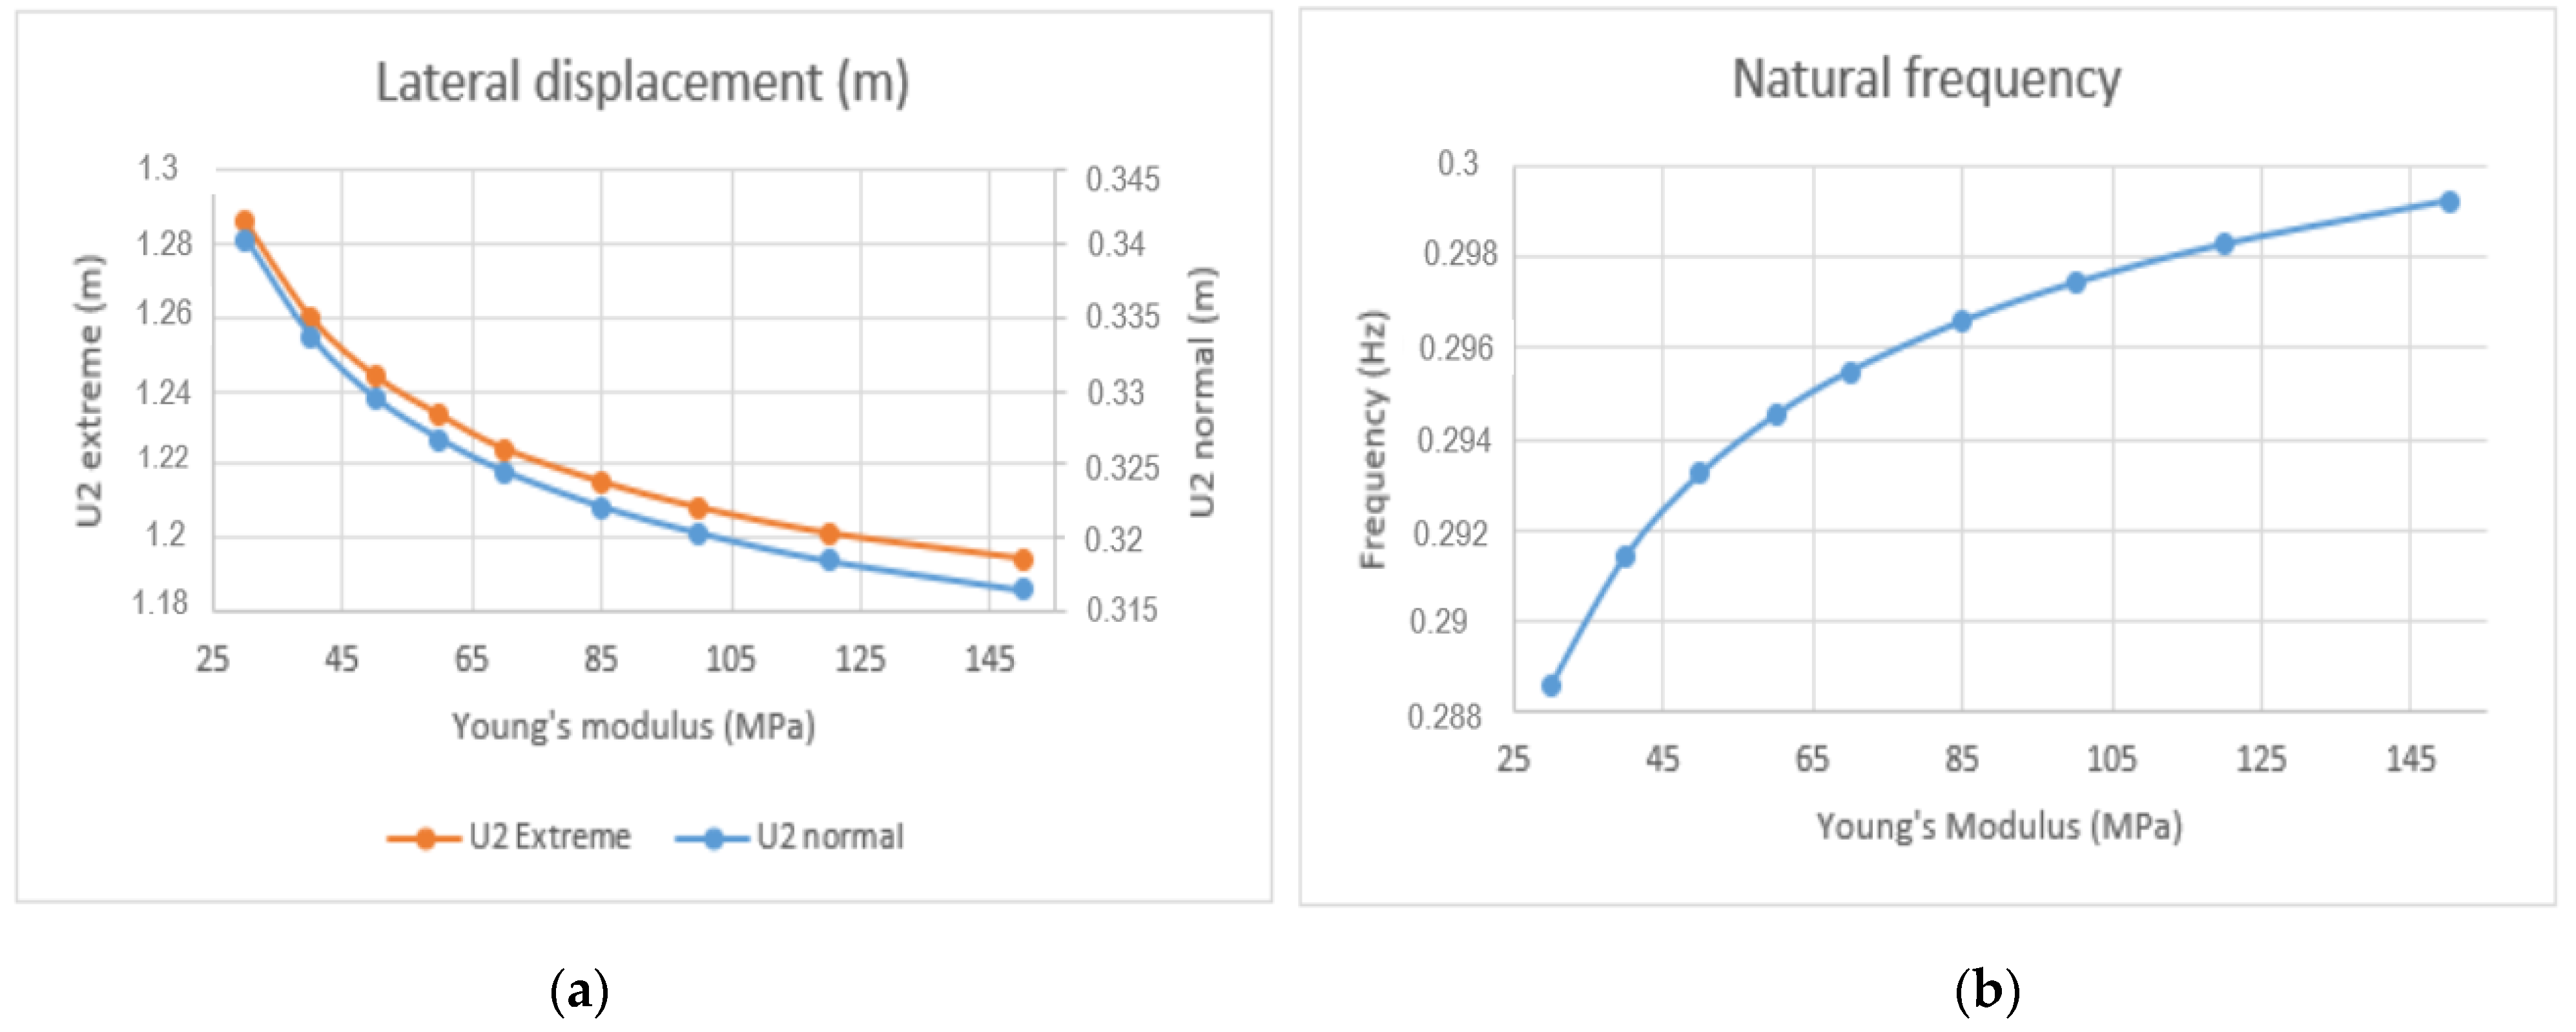
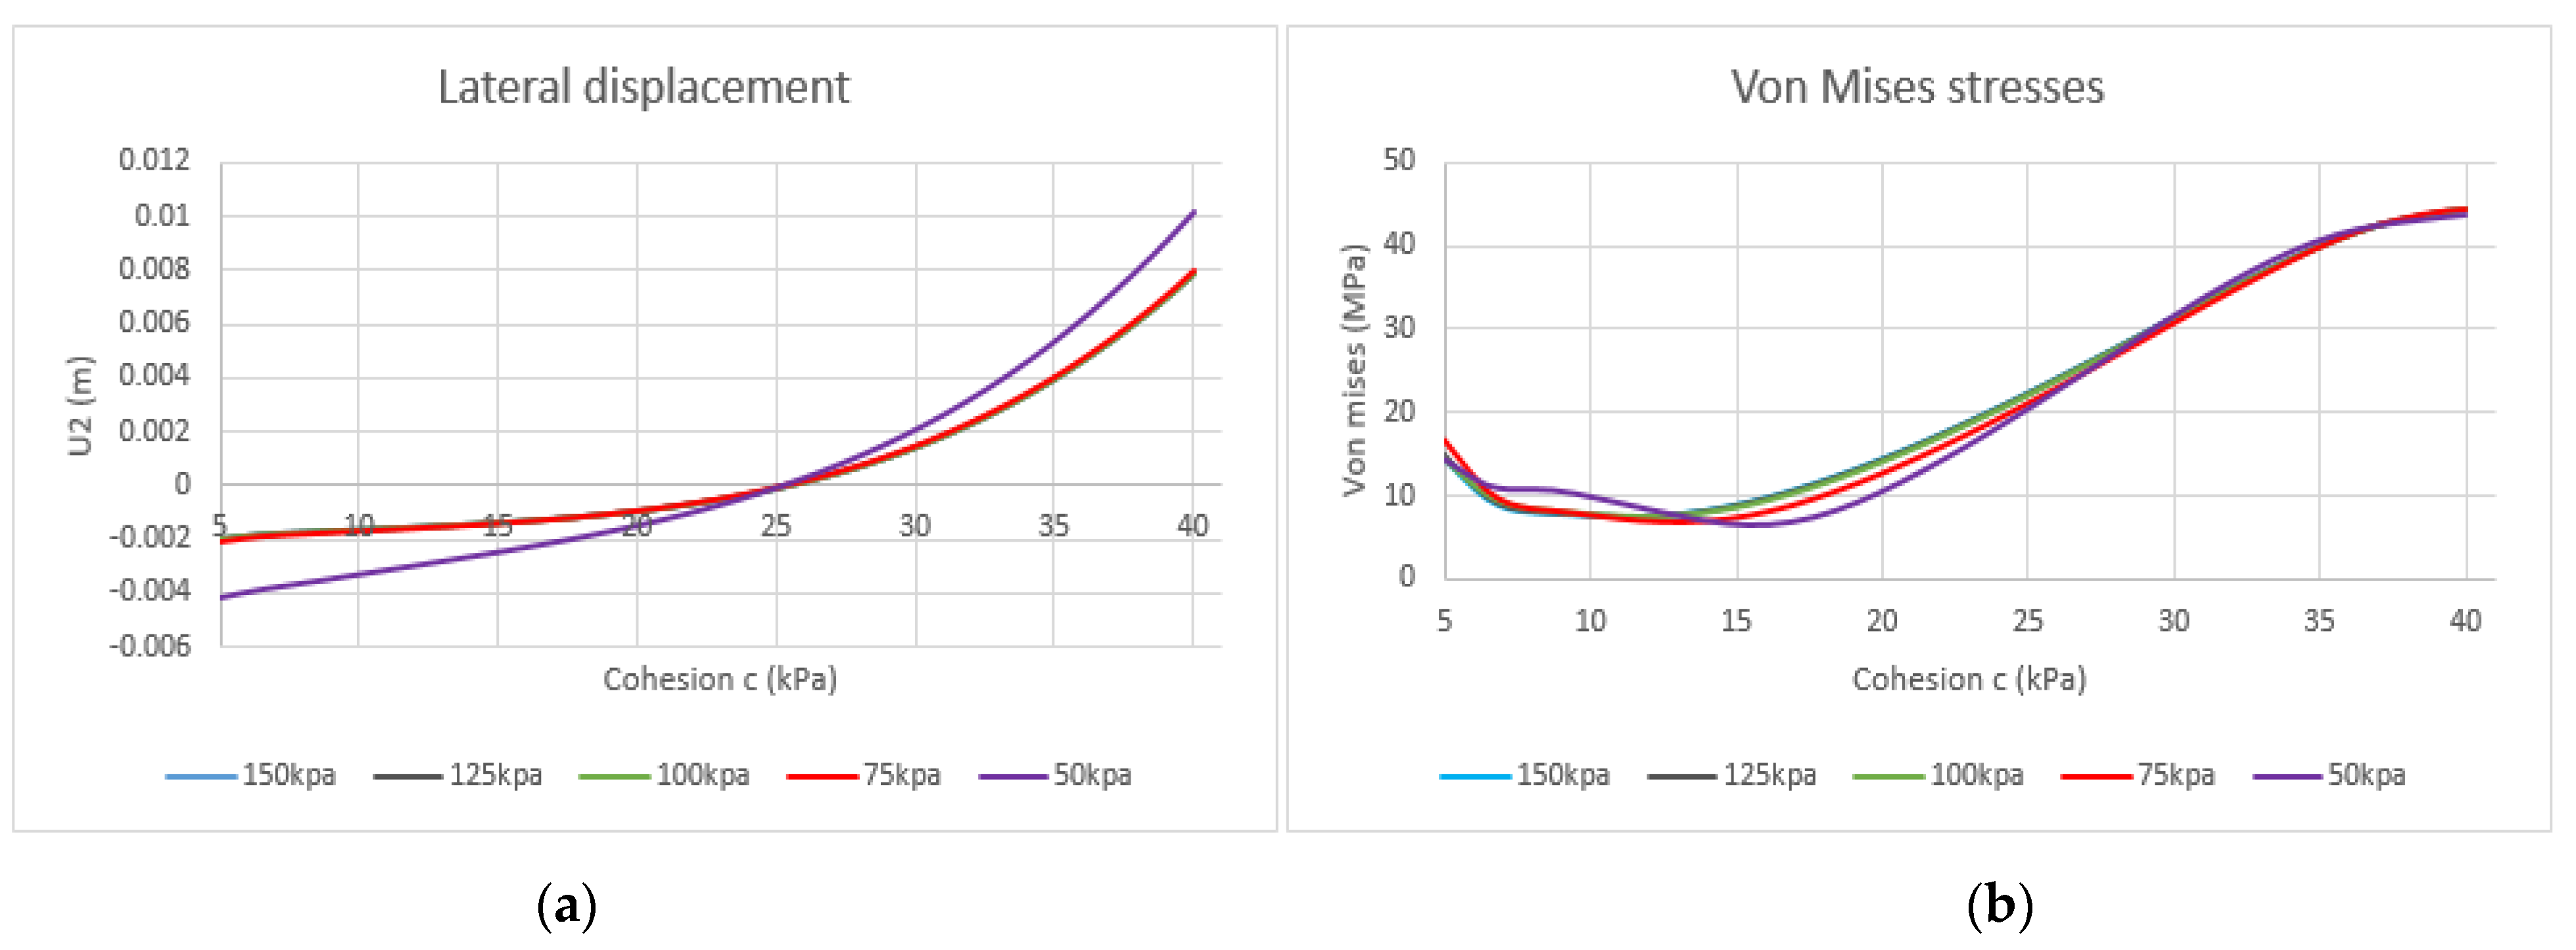
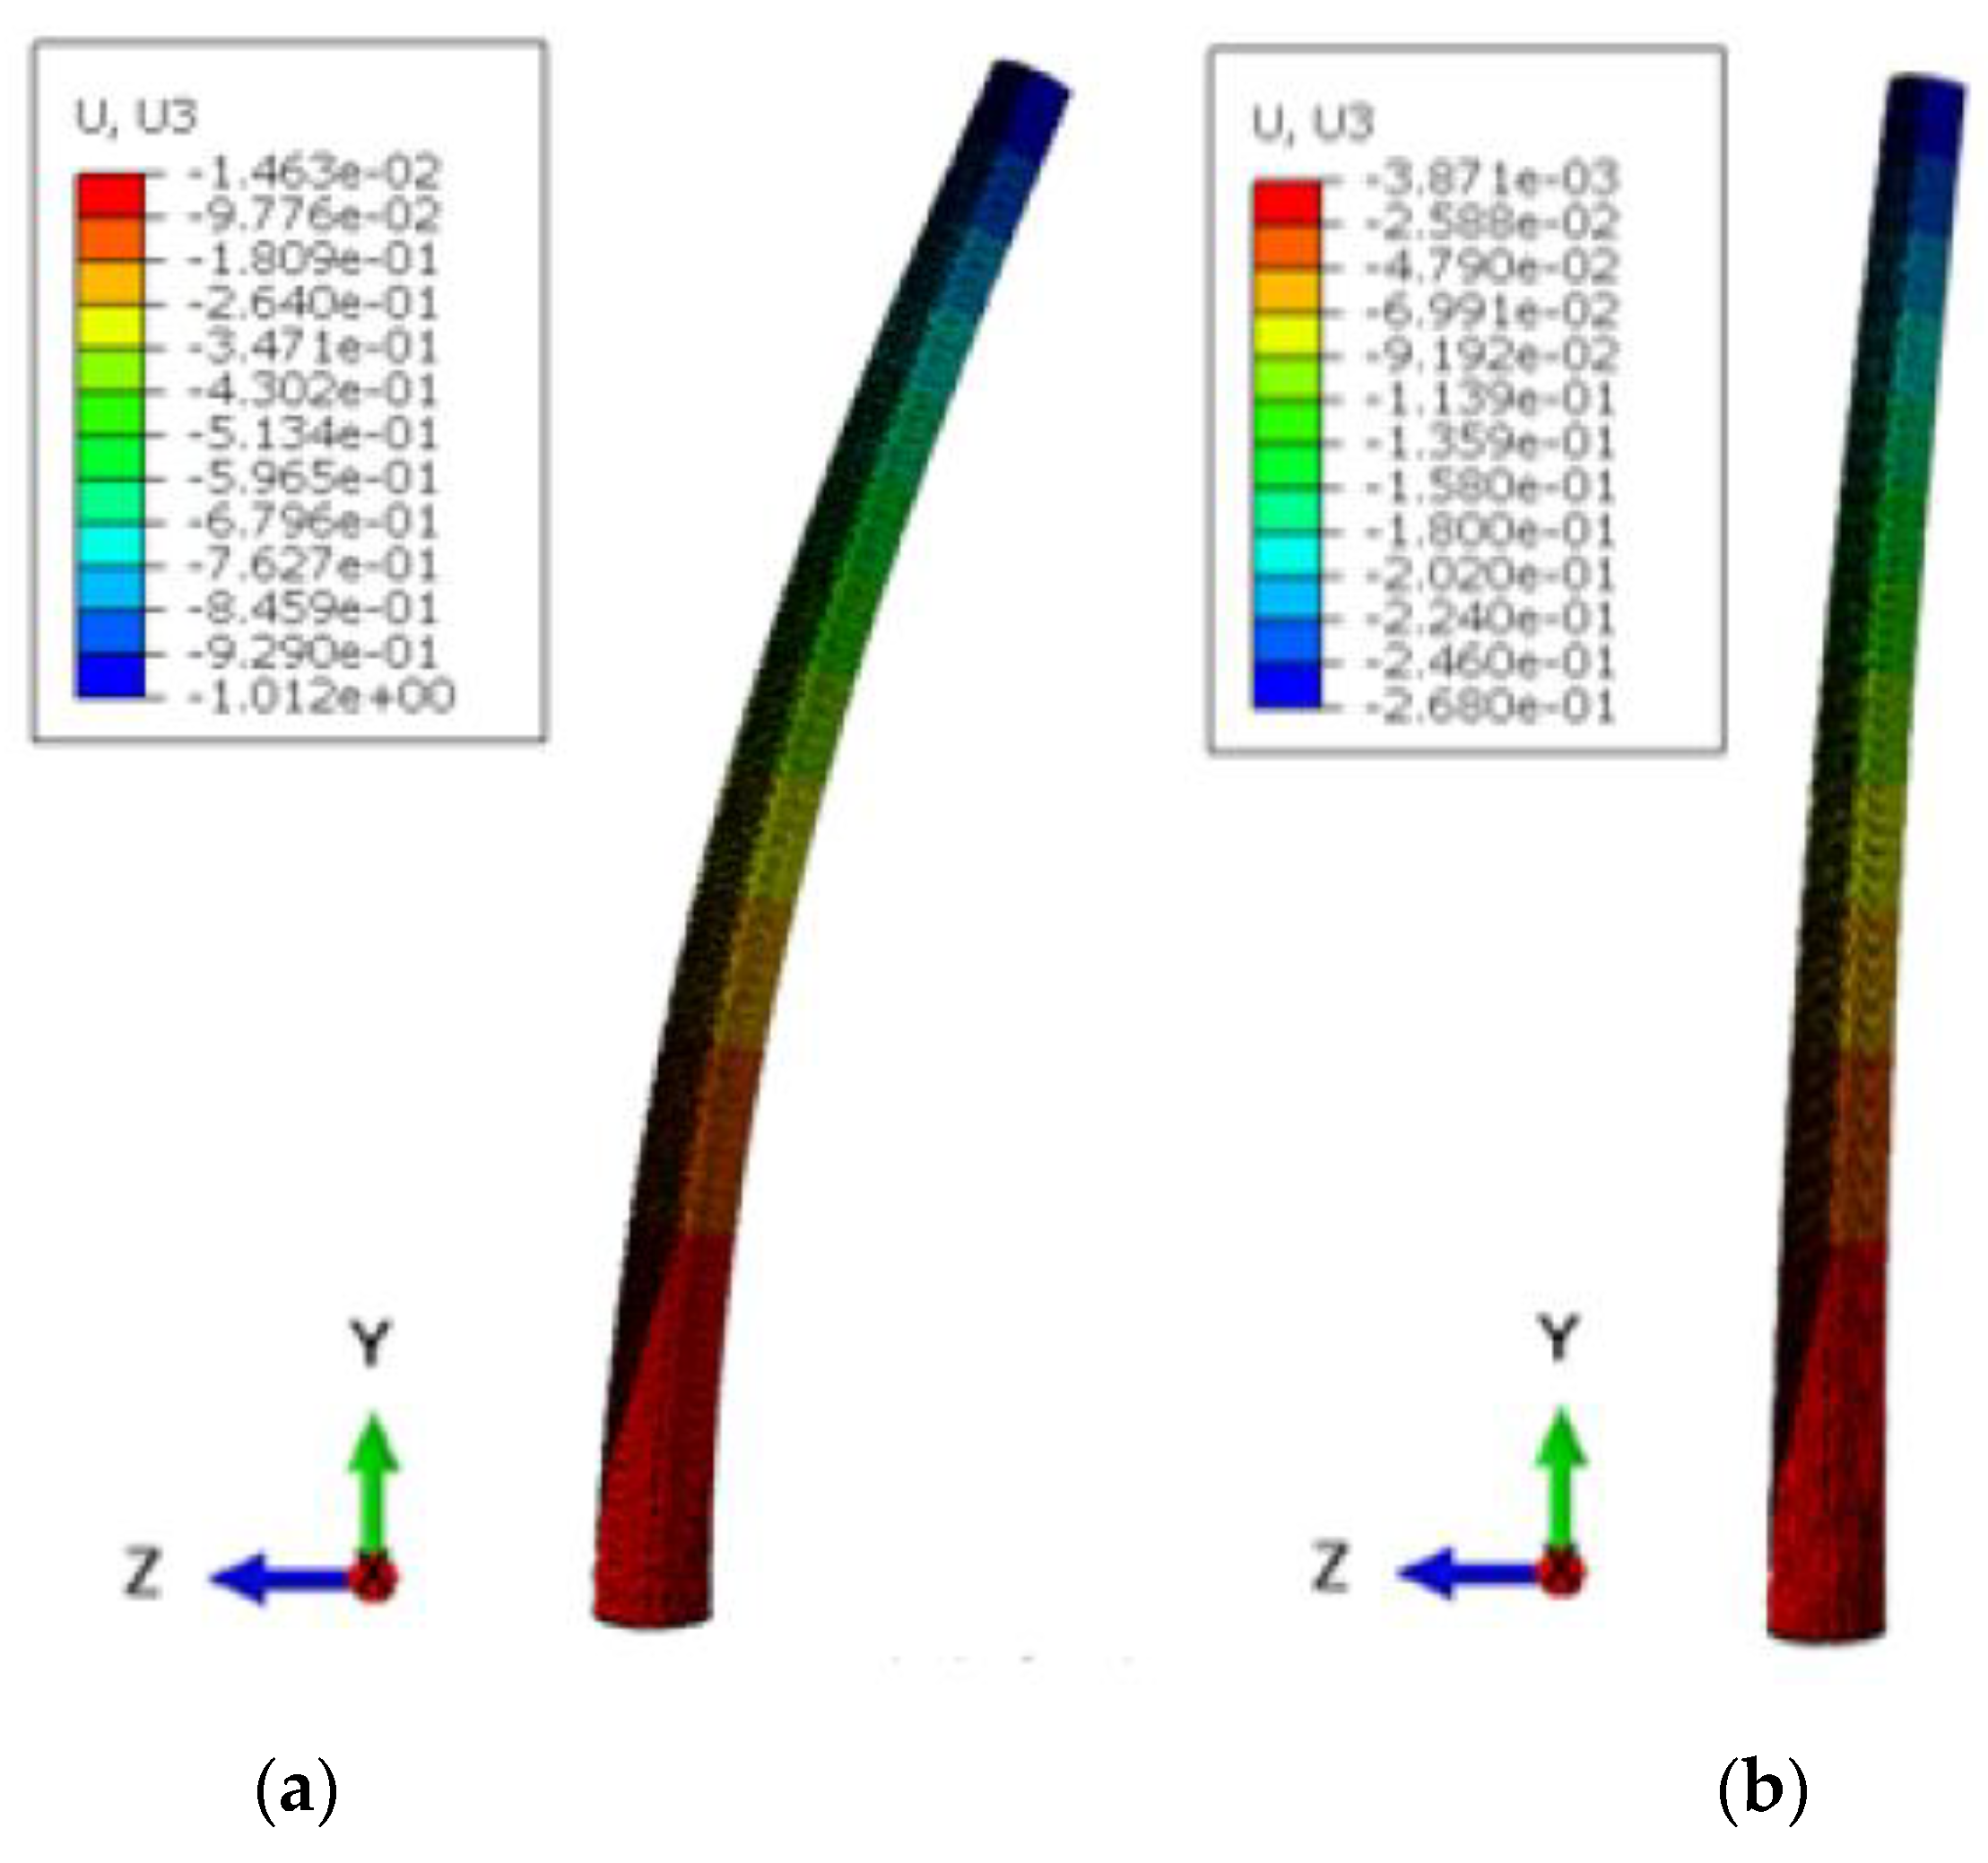
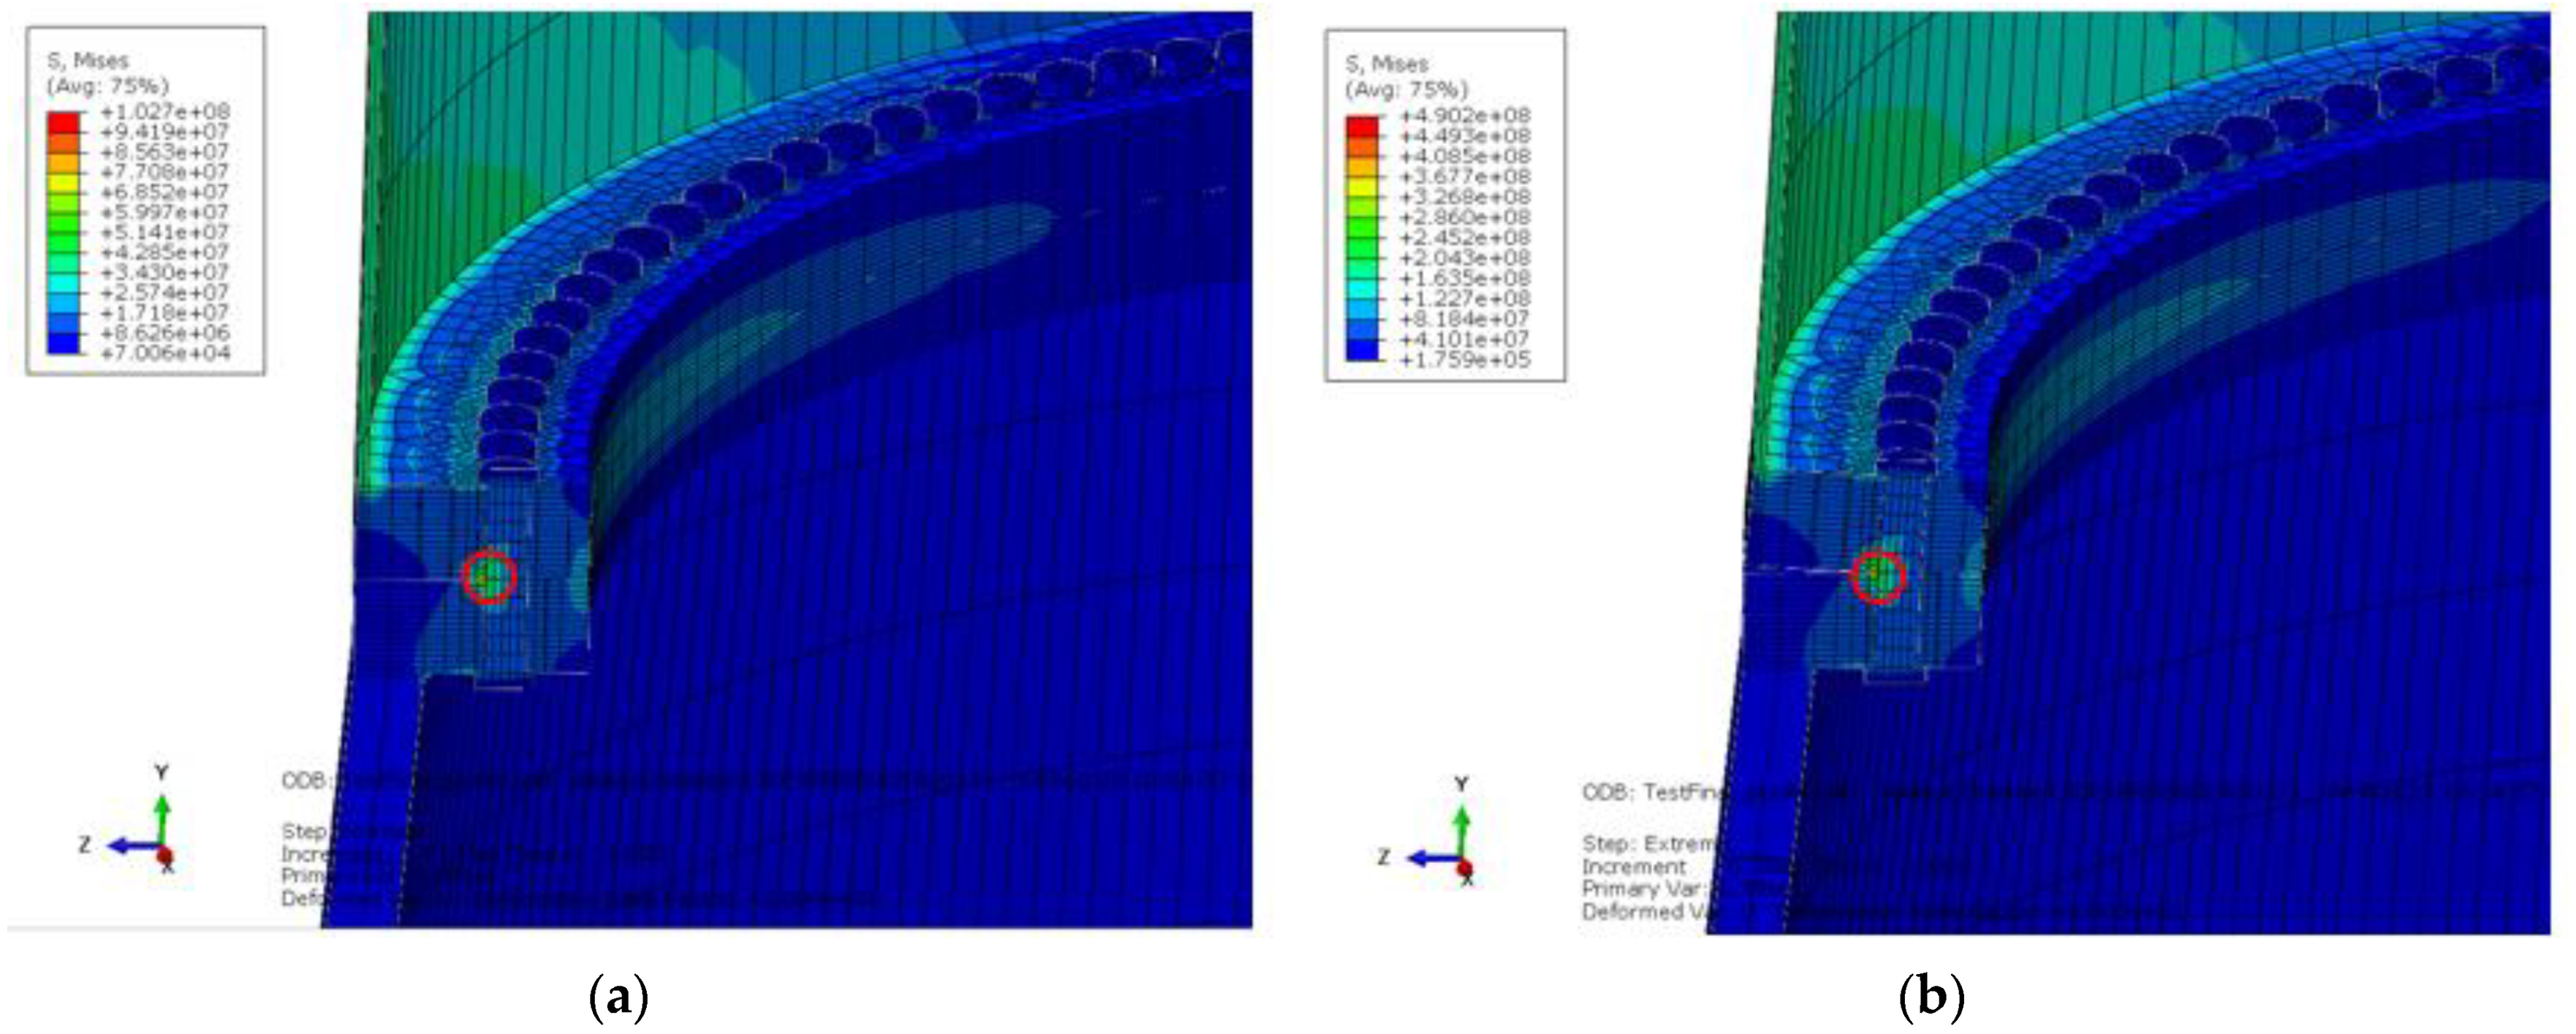
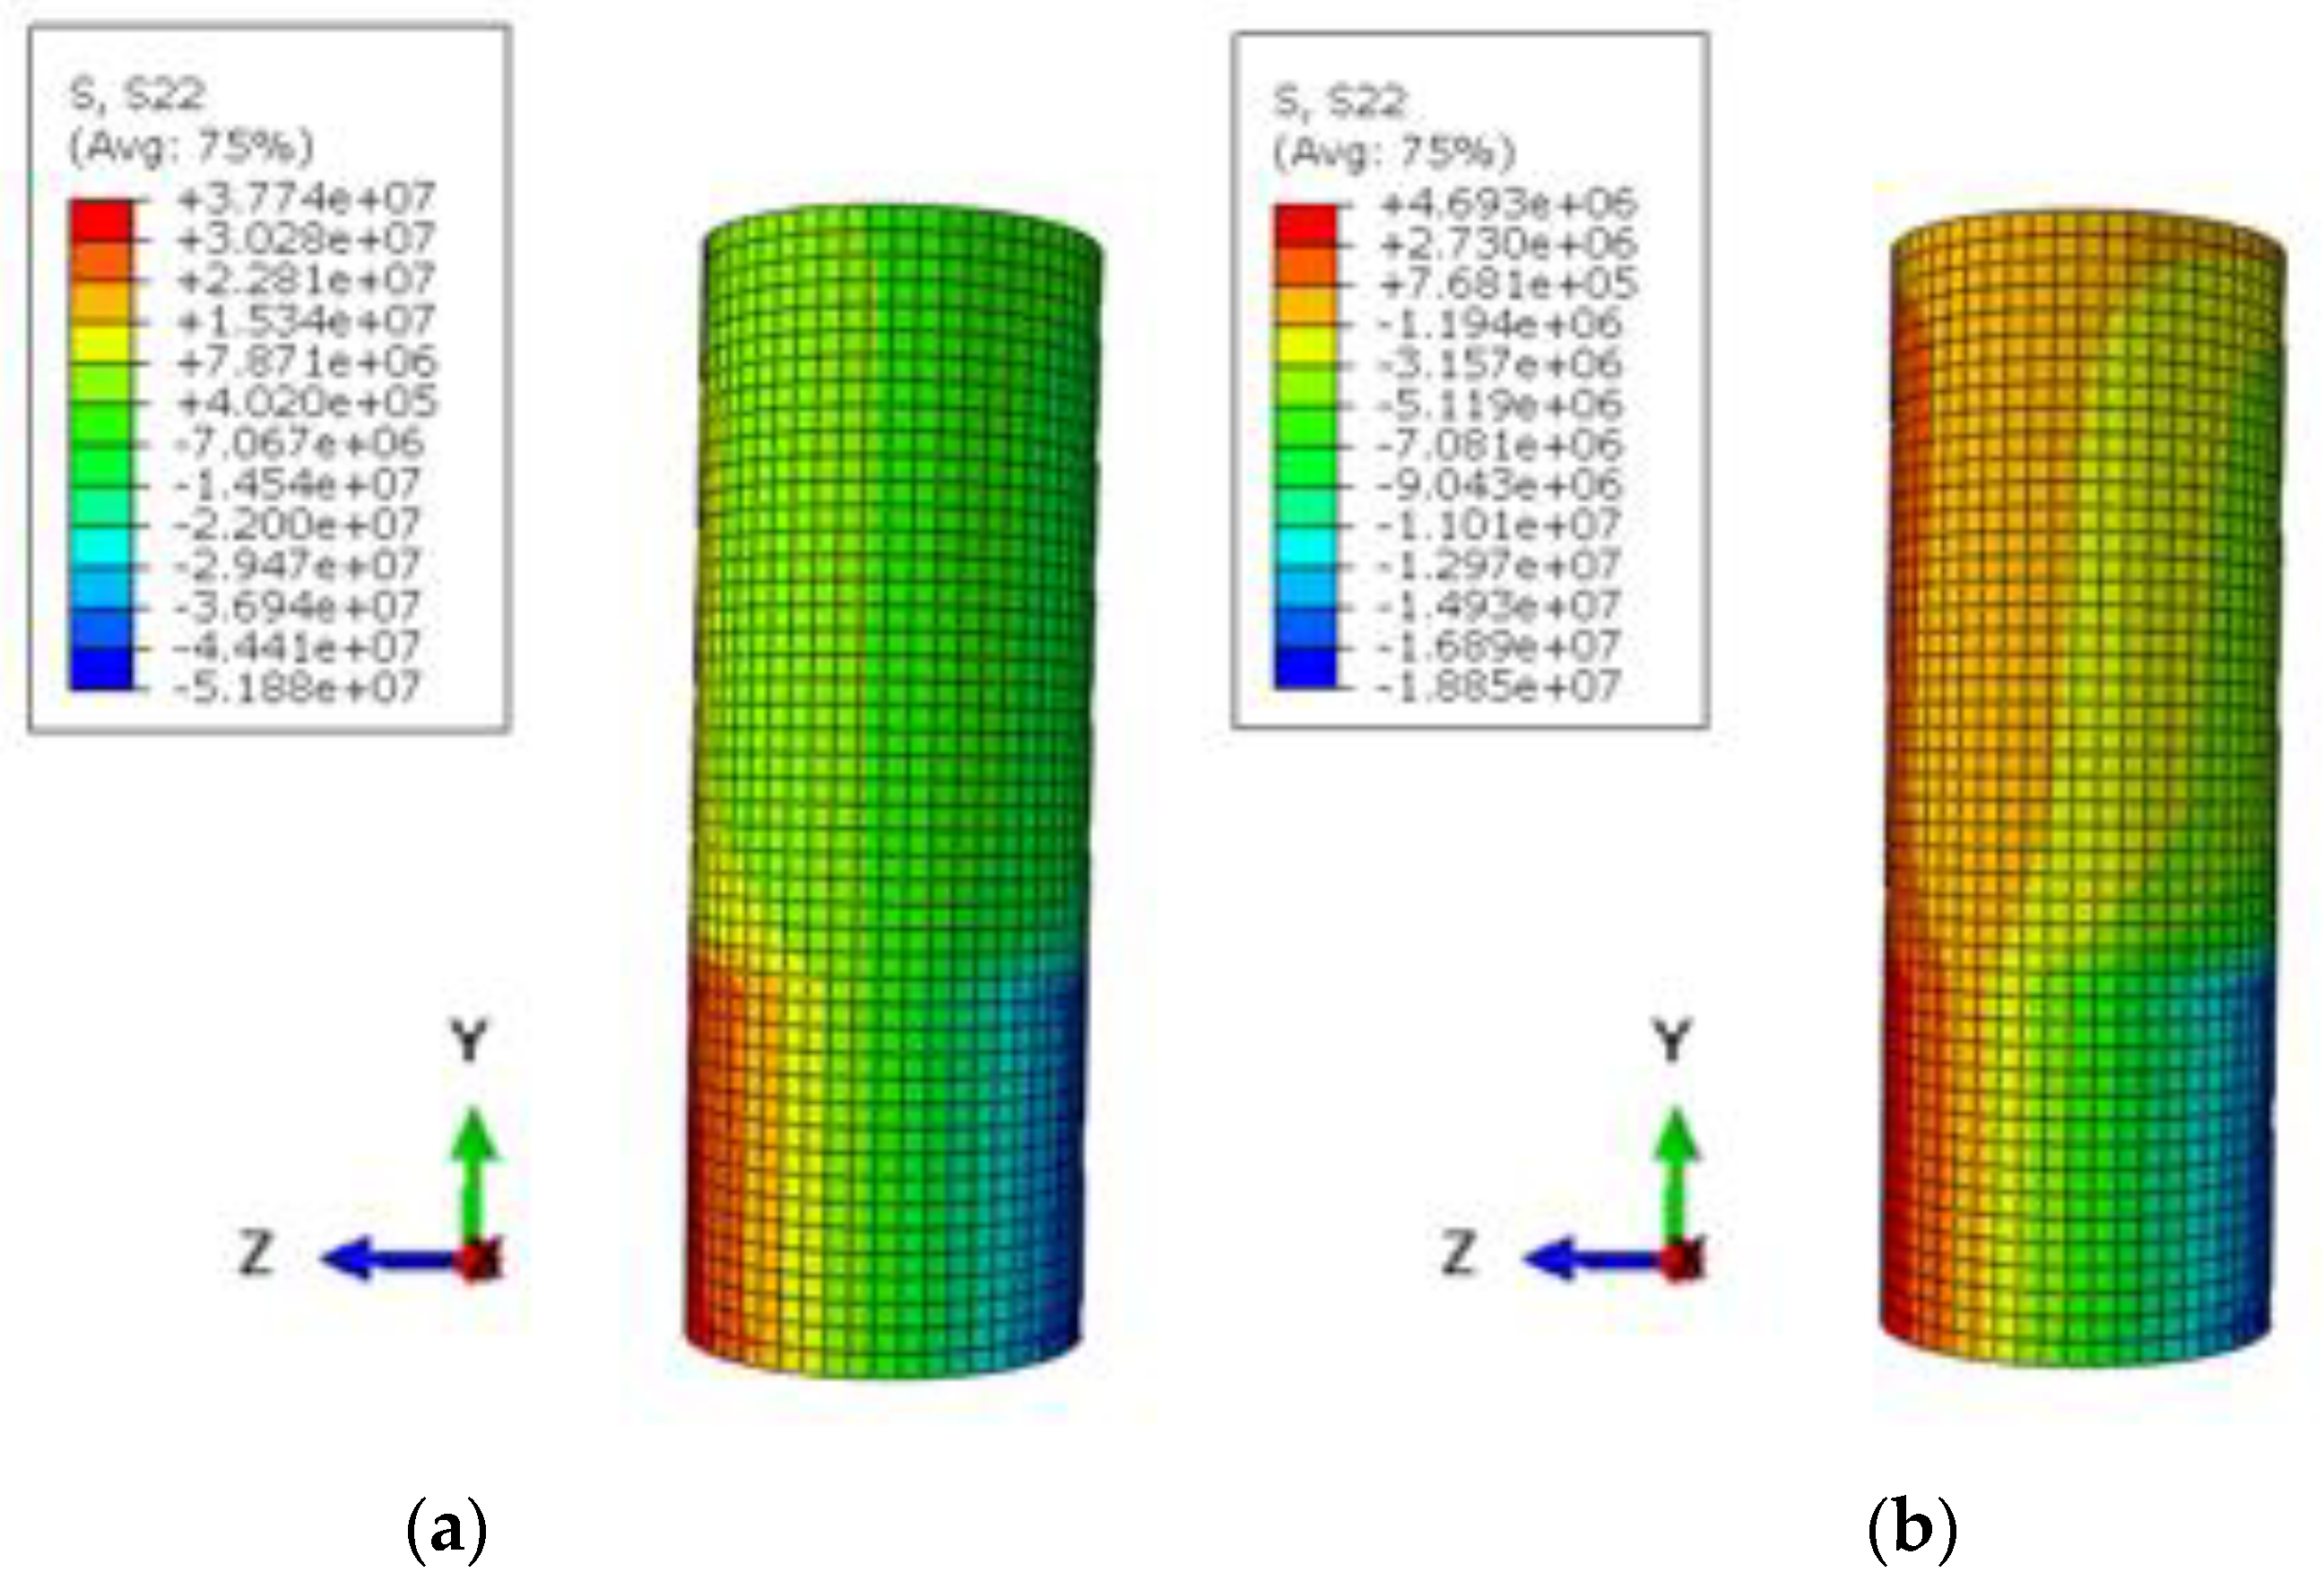
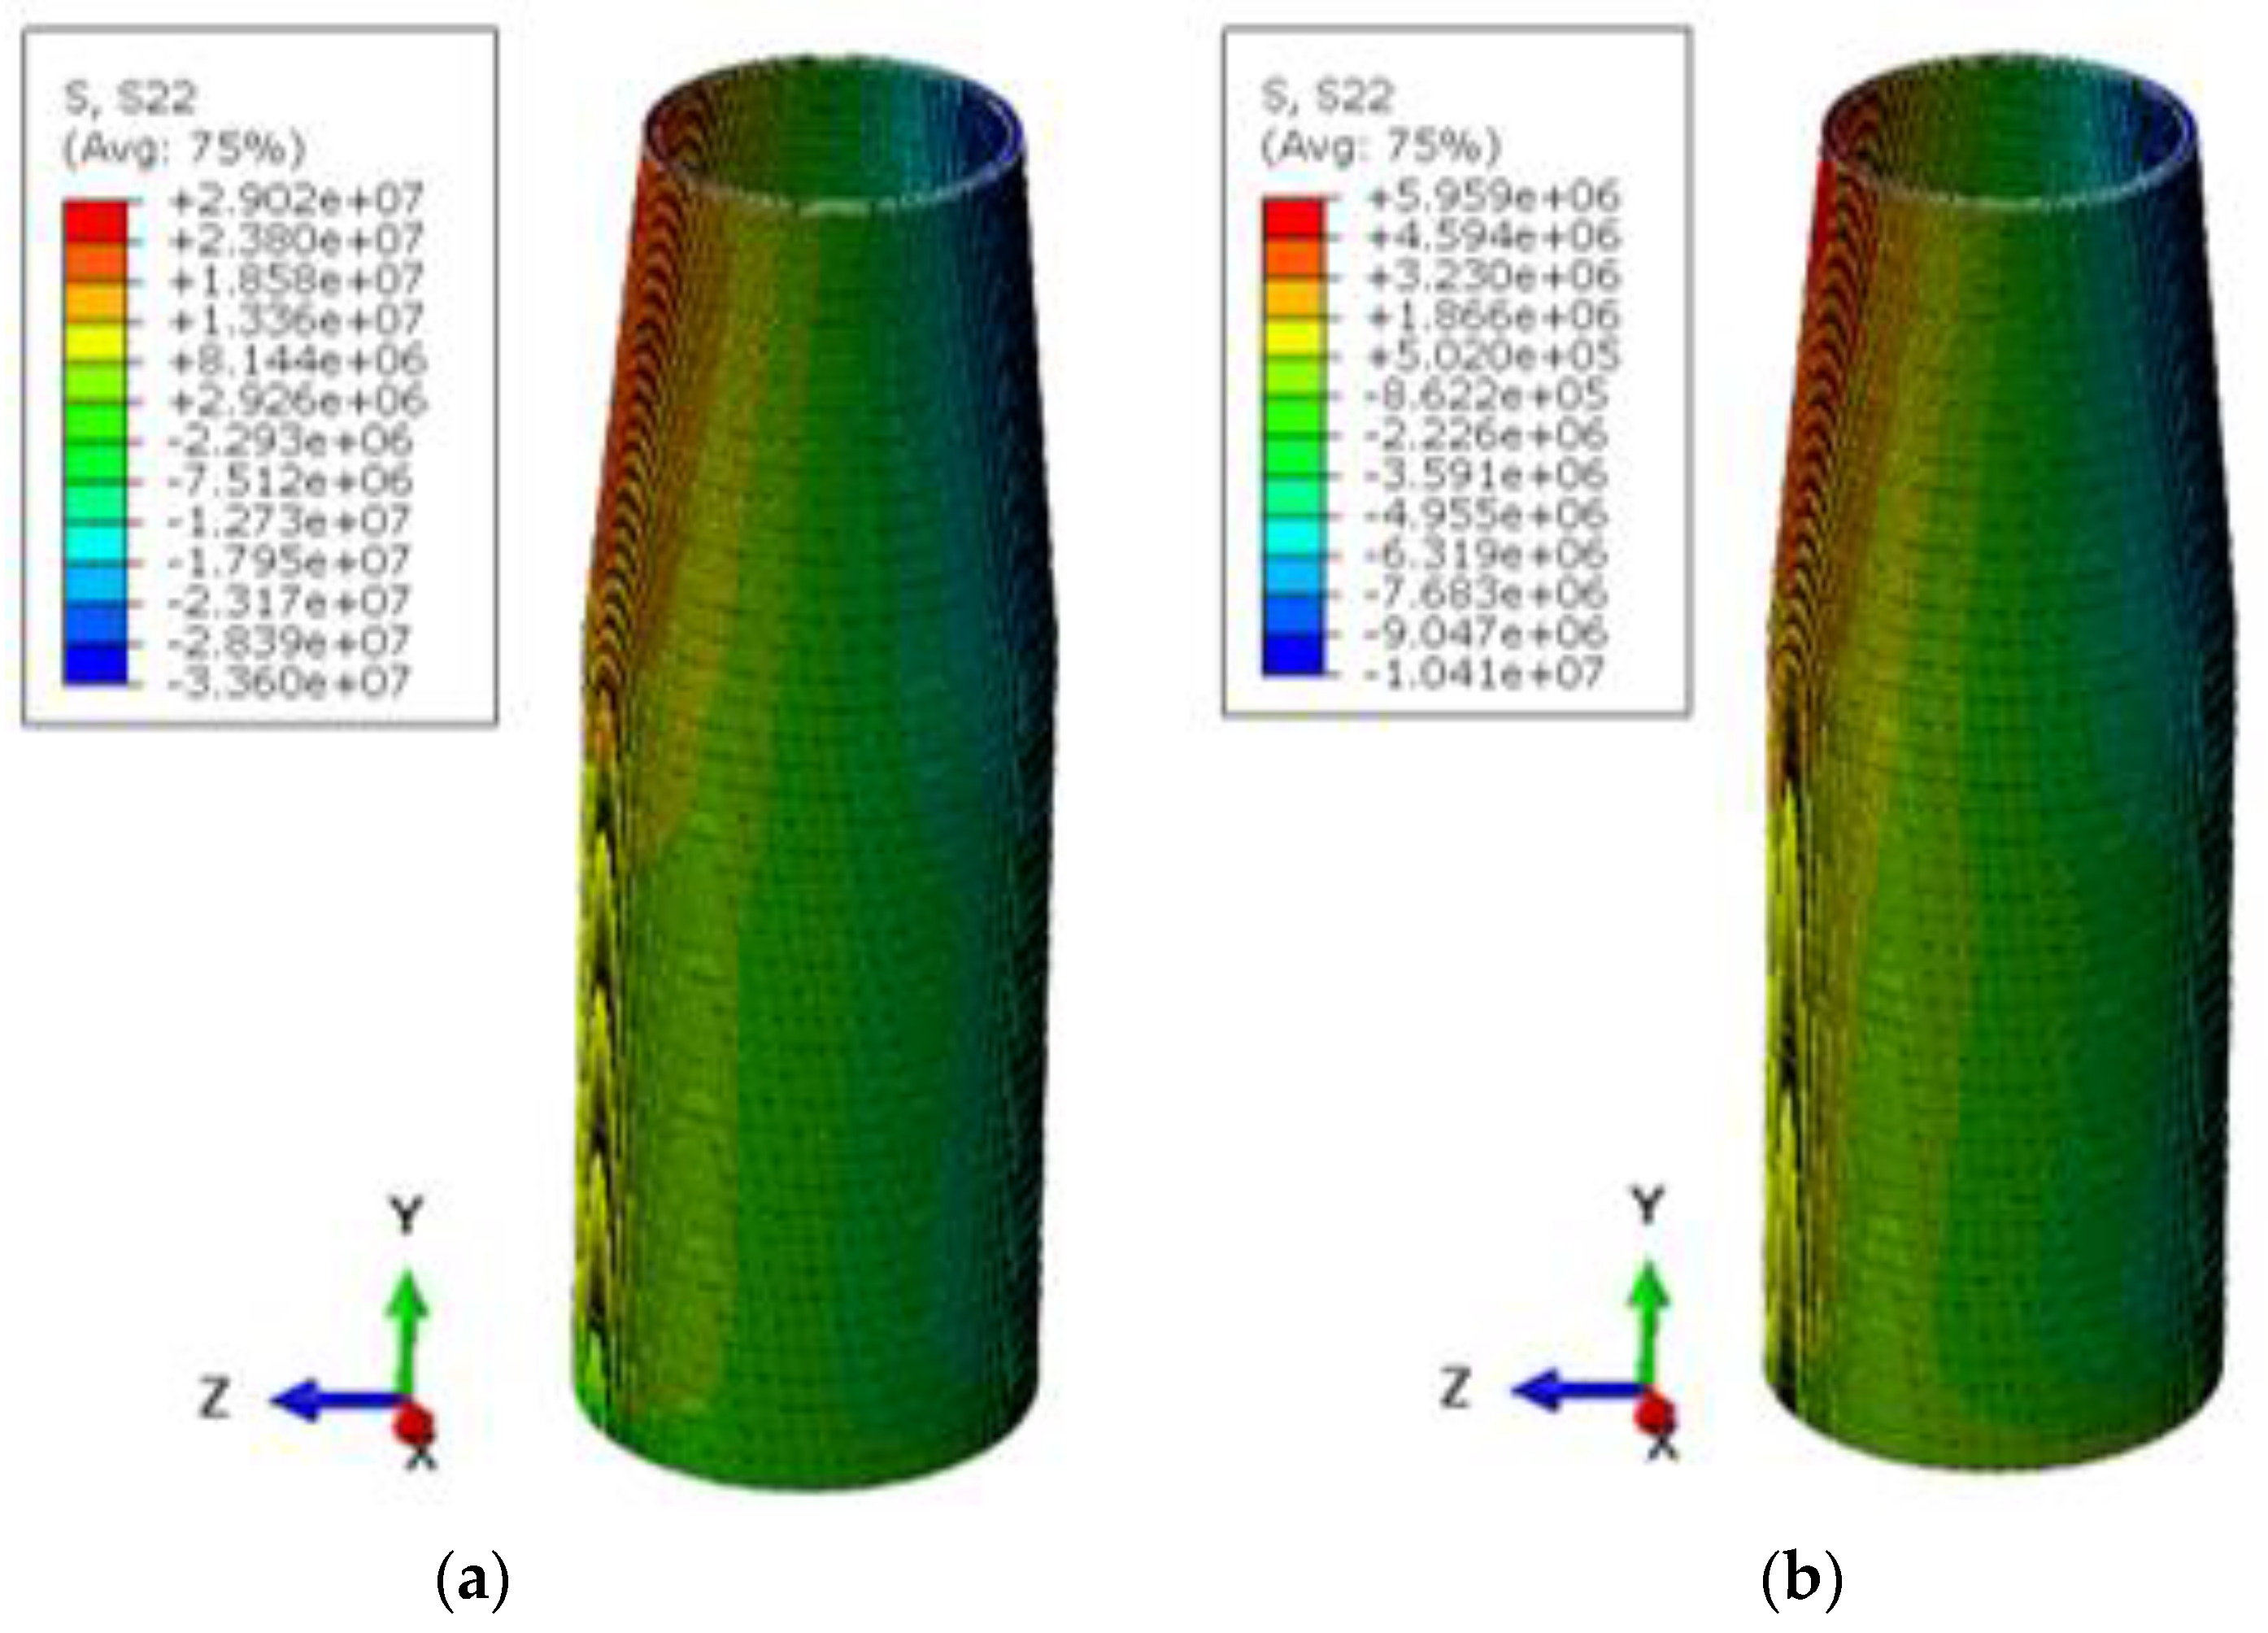
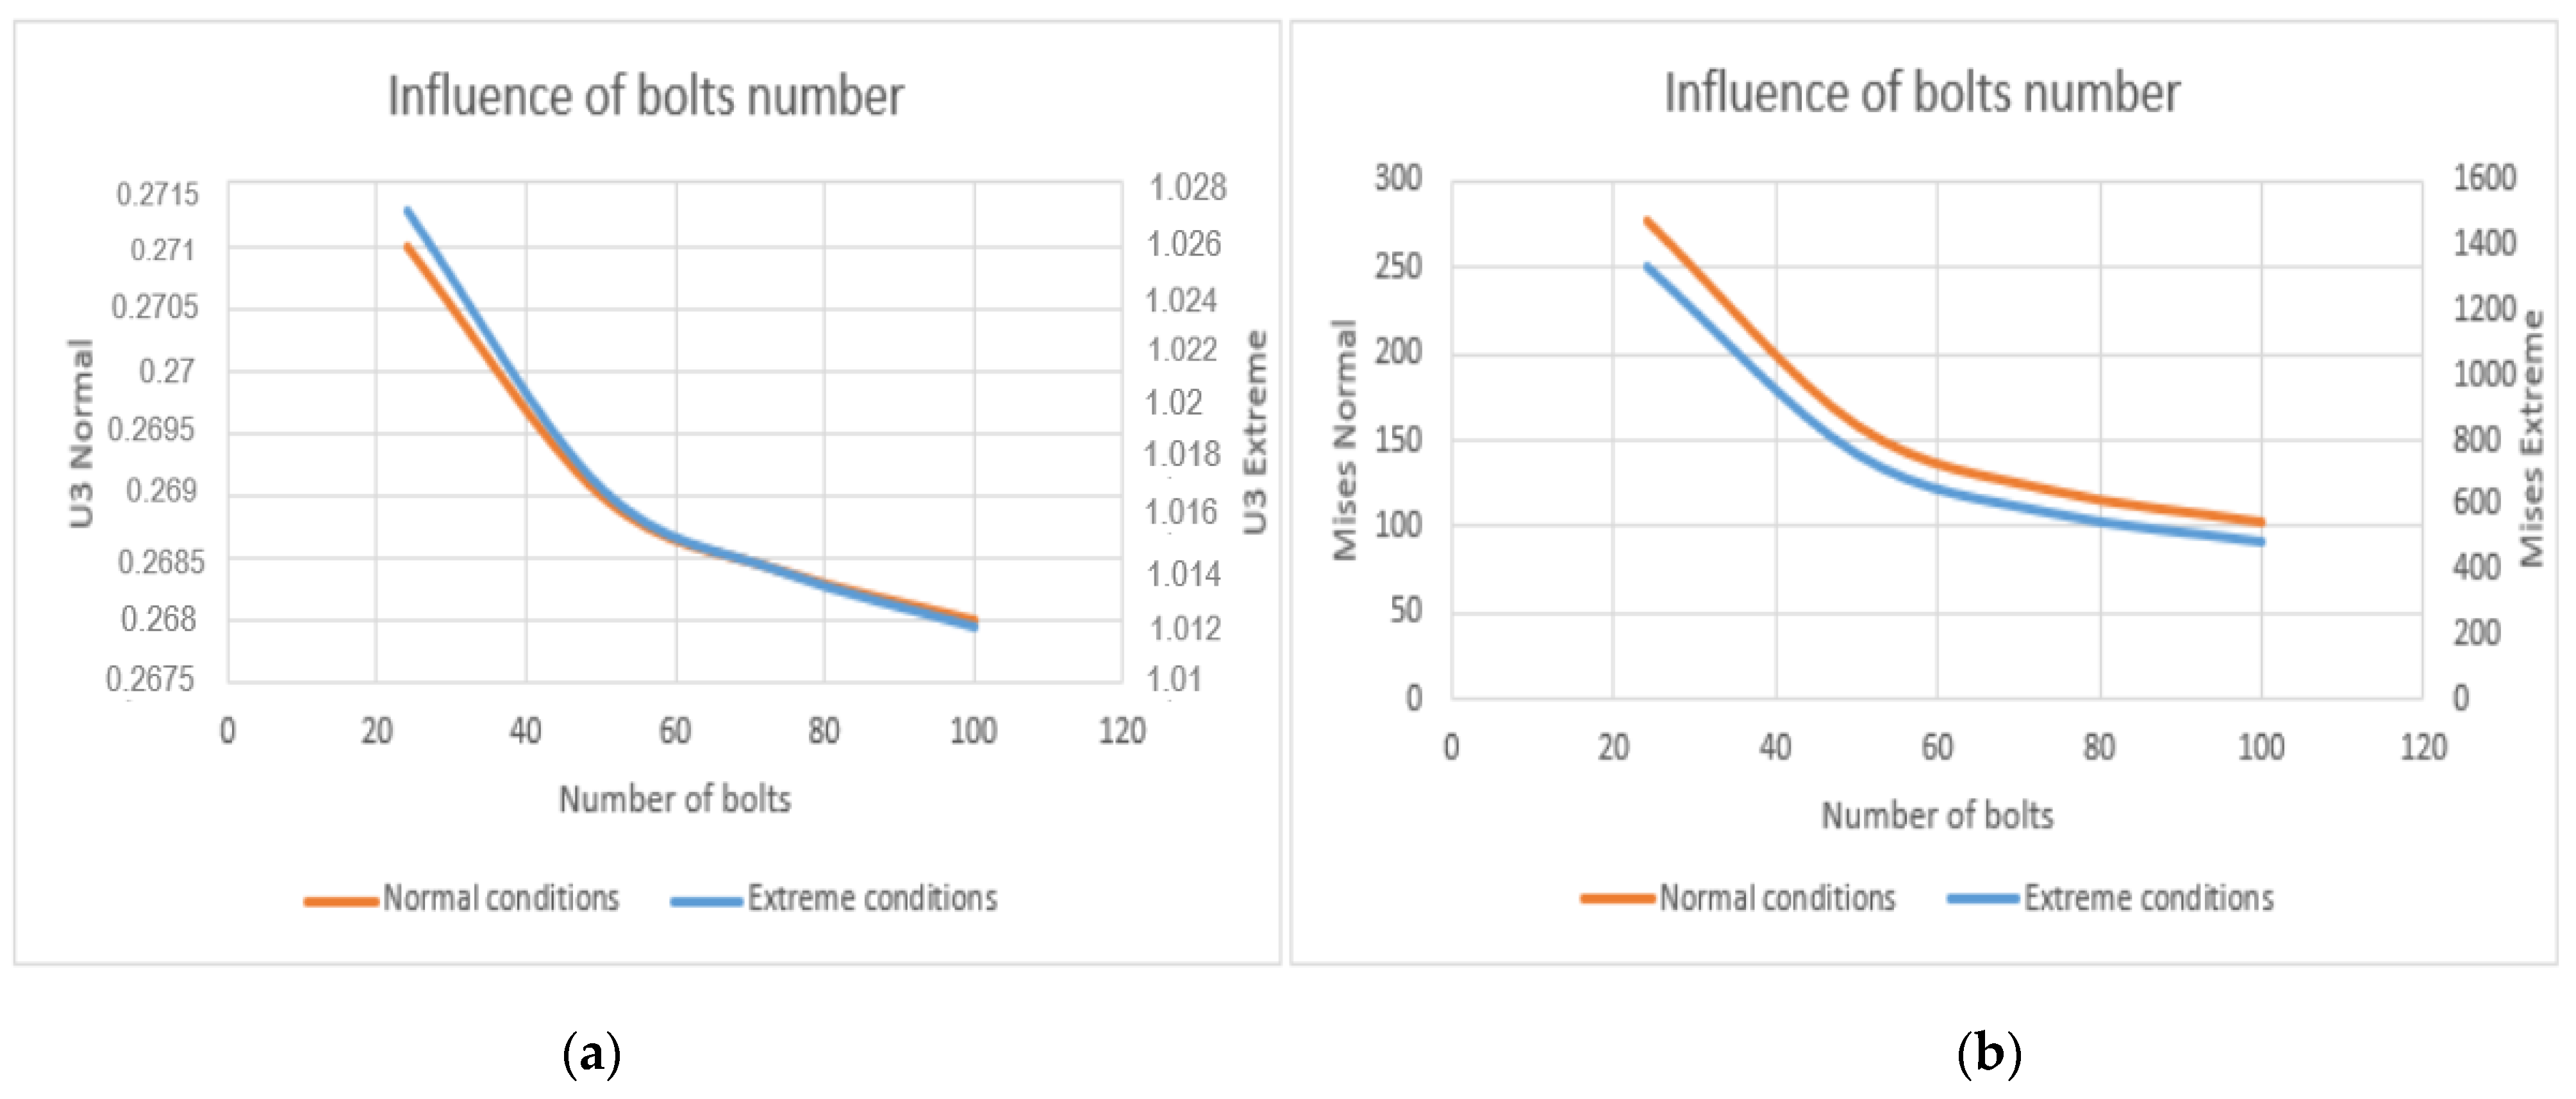
3.3. Design 3 Results

The maximum displacement in extreme conditions is 1.012 m (see Figure 18), and under normal conditions is 26.80 cm. We can note that these displacements are smaller than with the simplified model. Indeed, the transition part has a greater constant thickness along the piece in this model than in the first model.
As there are holes in both the tower and the transition piece, stresses will be higher. Unlike the lateral displacement, there is a significant difference in maximum stresses between the two models. As shown in Figure 19, the maximum von Mises stress in normal conditions is 102.7 MPa, while it is 490.2 MPa in extreme conditions. This may be due to the fact that there is a bolted flange connection in this model [81]. Consequently, as the tower and the transition part only lean on each other and are only linked by bolts, the maximum stresses will be at the contact surface, close to the holes. The results of three types of design are summarised in Table 7.
The distribution of vertical stresses σyy (see Figure 20) is very different from the first model, which is not surprising because the first model was only made of a single part. However, the compression and tension area are still on the same sides for both the monopile and the transition piece.
The area where loads are applied (on the left) is a tension area whereas the opposite face is a compression area, but as shown in Figure 21, the distribution of the stresses is the same in normal conditions and extreme conditions, which is not the case for the monopile.
The influence of the number of bolts on the different parameters was also investigated (see Figure 22).
As expected, the lateral displacement slightly decreases when the number of bolts increases, but the difference between 24 bolts and 100 bolts is not significant. The parameter largely impacted by the number of bolts is the von Mises stress. Indeed, in both normal and extreme conditions, the maximum stress is 2.7 times greater with 24 bolts than with 100 bolts. Furthermore, when the number of bolts is under 85–90, the maximum Von Mises stress is greater than the yield stress of the steel, and consequently plastic deformations will occur. Therefore, the number of bolts is very important and there should be a sufficient number of bolts for the structure to resist external loads.

4. Conclusions

In this study, three different models were developed to analyse the influential parameters of the wind turbine foundation. The first was a simple model, and omitted many complex structural parts. Despite the simplicity of the model, it gives an idea of the order of magnitude of the results, especially concerning the displacement at the top of the tower and the natural frequency. Concerning the von Mises stresses, the results were not as accurate as the displacement (compared with the complex model). In the second design, the soil was added to this simplified model to ascertain its influence. Different parametric studies were carried out to investigate the influence of the soil. It was shown that the mechanical parameters of soil (such as cohesion for the elasto-plastic model) do not have a great effect on the results. However, the Young’s modulus of the soil has a large influence, which is due to the fact that this parameter directly influences the stiffness of the soil and consequently the displacement of the structure will be affected. The embedded length also has a non-negligible influence on the displacement. The soil was also modelled using an elasto-plastic criteria (Mohr–Coulomb) model, which produced similar results to the elastic model. Finally, a more complex model was designed by properly modelling the grout, the transition piece and also the connection between the wind turbine and the transition piece. This model is closer to reality than the first one. Displacement at the top of the tower in this model is lower than in the first model, but the main difference is in the von Mises stresses, which are greater in the complex model, mainly due to stress concentration at the bolts and connection joints. In extreme conditions, the maximum stresses are very close to the yield stress of the steel. Future studies can consider other types of wind turbines and the effects of other soil properties in this kind of wind turbine.

Author Contributions

Conceptualization, A.J., M.A., A.A.J., A.K.; methodology, M.A., A.J., A.A.J., A.K.; software, M.A., A.K.; validation, M.A., A.J.; formal analysis, A.J., A.K.; investigation, A.J., M.A., A.A.J.; resources, M.A., A.J.; data curation, M.A., A.J.; writing—original draft preparation, A.J., M.A., M.D., I.S.-M., A.K.; writing—review and editing, A.J., M.A., M.D., I.S.-M., A.A.J., A.K.; visualization, A.J., M.A.; supervision, M.A., A.A.J.; project administration, M.A., A.A.J. All authors have read and agreed to the published version of the manuscript.

Funding

This research received no external funding.

Data Availability Statement

Data sharing not applicable.

Conflicts of Interest

The authors declare no conflict of interest.

References

  1. Lins, C.; Williamson, L.E.; Leitner, S.; Teske, S. The first decade: 2004—2014: 10 years of renewable energy progress. In Renewable Energy Policy Network for the 21st Century; 2014; Available online: https://www.ren21.net/Portals/0/documents/activities/Topical%20Reports/REN21_10yr.pdf (accessed on 12 June 2021).
  2. Midilli, A.; Dincer, I.; Ay, M. Green energy strategies for sustainable development. Energy Policy 2006, 34, 3623–3633. [Google Scholar] [CrossRef]
  3. Ribrant, J.; Bertling, L.M. Survey of Failures in Wind Power Systems with Focus on Swedish Wind Power Plants during 1997–2005. IEEE Trans. Energy Convers. 2007, 22, 167–173. [Google Scholar] [CrossRef]
  4. Adedipe, O.; Brennan, F.; Kolios, A. Review of corrosion fatigue in offshore structures: Present status and challenges in the offshore wind sector. Renew. Sustain. Energy Rev. 2016, 61, 141–154. [Google Scholar] [CrossRef]
  5. Arshad, M.; O’Kelly, B.C. Offshore wind-turbine structures: A review. Proc. Inst. Civ. Eng. Energy 2013, 166, 139–152. [Google Scholar] [CrossRef]
  6. Alderlieste, E.A. Experimental Modelling of Lateral Loads on Large Diameter Mono-Pile Foundations in Sand. Master’s Thesis, TU Delft, Mekelweg, The Netherlands, 2011. [Google Scholar]
  7. Wang, X.; Zeng, X.; Li, J.; Yang, X.; Wang, H. A review on recent advancements of substructures for offshore wind turbines. Energy Convers. Manag. 2018, 158, 103–119. [Google Scholar] [CrossRef]
  8. Byrne, B.W.; Houlsby, G.T. Foundations for offshore wind turbines. Philos. Trans. R. Soc. A Math. Phys. Eng. Sci. 2003, 361, 2909–2930. [Google Scholar] [CrossRef] [PubMed]
  9. Lombardi, D.; Bhattacharya, S.; Wood, D.M. Dynamic soil–structure interaction of monopile supported wind turbines in cohesive soil. Soil Dyn. Earthq. Eng. 2013, 49, 165–180. [Google Scholar] [CrossRef]
  10. Bhattacharya, S. Challenges in design of foundations for offshore wind turbines. Eng. Technol. Ref. 2014, 1, 922. [Google Scholar] [CrossRef]
  11. Roddier, D.; Cermelli, C.; Aubault, A.; Weinstein, A. WindFloat: A floating foundation for offshore wind turbines. J. Renew. Sustain. Energy 2010, 2, 033104. [Google Scholar] [CrossRef]
  12. Adhikari, S.; Bhattacharya, S. Dynamic Analysis of Wind Turbine Towers on Flexible Foundations. Shock. Vib. 2012, 19, 37–56. [Google Scholar] [CrossRef]
  13. Bhattacharya, S.; Nikitas, N.; Garnsey, J.; Alexander, N.; Cox, J.; Lombardi, D.; Wood, D.M.; Nash, D. Observed dynamic soil–structure interaction in scale testing of offshore wind turbine foundations. Soil Dyn. Earthq. Eng. 2013, 54, 47–60. [Google Scholar] [CrossRef]
  14. Andersen, L.; Vahdatirad, M.; Sichani, M.; Sørensen, J. Natural frequencies of wind turbines on monopile foundations in clayey soils—A probabilistic approach. Comput. Geotech. 2012, 43, 1–11. [Google Scholar] [CrossRef]
  15. Breton, S.-P.; Moe, G. Status, plans and technologies for offshore wind turbines in Europe and North America. Renew. Energy 2009, 34, 646–654. [Google Scholar] [CrossRef]
  16. Aasen, S.; Page, A.; Skau, K.S.; Nygaard, T.A. Effect of foundation modelling on the fatigue lifetime of a monopile-based offshore wind turbine. Wind. Energy Sci. 2017, 2, 361–376. [Google Scholar] [CrossRef] [Green Version]
  17. Zhao, Y.; Yang, J.; He, Y. Preliminary Design of a Multi-Column TLP Foundation for a 5-MW Offshore Wind Turbine. Energies 2012, 5, 3874–3891. [Google Scholar] [CrossRef]
  18. Dvorak, M.J.; Archer, C.L.; Jacobson, M.Z. California offshore wind energy potential. Renew. Energy 2010, 35, 1244–1254. [Google Scholar] [CrossRef]
  19. Bush, E.; Manuel, L. Foundation models for offshore wind turbines. In Proceedings of the 47th AIAA Aerospace Sciences Meeting including The New Horizons Forum and Aerospace Exposition, Orlando, FL, USA, 5–8 January 2009; American Institute of Aeronautics and Astronautics: Reston, VA, USA, 2009. [Google Scholar]
  20. Hokmabadi, A.S.; Fatahi, B.; Samali, B. Assessment of soil–pile–structure interaction influencing seismic response of mid-rise buildings sitting on floating pile foundations. Comput. Geotech. 2014, 55, 172–186. [Google Scholar] [CrossRef]
  21. Roddier, D.; Cermelli, C.; Weinstein, A. WindFloat: A Floating Foundation for Offshore Wind Turbines—Part I: Design Basis and Qualification Process. In Proceedings of the International Conference on Offshore Mechanics and Arctic Engineering, Honolulu, HI, USA, 31 May–5 June 2009; pp. 845–853. [Google Scholar]
  22. Ibsen, L.B.; Brincker, R. Design of a new foundation for offshore wind turbines. In Proceedings of the IMAC-22: A Conference on Structural Dynamics, Hyatt Regency Dearborn; Society for Experimental Mechanics, Dearborn, MN, USA, 26–29 January 2004. [Google Scholar]
  23. Yamaguchi, A.; Ishihara, T. Assessment of offshore wind energy potential using mesoscale model and geographic information system. Renew. Energy 2014, 69, 506–515. [Google Scholar] [CrossRef]
  24. Wu, X.; Hu, Y.; Li, Y.; Yang, J.; Duan, L.; Wang, T.; Adcock, T.; Jiang, Z.; Gao, Z.; Lin, Z.; et al. Foundations of offshore wind turbines: A review. Renew. Sustain. Energy Rev. 2019, 104, 379–393. [Google Scholar] [CrossRef] [Green Version]
  25. Aubault, A.; Cermelli, C.; Roddier, D. WindFloat: A Floating Foundation for Offshore Wind Turbines—Part III: Structural Analysis. In Proceedings of the International Conference on Offshore Mechanics and Arctic Engineering, Honolulu, HI, USA, 31 May–5 June 2009; pp. 213–220. [Google Scholar]
  26. Cermelli, C.; Roddier, D.; Aubault, A. WindFloat: A Floating Foundation for Offshore Wind Turbines—Part II: Hydrodynamics Analysis. In Proceedings of the International Conference on Offshore Mechanics and Arctic Engineering, Honolulu, HI, USA, 31 May–5 June 2009; pp. 135–143. [Google Scholar]
  27. Gueydon, S.; Weller, S. Study of a Floating Foundation for Wind Turbines. J. Offshore Mech. Arct. Eng. 2013, 135, 031903. [Google Scholar] [CrossRef]
  28. Liu, Y.; Li, S.; Yi, Q.; Chen, D. Developments in semi-submersible floating foundations supporting wind turbines: A comprehensive review. Renew. Sustain. Energy Rev. 2016, 60, 433–449. [Google Scholar] [CrossRef]
  29. Zhou, S.; Shan, B.; Xiao, Y.; Li, C.; Hu, G.; Song, X.; Liu, Y.; Hu, Y. Directionality Effects of Aligned Wind and Wave Loads on a Y-Shape Semi-Submersible Floating Wind Turbine under Rated Operational Conditions. Energies 2017, 10, 2097. [Google Scholar] [CrossRef] [Green Version]
  30. Oh, K.-Y.; Nam, W.; Ryu, M.S.; Kim, J.-Y.; Epureanu, B.I. A review of foundations of offshore wind energy convertors: Current status and future perspectives. Renew. Sustain. Energy Rev. 2018, 88, 16–36. [Google Scholar] [CrossRef]
  31. Bredmose, H.; Skourup, J.; Hansen, E.A.; Christensen, E.D.; Pedersen, L.M.; Mitzlaff, A. Numerical reproduction of extreme wave loads on a gravity wind turbine foundation. In Proceedings of the International Conference on Offshore Mechanics and Arctic Engineering, Hamburg, Germany, 4–9 June 2006; pp. 279–287. [Google Scholar] [CrossRef]
  32. Lotsberg, I. Structural mechanics for design of grouted connections in monopile wind turbine structures. Mar. Struct. 2013, 32, 113–135. [Google Scholar] [CrossRef]
  33. Damgaard, M.; Bayat, M.; Andersen, L.; Ibsen, L. Assessment of the dynamic behaviour of saturated soil subjected to cyclic loading from offshore monopile wind turbine foundations. Comput. Geotech. 2014, 61, 116–126. [Google Scholar] [CrossRef]
  34. Carswell, W.; Johansson, J.; Løvholt, F.; Arwade, S.; Madshus, C.; DeGroot, D.; Myers, A. Foundation damping and the dynamics of offshore wind turbine monopiles. Renew. Energy 2015, 80, 724–736. [Google Scholar] [CrossRef]
  35. Lozano-Minguez, E.; Kolios, A.; Brennan, F. Multi-criteria assessment of offshore wind turbine support structures. Renew. Energy 2011, 36, 2831–2837. [Google Scholar] [CrossRef] [Green Version]
  36. Yeter, B.; Garbatov, Y.; Soares, C.G. Fatigue damage assessment of fixed offshore wind turbine tripod support structures. Eng. Struct. 2015, 101, 518–528. [Google Scholar] [CrossRef]
  37. Yang, H.; Zhu, Y.; Lu, Q.; Zhang, J. Dynamic reliability based design optimization of the tripod sub-structure of offshore wind turbines. Renew. Energy 2015, 78, 16–25. [Google Scholar] [CrossRef]
  38. O’Kelly, B.; Arshad, M. Offshore wind turbine foundations–analysis and design. In Offshore Wind Farms; Elsevier: Amsterdam, The Netherland, 2016; pp. 589–610. [Google Scholar]
  39. Shi, W.; Park, H.; Han, J.; Na, S.; Kim, C. A study on the effect of different modeling parameters on the dynamic response of a jacket-type offshore wind turbine in the Korean Southwest Sea. Renew. Energy 2013, 58, 50–59. [Google Scholar] [CrossRef]
  40. Dong, W.; Moan, T.; Gao, Z. Long-term fatigue analysis of multi-planar tubular joints for jacket-type offshore wind turbine in time domain. Eng. Struct. 2011, 33, 2002–2014. [Google Scholar] [CrossRef]
  41. Wang, X.; Yang, X.; Zeng, X. Lateral response of improved suction bucket foundation for offshore wind turbine in centrifuge modelling. Ocean Eng. 2017, 141, 295–307. [Google Scholar] [CrossRef]
  42. Arany, L.; Bhattacharya, S. Simplified load estimation and sizing of suction anchors for spar buoy type floating offshore wind turbines. Ocean Eng. 2018, 159, 348–357. [Google Scholar] [CrossRef] [Green Version]
  43. Malhotra, S. Design and construction considerations for offshore wind turbine foundations. In Proceedings of the International Conference on Offshore Mechanics and Arctic Engineering, San Diego, CA, USA, 10–15 June 2007. [Google Scholar]
  44. Leung, D.Y.; Yang, Y. Wind energy development and its environmental impact: A review. Renew. Sustain. Energy Rev. 2012, 16, 1031–1039. [Google Scholar] [CrossRef]
  45. Westgate, Z.J.; DeJong, J.T. Geotechnical Considerations for Offshore Wind Turbines; Report for MTC OTC Project; Penn State University: State College, PA, USA, 2005. [Google Scholar]
  46. Zhixin, W.; Chuanwen, J.; Qian, A.; Chengmin, W. The key technology of offshore wind farm and its new development in China. Renew. Sustain. Energy Rev. 2009, 13, 216–222. [Google Scholar] [CrossRef]
  47. O’Kelly, B.C. and M. Arshad, 20-Offshore wind turbine foundations–analysis and design. In Offshore Wind Farms; Ng, C., Ran, L., Eds.; Woodhead Publishing: Sawston, UK, 2016; pp. 589–610. [Google Scholar]
  48. Lee, Y.-S.; Choi, B.-L.; Lee, J.H.; Kim, S.Y.; Han, S. Reliability-based design optimization of monopile transition piece for offshore wind turbine system. Renew. Energy 2014, 71, 729–741. [Google Scholar] [CrossRef]
  49. Seo, J.; Schaffer, W.; Head, M.; Shokouhian, M. Retrofitting of monopile transition piece for offshore wind turbines. In Proceedings of the 27th International Ocean and Polar Engineering Conference, San Francisco, CA, USA, 25–27 June 2017; International Society of Offshore and Polar Engineers: Mountain View, CA, USA, 2017. [Google Scholar]
  50. Achmus, M.; Kuo, Y.-S.; Abdel-Rahman, K. Behavior of monopile foundations under cyclic lateral load. Comput. Geotech. 2009, 36, 725–735. [Google Scholar] [CrossRef]
  51. Moller, A. Efficient Offshore Wind Turbine Foundations. Wind. Eng. 2005, 29, 463–469. [Google Scholar] [CrossRef]
  52. Igwemezie, V.; Mehmanparast, A.; Kolios, A. Current trend in offshore wind energy sector and material requirements for fatigue resistance improvement in large wind turbine support structures–A review. Renew. Sustain. Energy Rev. 2019, 101, 181–196. [Google Scholar] [CrossRef] [Green Version]
  53. Gill, J.P.; Sales, D.; Pinder, S.; Salazar, R. Kentish Flats Wind Farm, Fifth Ornithological Monitoring Report; Environmentally Sustainable Systems report to Kentish Flats Ltd.: Edinburg, UK, 2008. [Google Scholar]
  54. Athanasia, A.; Genachte, A.B. Deep Offshore and New Foundation Concepts. Energy Procedia 2013, 35, 198–209. [Google Scholar] [CrossRef] [Green Version]
  55. Shi, W.; Park, H.; Chung, C.; Baek, J.; Kim, J.; Kim, C. Load analysis and comparison of different jacket foundations. Renew. Energy 2013, 54, 201–210. [Google Scholar] [CrossRef]
  56. Harte, M.; Basu, B.; Nielsen, S. Dynamic analysis of wind turbines including soil-structure interaction. Eng. Struct. 2012, 45, 509–518. [Google Scholar] [CrossRef]
  57. Arany, L.; Bhattacharya, S.; Macdonald, J.; Hogan, S.J. Simplified critical mudline bending moment spectra of offshore wind turbine support structures. Wind. Energy 2014, 18, 2171–2197. [Google Scholar] [CrossRef] [Green Version]
  58. Lian, J.; Jiang, Q.; Dong, X.; Zhao, Y.; Zhao, H.; Zhao, L. Dong Dynamic Impedance of the Wide-Shallow Bucket Foundation for Offshore Wind Turbine using Coupled Finite–Infinite Element Method. Energies 2019, 12, 4370. [Google Scholar] [CrossRef] [Green Version]
  59. Bouzid, D.A.; Bhattacharya, S.; Otsmane, L. Assessment of natural frequency of installed offshore wind turbines using nonlinear finite element model considering soil-monopile interaction. J. Rock Mech. Geotech. Eng. 2018, 10, 333–346. [Google Scholar] [CrossRef]
  60. Zoumakis, N. The dependence of the power-law exponent on surface roughness and stability in a neutrally and stably stratified surface boundary layer. Atmosfera 2009, 6. [Google Scholar]
  61. Davenport, A.G. The application of statistical concepts to the wind loading of structures. Proc. Inst. Civ. Eng. 1961, 19, 449–472. [Google Scholar] [CrossRef]
  62. Garcés García, C. Design and Calculus of the Foundation Structure of an Offshore Monopile Wind Turbine; 2012; Available online: https://upcommons.upc.edu/bitstream/handle/2099.1/19209/Design%20and%20Calculus.pdf?sequence=1&isAllowed=y (accessed on 10 June 2021).
  63. Bilgili, M.; Yaşar, A.; Ilhan, A.; Șahin, B. Aerodynamic characteristics of a horizontal axis wind turbine in Belen-Hatay, Turkey. Int. J. Nat. Eng. Sci. 2015, 9, 54–58. [Google Scholar]
  64. ABS. Design Standards for Offshore Wind Farms. M10PC00105. 2011. Available online: https://www.bsee.gov/sites/bsee.gov/files/tap-technical-assessment-program/670aa.pdf (accessed on 12 June 2021).
  65. Murtagh, P.J.; Basu, B.; Broderick, B.M. Along-wind response of a wind turbine tower with blade coupling subjected to rota-tionally sampled wind loading. Eng. Struct. 2005, 27, 1209–1219. [Google Scholar] [CrossRef]
  66. AS, DET NORSKE VERITAS. Modelling and analysis of marine operations. Recommended Practice: DNV-RP-H103. 2011. Available online: https://home.hvl.no/ansatte/tct/FTP/H2020%20Marinteknisk%20Analyse/Regelverk%20og%20standarder/DnV_documents/RP-H103.pdf (accessed on 12 June 2021).
  67. Pavlou, D.G. Soil–Structure–Wave Interaction of Gravity-Based Offshore Wind Turbines: An Analytical Model. J. Offshore Mech. Arct. Eng. 2021, 143. [Google Scholar] [CrossRef]
  68. Pavlou, D.G.; Li, Y. Seabed Dynamic Response of Offshore Wind Turbine Foundation under Vertical Harmonic Loading: An Analytic Solution. Math. Probl. Eng. 2018, 2018, 1–9. [Google Scholar] [CrossRef] [Green Version]
  69. Kunisu, H. Evaluation of wave force acting on Submerged Floating Tunnels. Procedia Eng. 2010, 4, 99–105. [Google Scholar] [CrossRef] [Green Version]
  70. Techet, A. Morrison’s Equation; Class Notes: Spring; 2004; Available online: https://www.cottey.edu/pdf/viewpoint/vp_archive/sp04_vp/sp04_classnotes.html (accessed on 10 June 2021).
  71. Yue, D.K.P. 2.20 Marine Hydrodynamics (13.021). 2005. Available online: https://ocw.mit.edu/courses/mechanical-engineering/2-20-marine-hydrodynamics-13-021-spring-2005/ (accessed on 10 February 2021).
  72. Ivanhoe, R.O.; Wang, L.; Kolios, A. Generic framework for reliability assessment of offshore wind turbine jacket support structures under stochastic and time dependent variables. Ocean Eng. 2020, 216, 107691. [Google Scholar] [CrossRef]
  73. Bai, Y.; Bai, Q. Subsea Pipelines and Risers; Elsevier BV: Amsterdam, The Netherlands, 2005. [Google Scholar]
  74. Haiderali, A.; Madabhushi, G. Three-Dimensional Finite Element Modelling of Monopiles for Offshore Wind Turbines. In Proceedings of the 2012 World Congress on Advances in Civil, Environmental, and Materials Research (ACEM’ 12), Seoul, Korea, 26–30 August 2012. [Google Scholar]
  75. Jonkman, J.; Butterfield, S.; Musial, W.; Scott, G. Definition of a 5-MW Reference Wind Turbine for Offshore System Development; National Renewable Energy Lab.: Golden, CO, USA, 2009. [Google Scholar]
  76. Lago, L.I.; Ponta, F.L.; Otero, A.D. Analysis of alternative adaptive geometrical configurations for the NREL-5 MW wind turbine blade. Renew. Energy 2013, 59, 13–22. [Google Scholar] [CrossRef]
  77. Duan, N. Mechanical Characteristics of Monopile Foundation in Sand for Offshore Wind Turbine; UCL (University College London): London, UK, 2016. [Google Scholar]
  78. Skempton, A.W. Selected Papers on Soil Mechanics. Sel. Pap. Soil Mech. 1984, 1032, 4–16. [Google Scholar] [CrossRef]
  79. Bhattacharya, S. Design of Foundations for Offshore Wind Turbines; John Wiley & Sons Ltd.: Hoboken, NJ, USA, 2019. [Google Scholar]
  80. Arany, L.; Bhattacharya, S.; Adhikari, S.; Hogan, S.; Macdonald, J. An analytical model to predict the natural frequency of offshore wind turbines on three-spring flexible foundations using two different beam models. Soil Dyn. Earthq. Eng. 2015, 74, 40–45. [Google Scholar] [CrossRef] [Green Version]
  81. Mehmanparast, A.; Lotfian, S.; Vipin, S.P. A Review of Challenges and Opportunities Associated with Bolted Flange Con-nections in the Offshore Wind Industry. Metals 2020, 10, 732. [Google Scholar] [CrossRef]
Figure 1. Simplified finite element model: (a) model, (b) finite element analysis.
Computation 09 00071 g001
Figure 2. Boundary conditions.
Computation 09 00071 g002
Figure 3. Soil 3D model.
Computation 09 00071 g003
Figure 4. Global mesh of soil: (a) Soil’s mesh, (b) Mesh size.
Computation 09 00071 g004
Figure 5. Flange bolted connection: (a) Bolted connection, (b) Geometric features.
Computation 09 00071 g005
Figure 6. Three-dimensional complex model.
Computation 09 00071 g006
Figure 7. Lateral displacement: (a) Normal conditions, (b) Extreme sea state.
Computation 09 00071 g007
Figure 8. Von Mises stress: (a) Normal conditions, (b) Extreme sea state.
Computation 09 00071 g008
Figure 9. Vertical stresses—Extreme conditions, (a) Results of stress analysis, (b) Stress map.
Computation 09 00071 g009
Figure 10. Lateral displacement: (a) Normal conditions, (b) Extreme sea state.
Computation 09 00071 g010
Figure 11. Stresses in situ: (a) Effective stresses (σ’), (b) Pore pressure.
Computation 09 00071 g011
Figure 12. Lateral displacement: (a) Normal conditions, (b) Extreme sea state.
Computation 09 00071 g012
Figure 13. Lateral displacement: (a) Normal conditions, (b) Extreme sea state.
Computation 09 00071 g013
Figure 14. Soil–structure interaction: (a) Lateral displacements, (b) Von Mises stresses.
Computation 09 00071 g014
Figure 15. Influence of embedded length: (a) Lateral displacement, (b) Natural frequency.
Computation 09 00071 g015
Figure 16. Influence of Young’s modulus E: (a) Lateral displacement, (b) Natural frequency.
Computation 09 00071 g016
Figure 17. Influence of cohesion C of soil: (a) Lateral displacements, (b) Von Mises stresses.
Computation 09 00071 g017
Figure 18. Lateral displacement: (a) Extreme sea state, (b) Normal conditions.
Computation 09 00071 g018
Figure 19. Von Mises stresses: (a) Normal conditions, (b) Extreme sea conditions.
Computation 09 00071 g019
Figure 20. Vertical stresses on monopile: (a) Extreme sea state, (b) Normal conditions.
Computation 09 00071 g020
Figure 21. Von Mises stresses: (a) Extreme sea state, (b) Normal conditions.
Computation 09 00071 g021
Figure 22. Influence of number of bolts: (a) Lateral displacement, (b) Von Mises stresses.
Computation 09 00071 g022
Table 1. Different types of analyses.
Design 1 (Without the Soil)Design 2 (With the Soil)
Loads:
Weight of Blades and Nacelle
Rotor Force
Weight of Structure
Lateral Loads (Waves and Wind)
Four Steps:Three Different Types of Soil:
Soil Step (Behaviour of the Soil)
Gravity Loads (Soil and Structure)
Loads in Normal Conditions (NC)
Loads in Extreme Conditions (EC)
(1) Homogeneous Stiff Clay
(2) Homogeneous Soft Clay
(3) Layered Soil (Composed of Sand and Clay)
Design 3 (With the Soil + Transition Piece + Grout + Connection between Tower and Transition Piece)
Grout (Cylindrical Pipe with Constant Radius)
Transition Piece (Cylindrical Pipe with Variable Cross-Section)
Grout Connection (Made of Concrete)
Table 2. Wave parameters and wind speed in normal conditions and extreme sea state.
Normal ConditionsExtreme Sea State
Wave parametersSignificant height H 1 m8.4 m
Wave length λ 48.09 m173 m
Wave period T 5.579 s13.359 s
Wave pulsation ω 1.126064 rad/s0.47032 rad/s
Wind speedHeight = 13.80 m6.38 m/s23.97 m/s
Height = 90 m8.02 m/s27.23 m/s
Table 3. NREL-5MW features.
Geometric Features
Hub height90 m
Rotor diameter126 m
Diameter/thickness at the bottom6 m/0.027 m
Diameter/thickness at the top3.85 m/0.019 m
Drivetrain properties
Rated rotor speed12.1 rpm
Nominal speed/cut-off speed11.2 m/s/25 m/s
Rated generator speed1173.7 rpm
Electrical generator efficiency94.4%
Mass properties
Rotor weight110,000 kg
Nacelle weight240,000 kg
Tower weight347,460 kg
Total weight697,460 kg
Frequency
1P Frequency range0.115 Hz–0.20 Hz
3P Frequency range0.35 Hz–0.61 Hz
Theoretical natural frequency0.3240 Hz
Table 4. The properties for the soil layers.
Depth (m)E (MPa)υ (Unitless) ρ   ( kg . m 3 ) e (Unitless) Φ (°)Ψ (°)
0–5 m: Dense sand600.35918.40.81333
5–10 m: Soft clay200.4511200.6600
10–15 m: Stiff clay750.4512000.5400
15–20 m: Stiff clay850.4512500.4300
20–25 m: Dense sand750.35968.40.72388
25–30 m: Soft clay250.4511900.5900
30–40 m: Stiff clay950.4510700.4300
Where E, υ, e, Φ and Ψ are the modulus of elasticity, Poisson’s ratio, density, void ratio, internal friction angle and dilation angle, respectively.
Table 5. The geometrical properties.
PartOuter DiameterThicknessLength
Monopile7 m0.13 m19 m
Grout7.36 m 0.18 m12.5 m
Transition piece to sea level7.7 m0.17 m13.5 m
Transition piece at flange connection7 m0.17 m9.75 m
Table 6. Mechanical properties of Ducorit D4.
PropertiesGrout
Density ρ 2470 kg . m 3
Young’s modulus E70 GPa
Poisson’s ratio υ0.19
Coefficient of friction with the steel0.5
Table 7. The results of three different designs (NC: Normal Condition, EC: Extreme Condition).
Design 1Design 2Design 3
Soil 1Soil 2Soil 3
NCECNCECNCECNCECNCEC
Maximum Lateral Displacement (m)0.29141.0970.32031.2080.35291.3350.32841.240.26801.012
Maximum Von Mises Stress (MPa)58.61189.3******102.7490.2
Natural Frequency (Hz)0.310510.310510.283300.293710.31051
* In design 2, the maximum von Mises stress in both models with soil and without soil was negligible and, therefore, the soil did not have any influence on the variation of this parameter.
Publisher’s Note: MDPI stays neutral with regard to jurisdictional claims in published maps and institutional affiliations.

