Abstract
Alzheimer’s disease (AD) is a progressive neurodegenerative brain disorder. One of the important therapeutic approaches of AD is the inhibition of β-site APP cleaving enzyme-1 (BACE1). This enzyme plays a central role in the synthesis of the pathogenic β-amyloid peptides (Aβ) in Alzheimer’s disease. A group of potent BACE1 inhibitors with known X-ray structures (PDB ID 5i3X, 5i3Y, 5iE1, 5i3V, 5i3W, 4LC7, 3TPP) were studied by molecular dynamics simulation and binding energy calculation employing MM_GB(PB)SA. The calculated binding energies gave Kd values of 0.139 µM, 1.39 nM, 4.39 mM, 24.3 nM, 1.39 mM, 29.13 mM, and 193.07 nM, respectively. These inhibitors showed potent inhibitory activities in enzymatic and cell assays. The Kd values are compared with experimental values and the structures are discussed in view of the energy contributions to binding. Drug likeness of these inhibitors is also discussed. Accommodation of ligands in the catalytic site of BACE1 is discussed depending on the type of fragment involved in each structure. Molecular dynamics (MD) simulations and energy studies were used to explore the recognition of the selected BACE1 inhibitors by Asp32, Asp228, and the hydrophobic flap. The results show that selective BACE1 inhibition may be due to the formation of strong electrostatic interactions with Asp32 and Asp228 and a large number of hydrogen bonds, in addition to π–π and van der Waals interactions with the amino acid residues located inside the catalytic cavity. Interactions with the ligands show a similar binding mode with BACE1. These results help to rationalize the design of selective BACE1 inhibitors.
Keywords:
Alzheimer’s disease; BACE1; molecular dynamics; MM/GBSA; inhibitors; drug likeness; ligand efficiency; Kd 1. Introduction
Alzheimer’s disease (AD) is a progressive, neurodegenerative disease of the brain. AD and the associated dementia are connected to amyloid plaque accumulated in the brain. The β-Site Amyloid Precursor Protein cleaving enzyme 1 (BACE1) is an aspartic protease enzyme fixed to the cell membrane; it acts to produce β-amyloid (Aβ) in the signaling pathways in Alzheimer’s disease (AD). Excessive accumulation Aβ is believed to induce pathological changes and causes dementia in brains of AD patients.
The enzyme BACE1 initiates the cleavage of amyloid precursor protein (APP) at the β-secretase site, then Aβ is released as a result of further cleavage of the BACE1-cleaved C-terminal APP fragment [1]. Blocking BACE1 proteolytic activity will suppress Aβ generation and reduce the formation of amyloid. Research has been directed towards potent BACE1 inhibitors for AD therapy. Recent breakthroughs in developing BACE1 inhibitors which can penetrate brain cells make the targeting of amyloid deposition-mediated pathology as a therapy more obtainable. Various strategies that have successfully led to the discovery of BACE1 inhibitor drugs have reached the stage of clinical trials.
BACE1 consists of three domains: an N-terminal, a single transmembrane domain, and a cytosolic C-terminus. The catalytic ecto-domain has an aspartic protease fold, with the substrate-binding cleft located between the N- and C-terminal lobes (Figure 1).
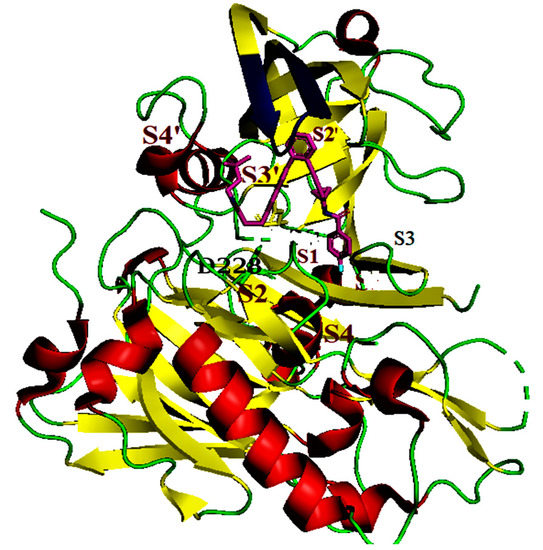
Figure 1.
Structures of β-site APP cleaving enzyme-1 (BACE1) in complex with inhibitor 1 (PDB ID 5i3X. The inhibitor 68J (Pink), catalytic dyad D228 and D32, flap (Blue); ß sheets (yellow); coils (green), Inhibitor (pink).
The crucial catalytic aspartate (Asp) dyad, Asp32 and Asp228, is located at the interface of the two lobes [2]. A hairpin loop “flap” in the N terminal lobe partially covers the cleft in a perpendicular orientation and contains Valine 69 Tyrosine 71 and Threonine 72 (colored blue in Figure 1). The conformational changes in the flap control the substrate access to the active site. The first BACE1 substrate analogues inhibitors to mimic the APP-cleavage sequence which contains a non-cleavable peptide bond. This showed high potency but resulted in poor oral bioavailability and low brain penetration, which prevents therapeutic utility [3,4]. Amidine-containing compounds that form optimal interactions with Asp32 and Asp228 enhance the search for BACE1 inhibitors [1]. These Asp-binding amidine and guanidine inhibitors have been studied and the cyclohexyl groups were found to bind the S1 and the lipophilic S1′ pockets (Figure 1).
Other compounds feature a quaternary carbon that acts as a vector in the S1−S3 and S2’ pockets of the catalytic site (Figure 1) [5]. In other inhibitors, the basicity of the amidine/guanidine function provides a formal positive charge that impacts the optimization of physicochemical parameters. In contrast, there are a few known ligands that bind to the catalytic cleft without interacting with the Asp32 and Asp228 residues. Merck reported an inhibitor (Pyrimidine) which binds to the S1 and S3 pockets [6] and Elan Pharmaceuticals reported an S2 pocket binding inhibitor [7].
Researchers have employed several methods to predict drug potency by calculating the binding free energies of potential drugs as ligands to protein targets [8]. Thermodynamic integration (TI) and free energy perturbation (FEP) have been successfully applied to calculate free energy values close to experimentally reported values [9]. These methods proved to be computationally expensive and not practical. In addition, docking programs have been employed to obtain scores for large numbers of candidate drugs but proved to be not very accurate in predicting the free energies of inhibitor binding to potential sites on the proteins [10]. The approximations used in these methods, such as ignoring protein flexibility, inadequate treatment of solvation and simplifying the energy functions used, make them less valuable for studying drug binding. The molecular mechanics- Poison Boltzmann (MM/GBSA) method provides faster estimates of the free energy of binding, compared to the other computational free energy methods, such as free energy perturbation (FEP) or thermodynamic integration (TI) methods [11]. Comparison studies have also shown that MM/GBSA outperforms Molecular Mechanics/Poisson Boltzmann Surface Area (MM/PBSA) in calculating the inhibitor binding energy to protein receptors [12].The MM/GBSA method [12,13] has been widely exploited in free energy calculations and its rescoring generally yields better results than docking for the Directory of Useful Decoys, Enhanced data set [13]. When applied to any protein-ligand system, MM/GBSA requires the calculation of an explicit entropy term [8,13] and, for some systems, displays overly large contributions to the absolute free energy of binding [14].
The design of BACE1 inhibitors was concentrated on peptidic substrate transition-state mimic inhibitors; these ligands showed low nanomolar inhibition potency for BACE1, but have poor pharmacokinetic properties [1]. Recently, second-generation inhibitors were designed based on structure-based drug design. Low molecular weight molecules with excellent cell permeability, such as OM99-2, a substrate-based inhibitor with a highly potent BACE1 inhibition (IC50 = 1.6 nM), have little peptidic character, and show an enhanced pharmacokinetic profile. Fragment-based inhibitors discovered using a computational approach have led to designing potent small-size BACE1 inhibitors [15].
In this work, the binding energies of a group of inhibitors to BACE1 were calculated employing molecular dynamics (MD) simulation and MM/GBSA. The contributing energies were analyzed and the values were correlated to experimentally find Kd values for the inhibitors. The feasibility of MM/GBSA to estimate Kd values for drugs and how to optimize drug structures in view of the results to provide acceptable inhibition are discussed [16].
The principle for choosing the group of inhibitors under study is the common groups they share that are known to bind the BACE1 enzyme in different affinities. By establishing a binding theme one can build the best inhibitor with the desired properties to penetrate the brain cells and have the proper Ki value.
2. Methods
2.1. Molecular Dynamics Simulations
Molecular dynamics simulations were performed on the initial structures based on the X-ray crystal structure of the protein-inhibitor complexes with PDB identifications shown in Table 1. MD simulations were carried out using the Amber18.0 package [17] on a GPU accelerated version [18], employing the AMBER force field ff14SB for proteins and nucleic acids, which describes the potential energy of the system [19]. All atom explicit water molecular dynamics simulations were performed on all systems. The PDB file was downloaded in pymol [20], and the complex was prepared using the pdb4amber program, inspected, and salt and water were removed. The receptor, ligand, and complex pdb files were saved separately using a text editor.

Table 1.
The calculated energies of BACE1 Inhibitors.
Preparing ligand, receptor, and complex files for Amber [22]:
The Antechamber [23] package in Amber Tools [24] was used to create topology and coordinate files for the simulations of ligands. Antechamber is designed to be used with the “general AMBER force field (GAFF)” [23], for organic molecules. This force field has been specifically designed to cover most pharmaceutical (organic) molecules and is compatible with the traditional AMBER force fields in such a way that the two can be mixed during a simulation. Hydrogens were added to the ligand (using reduce) then the ligand. frcmod and library files were prepared for amber, and the tleap editor was used to load the complex or combine the ligand and receptor. The complexes were solvated in a TIP3P [25] cubic water box with water molecules extending 15Å from the complex surface to the water box boundary, and Na+ or Cl- ions were added to neutralize the system depending on the charge. The structure of the complex was checked for errors and then converted to topology and coordinate files. The particle mesh Ewald method [26] was used for treating long range electrostatics, and a 9Å cutoff was set for long range interactions. The force field energy of each structure was minimized by progressively relaxing the system before starting the MD simulations. Minimizations were performed employing steepest descent followed by conjugate gradient minimizations (1000 cycles in tandem).
After relaxation of the system it was heated to 300 K by applying harmonic restraint (10 Kcal/Å2 .mol) on solute. This was followed by an unrestrained 2 ns MD simulation at 300 K and 1 atm to equilibrate the system and adjust the density.
The SHAKE algorithm [27] was used to constrain hydrogen atoms to enable a longer time step (2 fs) in the simulation. A Langevin thermostat [28] with 2 ps−1 collision frequency and weak coupling barostat with 2 ps of relaxation time were employed. Production MD simulations were carried out for 150 ns and resulted in a converged trajectory evident in the RMSD behavior which showed good stability within 1.5Å. Trajectories were collected at 2 ps intervals. These trajectories were used to calculate the binding free energy using MMPBSA.py script [29]; 50 or 100 frames were used in the calculations. Loss in flexibility upon binding expressed as entropy change (TΔS) was calculated by normal modes using the same snapshots that were used for calculating ΔG binding. Then, the absolute free energy of binding was calculated (Equation (5)). The binding energy of the complex was calculated using the MM/GBSA method.
2.2. The Generalized Born/Surface Area Model
The MM/PBSA [30] and MM/GBSA methods [31] have been used to estimate ligand-binding affinities in many systems, giving correlation coefficients compared with experiments of R2 in the range of 0.3 to 0.9, depending on the protein, with MM/GBSA giving better results in this case. The results strongly depend on details in the method, especially the continuum-solvation method, the charges, the dielectric constant, the sampling method, and the entropies. The methods often overestimate differences between sets of ligands.
The (MM/PB(GB)SA [30] method uses representative snapshots from an ensemble of conformations to calculate free energy change between the bound and unbound states of receptor and ligand, Equations (1) and (2)). Before using MM-GBSA [32] the system equilibration was verified by considering temperature, density, total energy, and root mean squared deviation of coordinates (RMSD). An RMSD value relative to the crystal structure of 1.5Å was deemed acceptable. Extensive analysis of each trajectory was performed to make sure the energies calculated are reliable depending on the snapshots [33]. To estimate the total solvation free energy of a molecule, ΔGsolv, one typically assumes that it can be decomposed into the “electrostatic” and “non-electrostatic” parts:
where ΔGnonel is the free energy of solvating a molecule from which all charges have been removed (i.e., partial charges of every atom are set to zero), and ΔGel is the free energy after removing all charges in vacuum, and then adding them back in the presence of a continuum solvent environment. Generally speaking, ΔGnonel comes from the combined effect of two types of interaction: the favorable van der Waals attraction between the solute and solvent molecules, and the unfavorable cost of breaking the structure of the solvent (water) around the solute. In the current Amber code, this is taken to be proportional to the total solvent accessible surface area (SA) of the molecule, with a proportionality constant derived from experimental solvation energies of small non-polar molecules, and uses a fast LCPO algorithm to compute an analytical approximation to the solvent accessible area of the molecule. Within Amber GB models, each atom in a molecule is represented as a sphere of radius Ri with a charge qi at its center; the interior of the atom is assumed to be filled uniformly with a material of dielectric constant 1. The molecule is surrounded by a solvent of a high dielectric constant 80 for water at 300 K) (Equation (3)). The GB model approximates ΔGel and the nonpolar energy is usually estimated using the solvent-accessible surface area (SASA) (Equation (7)) [8]:
where ΔEMM is total gas phase energy (sum of ΔE internal + ΔEelectrostatic + ΔEvdw).
ΔGsolv = ΔGel + ΔGnonel
ΔG bind = G RL − G R − G L where R = receptor, L = Ligand
∆G0Bind, Solv = ∆G0Bind, vacuum + ∆G0solv, complex − (∆G0solv, ligand + ∆G0solv, receptor)
∆G0solv = ∆G0electrostatic, ε=80 − ∆G0electrostatic, ε=1 + ∆G0hydrophobic
∆G0vacuum = ∆E0olecular mechanics − ∆S0normal mode analysis
ΔG = ΔH − TΔS = ΔEMM + ΔGSOL − TΔS
ΔEMM = ΔEinternal + ΔEelectrostatic + ΔEvdw
ΔGSOL(PB/GB) = ΔGPB/GB + ΔGSA(PB/GB)
ΔG SOL(PB/GB) is the sum of nonpolar and polar contributions to solvation calculated by PB or GB. TΔS is conformational entropy upon binding computed by normal-mode analysis on a set of conformational snapshots taken from MD simulations. ΔEinternal is internal energy arising from bond, angle, and dihedral terms in the MM force field. ΔEelectrostatic is electrostatic energy as calculated by the molecular mechanics (MM) force field. ΔEvdw is the van der Waals contribution from MM. ΔGPB/GB is the nonpolar contribution to the solvation free energy calculated by an empirical model. The nonpolar solvation free energy is typically given by an empirical formula that is proportional to the solvent accessible surface area of the solute: Δ GSA = ɣ·SASA + b, where γ is the surface tension constant and b is a correction constant (γ = 0.00542 kcal·mol−1·Å−2 and b = 0.92 kcal/mol in the AMBER package). ΔGSA/GB is the electrostatic contribution to the solvation free energy calculated by the PB or GB method.
One-thousand 2 ps spaced snapshots of each complex were generated from the MD trajectories, and all water molecules and counter-ions were removed before MM-PBSA/GBSA calculations. Coordinates were extracted by using the extract-coords.mmpbsa script and the ΔG values were calculated using the “MMPBSA.py” script [29].
3. Results and Discussion
3.1. Data Analysis
The RMSDs, dynamic cross-correlation analysis, and principal component analysis (PCA) were processed using the CPPTRAJ module in Amber 18 package [34]. The principal component analysis (PCA) was performed to help in sampling [35,36].
System stability under MD simulations (see Figure 2a–d).
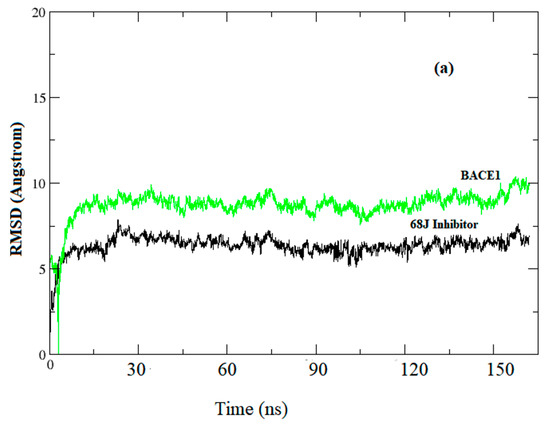
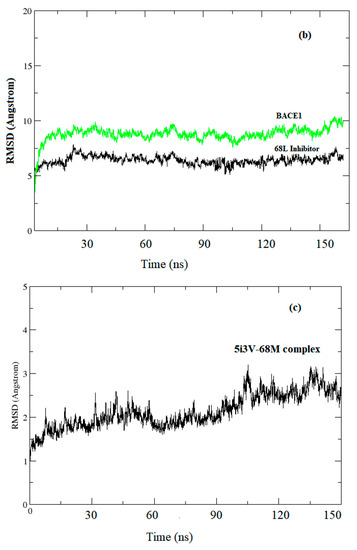
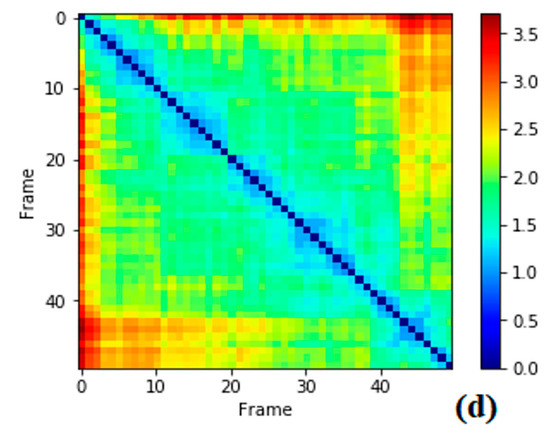
Figure 2.
Root mean square deviation (RMSD) evolutions from molecular dynamics (MD) simulations of (a) BACE1 (green) and Inhibitor 68J (black) in 5i3X; (b) 5i3W BACE1 (green) and 68L inhibitor (black); (c) 5i3V, the BACE1-68M complex (d): pairwise plot of RMSD of BACE1-68J complex in 5i3X, RMSD pairwise computed for first 5000 snapshots and skipped every 10 frames.
Before starting MD analysis, the root mean square deviation (RMSD) evolution of the protein backbone Cα for each complex was monitored throughout the 200 ns MD simulations to ensure stability of the systems. As shown in Figure 2, the RMSD evolution for Cα of BACE1 bound with inhibitors exhibited relatively small fluctuations at the start of simulation, then was stable and changes were within 1.0 Å. Accordingly, the RMSD evolution of the heavy atoms of the inhibitors maintained relative stability (RMSD fluctuation <1 Å) during the 200 ns simulation. Pairwise RMSD for specific snapshots was computed using pytraj in Amber. The RMSD to the experimental structure reference was computed, then, pairwise RMSD for the first 5000 snapshots, skipping every 10 frames, was computed (Figure 2d).
3.2. Prediction of Binding Mode and Key Interactions of Inhibitors to BACE1
MD simulations were performed to elucidate the key interactions of inhibitors responsible for inhibitory activity against β-amyloid (Aβ) accumulation. The MD simulations were performed to evaluate the favored binding modes and key interactions of BACE1 with various inhibitors (Figure 3).
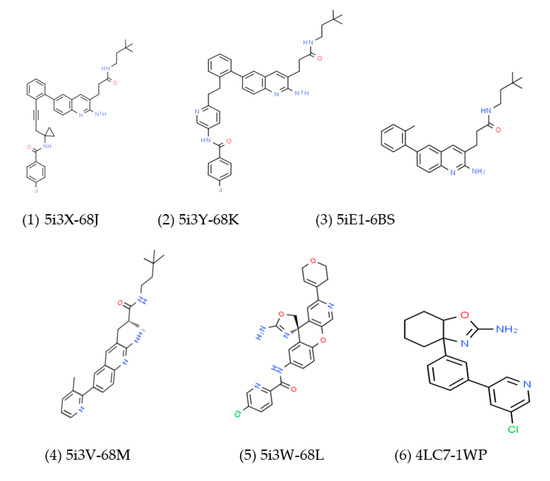
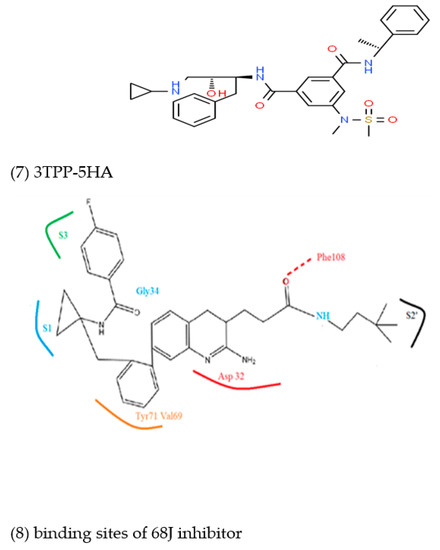
Figure 3.
Structures 1 to 7 are selected BACE1 inhibitors with their PDB ID. Structure (8) shows the binding mode of inhibitors derived from MD simulation using 68J as an example.
The binding energies of inhibitors with BACE1 are shown in Table 1 and Table 2 and in Figure 4 and Figure 5; inhibitors under study bind Asp32 and Asp228 (Table 3, Table 4 and Table 5, and Figure 6), except for 4LC7 which binds Asp93 and Asp289 (See later).

Table 2.
The different components of binding free energy (kcal/mol) between the inhibitors-BACE1 complex evaluated using the MM/GBSA method.
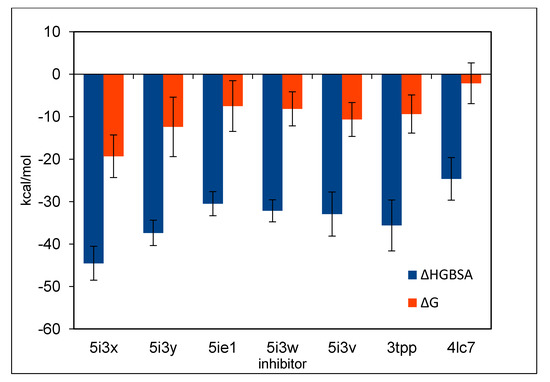
Figure 4.
The binding energies of inhibitors calculated by MM/GBSA.
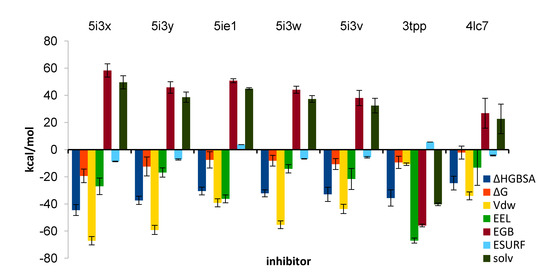
Figure 5.
The breakout of binding energy ΔH to its contributing energies for inhibitors under study.

Table 3.
Bond distances measured in the average structure using pymol.

Table 4.
Correlation coefficients (R2) of ΔH with contributing energies (from Table 2) for groups of inhibitors.

Table 5.
Details of binding of inhibitors to BACE1 extracted from average structures.
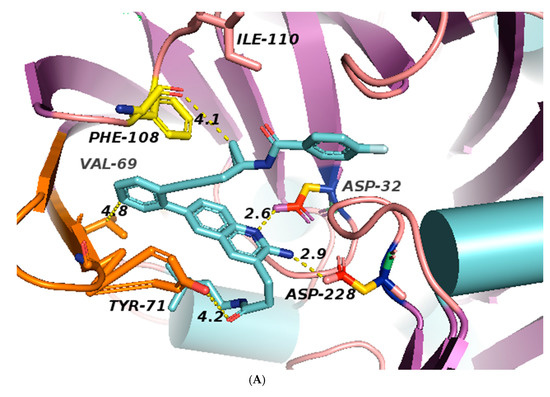
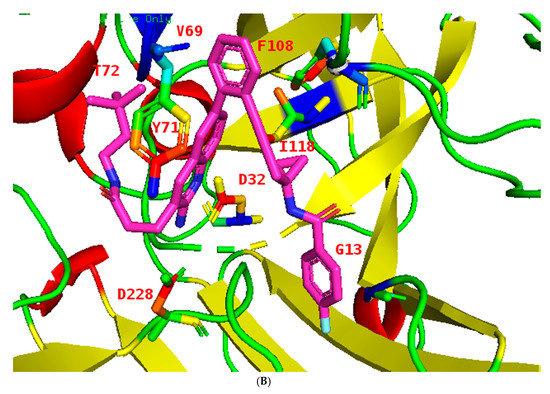
Figure 6.
(A): Structures of BACE1 complexed with 1 (shown in cyan), showing the distances of the residues from inhibitor 1 in 5i3X, the aspartate pocket (Asp32 and Asp228), and the flap shown in orange which contains Val69 and Tyr 71. Distances are listed in Table 3 (for views of inhibitors binding to BACE1 see Figures S1–S8). Colors: helices light blue cylinders; flap orange brown; coils light pink. (B): The binding pocket of BACE1; inhibitor 1 in 5i3X is shown (pink) and all potential binding residues labeled, the flap shown in blue. Structure of BACE1 complexed with inhibitor 1 (shown in pink), interactions between ligand and protein at the catalytic aspartic acids Asp32 and Asp228 and at Trp72 of the S2’ region (Table 3). Colors: ß sheets Yellow; coils green; flap blue; helices red; Nitrogen atoms blue; inhibitor cyan.
The flap, a β-hairpin loop containing residues Tyr71to Val69, positioned directly over the catalytic dyad, can open and close to allow substrate and inhibitor access to the active site; see Figure 1 and Figure 6A.
All inhibitors occupy similar binding pockets and more importantly form hydrogen bond interactions with the catalytic dyad of Asp32 and Asp228. The active site of BACE1 is mostly hydrophobic, with no charged residues within a distance of 8 Å of the Asp dyad; the aspartate residues form bonds with the amine and the nitrogen of the pyridine ring; see Figure 1 structure 8 and Figure 7 and Figure 8.
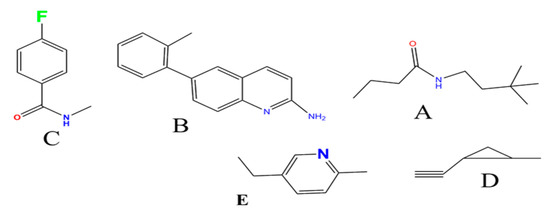
Figure 7.
Structure of the fragments in Inhibitors 1, 2, 3 and 4. (A) the alkyl chain fragment with amide; (B) phenyl rings attached to amidine group; (C) Flour and amide attached to the phenyl ring in para position; (D) the fragment with Л cloud and cyclic ring; (E) pyridine fragment.
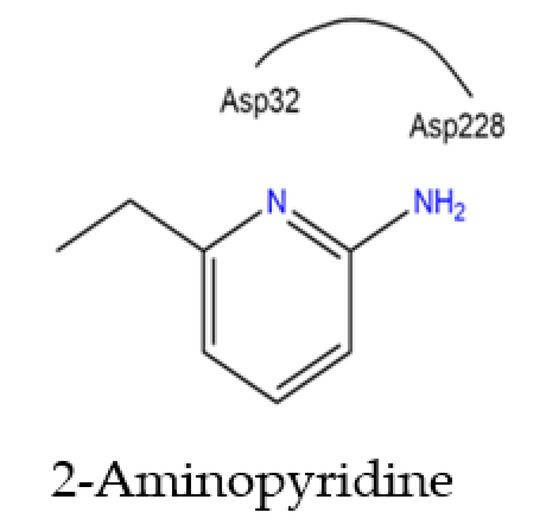
Figure 8.
Binding of Asp32 and Asp228 to the 2-aminopyridine moiety.
The hydrophobic interactions Tyr71, Val69, Gly13, Gly230. Phe108, Leu30, and Ile118 are common in all 68J, 68K, 68L, and 68M inhibitors, and all display hydrophobic contacts with residues. The nitrogen containing heterocycles are often referred to as the aspartyl binding motif; see Figure 8.
Inhibitors 1, 2, 3, and 4 share fragments A and B in Figure 7 and Figure 8, where the terminal CR3 forms hydrophobic interactions in the S2′ pocket which contains D228. The correlation coefficient of binding energy (∆H) for these 4 inhibitors with vdW energy is 0.95 and Esurface is 0.63. The 2-aminopyridine fragment forms hydrogen bonds with Asp32 (2.6Å) and a weaker interaction with Asp 228 (4.9 Å).
The correlation with electrostatic energy is very small (Table 4) indicating a mostly hydrophobic interaction on this side. The phenyl rings in structure B (Figure 7) bind Tyr 71 (3.0 Å) and Val69 (4.0 Å). Inhibitors 1 and 2 have an extra fragment C which binds the S3 pocket and differ by one fragment (where fragment D is in inhibitor 1 and replaced by fragment E in inhibitor 2) which binds the S1 pocket and Gly34, where in inhibitor 1 it is D and in inhibitor 2 it is E. Fragment D in Figure 7 with its Л cloud provides stronger interaction than that of E. All differences arise from different vdW interactions, and the π–π stacking interaction between the phenyl-imino group and Phe108 added stability with the enzyme 5i3W-68L (inhibitor 5) binds Asp 32, Asp 228, Gly230, Tyr71, Leu30, and Gly13, see Figure 9E. This inhibitor shares fragment C in Figure 7 with inhibitors 1–4, which binds S1 and yields an experimental ∆G value of −12.5 kcal/mol and comparable vdw energy to other inhibitors 1–4, whereas the calculated value is −8.15(4) kcal/mol. The fragment  binds Asp32 and Leu30. The attachment of the phenyl ring could lead to a significant hydrophobic interaction, which would increase the probability of permeability into the brain. Thus, many BACE1 inhibitors were designed using phenyl -based analogs.
 binds Asp32 and Leu30. The attachment of the phenyl ring could lead to a significant hydrophobic interaction, which would increase the probability of permeability into the brain. Thus, many BACE1 inhibitors were designed using phenyl -based analogs.
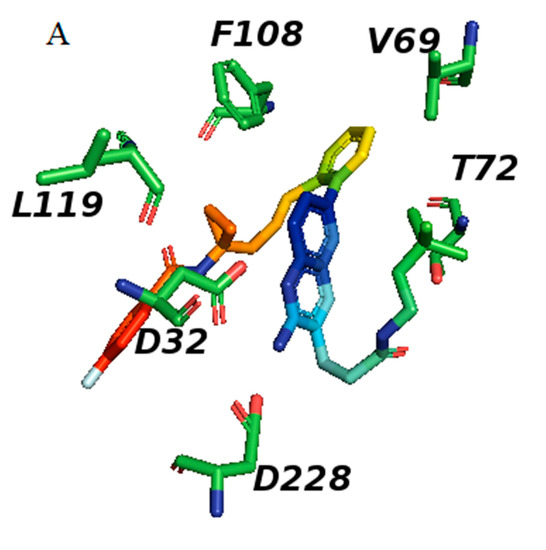
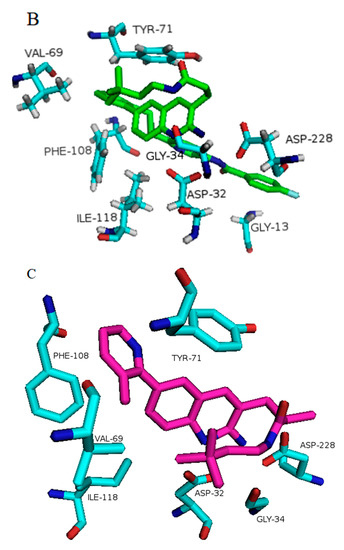
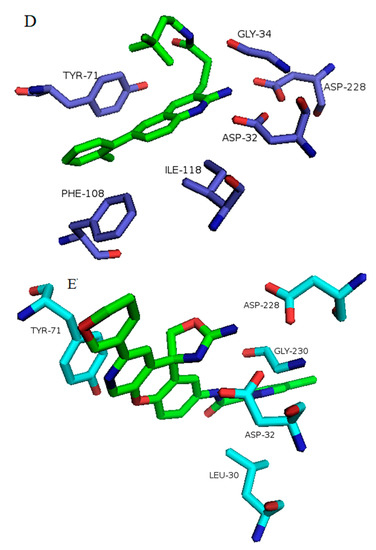
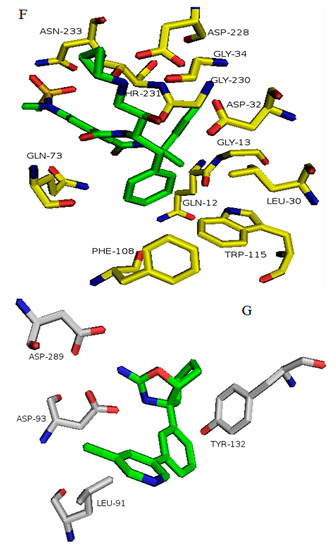
Figure 9.
Binding of inhibitors to BACE1 obtained from average structures after MD simulation software. Structures are defined by their PDB ID of complexes of BACE1 and the inhibitor: (A) 5i3X-68J (1); (B) 5i3Y-68K (2); (C) 5i3V-69M (4); (D) 5ie1-6BS (3); (E) 5i3W-68L (5); (F) 3TPP-5HA (7); (G) 4LC7 = 1WP (6). Inhibitor numbers in brackets from Figure 2, see also Figures S1–S8.
In BACE1 bound to inhibitor 7 (4LC7), shown in Figure 6G, and the heterocyclic pentatomic ring  binds Asp93 and Asp289. This feature is shared with 5i3W (Figure 9E) in which the same ring binds Asp32 and Asp228. Inhibitor 5 (5i3W) has an extra phenyl group that binds the hydrophobic pocket (near Tyr71) which enhanced its binding over 4LC7. Inhibitor 6 (3TPP) has a different structure but shares an aryl ring with other inhibitors and it showed enhanced binding (Figure 6F. The sulfate group binds Asn233 and the attached aryl group interacts with Gln73, the fragment
  cyclopropane ring-NH binds the other end of Asn233 and Thr231. The Asp 32, Asp 228, Gly230, Gly34, and the other side of Thr231 all make hydrogen bonds with the oxygen and nitrogen on the polar end (Figure 9F).
 binds Asp93 and Asp289. This feature is shared with 5i3W (Figure 9E) in which the same ring binds Asp32 and Asp228. Inhibitor 5 (5i3W) has an extra phenyl group that binds the hydrophobic pocket (near Tyr71) which enhanced its binding over 4LC7. Inhibitor 6 (3TPP) has a different structure but shares an aryl ring with other inhibitors and it showed enhanced binding (Figure 6F. The sulfate group binds Asn233 and the attached aryl group interacts with Gln73, the fragment
  cyclopropane ring-NH binds the other end of Asn233 and Thr231. The Asp 32, Asp 228, Gly230, Gly34, and the other side of Thr231 all make hydrogen bonds with the oxygen and nitrogen on the polar end (Figure 9F).
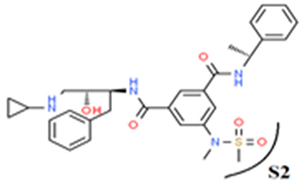
 The aryl group on the opposite end makes hydrophobic interactions with Phe108, Gly13, Gln12, and Leu30. The oxygen of the peptide bond also interacts with Gln73. The sulfate fragment in 3TPP-5HA binds S2, as seen in the structure below.
3.3. Drug Likeness
Lipinski’s rule of five was used to evaluate drug likeness or determine if a compound with a certain pharmacological activity has properties that would make it a feasible orally active drug in humans (Table 6).

Table 6.
Correlation coeffecients of polar surface area with each energy contribution for various inhibitors.
The rule was based on the observation that most orally administered drugs are relatively small and moderately lipophilic. The rule predicts the absorption, distribution, metabolism, and excretion of the compound. Lipinski’s rule states that, in general, an orally active drug has no more than one violation of the following criteria:
- -
- No more than five hydrogen bond donors (total H-N, H-O bonds);
- -
- No more than 10 hydrogen bond acceptors (all N+O atoms);
- -
- Molecular mass less than 500;
- -
- LogP value less than 5 (octanol-water partition coefficient);
- -
- Drug likeness improved LogP (−0.4 to 5.6), molecular weight 180 to 480, total atoms 20 to 70, including N and O,
Veber’s Rule:
Good oral bioavailability, questioned the 500 molecular weight cutoff. Introduced polar surface area (PSA), no greater than 140 Å2, and 10 rotatable bonds or less (Table 7).

Table 7.
Drug likeness parameters for inhibitors under study (all rules are included).
PSA is a commonly used metric for the optimization of a drug’s ability to permeate cells [39]. Molecules with a polar surface area of greater than 140 Å2 tend to be poor at permeating cell membranes. For molecules to penetrate the blood–brain barrier; a PSA less than 90 Å2 is usually needed [39]. Inspecting the properties of the seven inhibitors used (Table 6) shows that each can be a suitable drug.
Inhibitors 1, 2, 3, and 4, which share a hydrophobic mioty (Figure 7) and the 2-aminopyridine fragment (Figure 7) in their structure, showed the best correlation between PSA (Table 8) and binding energy (∆H), Evdw, Esurface, and Eelectrostatic; Table 4. Furthermore, the vdw energy showed the best correlation with PSA for these inhibitors. Inhibitors 1 to 6 showed the best correlation with surface area energy (Figure 7). When structure 5 was added to the group, the correlation of PSA with Eelectrostatic improved due to the presence of hydrogen bond donors and acceptors in inhibitor 5, but the correlation with Esurface was not changed. Analysis of energies involved in the binding of inhibitors to BACE1 will aid the design of new inhibitors with more efficacy. Ligand efficiency (LE) [40] is calculated by scaling affinity by molecular size (Table 9). LE was introduced as a metric for the molecular structure to normalize the affinity with respect to molecular size by scaling the standard free energy of binding (ΔG°) with the number of heavy atoms (NnH), using the formula:
LE (T, P, C) = −∆G/NnH

Table 8.
The areas of hydrophobic pockets in BACE1 for each inhibitor binding (Figure S5). The calculated energies resulting from hydrophobicity using the formula −25 cal/Å2of surface area and comparing the estimated hydrophobic energy with that resulting from reported polar surface area (PSA) [21].

Table 9.
Ligand efficiency (LE) and a comparison of ∆G experimental with the calculated ∆G values from MM/GBSA.
LE values vary with conditions, and a value of 0.3 or higher is considered favorable. LE decreases with an increase in the number of heavy atoms. There was no obvious trend followed in the inhibitors in this work due to variation in structure. This variation in the results of high energy cost for desolvation of ligands depends on the changes that took place. Ligand efficiency values of inhibitors were in the range of 0.09 to 0.41 (Table 9).
The drug-like properties when applying Lipinski’s rule of five, Veber’s Rule, and the MDDR Rule (No. rings ≥ 3, No. rigid bonds ≥ 18, No. rotatable bonds ≥ 6) changed depending on functional groups and molecular weights. There was a good correlation between the Gibbs free energy (∆G) calculated and the experimentally obtained values [21,41].
4. Conclusions
The parameters for successful drugs depend on the specificity and binding to the receptor; a 500 molecuar weight and a Kd value in the range of 1 to 10 nM is preferred for good absorption. The potency depends on the specificity of binding (Asp) and increased hydrophobic binding residues are preferred. However, this depends on the specificity, and a balance between specific binding and hydrphobicity should be maintained. The higher LE, the more promising the drug binding to a specific target.
The binding energy of drug to its target depends on a group of energies [42]; the first is the desolvation energy needed to break the hydrogen bonds between the inhibitor and solvent, then the energy released upon binding of the inhibitor to the receptor, and burying the inhibitor hydrophobic surface. Polar interactions and hydrophobic surface burial depend on the surface area (every 1Å2 of surface area releases approximately 25 cal); see Table 7 and Table 8. The disadvantage in the drugs under study is the limited surface area, of around 90 Å2, for the drugs to enter brain cells. Differences between calculated and actual ΔG values are due to imperfect H-bonds caused by steric and distance factors, which result in a higher E-cost for desolvation.
Research on the mechanism of AD has considered BACE1 as a key enzyme that participates in the formation of Aβ, and which broadly exists in the brains of AD patients. Compounds with peptide mimetic structures are effective in BACE1 inhibition according to experimental aspartic proteinase results in vitro. Nevertheless, these kinds of BACE1 inhibitors did not perform well in pre-clinical trials due to their excessive number of hydrogen bond donors and acceptors, which increase the polarity and further lead to a lack of permeability across the BBB (Blood Brain Barrier). Based on molecular dynamics and energy studies, the amino acid residues Asp228 and Asp32 in the BACE1 enzyme play an important role in the interactions between compounds and the enzyme. Furthermore, S1, S3, S2′ and other pockets also exhibited a central role in binding with the BACE1 inhibitors. In the light of these studies, compounds with amino heterocycles were designed and synthesized. The presence of amino and aromatic rings maintained the inhibitory ability while decreasing the polarity of the structure.
MM/PBSA energies are calculated for snapshots obtained by MD simulations. Variations are normally solved by calculating only interaction energies, studying many snapshots, and using several independent simulations. It has been suggested that the calculations can be performed using only minimized structures, but such results may depend on the starting structures. Finally, MM/GBSA, compared with other ligand binding methods, showed reasonable accuracy.
MM/GBSA is a popular method for calculating absolute binding affinities with a modest computational effort. Energy results from six well-defined terms. However, questions remain about the dielectric constant, parameters for the non-polar energy, the radii used for the PB or GB calculations, whether to include the entropy term, and whether to perform MD simulations or minimizations. In practice, MM/GBSA typically provides results of intermediate quality, which are often better than docking and scoring but worse than FEP; for example, R2 = 0.3 for the whole PDB bind database, but R2 = 0.0–0.8 for individual proteins.
Supplementary Materials
The following are available online at https://www.mdpi.com/2079-3197/8/4/106/s1, Figure S1: 5i3V; Figure S2: Different views of binding of inhibitor 4 in 5i3v; Figure S3: Binding mode of Inhibitor 6 in 4LC7 Different views; Figure S4: Protein view of inhibitor 7 in 3TP; Figure S5: Surface areas of inhibitors and the BACE1 surface; Figure S6: Views of Inhibitor 3 binding protein view (5ie1); Figure S7: Views of inhibitor 2 to BACE1 (5i3Y); Figure S8: 5i3W binding of inhibitor 5 to BACE1; Figure S9: The dendogram (cluster trees) of the BACE1-Inhibitor in 5i3X; Figure S10: The dendogram (cluster trees) of the BACE1-Inhibitor in 5i3X complex employing RMSD.
Funding
This Research was funded by Birzeit University.
Acknowledgments
I would like to thank J. Andrew McCammon, department of Biochemistry & Biophysics, UC-San Diego, USA for hosting me for a year in his group, and his generous support in providing all facilities including office space and access to GPU cluster. This work would not be possible without his support.
Conflicts of Interest
The authors declare no conflict of interest.
References
- Gu, T.; Wu, W.Y.; Dong, Z.X.; Yu, S.P.; Sun, Y.; Zhong, Y.; Lu, Y.T.; Li, N.G. Development and Structural Modification of BACE1 Inhibitors. Molecules 2017, 22, 4. [Google Scholar] [CrossRef] [PubMed]
- Rombouts, F.J.R.; Alexander, R.; Cleiren, E.; De Groot, A.; Carpentier, M.; Dijkmans, J.; Fierens, K.; Masure, S.; Moechars, D.; Palomino-Schätzlein, M.; et al. Fragment Binding to β-Secretase 1 without Catalytic Aspartate Interactions Identified via Orthogonal Screening Approaches. ACS Omega 2017, 2, 685–697. [Google Scholar] [CrossRef] [PubMed]
- Ghosh, A.K.; Brindisi, M.; Tang, J. Developing $β$-secretase inhibitors for treatment of Alzheimer’s disease. J. Neurochem. 2012, 120, 71–83. [Google Scholar] [CrossRef] [PubMed]
- Hong, L.; Koelsch, G.; Lin, X.; Wu, S.; Terzyan, S.; Ghosh, A.K.; Zhang, X.C.; Tang, J. Structure of the protease domain of memapsin 2 ($β$-secretase) complexed with inhibitor. Science 2000, 290, 150–153. [Google Scholar] [CrossRef]
- Malamas, M.S.; Erdei, J.; Gunawan, I.; Turner, J.; Hu, Y.; Wagner, E.; Fan, K.; Chopra, R.; Olland, A.; Bard, J.; et al. Design and synthesis of 5,5′-disubstituted aminohydantoins as potent and selective human β-secretase (BACE1) inhibitors. J. Med. Chem. 2010, 53, 1146–1158. [Google Scholar] [CrossRef]
- Steele, T.G.; Hills, I.D.; Nomland, A.A.; de León, P.; Allison, T.; McGaughey, G.; Colussi, D.; Tugusheva, K.; Haugabook, S.J.; Espeseth, A.S.; et al. Identification of a small molecule $β$-secretase inhibitor that binds without catalytic aspartate engagement. Bioorg. Med. Chem. Lett. 2009, 19, 17–20. [Google Scholar] [CrossRef]
- Ren, Z.; Tam, D.; Xu, Y.Z.; Wone, D.; Yuan, S.; Sham, H.L.; Cheung, H.; Regnstrom, K.; Chen, X.; Rudolph, D.; et al. Development of a novel β-secretase binding assay using the alphascreen platform. J. Biomol. Screen. 2013, 18, 695–704. [Google Scholar] [CrossRef]
- Wang, E.; Sun, H.; Wang, J.; Wang, Z.; Liu, H.; Zhang, J.Z.H.; Hou, T. End-Point Binding Free Energy Calculation with MM/PBSA and MM/GBSA: Strategies and Applications in Drug Design. Chem. Rev. 2019, 119, 9478–9508. [Google Scholar] [CrossRef]
- Lu, N.; Kofke, D.A. Accuracy of free-energy perturbation calculations in molecular simulation. II. Heuristics. J. Chem. Phys. 2001, 115, 6866–6875. [Google Scholar] [CrossRef]
- Veselovsky, A.V.; Ivanov, A.S. Strategy of Computer-Aided Drug Design. Curr. Drug Target -Infectious Disord. 2003, 3, 33–40. [Google Scholar] [CrossRef]
- Temiz, N.A.; Trapp, A.; Prokopyev, O.A.; Camacho, C.J. Optimization of minimum set of protein--DNA interactions: A quasi exact solution with minimum over-fitting. Bioinformatics 2010, 26, 319–325. [Google Scholar] [CrossRef] [PubMed]
- Srinivasan, J.; Miller, J.; Kollman, P.A.; Case, D.A. Continuum solvent studies of the stability of RNA hairpin loops and helices. J. Biomol. Struct. Dyn. 1998, 16, 671–682. [Google Scholar] [CrossRef] [PubMed]
- Kollman, P.A.; Massova, I.; Reyes, C.; Kuhn, B.; Huo, S.; Chong, L.; Lee, M.; Lee, T.; Duan, Y.; Wang, W.; et al. Calculating structures and free energies of complex molecules: Combining molecular mechanics and continuum models. Acc. Chem. Res. 2000, 33, 889–897. [Google Scholar] [CrossRef] [PubMed]
- Srinivasan, J.; Cheatham, T.E.; Cieplak, P.; Kollman, P.A.; Case, D.A. Continuum solvent studies of the stability of DNA, RNA, and phosphoramidate- DNA helices. J. Am. Chem. Soc. 1998, 120, 9401–9409. [Google Scholar] [CrossRef]
- Vassar, R. BACE1 inhibitor drugs in clinical trials for Alzheimer’s disease. Alzheimer’s Res. Ther. 2014, 6, 1–14. [Google Scholar] [CrossRef] [PubMed]
- Sliwoski, G.; Kothiwale, S.; Meiler, J.; Lowe, E.W. Computational Methods in Drug Discovery. Pharmacol. Rev. 2014, 66, 334–395. [Google Scholar] [CrossRef]
- Ben-Shalom, I.Y.; Lin, C.; Kurtzman, T.; Walker, R.C.; Gilson, M.K. Simulating water exchange to buried binding sites. J. Chem. Theory Comput. 2019, 15, 2684–2691. [Google Scholar] [CrossRef]
- Götz, A.W.; Williamson, M.J.; Xu, D.; Poole, D.; Le Grand, S.; Walker, R.C. Routine Microsecond Molecular Dynamics Simulations with AMBER on GPUs. 1. Generalized Born. J. Chem. Theory Comput. 2012, 8, 1542–1555. [Google Scholar] [CrossRef]
- Maier, J.A.; Martinez, C.; Kasavajhala, K.; Wickstrom, L.; Hauser, K.E.; Simmerling, C. ff14SB: Improving the Accuracy of Protein Side Chain and Backbone Parameters from ff99SB. J. Chem. Theory Comput. 2015, 11, 3696–3713. [Google Scholar] [CrossRef]
- Rother, K. Introduction to PyMOL. Methods Mol. Biol. Clift. Nj 2005, 635, 1–32. [Google Scholar] [CrossRef]
- Binding Constants. Available online: http://www.bindingdb.org/pdb/1o86 (accessed on 23 December 2018).
- Antechamber Tutorial. Available online: http://ambermd.org/tutorials/basic/tutorial4b/ (accessed on 23 December 2018).
- Wang, J.M.; Wolf, R.M.; Caldwell, J.W.; Kollman, P.A.; Case, D.A. Development and testing of a general amber force field. J. Comput. Chem. 2004, 25, 1157–1174. [Google Scholar] [CrossRef]
- Shanti, P.; Kwon, J.B. How to Cite Amber. Am. Ethnol. 2020, 47, 209. [Google Scholar] [CrossRef]
- Jorgensen, W.L.; Chandrasekhar, J.; Madura, J.D.; Impey, R.W.; Klein, M.L. Comparison of simple potential functions for simulating liquid water. J. Chem. Phys. 1983, 79, 926–935. [Google Scholar] [CrossRef]
- Essmann, U.; Perera, L.; Berkowitz, M.L.; Darden, T.; Lee, H.; Pedersen, L.G. A smooth particle mesh Ewald method. J. Chem. Phys. 1995, 103, 8577–8593. [Google Scholar] [CrossRef]
- Kräutler, V.; Van Gunsteren, W.F.; Hünenberger, P.H. A fast SHAKE algorithm to solve distance constraint equations for small molecules in molecular dynamics simulations. J. Comput. Chem. 2001, 22, 501–508. [Google Scholar] [CrossRef]
- Berendsen, H.J.C.; Postma, J.P.M.; Van Gunsteren, W.F.; Dinola, A.; Haak, J.R. Molecular dynamics with coupling to an external bath. J. Chem. Phys. 1984, 81, 3684–3690. [Google Scholar] [CrossRef]
- Miller, B.R.; Mcgee, T.D.; Swails, J.M.; Homeyer, N.; Gohlke, H.; Roitberg, A.E. MMPBSA.py: An Efficient Program for End-State Free Energy Calculations. J. Chem. Theory Comput. 2012, 8, 3314–3321. [Google Scholar] [CrossRef] [PubMed]
- Wang, W.; Kollman, P.A. Computational study of protein specificity: The molecular basis of HIV-1 protease drug resistance. Proc. Natl. Acad. Sci. USA 2001, 98, 14937–14942. [Google Scholar] [CrossRef]
- Genheden, S.; Ryde, U. The MM/PBSA and MM/GBSA methods to estimate ligand-binding affinities. Expert Opin. Drug Discov. 2015, 10, 449–461. [Google Scholar] [CrossRef]
- Narang, S.S.; Goyal, D.; Goyal, B. Inhibition of Alzheimer’s amyloid-β42 peptide aggregation by a bi-functional bis-tryptoline triazole: Key insights from molecular dynamics simulations. J. Biomol. Struct. Dyn. 2020, 38, 1598–1611. [Google Scholar] [CrossRef]
- Hermansson, A. Calculating Ligand-Protein Binding Energies from Molecular Dynamics Simulations-Thesis in Physical Chemistry. Master’s Thesis, KTH Royal Institute of Technology, Stockholm, Sweden, July 2015. Available online: https://www.diva-portal.org/smash/record.jsf?pid=diva2%3A839581&dswid=6921 (accessed on 23 December 2018).
- Roe, D.R.; Cheatham, T.E., III. PTRAJ and CPPTRAJ: Software for processing and analysis of molecular synamics trajectory data. J. Chem. Theory Com. 2013, 9, 3084–3095. [Google Scholar] [CrossRef] [PubMed]
- Lill, M.A.; Thompson, J.J. Solvent interaction energy calculations on molecular dynamics trajectories: Increasing the efficiency using systematic frame selection. J. Chem. Inf. Model. 2011, 51, 2680–2689. [Google Scholar] [CrossRef]
- Galindo-Murillo, R.; Roe, D.R.; Cheatham, T.E. Convergence and reproducibility in molecular dynamics simulations of the DNA duplex d(GCACGAACGAACGAACGC). Biochim. Biophys. Acta Gen. Subj. 2015, 1850, 1041–1058. [Google Scholar] [CrossRef] [PubMed]
- RCSB PDB: Search. Available online: https://www.rcsb.org/search (accessed on 23 December 2018).
- Binding MOAD. Available online: http://bindingmoad.org/ (accessed on 23 December 2018).
- Pajouhesh, H.; Lenz, G.R. Medicinal chemical properties of successful central nervous system drugs. NeuroRx 2005, 2, 541–553. [Google Scholar] [CrossRef]
- Irannejad, H. Lipophilic Ligand Efficiency as a Useful Metric in Hit and Lead Optimization. J. Med. Chem. Drug Des. 2019, 2, 9–10. [Google Scholar] [CrossRef]
- Wang, C.; Nguyen, P.H.; Pham, K.; Huynh, D.; Le, T.B.N.; Wang, H.; Ren, P.; Luo, R. Calculating protein-ligand binding affinities with MMPBSA: Method and error analysis. J. Comput. Chem. 2016, 37. [Google Scholar] [CrossRef]
- Li, S.; Zhao, H.; Li, J.; Hao, J.; Yu, H. A series of molecular modeling techniques to reveal selective mechanisms of inhibitors to β-Site amyloid precursor protein cleaving enzyme 1 (BACE1) and β-site amyloid precursor protein cleaving enzyme 2 (BACE2). J. Biomol. Struct. Dyn. 2020, 1–14. [Google Scholar] [CrossRef]
Publisher’s Note: MDPI stays neutral with regard to jurisdictional claims in published maps and institutional affiliations. |
© 2020 by the author. Licensee MDPI, Basel, Switzerland. This article is an open access article distributed under the terms and conditions of the Creative Commons Attribution (CC BY) license (http://creativecommons.org/licenses/by/4.0/).