1. Introduction
The stage of skin cancer indicates how widespread the disease is in the body and is a very important parameter for determining prognosis and deciding on the type of treatment to be undertaken. Therefore, diagnosis and relative early staging are of fundamental importance to increase a patient’s chances of survival. Basal cell and spino-cellular carcinomas, unlike other skin tumors such as melanoma, metastasize only in rare cases and many years after their appearance. As a result, they are usually removed when they are still located. In persons with immune system issues, spino-cellular carcinomas can be at high risk of metastasis and for this we proceed with staging with the TNM system: tumors can be classified into four stages (I, II, III and IV) based on the size and position of the disease (T), involvement of lymph nodes (N) and presence of metastases (M). It is clear, therefore, that the search for an efficient and accurate approach that allows dermatologists and/or oncologists to quickly discriminate skin lesion (the so-called “nevus”) suspicions (which therefore deserve further investigation) is a subject of considerable attention by researchers in the medical field. Basal cell and spino-cellular carcinomas, if treated in the initial phases, recover in almost all cases and can often be treated completely, thanks to surgery and/or local treatments. Therefore, surgery is generally the first choice treatment for these tumors. Radiotherapy and systemic chemotherapy (to the whole body) are not used very often for skin carcinomas: chemotherapy is useful in cases where the tumor has reached lymph nodes. Therefore, much emphasis is placed on early diagnosis, especially for the most aggressive histology of melanoma.
Among the commonly used methods for early diagnosis of skin tumors is the “ABCDE Method”; based on the abbreviation, the following nevus characteristics are monitored: Asymmetry, Borders, variegation of the Color, Diameter, Evolution of the lesion cuts. Basically, a physician who applies the ABCDE criterion in the analysis of a skin lesion performs a visual statistical evaluation of the nevus based on the heuristic (and experience-based) evaluation of the characteristics mentioned. Clearly, this strategy suffers from the subjectivity of the clinician or low sensitivity and specificity. Consequently, analysis by the ABCDE method is followed by the necessary biopsy confirmation that often, however, belies the apparent oncological risk that instead the dermatologist had estimated by means of the ABCDE analysis. In order to correctly address this issue, the authors propose an automatic pipeline discrimination system based on the analysis of dermoscopic images so as to classify the low-risk lesion (benign lesions or low risk of oncological progression) from those at high risk (high risk of oncological progression), trying to find a good trade-off between sensitivity and specificity.
Scientific research is making significant progress in the aspect of early nevus diagnosis. A method that currently shows itself to be particularly promising is the so-called “ex vivo confocal microscopy” (performed on excised tissue), which allows us to anticipate the time taken for standard histological analyzes, which is about 10 days. The specificity—the ability to exclude the presence of the disease—of this method is particularly high. Thus, this new method allows to intervene with the biopsy only if necessary and not as a precaution in case of suspected malignancy. However, methods based on recent deep learning techniques continue to be much investigated by researchers around the world.
The authors recently developed two different implementations of deep systems for skin lesion discrimination [
1,
2]. The obtained results are promising. A subsequent extension of the proposed approach is described in [
3] and in which performances have been strongly increased, thanks to revision of the hand-crafted image features, adopted together with the use of Stacked Deep Autoencoder as classifiers of such features. All the algorithmic versions proposed by the authors in the previous referenced works have been successfully validated using the public dataset (containing a set of dermoscopic images of benign and malignant nevi) called PH
2 [
4].
However, in the scientific literature, different algorithmic approaches have been proposed for the early and robust diagnosis of skin cancer. Among these, it is worth mentioning methods based on classical pattern recognition techniques combined with the statistical study of dermoscopic images [
5,
6]. In [
6,
7,
8,
9], some methods for classifying skin cancer are described, which are based on the adaptive analysis of the so-called global and local characteristics of lesions. Using soft computing techniques, the authors of these pipelines have successfully discriminated skin lesions by post-processing these features. Also the use of clustering methods based on Support Vector Machines (SVM), Artificial Neural Networks (ANNs), K-closer, Naive-Bayes Algorithm have shown remarkable discriminative abilities, compared to the classical methods based on the search for specific patterns in dermoscopic images [
8,
9]. A very promising approach has been proposed in [
7], in which the features of ad hoc hand-crafted dermoscopic image features are combined with an in-depth learning algorithm capable of extracting additional learned functions, as well as classifying the entire set of features with respect to the characterization of benign versus malignant lesions. However, the analysis of the results obtained in [
7] shows a fairly low sensitivity/specificity ratio. In [
8], the authors propose an interesting novel multiple convolution neural network model (MCNN) to classify different disease types in dermoscopic images, where several models were trained separately using an additive sample learning strategy. The results are promising, as confirmed by authors in [
8]. An interesting consideration was made by such authors in [
9] in which the skin lesion images dataset was augmented before it is used in the deep learning pipeline. The image dataset augmentation showed an interesting performance increase with respect to the same approach applied in the same dataset without augmentation pre-processing. More details are provided in [
9].
The authors intend to propose an innovative method of nevus discrimination for the early diagnosis of high-risk malignancy lesions (with particular attention to the histology called melanoma as the most aggressive). Considering that melanoma originates in the melanocytic cells of the epidermis, we characterized the proposed hand-crafted features that were particularly attentive to the superficial melanocytic distribution of the nevus. In fact, we designed ad-hoc hand-crafted image features that allow us to characterize the self-similarity of melanocytic cells in addition to the degree of symmetry and regularity of the edges of the lesion of the skin, as specified in the next paragraphs. In this way, we bio-inspired the proposed algorithm, since the characterization of the nevus is correlated to the analytical modeling of the physical properties of the melanocytic cells of the analyzed lesion. Moreover, the algorithmic part linked to the use of Cellular Neural Networks (CNNs) was hypothesized to analyze each pixel of the lesion (which groups several melanocytic cells) by means of the processing defined by the suitably configured CNNs’ cell state equation. Therefore, each CNN’s setup allows the characterization of a specific morphological feature of the analyzed lesion, thus enabling the discriminator system based on convolutive multi-level deep architecture to learn these morphological features and from these to provide an internal functional mapping useful for classifying the analyzed skin lesion. The proposed method will be compared with methods present in scientific literature and previous algorithmic versions proposed by the authors [
1,
2,
3]. In order to guarantee a robust basis of comparison, it was decided to apply and validate the proposed pipeline in the same database of dermoscopic images, i.e., the PH
2 database [
4].
2. Materials and Methods
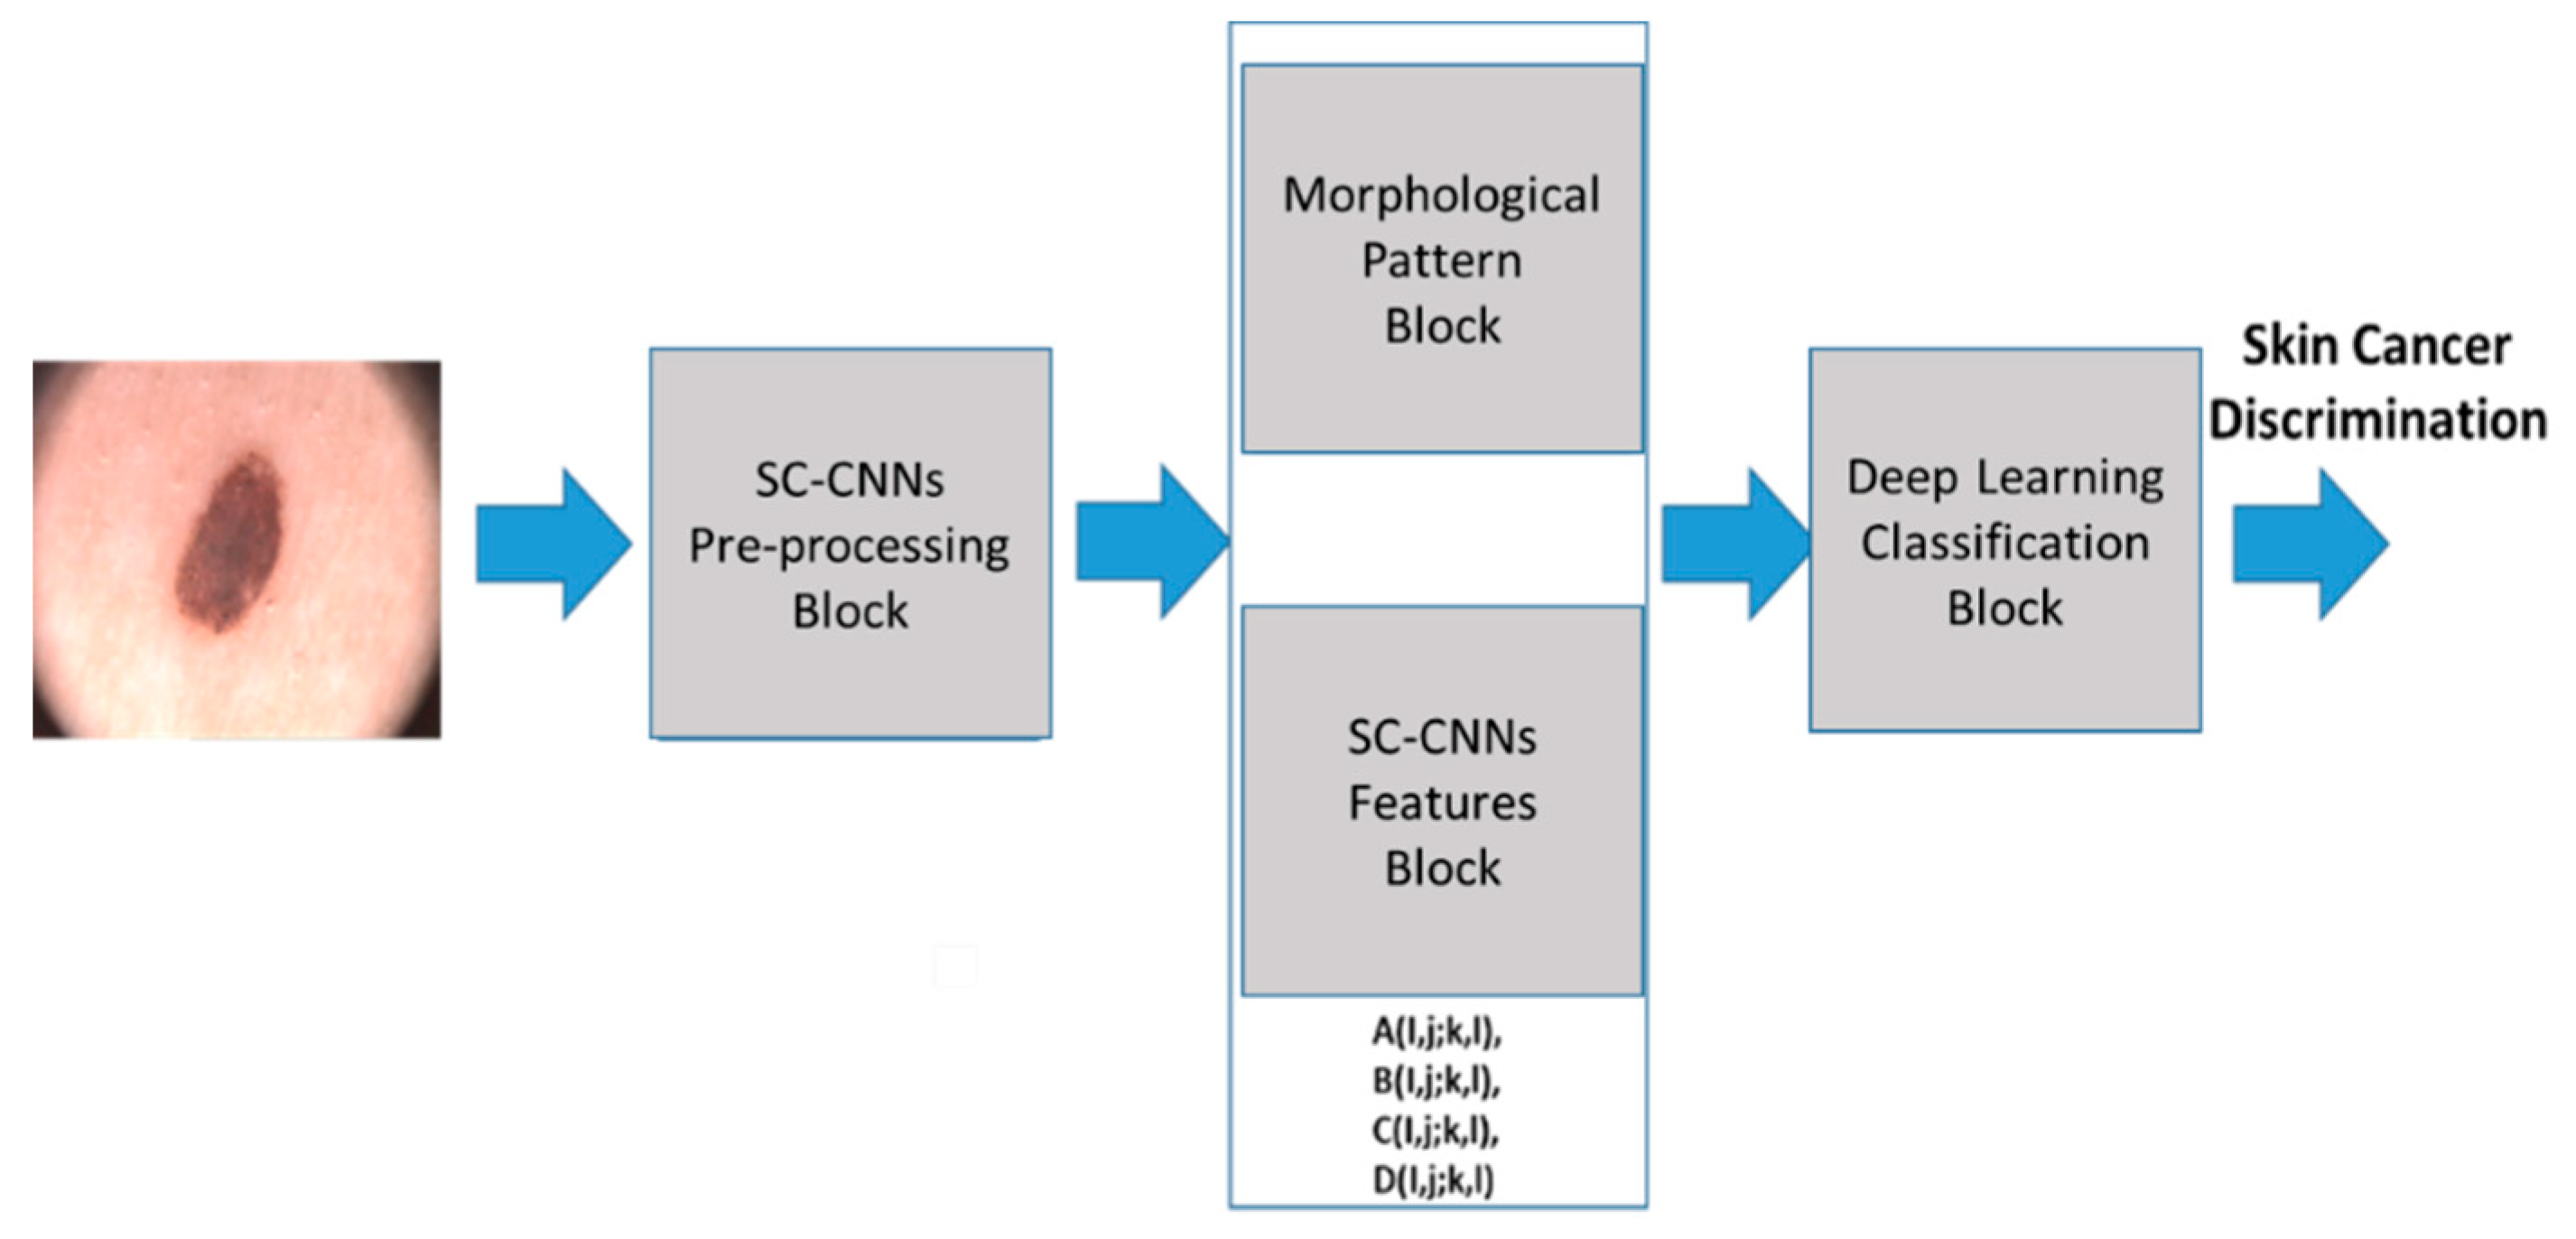
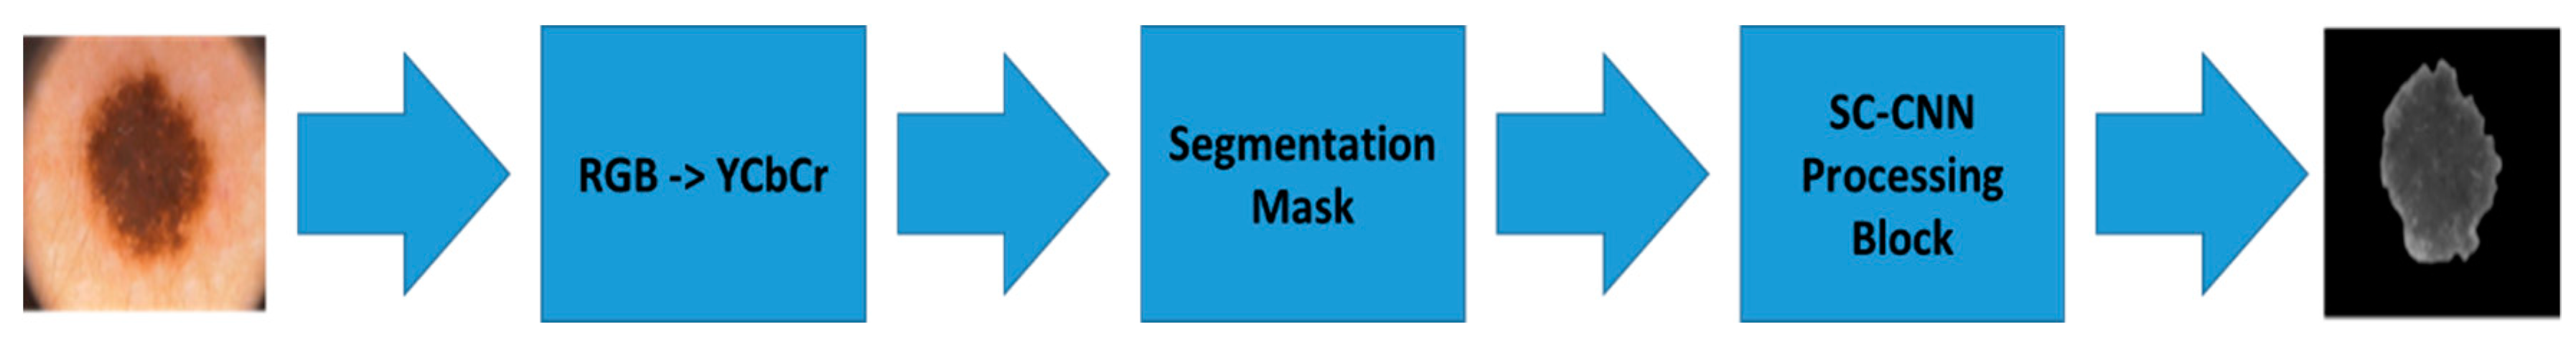
Figure 1 shows the proposed pipeline. Each block is detailed in the following paragraphs. The pipeline proposed here aims to analyze the dermoscopic image of the nevus generating features that are characteristic of the lesion of the skin, which allows the convolutional classification system to characterize the high risk of oncological progression or confirm its benignity. In this way, we want to provide physicians with a practical and innovative tool that allows them to diagnose with sufficient evidence the neoplastic progression of a new growth of skin.
2.1. SC-CNNs Pre-Processing Block
The input dermoscopy lesion image D(x,y) is usually a simple RGB colour image acquired by classical medical optical dermatoscope.
Dermatoscopy, dermoscopy or epiluminescence, is a non-invasive technique aimed at the early diagnosis of melanoma based on an optical instrument called a dermatoscope, which allows to observe sub-cutaneous patterns not visible to the naked eye, favoring their recognition.
The optical dermatoscope is a small manual tool based on a lens, able to provide magnifications mainly between 10 and 20 times, specially illuminated with incident light. It is now demonstrated how dermoscopy increases the diagnostic sensitivity for melanoma compared to simple vision with the naked eye of 20–30%, allowing early diagnosis. Experiences over the last decade have made it possible to extend the application of this diagnostic technique to non-pigmented skin lesions. Today dermatoscopy is particularly effective in the recognition of non-melanocytic skin tumors such as melanoma, basal cell carcinoma and Bowen’s disease and of other cutaneous neo-formations such as seborrheic keratoses, actinic keratoses, dermatofibroma, and clear cell acanthoma.
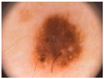
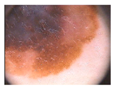
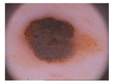
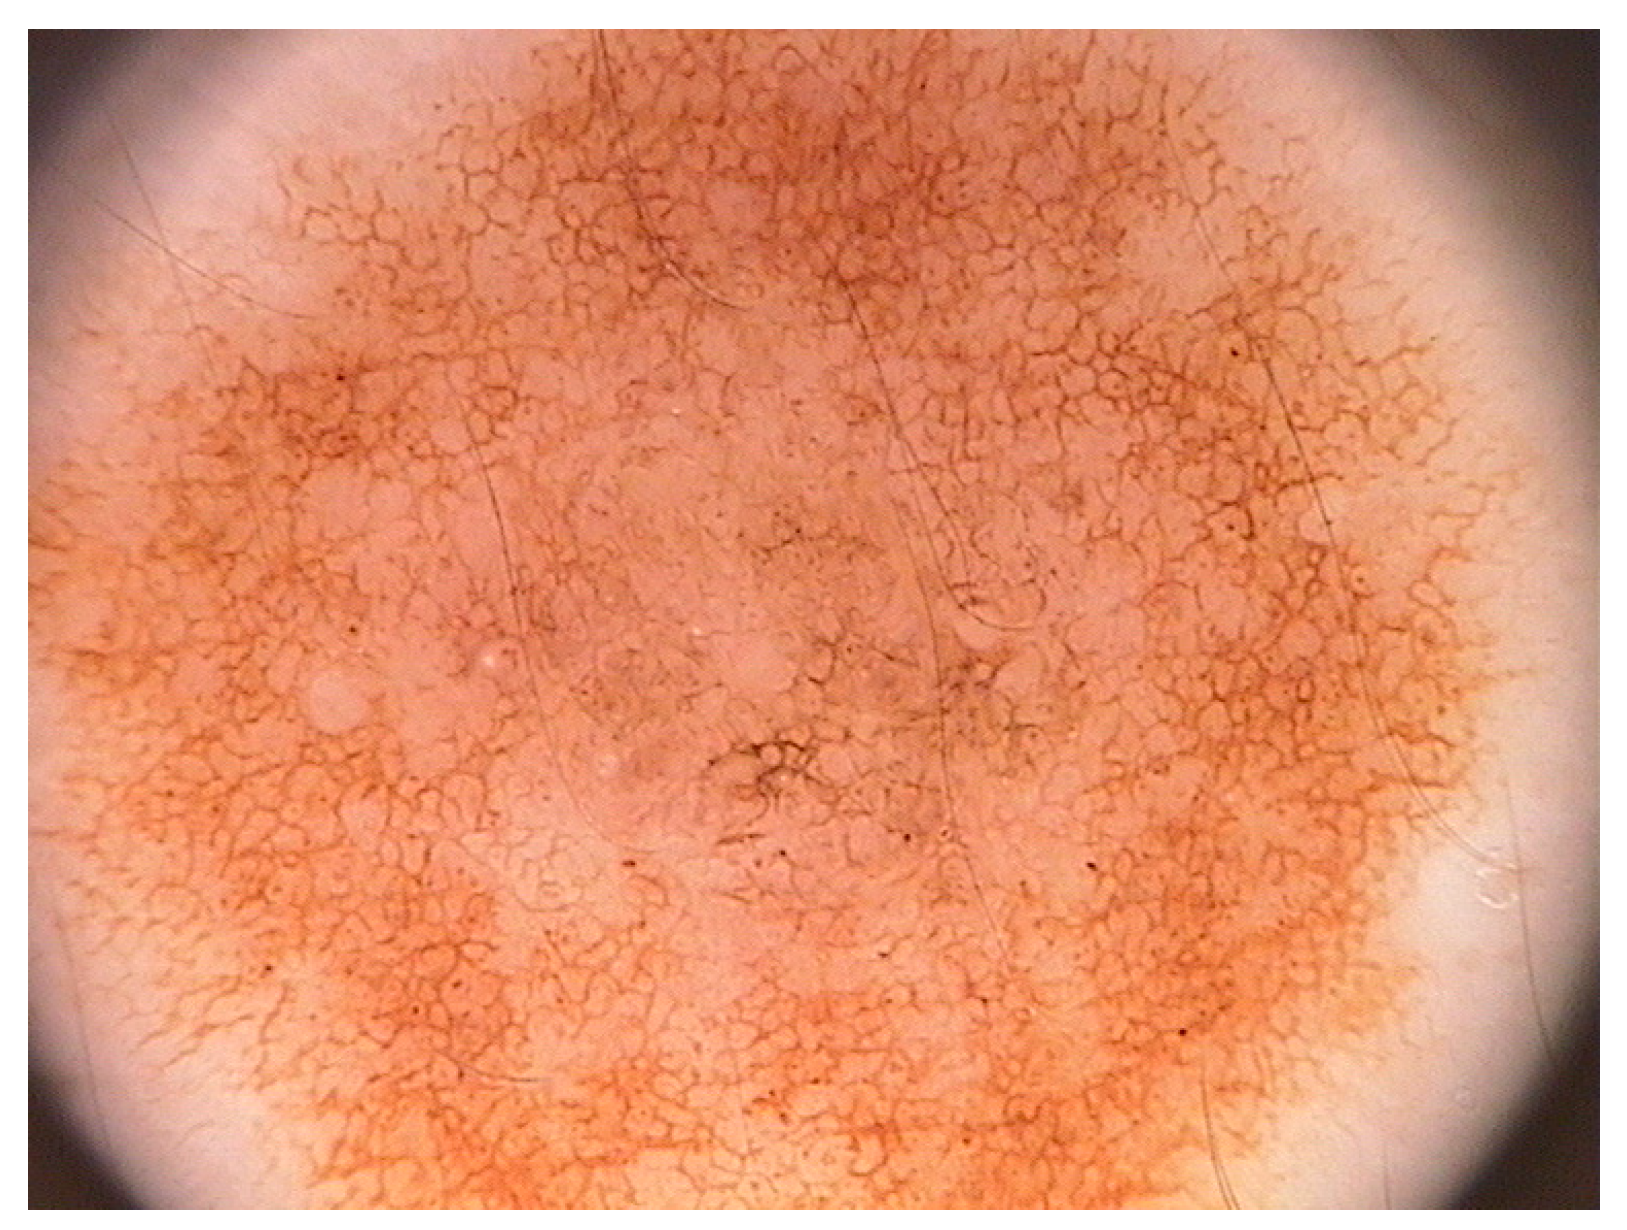
Figure 2 shows a classical dermoscopy image of a nevus. We are interested in a method that allows us to discriminate oncologically the lesion of the skin using a low computational complexity method.
For this reason, the proposed pipeline will process the gray-level component of the starting dermoscopic RGB colour image. To do that, the source dermoscopic colour images are converted into YCbCr format [
10,
11,
12] from which we will estract only the luminance component (gray levels image). We denoted this gray-levels image as
Yp(
x,
y). It is fed as “input” and “state” to a State-Controlled Cellular Neural Networks (SC-CNNs) 2D matrix having a size equal to the source image
Yp(
x,
y) i.e.,
m ×
n.
The first version of the Cellular Neural (or Nonlinear) Network (CNN) was proposed by L.O Chua and L. Yang [
13]. The CNNs can be defined as a high speed, local interconnected computing array of analog processors. The CNN dynamic is defined through so-called cloning template matrixes. The CNN cells interact with each other within their neighbourhood, defined by a heuristic radius.
Each CNN cell has an input, a state, and an output, which is correlated to the state (usually by means of Pieweise Linear (PWL) function). The CNN can be implemented both in digital (trough FPGA technology) and analog (VLSI or UVLSI technology) for which it is able to perform high speed “near real-time” computations. Some stability results by means of Lyapunov theorems and consideration about the dynamics of the CNNs can be found in [
13]. Several extensions of classical CNN have been reported in the literature, among which it is worth mentioning the so-called State-Controlled CNNs introduced (SC-CNNs) by Arena et al. in [
14]. This model directly explicates the dependency of dynamic evolution of the cell to the “state” of the single cell. We refer to SC-CNNs in the following mathematical formulations. By assigning each normalized gray-level lesion image
Yp(
x,
y) (of size
m ×
n) to input and state of the SC-CNNs, several image processing tasks may be performed according to the defined cloning templates instructions [
14]. Equation (1) defines the state equation of a (
m ×
n) SC-CNNs.
Nr(
i,
j) represents the neighbourhood of each cell
C(
i,
j) with radius
r;
xij represents the state,
yij the output (mapped to the state
xij by means of a classical PWL equation)
, and
uij the input of the cell
C(
i,
j). The cloning templates suitable to define the dynamic of the SC-CNNs are respectively
A(
i,
j;
k,
l),
B(
i,
j;
k,
l),
C(
i,
j;
k,
l), and the constant bias
I. The coefficients
C and
Rx are correlated to the capacitor and resistance of the analog circuit used to implement the single SC-CNNs cell [
13,
14].
As anticipated, the SC-CNNs compared to the classical CNNs model introduced by Chua and Yang make it possible to explain the direct dependence between the state of the cell with that of the adjacent cells belonging to its own neighborhood. In this way, we were able to characterize different image processing tasks with respect to the same executable using the CNN model originally proposed by Chua and Yang. Through SC-CNNs, we can better exploit the dependence between the dynamics of the state of individual cells in the network. In this way, considering that the intensity of the single pixel of the dermoscopic image is associated with the state of the single cell of the SC-CNNs, through the appropriate configurations of the cloning templates, we are able to highlight certain morphological characteristics of the nevus or eliminate others.
Before processing the acquired pre-processed nevus image, it is important to segment the Region of Interest (ROI) of the image (i.e., the nevus) with respect to background (skin). Considering that skin lesion segmentation is another issue currently under investigation by the authors, we decided to focus on the only objective of discriminating against skin lesions and for this reason we used a segmentation mask provided by the dermoscopy images database we used for validating the proposed approach i.e., the PH
2 database [
2].
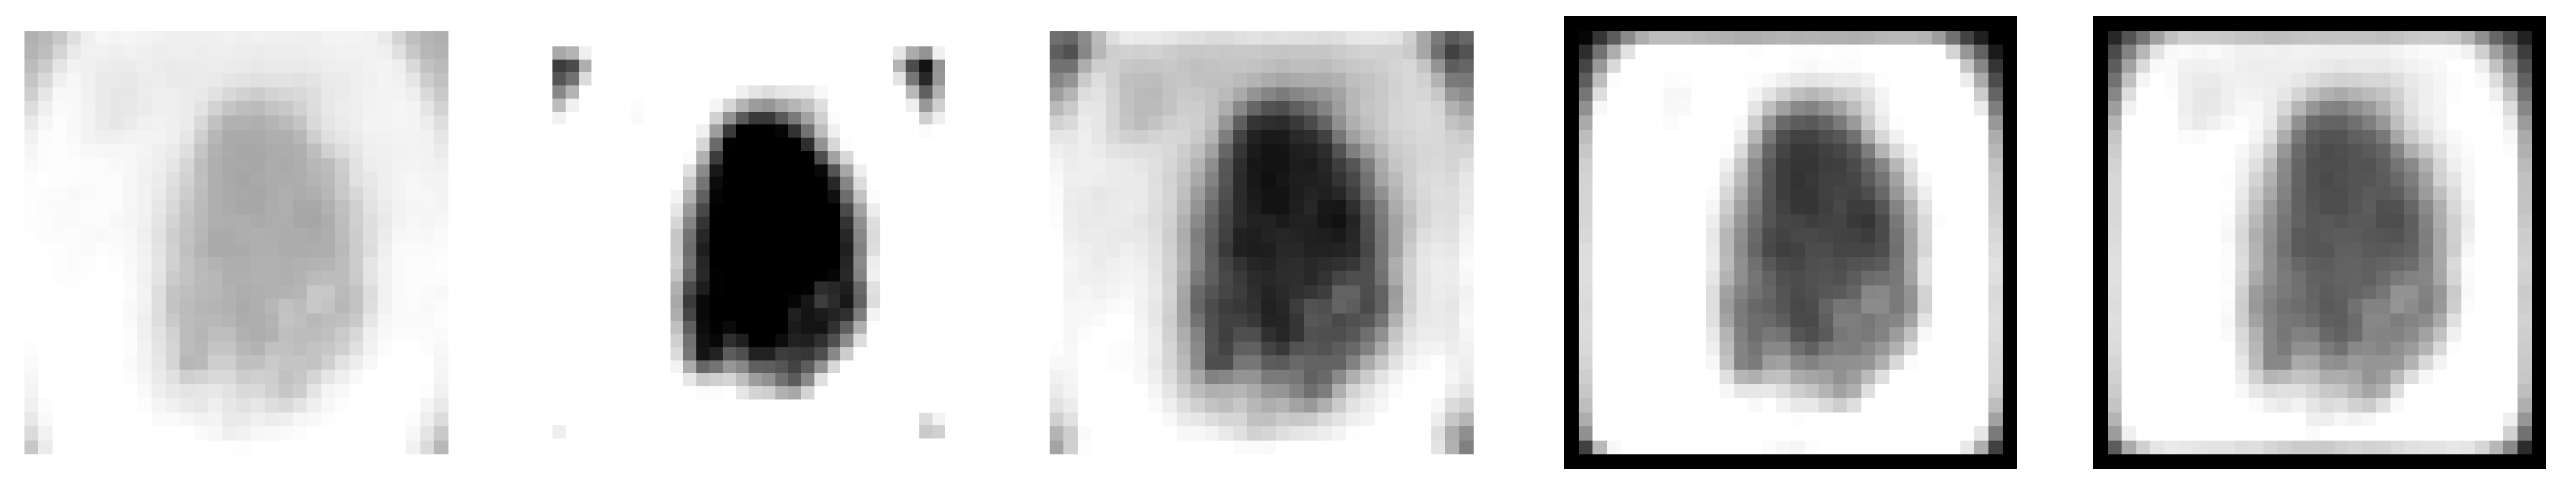
The SC-CNNs pre-processing pipeline is detailed in
Figure 3, while Equation (2) reports the setup of the used pre-processing cloning templates [
2,
15].
The cloning templates in (2) are useful to configure SC-CNNs in order to perform ad-hoc adaptive time-transient image stabilization (motion artifacts, dermo-gel, etc.). The cloning templates’ setup used in (2) improves stabilization with respect to the previous version used in [
1,
2,
3]. The dermoscopy gray level image processed by SC-CNNs is denoted as
YSCC(
x,
y).
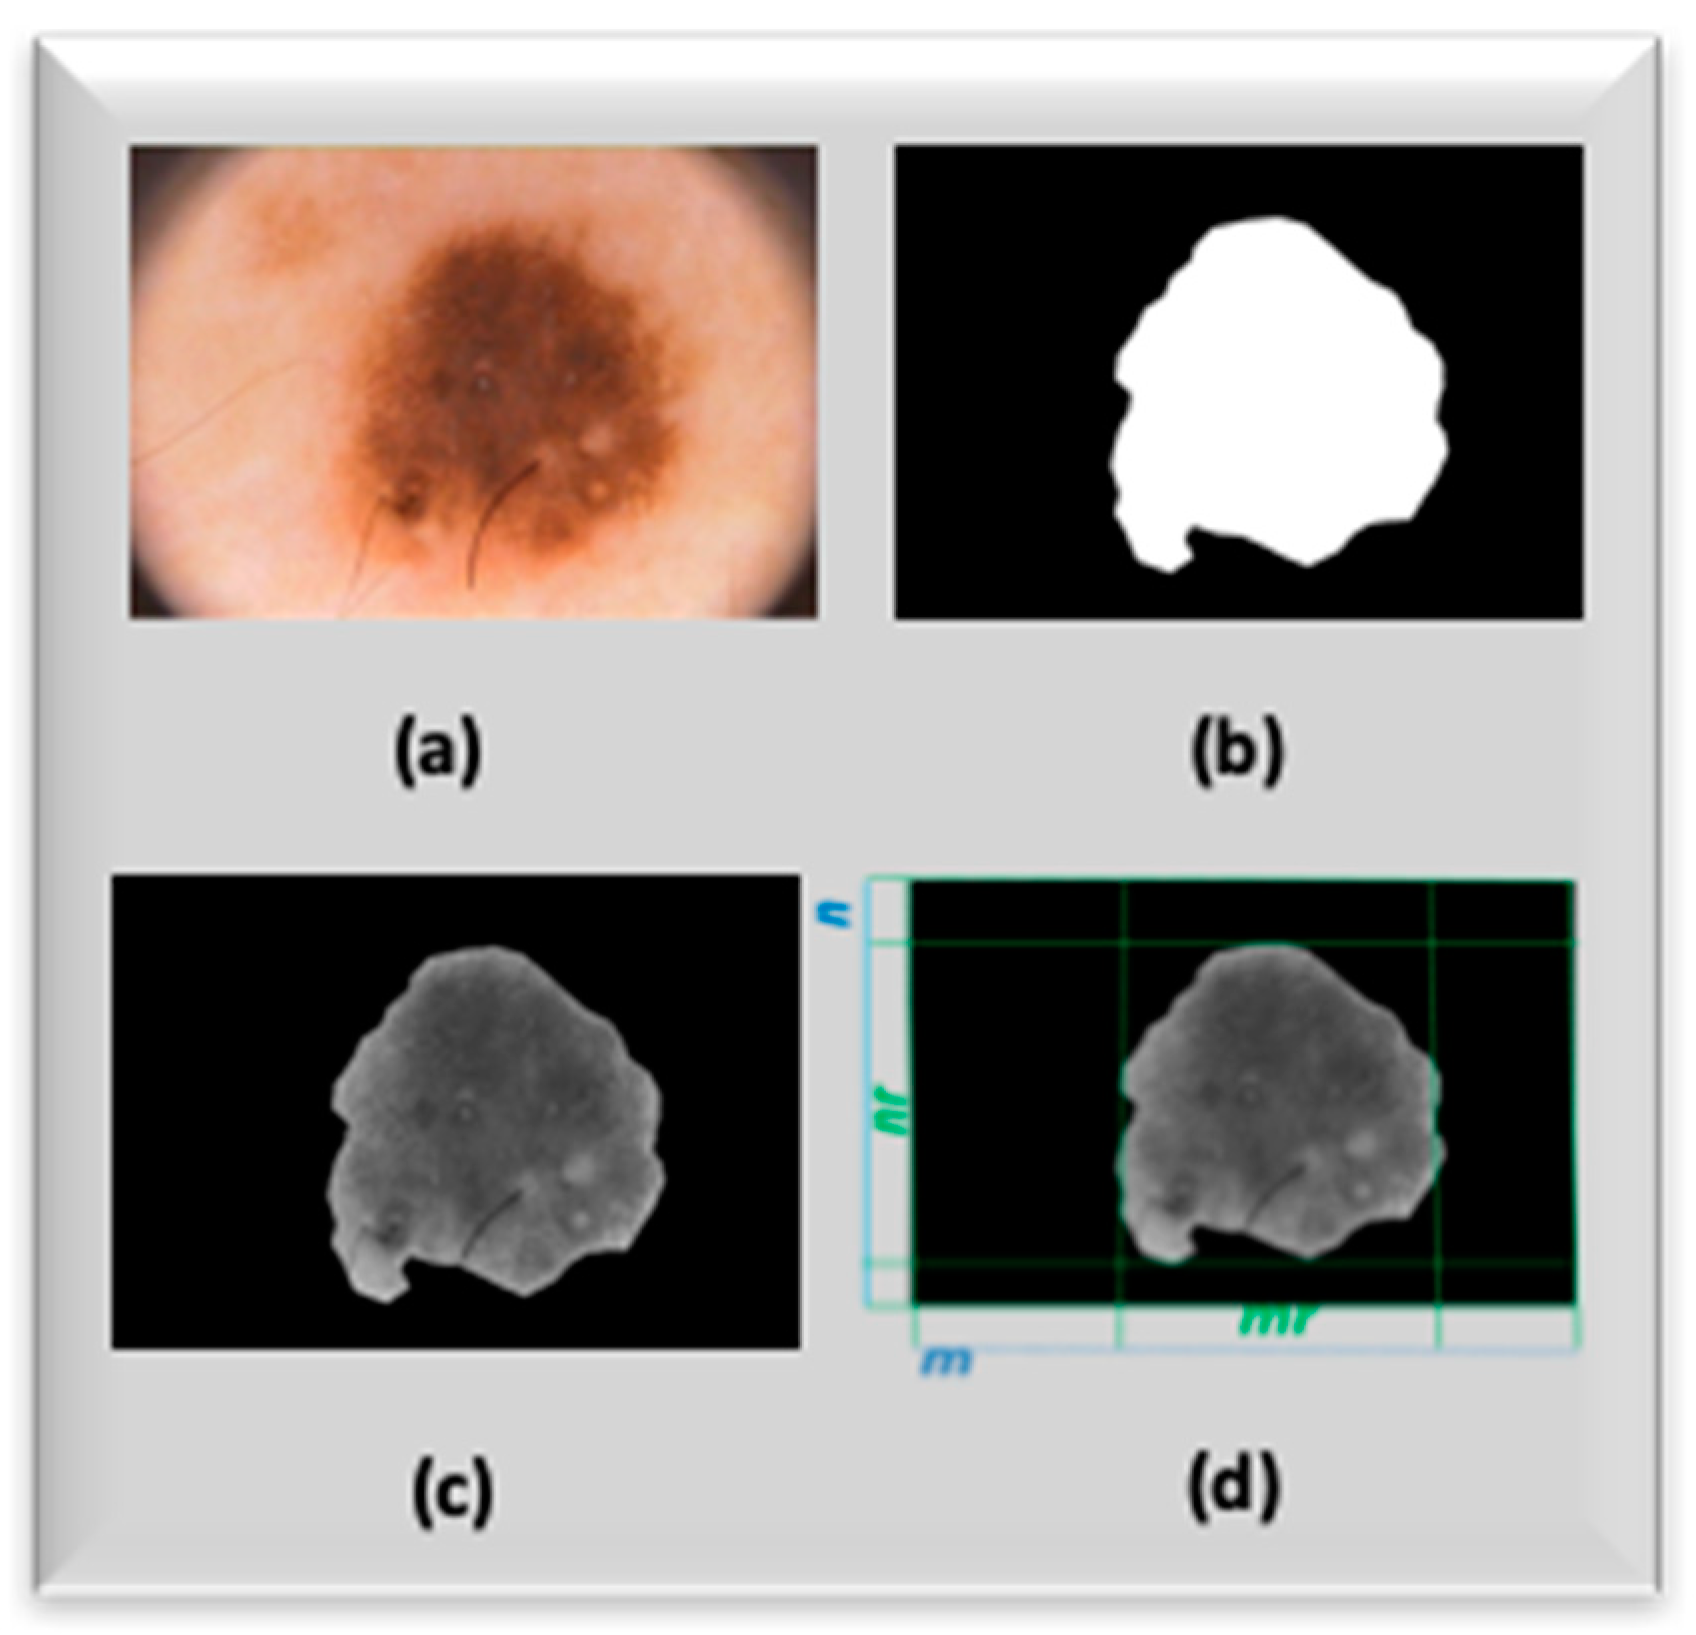
Figure 4a–d show the mask and output images related to the SC-CNN pre-processing task.
2.2. Morphological Pattern and SC-CNNs Features Block
The aim of this block is to provide a mathematical representation of the ABCDE rule aforementioned in this paper. The mathematical modeling of the ABCDE heuristic rule is obtained by using a combination of hand-crafted image features with Deep Learning generated features. Preliminarily, the proposed set of hand crafted image features is analyzed. The proposed image features are re-scaled via logarithmic function with the aim to reduce the range of their variability. We propose the main representative subset of the hand-crafted features we developed in our previous pipeline [
3]. We added new features and replaced others, as we have noted that the overal performance of the method was improved. In detail, we added the 7-th order moment (feature
F11) and a modified version of the “cosine similarity” feature (
F16) with respect to the same used in previous work [
3]. We dropped features
F14,
F18–
F21 proposed in the previous version of the pipeline [
3], as they do not bring any improvement in the overall discrimination performance of the algorithm herein described. We proceed in the description of the used features in the shown algorithm by indicating with
nr and
mr the dimension of the bounding box enclosing the ROI (
Figure 4d), respectively, while
p(
i,
j) represents the gray-level intensity of each pre-processed image pixel:
The following
Figure 5 shows the contribution of the hand-crafted feature
F12 for the right characterization of melanocyte distribution over the skin epidermis as well as “ad-hoc” measure of nevus area/dermoscopy area ratio (fixed input dermo-image size):
The following
Figure 6 shows the contribution of the hand-crafted feature
F16 for the right characterization of “similarity and symmetry” of the skin lesion i.e., weighted average measure of nevus asymmetry (“A” of the ABCDE rule) with specific weights for border part of nevus; specific weighted average measure of symmetry ratio between the borders and nevus core and, finally, specific weighted measure of symmetry distribution of the near pixels of nevus segmented dermo-image:
As said, the feature F1 to F6 are classical statistical features suitable to characterize melanocyte distribution in terms of a statistical process. The features F7 to F15 are a modified version of statistical moments, such that they are useful to characterize the dynamic evolution (borders, radius, colour and asimmetry) of the nevus. The feature F16 is a modified version of the so-called “cosine similarity”, used to analyze the intrinsic similarity and symmetry of the nevus, while the feature F15 is a modified advanced version of the “Jarque-Bera index”, which is able to point-out kurtosis and skewness of time-series and is often applied in the field of financial markets. In the proposed work, we adapted the Jarque-Bera index to 2D image analysis with regards to the kurtosis and skewness features for the analyzed pre-processed dermoscopic image. We used k = 9 in Equation (16).
In order to improve the performance of the previous version of the proposed pipeline, the authors analyzed features obtained by means of a modified version of SC-CNNs i.e., the so-called NonLinear SC-CNNs (NLSC-CNNs). Formally, an NLSC-CNNs can be mathematically represented as follows:
A nonlinear template
D(
i,
j;
k,
l) has been added to the model reported in Equation (1) in order to exploit the nonlinearity relationship between the outputs of single cell with its neighborhood. The NLSC-CNNs allow to characterize the dependence between the output of the single cell with those of the cells belonging to its neighborhood. In this way, it was possible to highlight the dynamic correlation between the processing of individual pixel that contain, as mentioned, groups of melanocytic cells. In this way, through the designed NLSC-CNNs, we can study the morphological dynamics of melanocytic cells (output of the single cell of the NLSC-CNNs architecture) for each type of processing defined by the designed cloning template. This result would not have been possible with the CNNs model proposed by Chua and Yang nor with that defined by classic SC-CNNs, where the dependence between the cell outputs with those of its neighborhood is not directly explained. The NLSC-CNN architecture has been used for several applications, including video and image processing [
14,
15,
16]. The authors have analyzed the target of robust skin lesion discrimination and, after several optimization tests, designed the following further deep learned features:
At the end of the described analysis, we collected 16 hand-crafted features that we arranged in a 32 × 32 matrix by means of a bi-cubic resizing algorithm [
12] as well as six deep learned features generated by the NLS-CNNs properly configured.
In the following
Figure 7, the authors report some of the generated features:
2.3. The Deep Learning Classification Block
The goal of this block is the proper classification of features previously described in order to oncologically discriminate the analyzed skin lesion. Specifically, the objective of this part of the proposed pipeline is to discriminate skin lesions—benign (i.e., with a low risk of oncological progression) as compared to malignant (i.e., with a high risk of malign progression).
On the basis of this lesion discrimination and in agreement with the attending physician, the algorithm will provide a follow-up rate for the patient.
In this work, the authors tried to further improve the performance of the previous version of the pipeline [
1,
2,
3] by using Deep Convolutional Neural Network (ConvNN) architecture for further processing of image features coming from previous blocks. The next sections will explain the structure of the Deep ConvNN that we propose in this work:
Input Layers 32 × 32 × 1
Convolution Layer (kernels 3 × 3 × 1, 8-filters, Padding)
Gradient Normalization Layer
ReLU Layer
MaxPooling Layer (2 × 2)
Convolution Layer (kernels 3 × 3 × 1, 16-filters, Padding)
ReLU Layer
MaxPooling Layer (2 × 2)
Convolution Layer (kernels 3 × 3 × 1, 32-filters, Padding)
ReLU Layer
The proposed pipeline is shown in the following figure:
In
Figure 8 the proposed Deep Convolutional Neural Network (ConvNN) architecture is reported. As noticed from the input layer description, the input size is 32 × 32. Consequently, we resized each dermoscopic image of the analyzed nevi (included in the PH
2 dataset) to a size of 32 × 32; therefore, the 2D structure of the used NLSC-CNNs will be composed of 32 × 32 cells having dynamics defined by the cloning templates described in Equations (20)–(25). Furthermore, the described 16 hand-crafted image features had previously been arranged in a 32 × 32 size pattern, becoming in fact a sort of “morphologic pattern” suitable for identifying each of the analyzed ones. All the described resizing was done using a classical bi-cubic algorithm [
12]. In the following paragraphs, each layer of ConvNNs is described:
Input Layer: These numbers correspond to the height, width, and channel size. As said, the input data (CNNs processed features) consists of grayscale images, so channel size (color channel) is one.
Convolutional Layer: In the convolutional layer, the first argument is filter size, which is the height and width of the kernel filters the training function uses while scanning the CNNs lesion features images. In this case, the number 3 indicates that we have used a filter size of 3-by-3. The second argument is the number of filters, which is the number of neurons that connect to the same region of the input. This parameter determines the dimension of the so-called “feature maps” generated by the ConvNNs.
ReLU Layer: The convolutional layer is followed by a nonlinear activation function. We decided to use the most common activation function i.e., the rectified linear unit (ReLU).
Max Pooling Layer: In the Deep ConvNN paradigm, the convolutional layers (with activation functions) are sometimes followed by a down-sampling operation that reduces the spatial size of the feature map and removes redundant spatial information. The max pooling layer returns the maximum values of rectangular regions of feature input image coming from the previous layer.
The proposed pipeline performs deep learning of the skin lesion image features that come from the previous block and at the end the learned features will be fed into further layers that are part of the overall skin lesion discrimination system, as described:
The following paragraphs describe the above layers:
Fully Connected Layer: This layer combines all the features learned by the previous layers across the image to identify larger patterns. The last fully connected layer combines the features to classify the images. In this case, in the last fully connected layer, we defined the number of classes in the target data i.e., two, as described in the previous section (benign nevus versus malignant ones).
Softmax Layer: The output of the softmax layer consists of positive numbers that sum up to one, which can then be used as classification probabilities by the classification layer.
Classification Layer: The final layer is the classification layer. This layer uses the probabilities returned by the softmax activation function for each input to assign the input to one of the mutually exclusive classes and compute loss and performance indexes. The classification output is further processed by the Autonomous Diagnosis System, which suggests a “follow-up rate” according to the detected oncological risk to be agreed with the attending physician. Specifically, the system will suggest prompt contact with the attending physician if it classifies the analyzed nevus at high risk of malignancy or will suggest a follow-up rate of more than six months if it considers that the analyzed skin lesion is at low risk of oncological progression. Obviously, the physician will be able to decide the follow-up rate on the basis of appropriate medical assessments, which are in fact based on the preventive evaluation performed by the algorithm.
3. Results
The proposed method has been trained and tested by using classified skin lesion images included in a database called “PH
2” [
4]. The PH
2 database consists of several dermoscopic images containing benign nevus as well as malignant ones (melanoma) with different morphologic features. The PH
2 dataset has been developed for research purposes and to allow a robust comparison between the methods of discriminative analysis of skin lesions for oncological purposes. The dermoscopic images included in the PH
2 dataset were acquired during daily clinical activity performed at the Dermatology Service of Hospital Pedro Hispano, Matosinhos, Portugal. As reported in the related documentation [
4], the dermoscopic images were acquired through the Tuebinger Mole Analyzer system using a magnification of 20×. The dataset contains 8-bit RGB color images with resolution of 768 × 560 pixels. It includes dermoscopic images of melanocytic lesions, including benign lesions (common, atypical and dysplastic nevus) and several cancerous skin lesions (i.e., melanomas) with different morphologies (diameter, asymmetry, edge regularity, etc.). The PH
2 database includes medical annotation of each reported image. The medical diagnosis for each reported lesion was performed by an expert dermatologist. The PH
2 dataset was thus properly organized. About 65% of the PH
2 dataset images were used as a training set. In the training set thus composed, dermoscopic images of benign skin lesions with different morphological features (common, atypical and dysplastic nevus) are included. Moreover, several dermoscopic images of cancerous lesions (melanomas) have been included in the training set but with different characteristics (diameter, edges, regularity of the contours, etc.). Therefore, the used training set consists of about 130 8-bit RGB dermoscopic images of benign and malignant lesions. In this way, we tried to increase the generalization capability of the proposed deep learning system. The remaining set of images (35%) of the PH
2 dataset (also composed of images of benign lesions and melanomas) were used for the testing and validation of the proposed pipeline. In order to provide a robust and efficient benchmarking of the proposed approach, we decided to include a comparison with several similar pipelines validated on the same PH
2 database. In order to perform a fair comparison of the proposed method with respect to other approaches, we evaluated our approach by computing the same benchmark indicators as computed in the compared methods [
4]. Specifically, we computed the ‘sensibility’ indicator as well ‘specificity’ and cost function ‘
C’, which can be computed as reported in the following equation:
The parameter
C includes the term
C10 as the weight coefficient of wrong classification (the pipeline classifies “malignant” or high risk a skin lesion, which actually is benign i.e., a false negative FN), while
C01 represents the weight coefficient for a False Positive (FP) wrong classification (the pipeline classifies “benign” or low-risk a nevus, which actually is malignant or high-risk). From a simple mathematical analysis of the model used for computing
C, it is clear that the system considers a False Positive more dangerous with respect to a False Negative for reasons that appear to be easily understandable, because they are linked to the extremely high danger of failure to report a malignant lesion, rather than a wrong classification of benign lesion, which could lead to closer controls and nothing more.
Table 1 reports performance benchmark comparison with respect to several approaches applied to the same PH
2 database [
17,
18]. In
Table 2, further performance indicators related to the proposed approach are reported.
In
Table 3, the authors reported analyzed skin lesions and related classification made by the proposed pipeline.
In
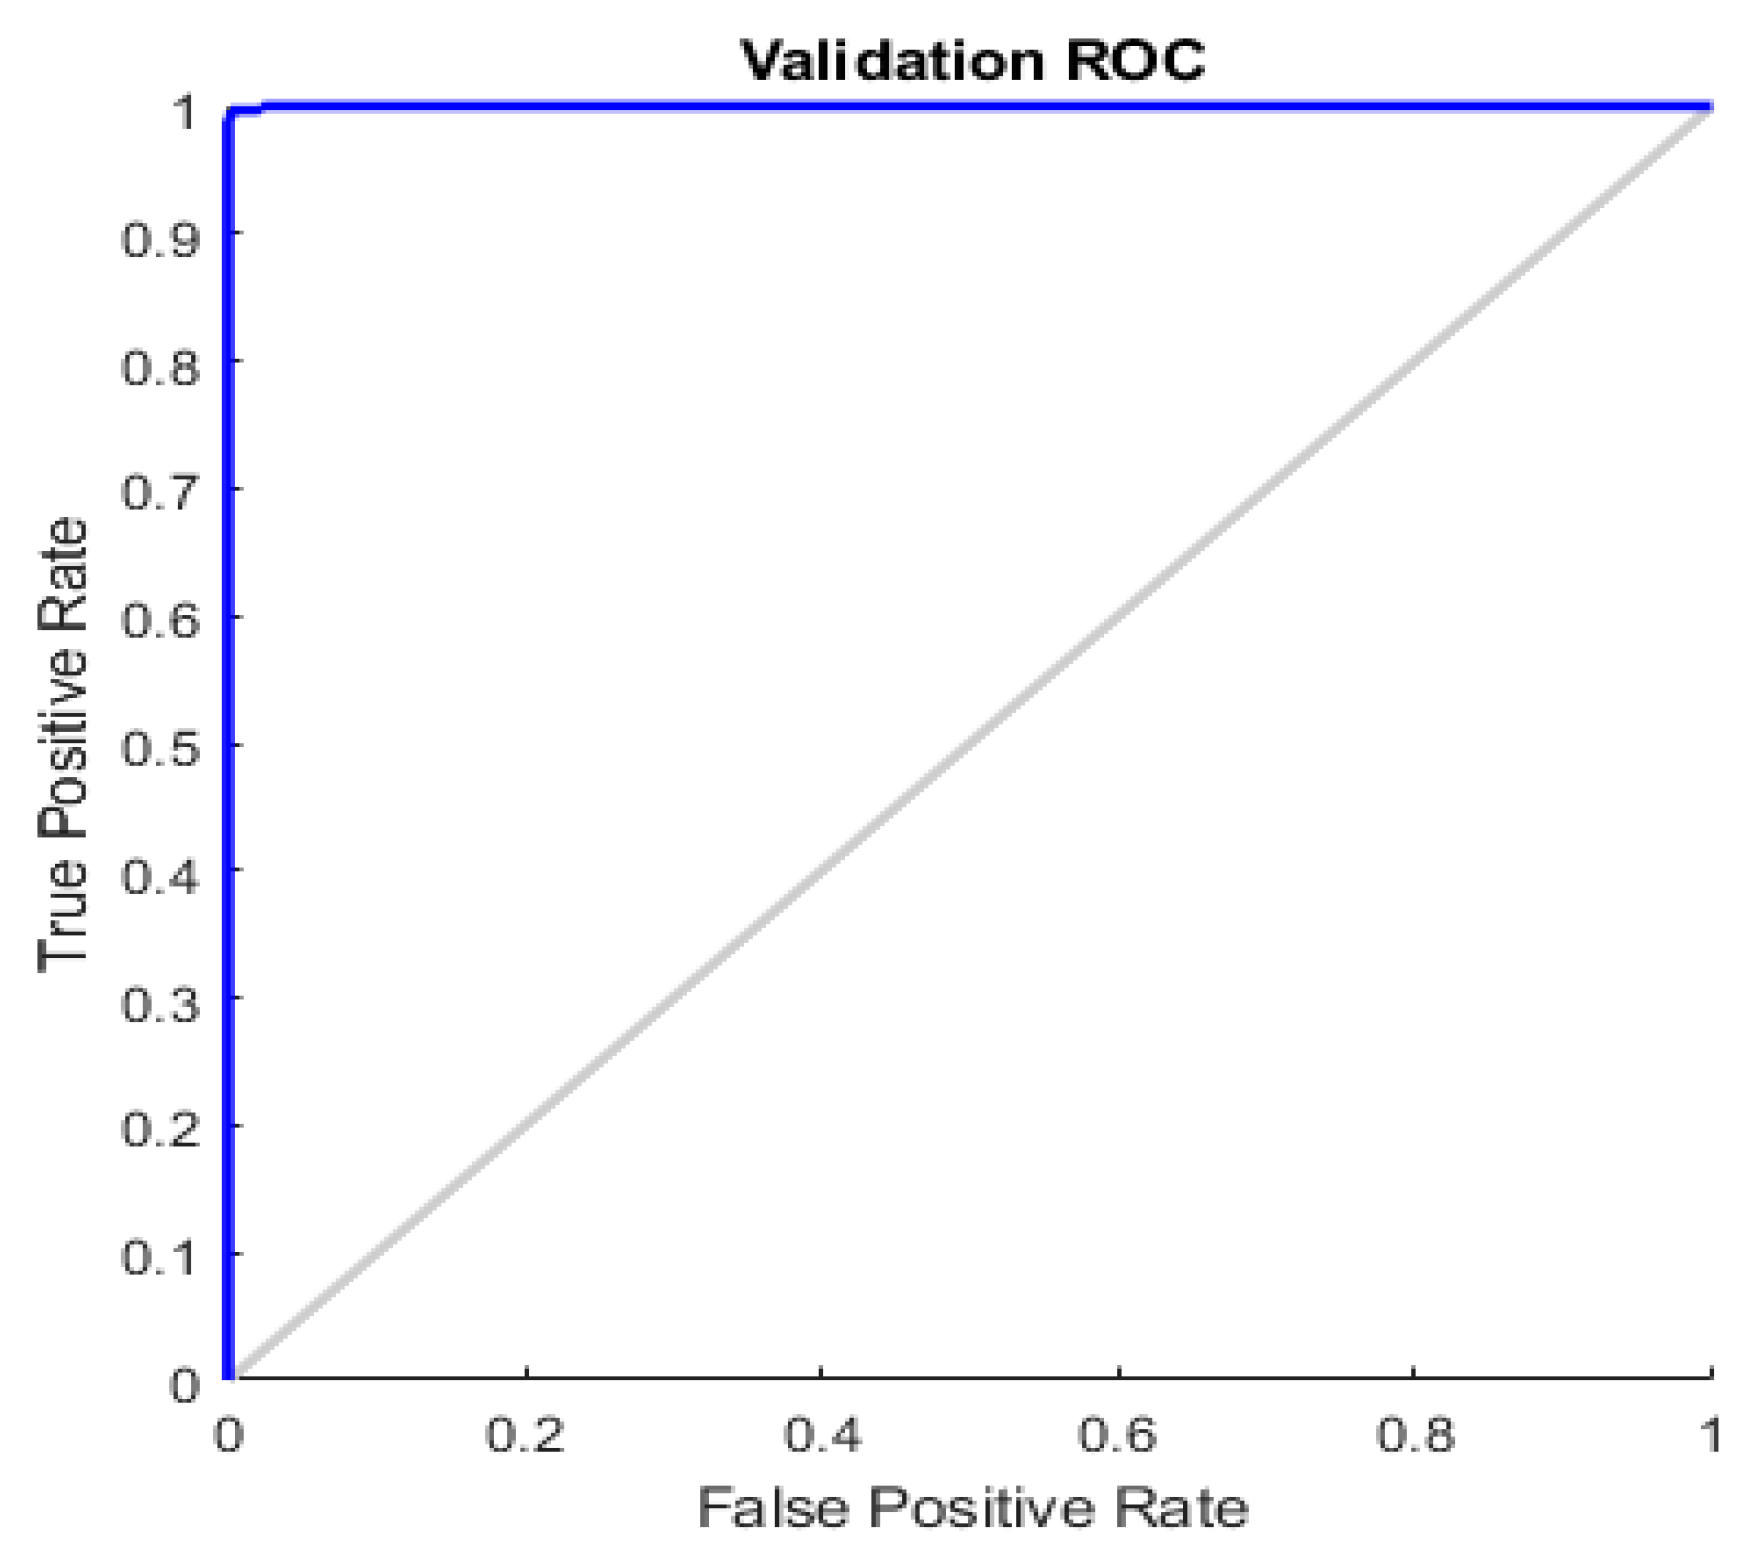
Table 2, we reported further performance measure indicators, specifically, the accuracy index of the overall pipeline as well as the F1-score (also known as F-measure) [
19]. Moreover, we showcased the ROC diagram in
Figure 9.
Both from the analysis of the ROC reported in
Figure 9 and the common performance indices (Sensitivity, Specificity, F1-score and Accuracy) reported in
Table 1 and
Table 2, it is evident that the proposed method has remarkable capabilities of identification (sensitivity) and discrimination (specificity) of skin lesions. With accuracy close to 100%, the proposed pipeline was able to identify skin lesions at high risk of malignancy, thus allowing the dermatologist/oncologist to promptly schedule treatment. It is possible to verify this by analyzing the malignant lesions present in the PH
2 dataset (used for the training and testing of the proposed method); there are dermoscopic images of cancerous lesions at the limit of the indications in the mentioned ABCDE criterion, which can escape visual inspection by expert physicians (we refer to cases of melanoma with a small diameter or edges not completely irregular). The proposed pipeline was also able to correctly identify malignant lesions, highlighting to the physician the high risk of the nevus, as well as suggesting a follow-up rate. Moreover, in order to avoid unnecessary biopsies, a lot of work has also been done on the discriminative capacity (specificity) of the proposed pipeline. Even in the case of dysplastic or atypical nevus (included both in the training set and in the set of dermoscopic images used for testing/validation) the proposed algorithm was able to correctly characterize the benignity of the lesion by appropriately evaluating the similarity features of the analyzed lesion (thanks to the designed hand-crafted features). The use of the features generated by the convolution system has allowed to significantly improve the specificity of the pipeline proposed compared to the previous versions, as the used ConvNN allowed to extract latent features otherwise not detectable by the classic techniques based on hand-crafted features, which allowed the classifier to properly separate the two classes of skin lesions (benign versus malignant).
4. Discussion and Conclusions
A simple comparison between benchmark results of the methods reported in
Table 1 and
Table 2 shows promising performance of the herein reported method with respect to other similar pipelines, also including the previous version of the same pipeline [
1,
2,
3]. An innovative combination between re-designed hand-crafted lesion image features with further features generated by the NLSC-CNNs system and innovative Deep Convolutional Neural Network framework considerably improves the overall discrimination performance of the system. As reported in
Table 1, it is clear that several approaches proposed in scientific literature increase sensitivity of the pipelines to the disadvantage of ‘specificity’ or vice versa. Unfortunately, a major drawback of poor skin lesion discrimination specificity is more nevus biopsy for patients. The proposed approach tries to achieve an excellent trade-off between sensitivity and specificity, thus offering the physician a practical tool that can be used in everyday medical practice. The development of the proposed approach as well as training and validation over the PH
2 database was made in MATLAB 2018b full toolboxes environment with ad-hoc NLSC-Cellular Neural Network functions library. The time performance of the proposed method is acceptable, as the proposed pipeline is able to analyze a single nevus in about 2.5/3 s (we tested the pipeline in a PC Intel Core having 12 Cores 64 Gbyte of RAM and a GPU Nvidia GTX 2030). The proposed pipeline is currently being ported from a MATLAB environment to an embedded platform based on STM32 [
19]. We are extending the skin lesions image dataset in order to better validate the discrimination performance of the proposed approach. Moreover, we have been studying the use of physiological signals acquired in the area of the skin lesion to extract ad-hoc dynamic features to be used for nevus classification [
20,
21,
22,
23,
24,
25] as well as an ad-hoc chemotherapy approach, driven by features detected trough the proposed approach [
26]. Specifically, through the innovative approaches used by the authors to characterize physiological signals related to blood-arterial flow activity (including the PhotoPlethysmoGraphic (PPG) signal analysis), we have been analyzing the underlying evolution of skin lesions for early detection of the lymphatic or hematic invasiveness of this lesion because vascular or lymphatic invasion is one of the most discriminating indicators of the malignancy or benignity.
A recent extension of the proposed method is being validated on a larger dataset than the one used in this article, which includes over 10,000 suitably cataloged skin lesions. Specifically, the authors, in addition to using recent deep learning approaches based on convolutive architecture with dilation, are exploiting a particular cross-correlation measure formulated originally by the authors themselves in [
27] and now modified to be applied to discriminative analysis of skin lesions. In a future work, the authors aim to describe the preliminary results they have achieved using this innovative approach.


