Search for Global Maxima in Multimodal Functions by Applying Numerical Optimization Algorithms: A Comparison between Golden Section and Simulated Annealing


Abstract
:1. Introduction
- Standardization of case studies with neural networks (multilayer perceptron). This provides uniformity when evaluating the performance of each algorithm.
- Comparison between two numerical optimization algorithms applied to different evaluation functions that emulate the performance of PV modules for sudden changes in operating conditions.
- Implementation of algorithms in C language in order to facilitate future implementation in microcontrollers.
2. Functions with Multiple Maximums
2.1. Partial Shading of a Photovoltaic Module
2.1.1. Mathematical Model of the PV Module
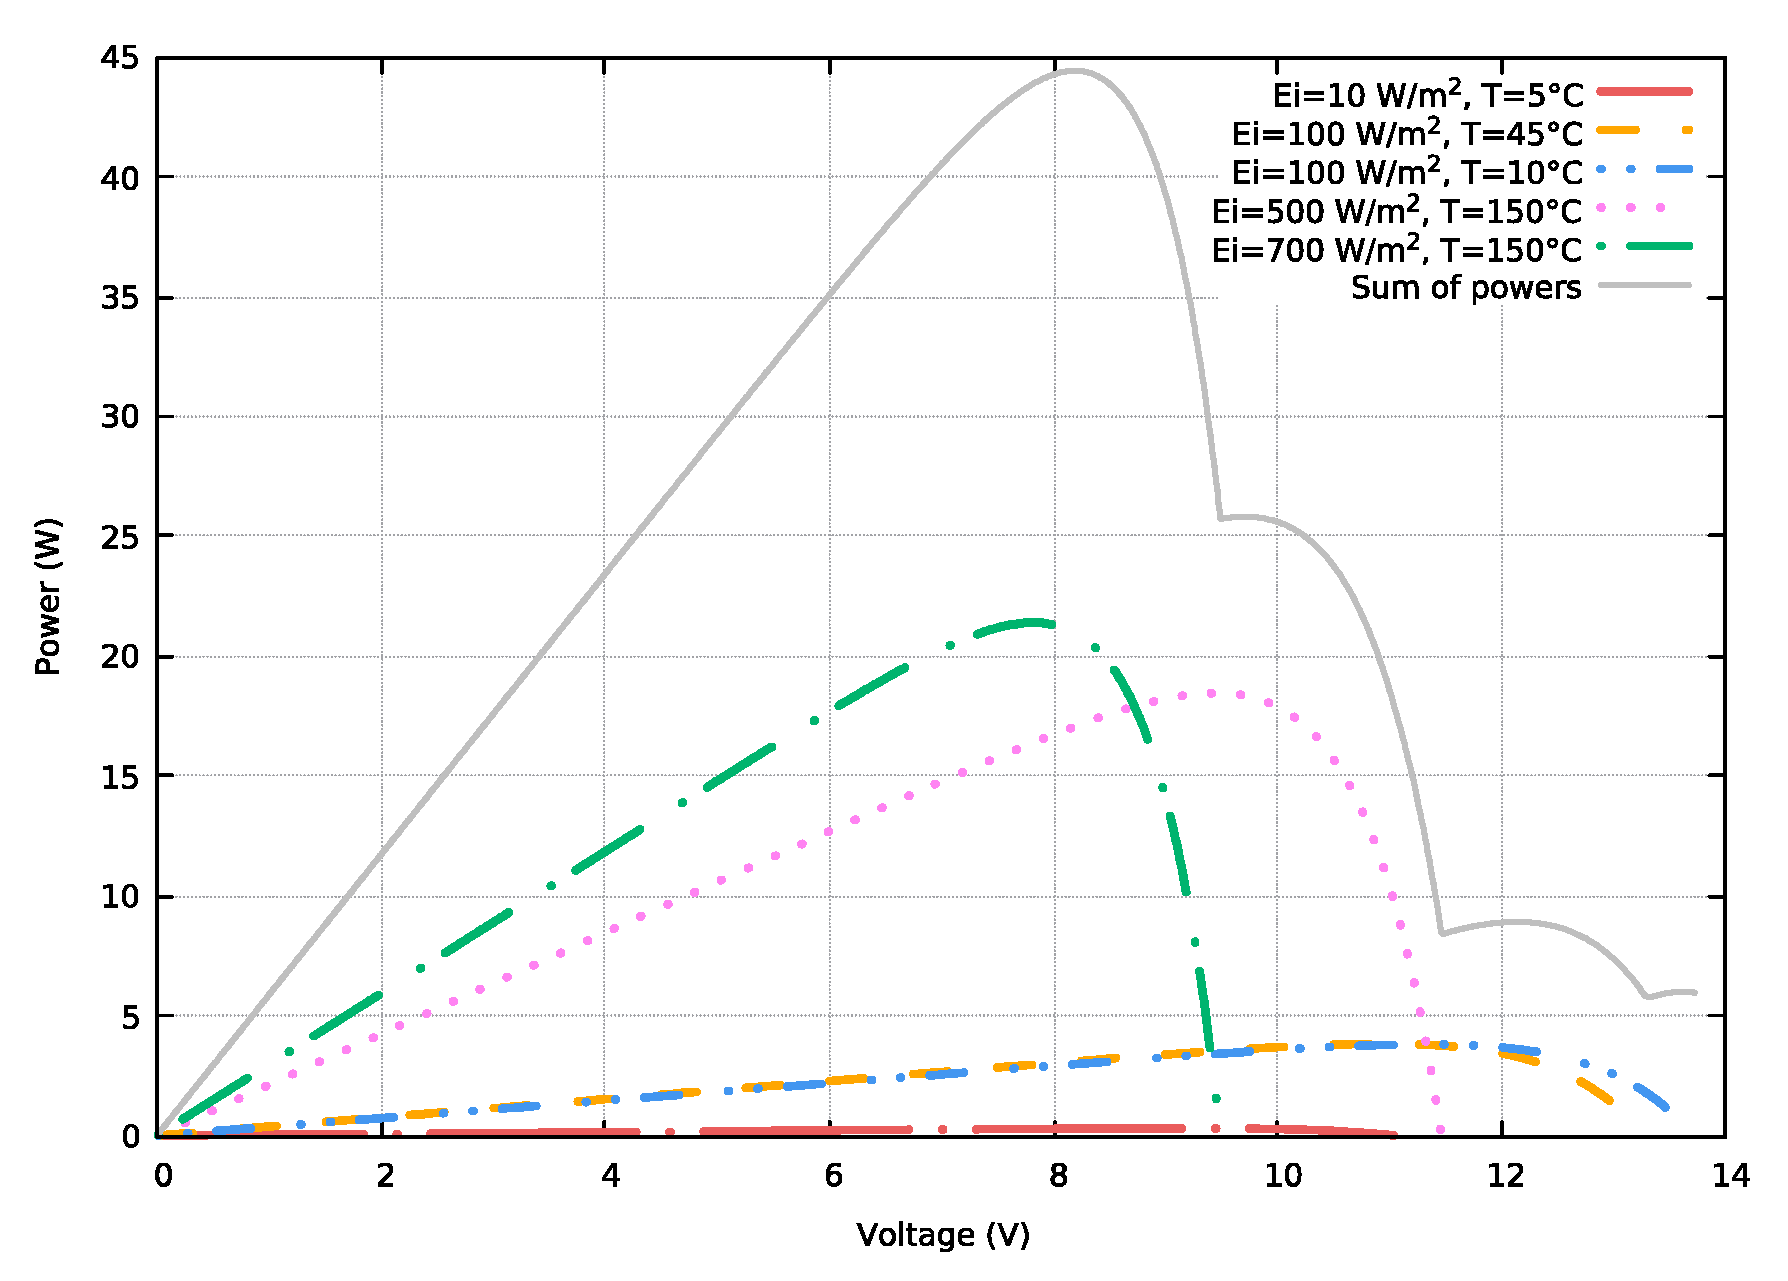
2.1.2. Design of Partial Shading Functions
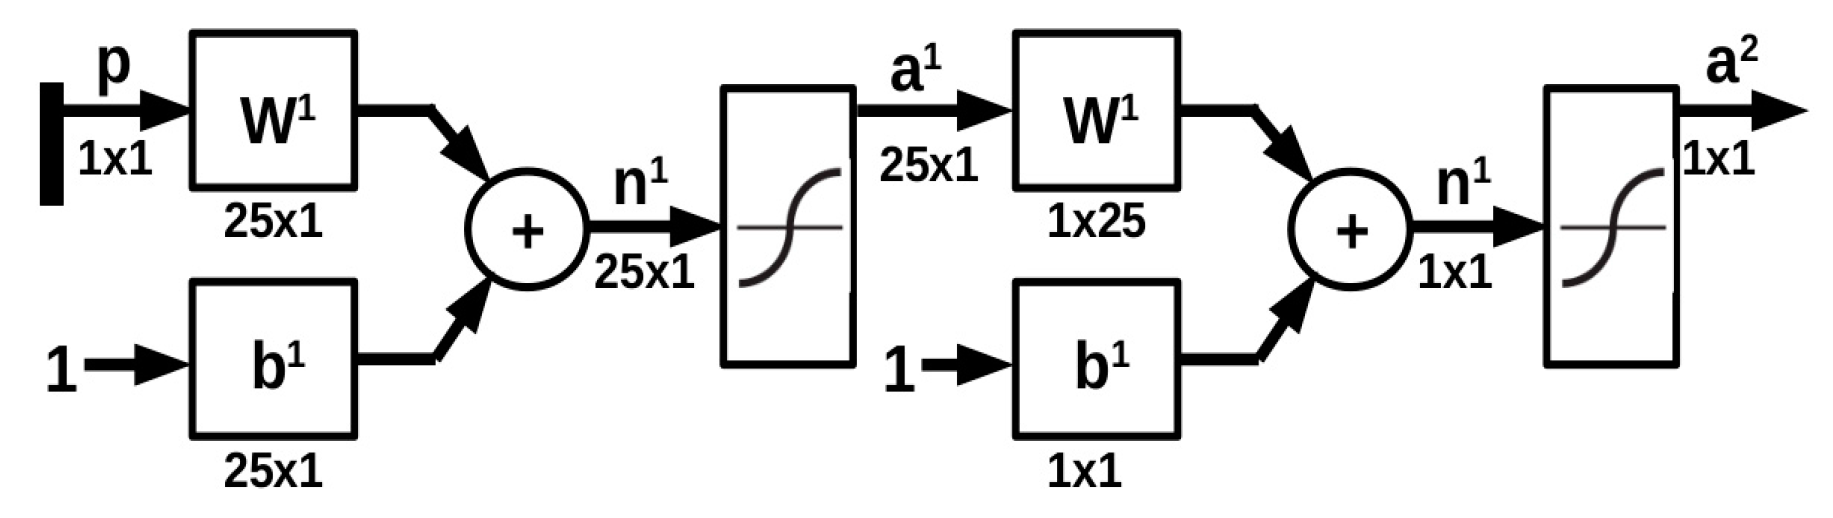
2.1.3. Architecture of the ANN Used for the Approximation
3. Numerical Optimization Algorithms
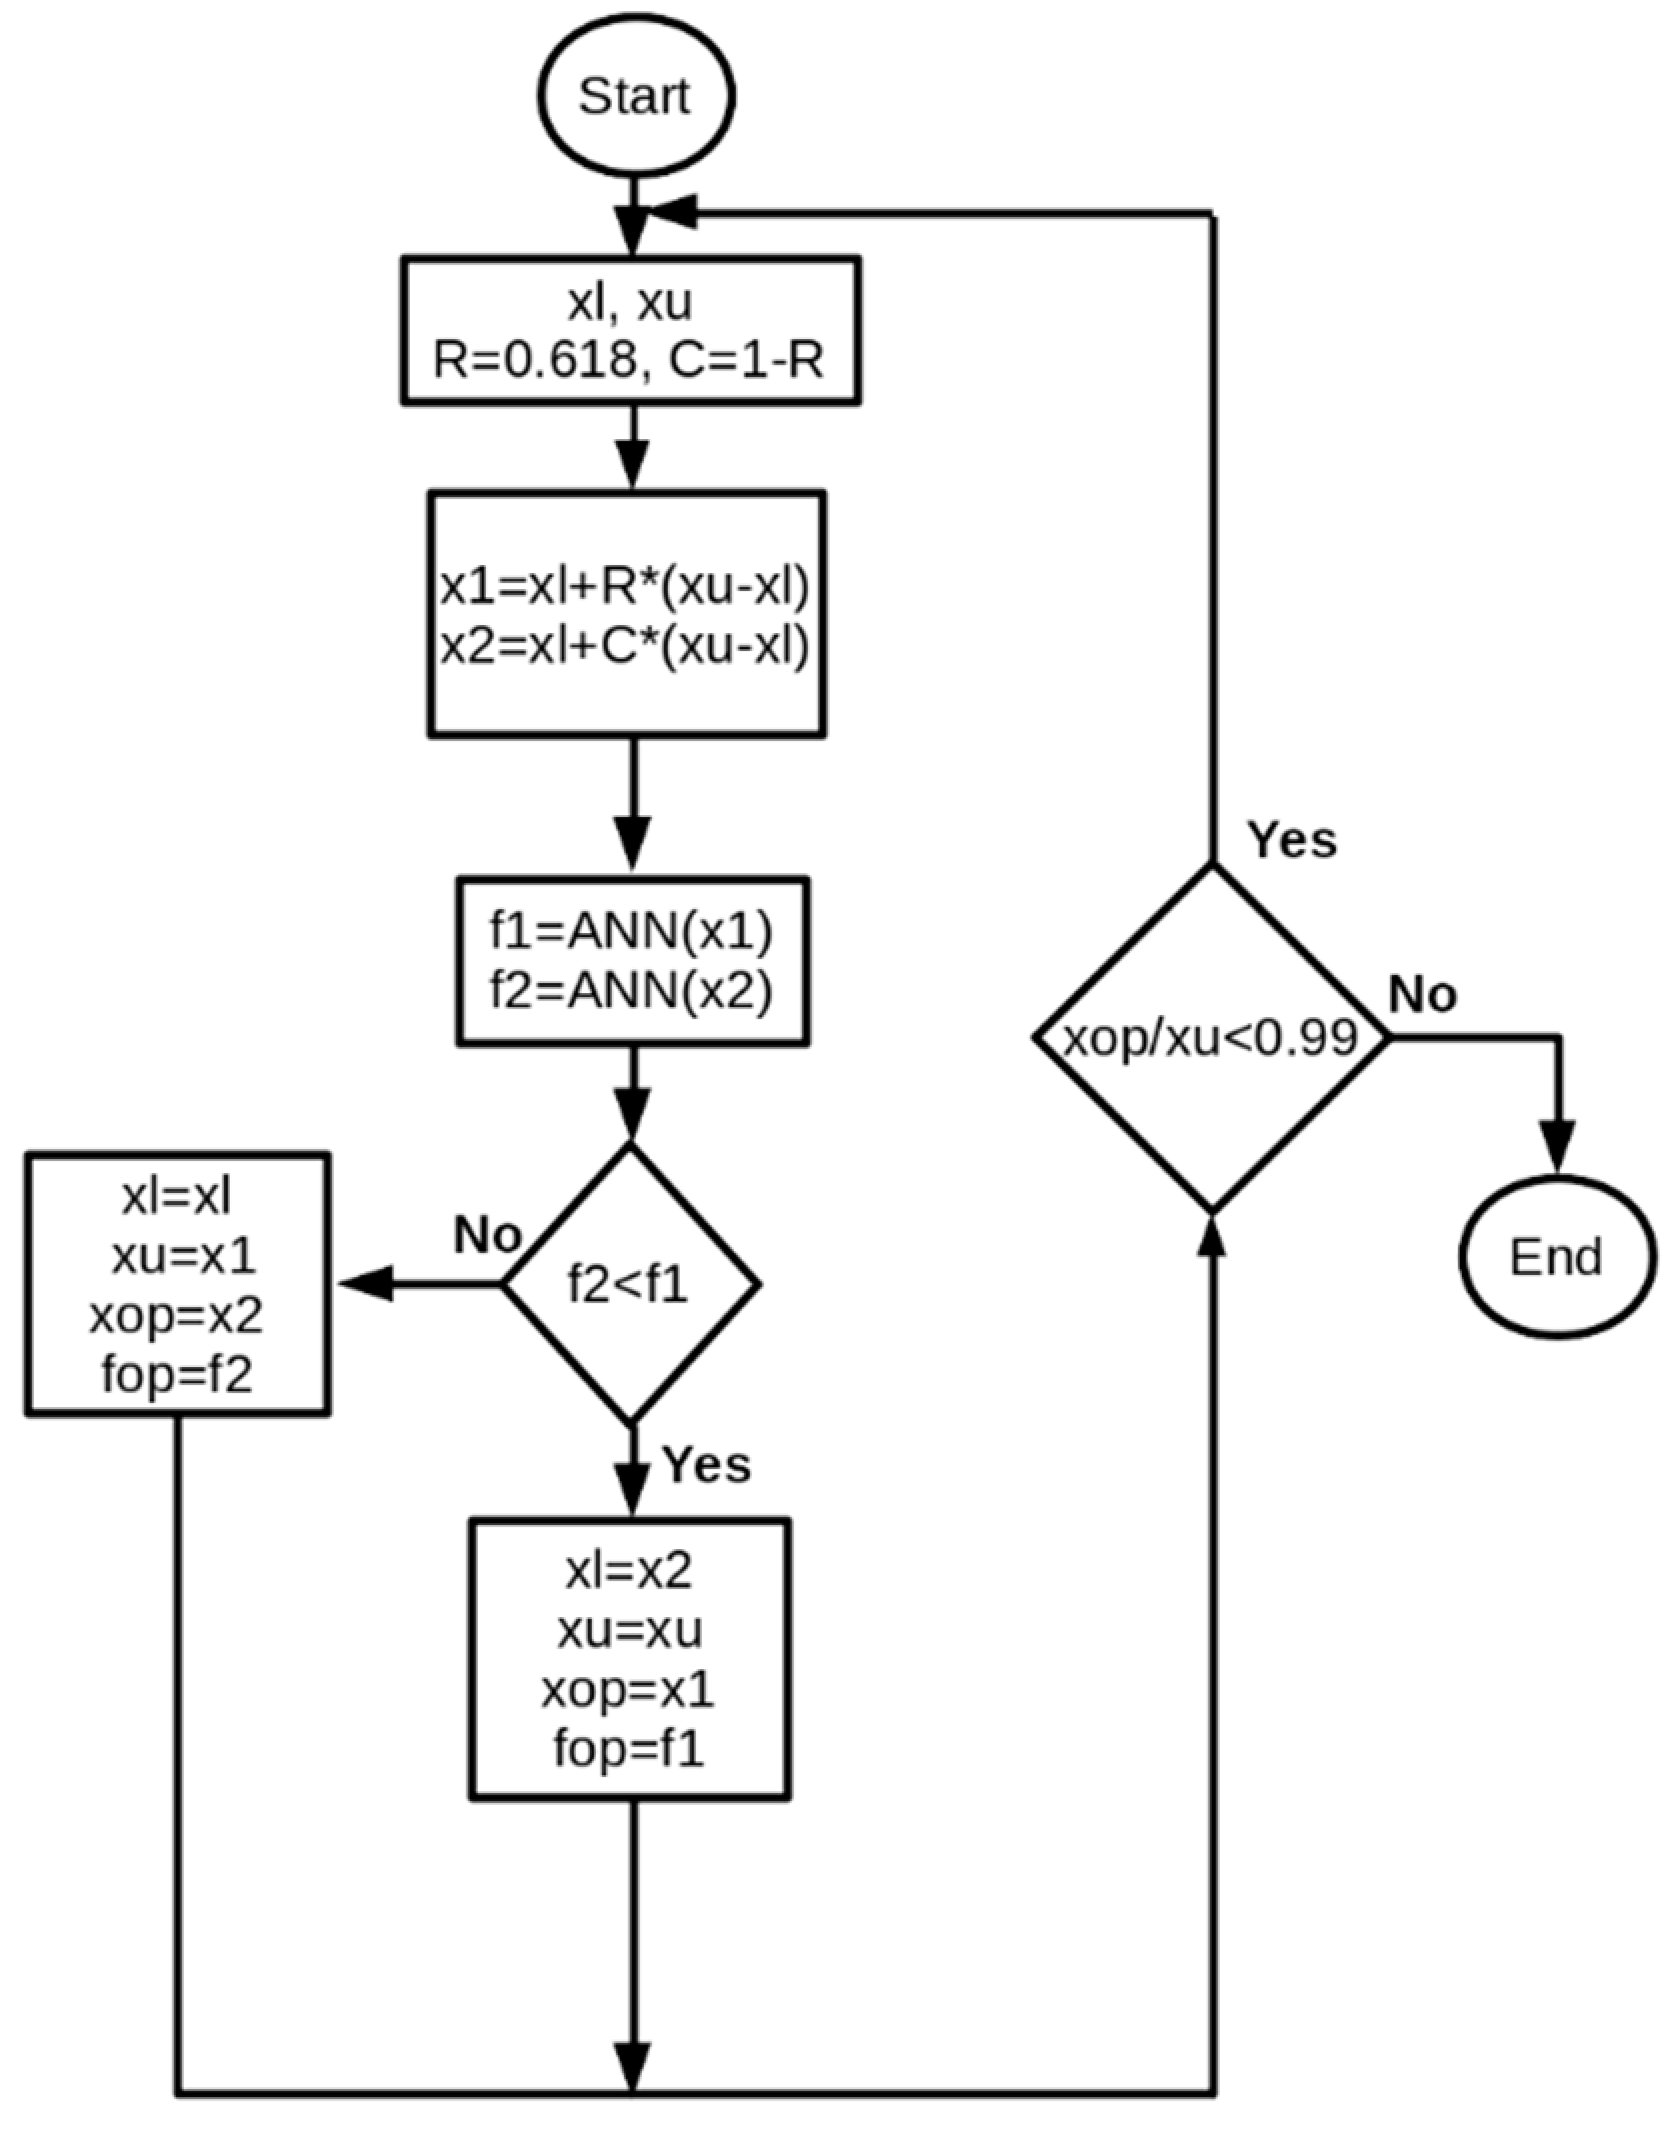
3.1. Golden Section Search Method
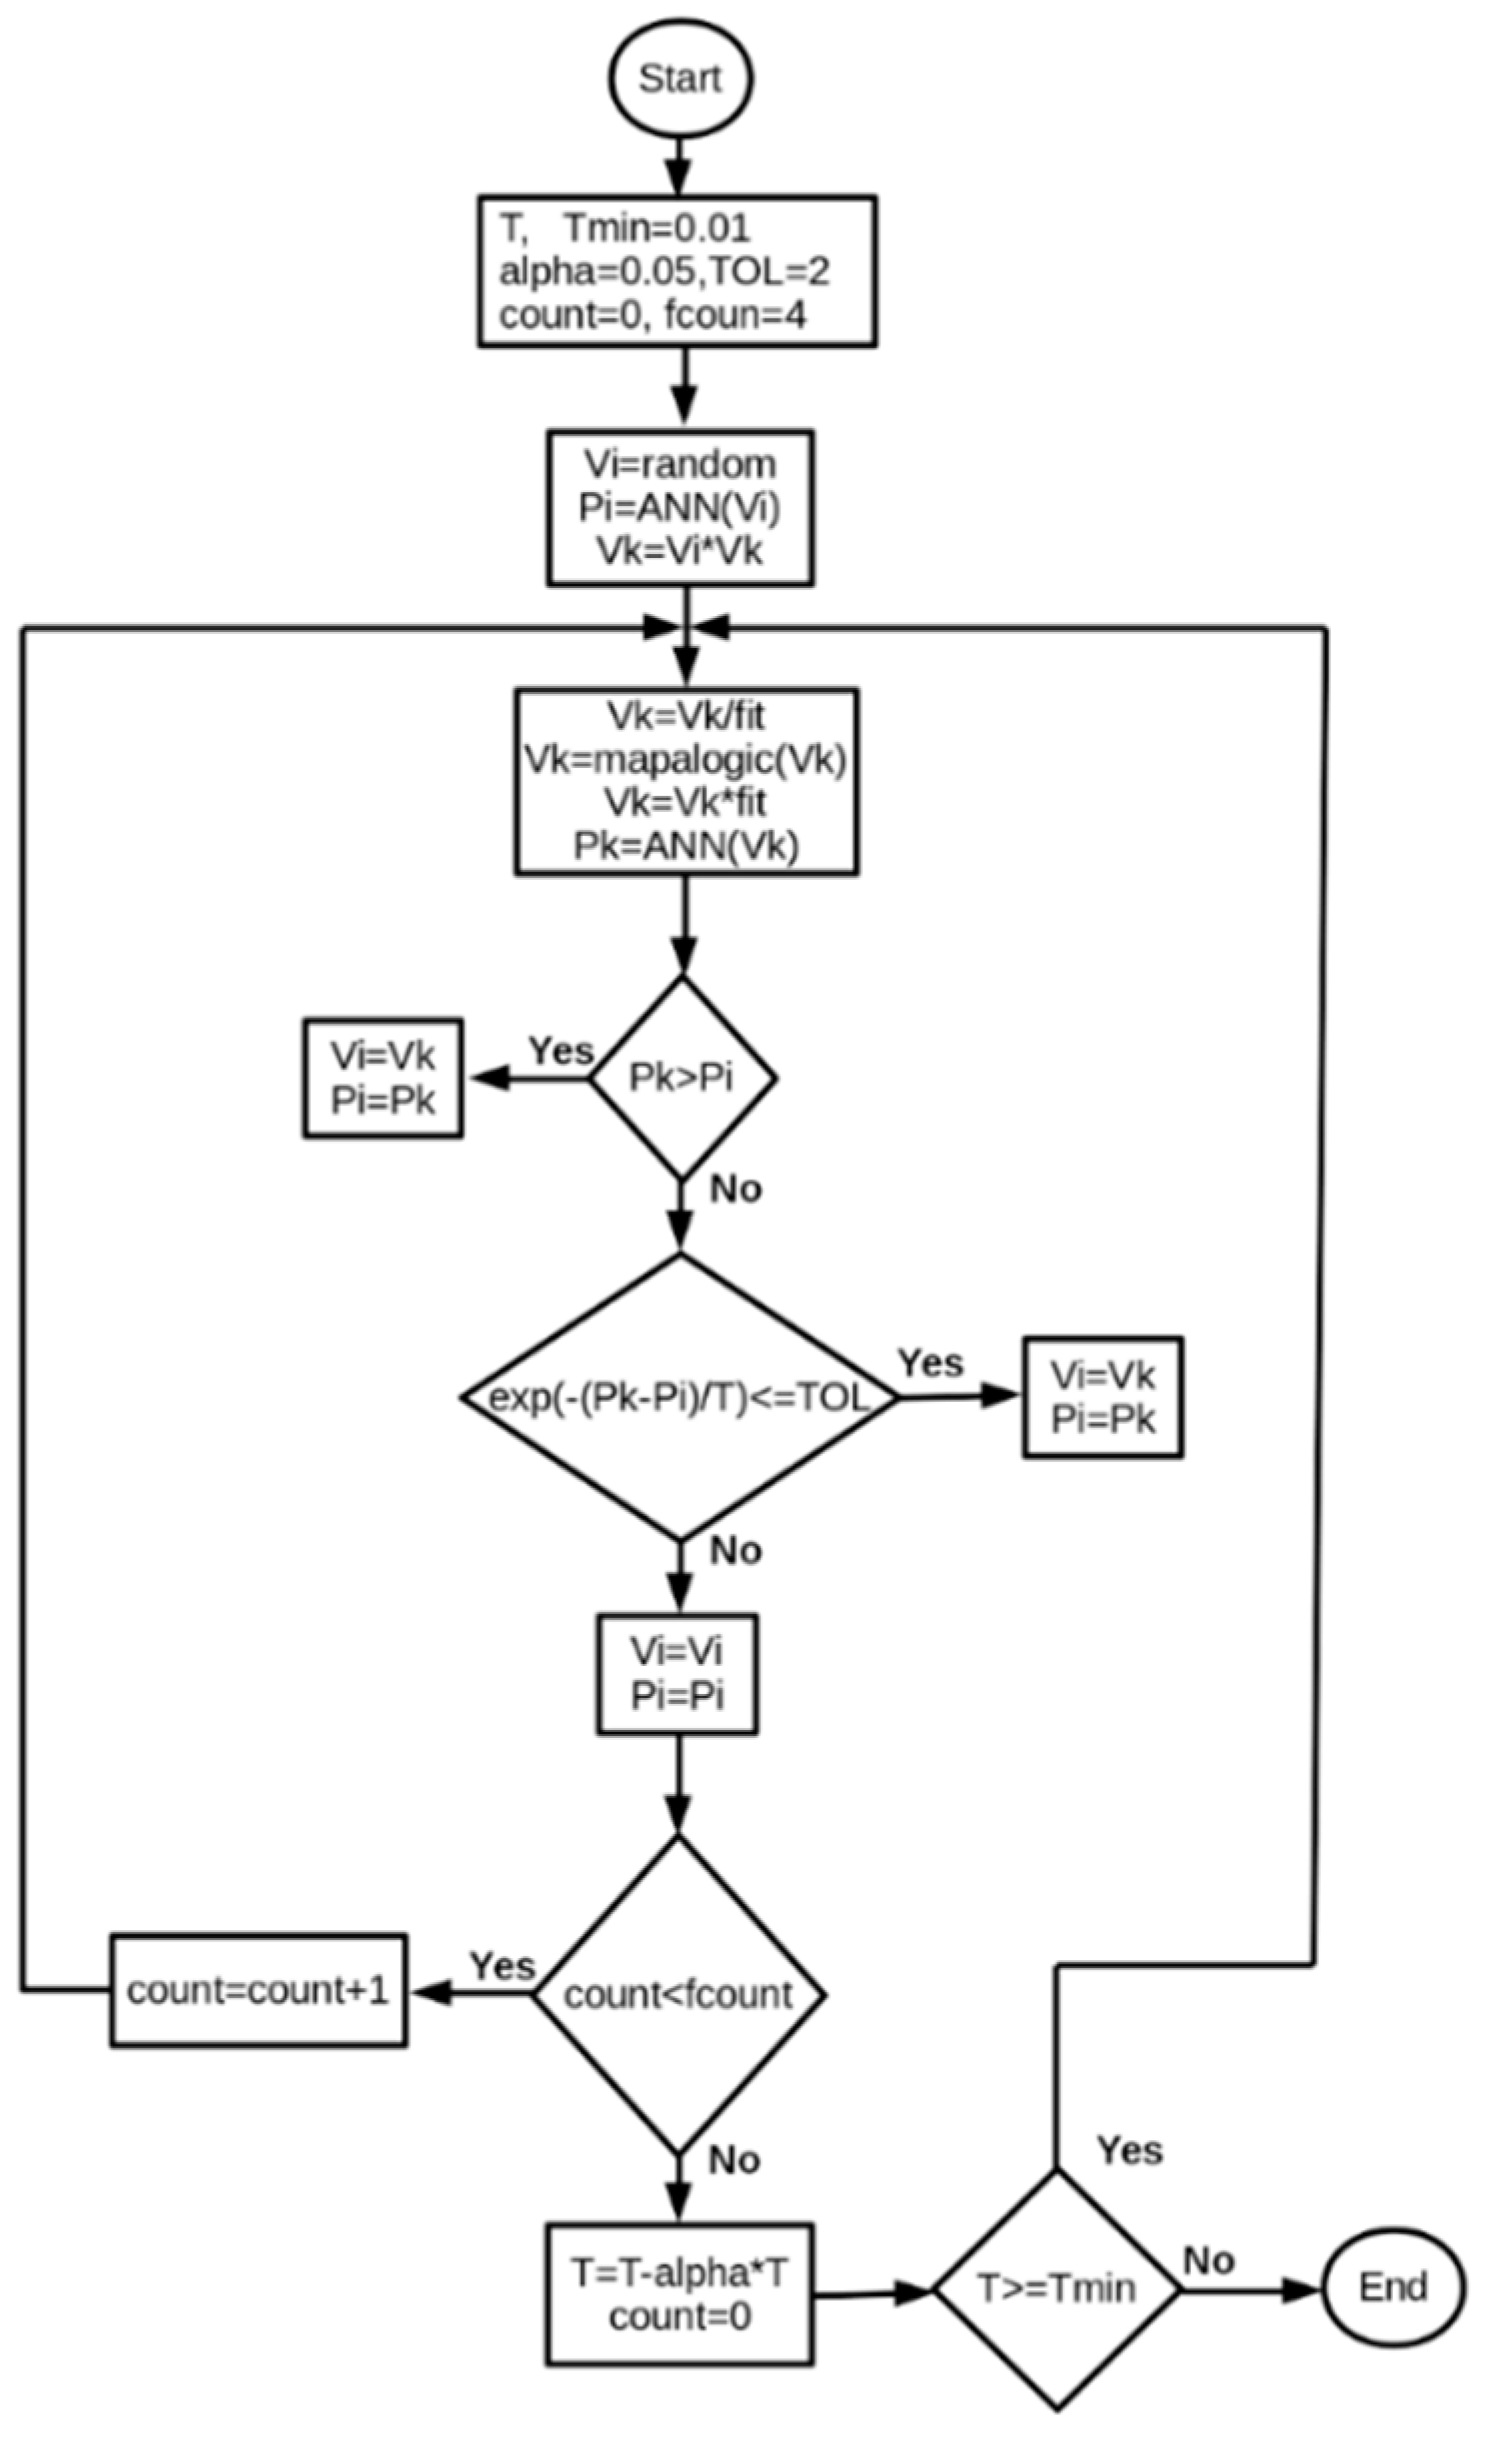
3.2. Simulated Annealing Algorithm
Logistics Map
4. Results and Discussion
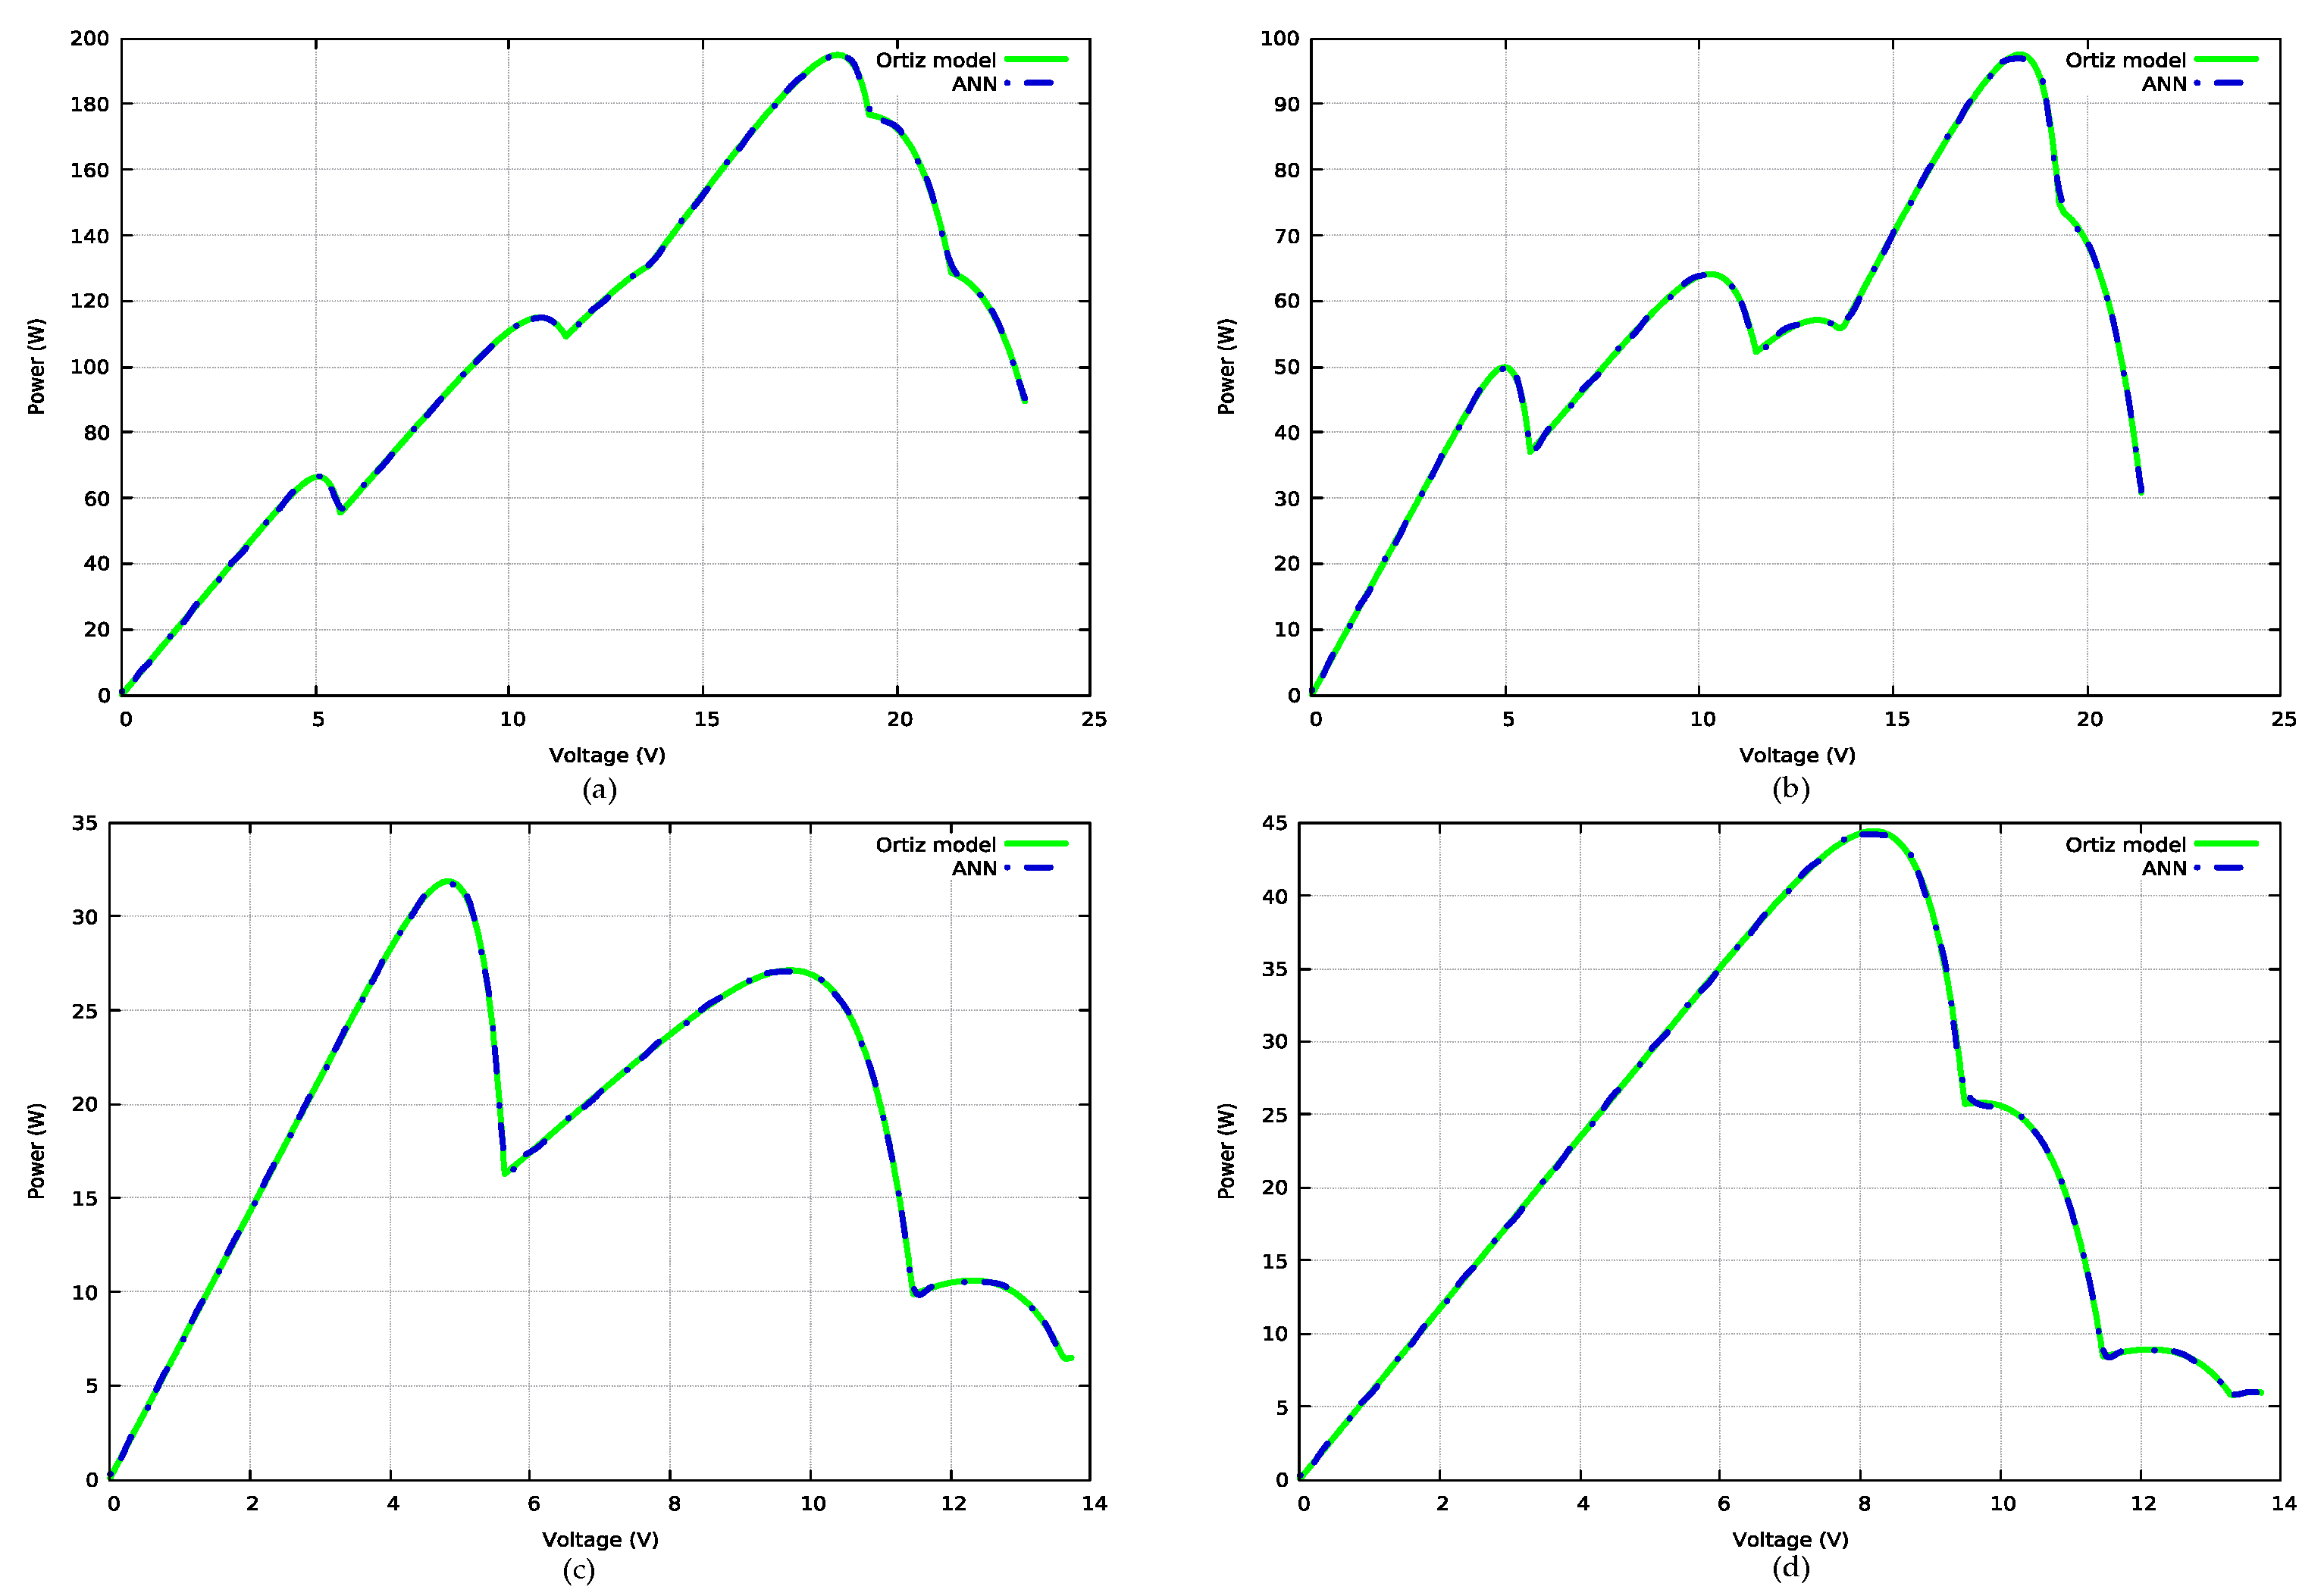
4.1. Approximation of the Test Functions with the Neural Network
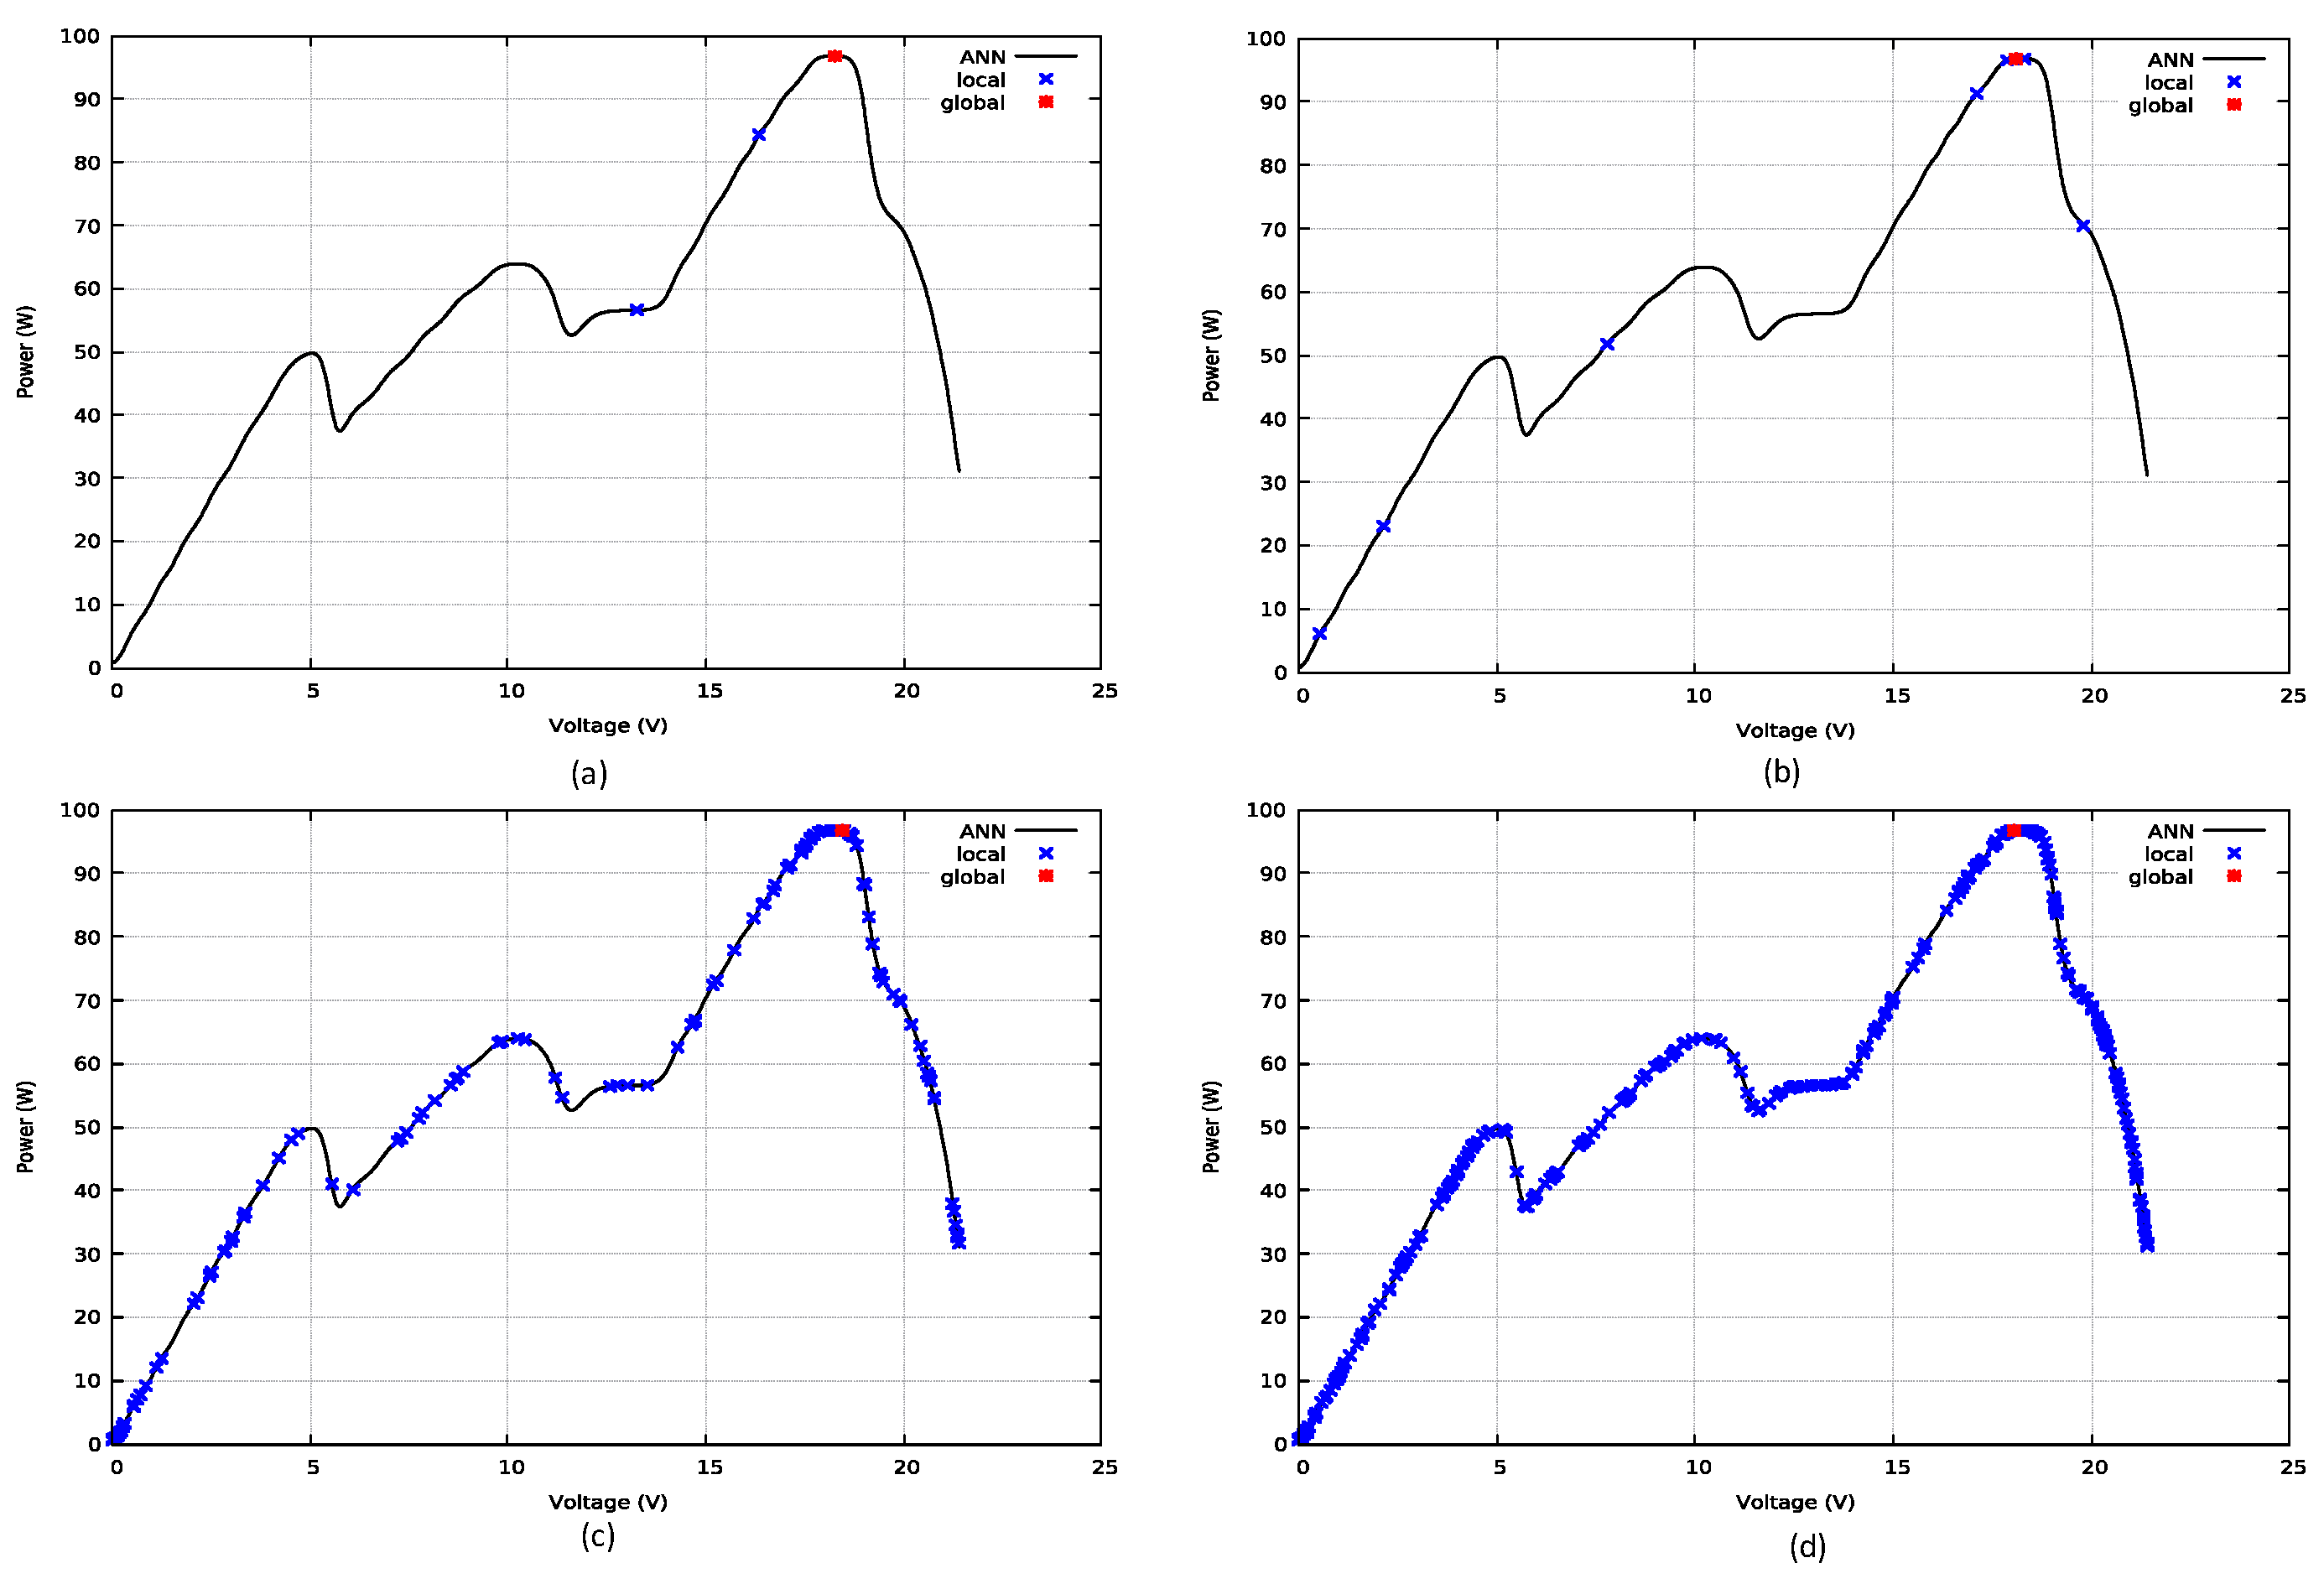
4.2. Results Obtained with Optimization Algorithms
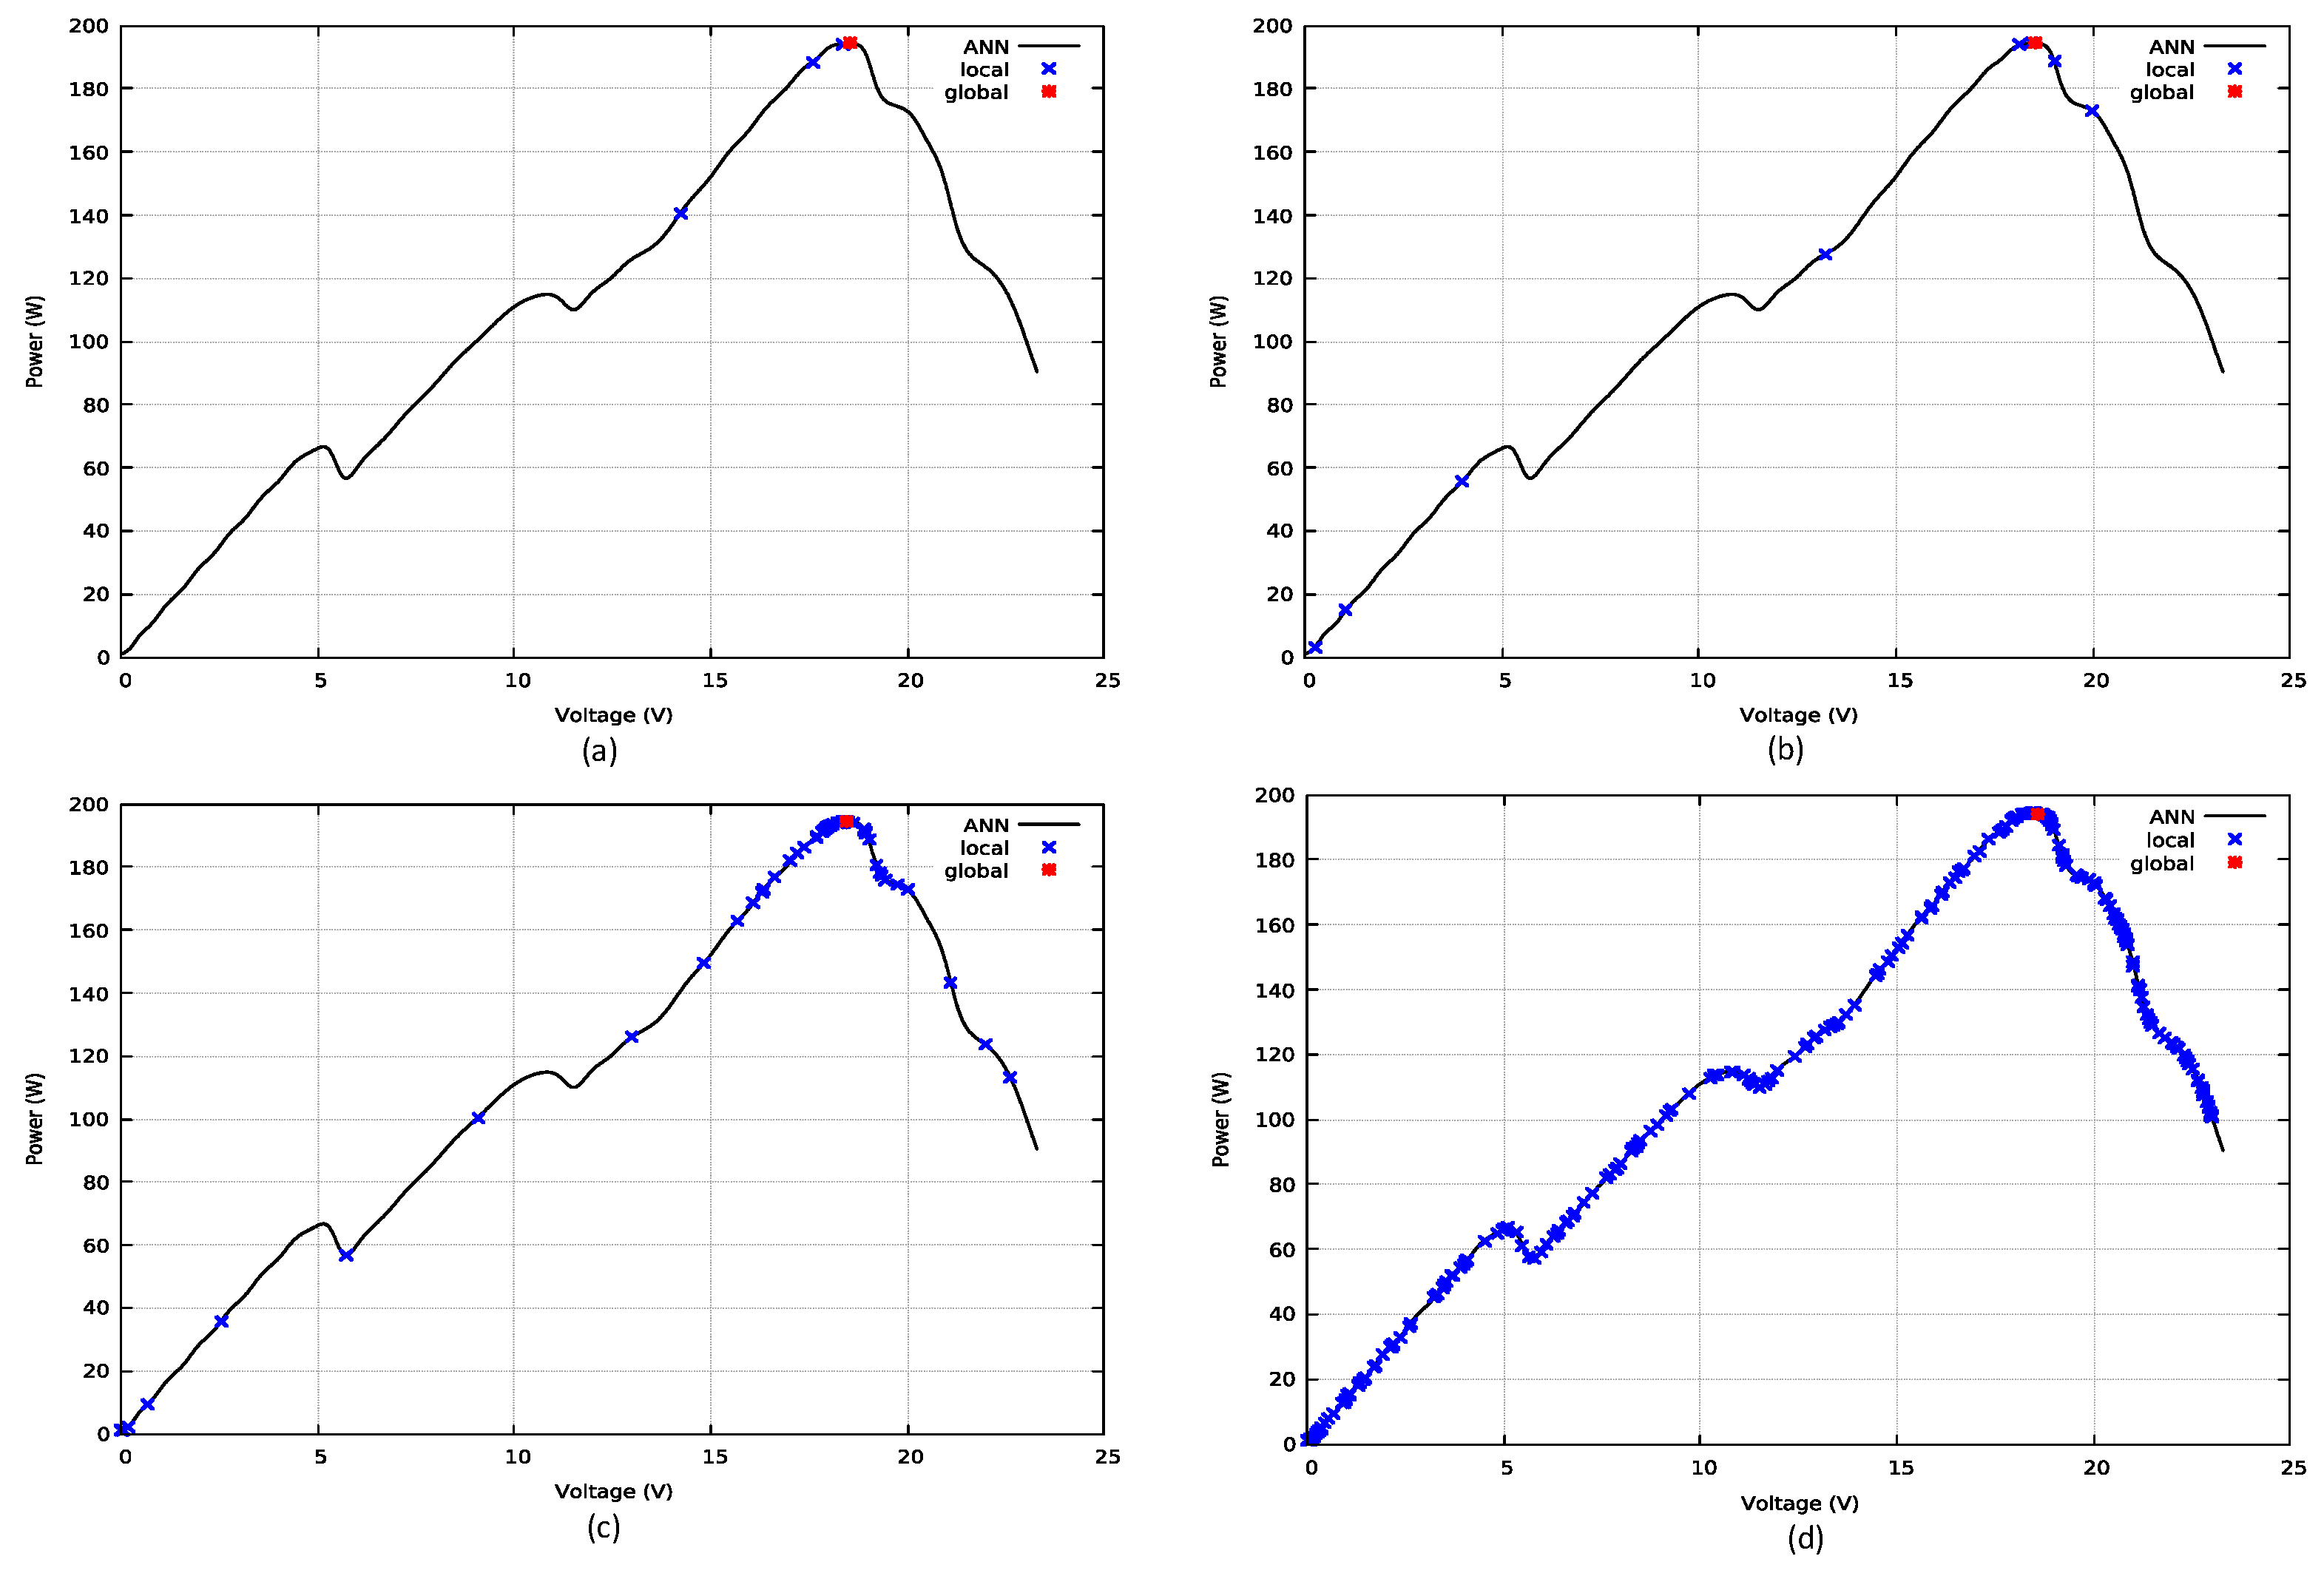
4.2.1. Results for Test Function 0
4.2.2. Results for Test Function 1
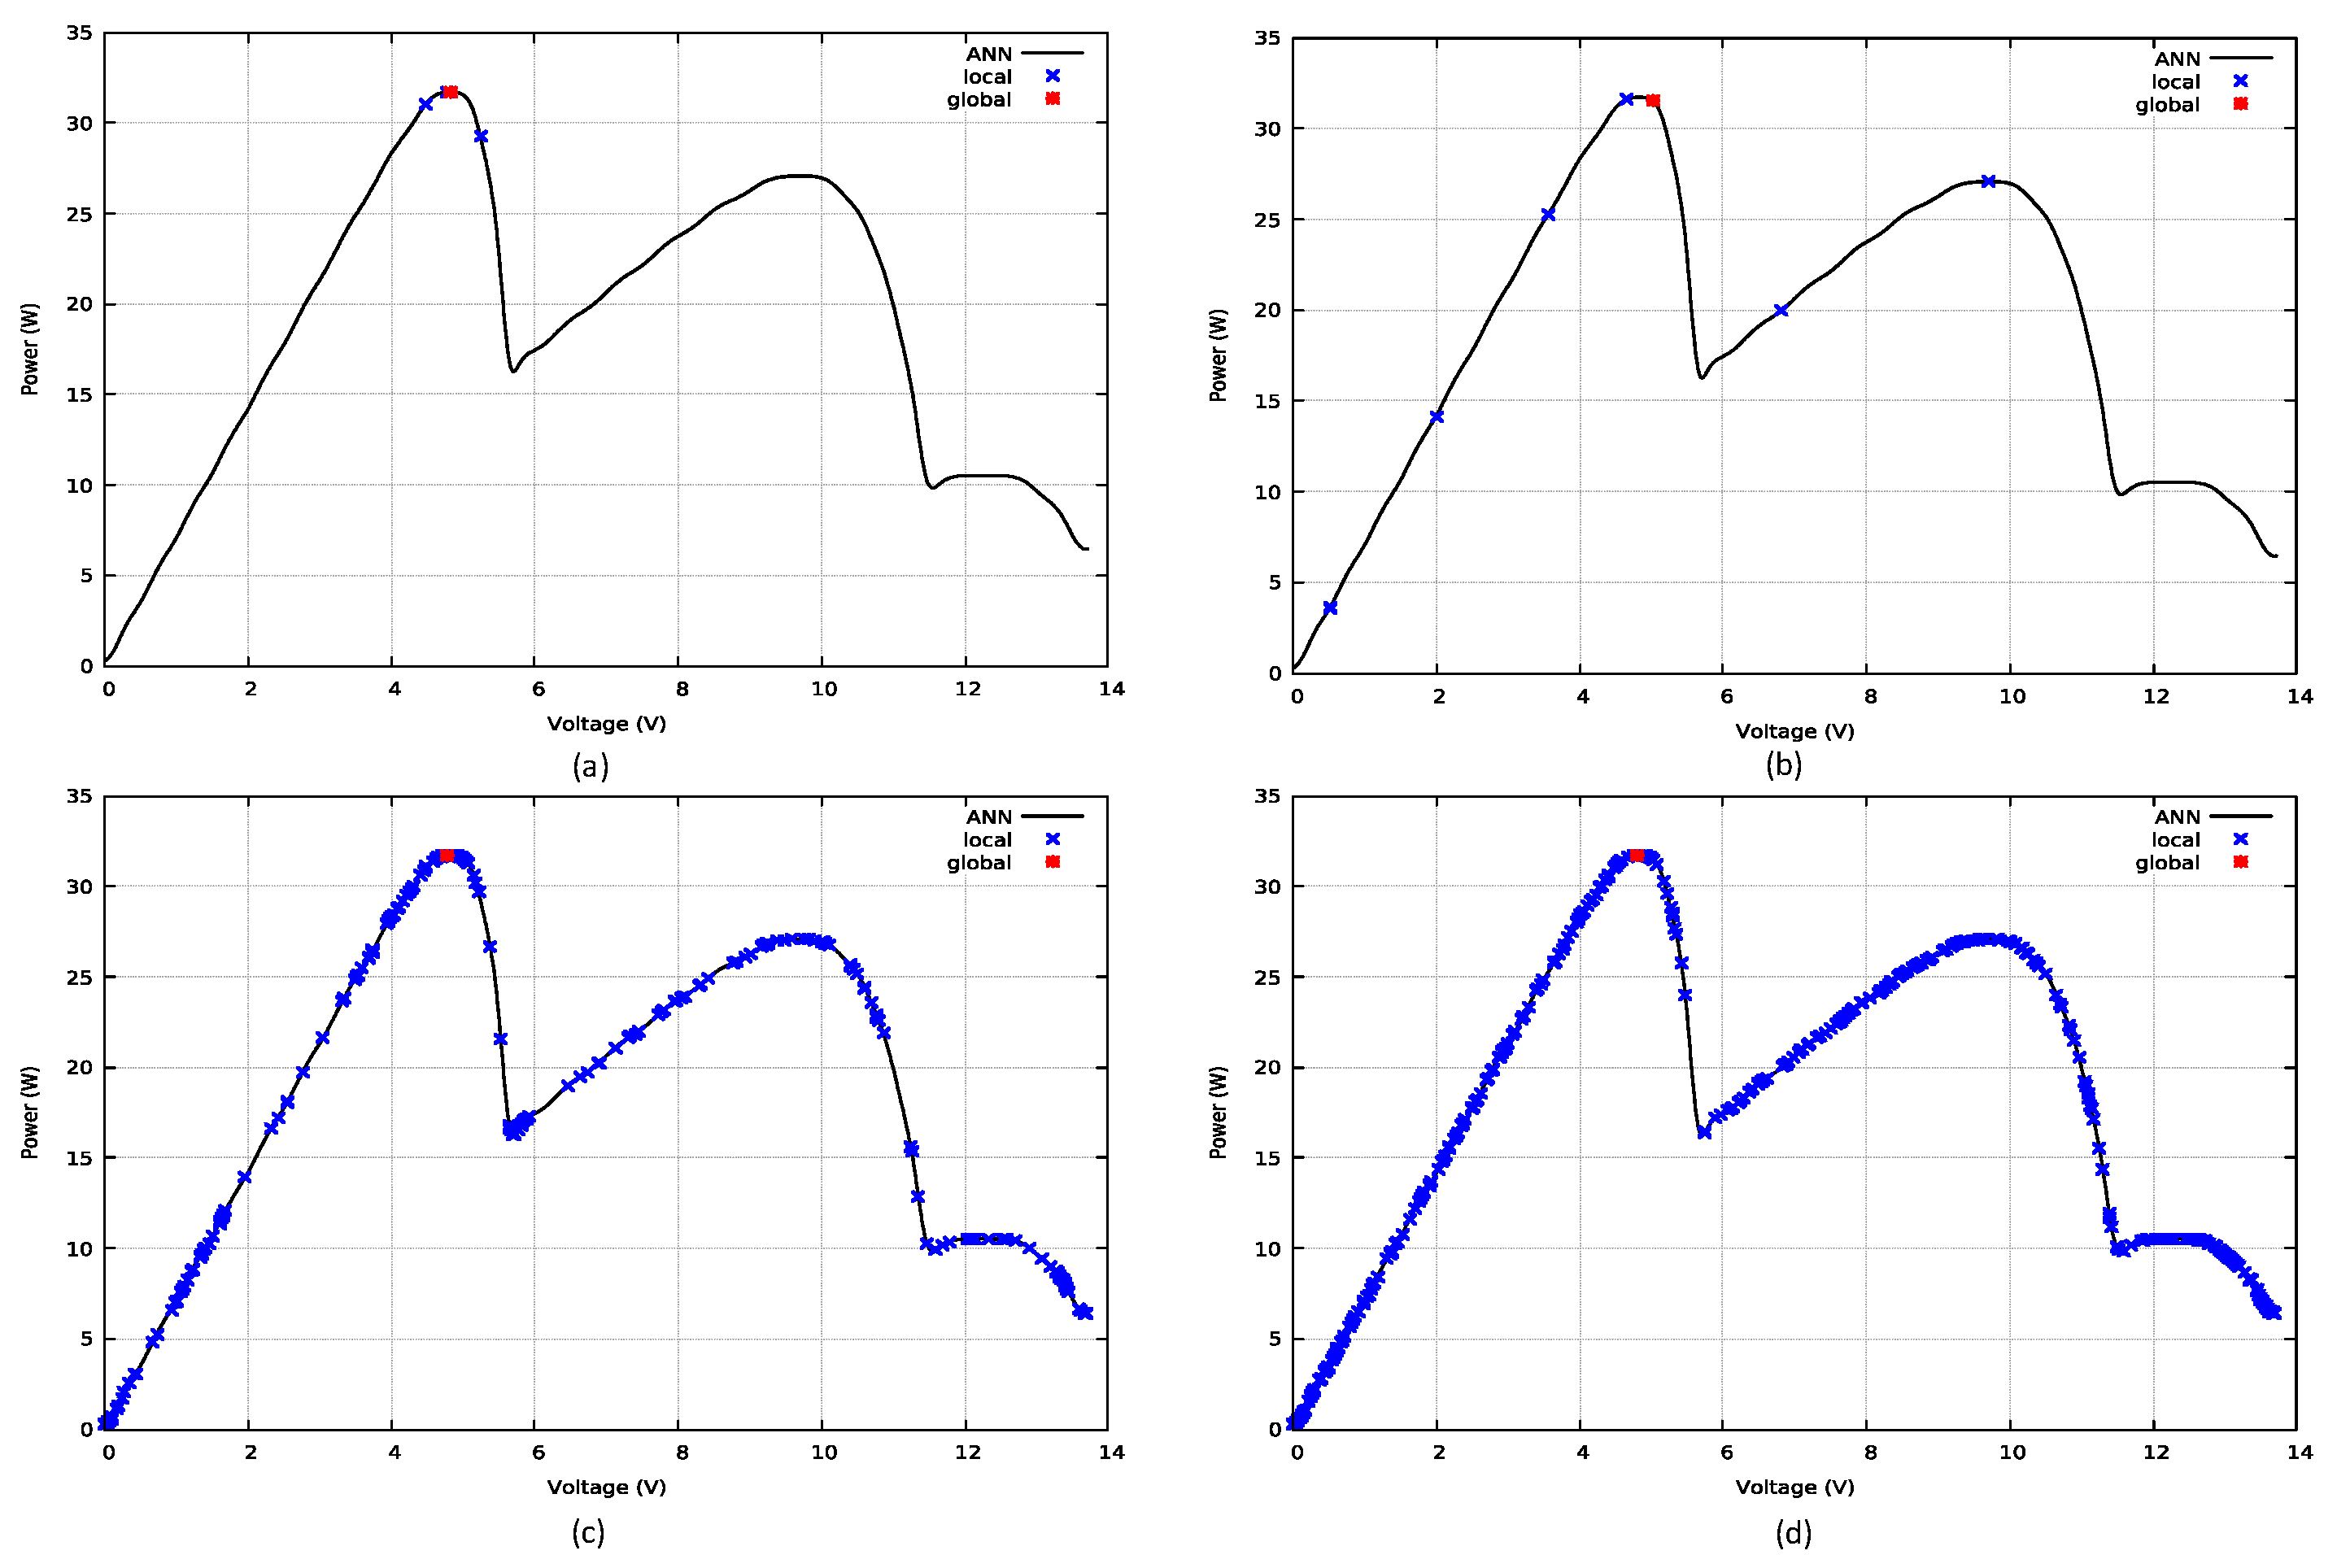
4.2.3. Results for Test Function 2
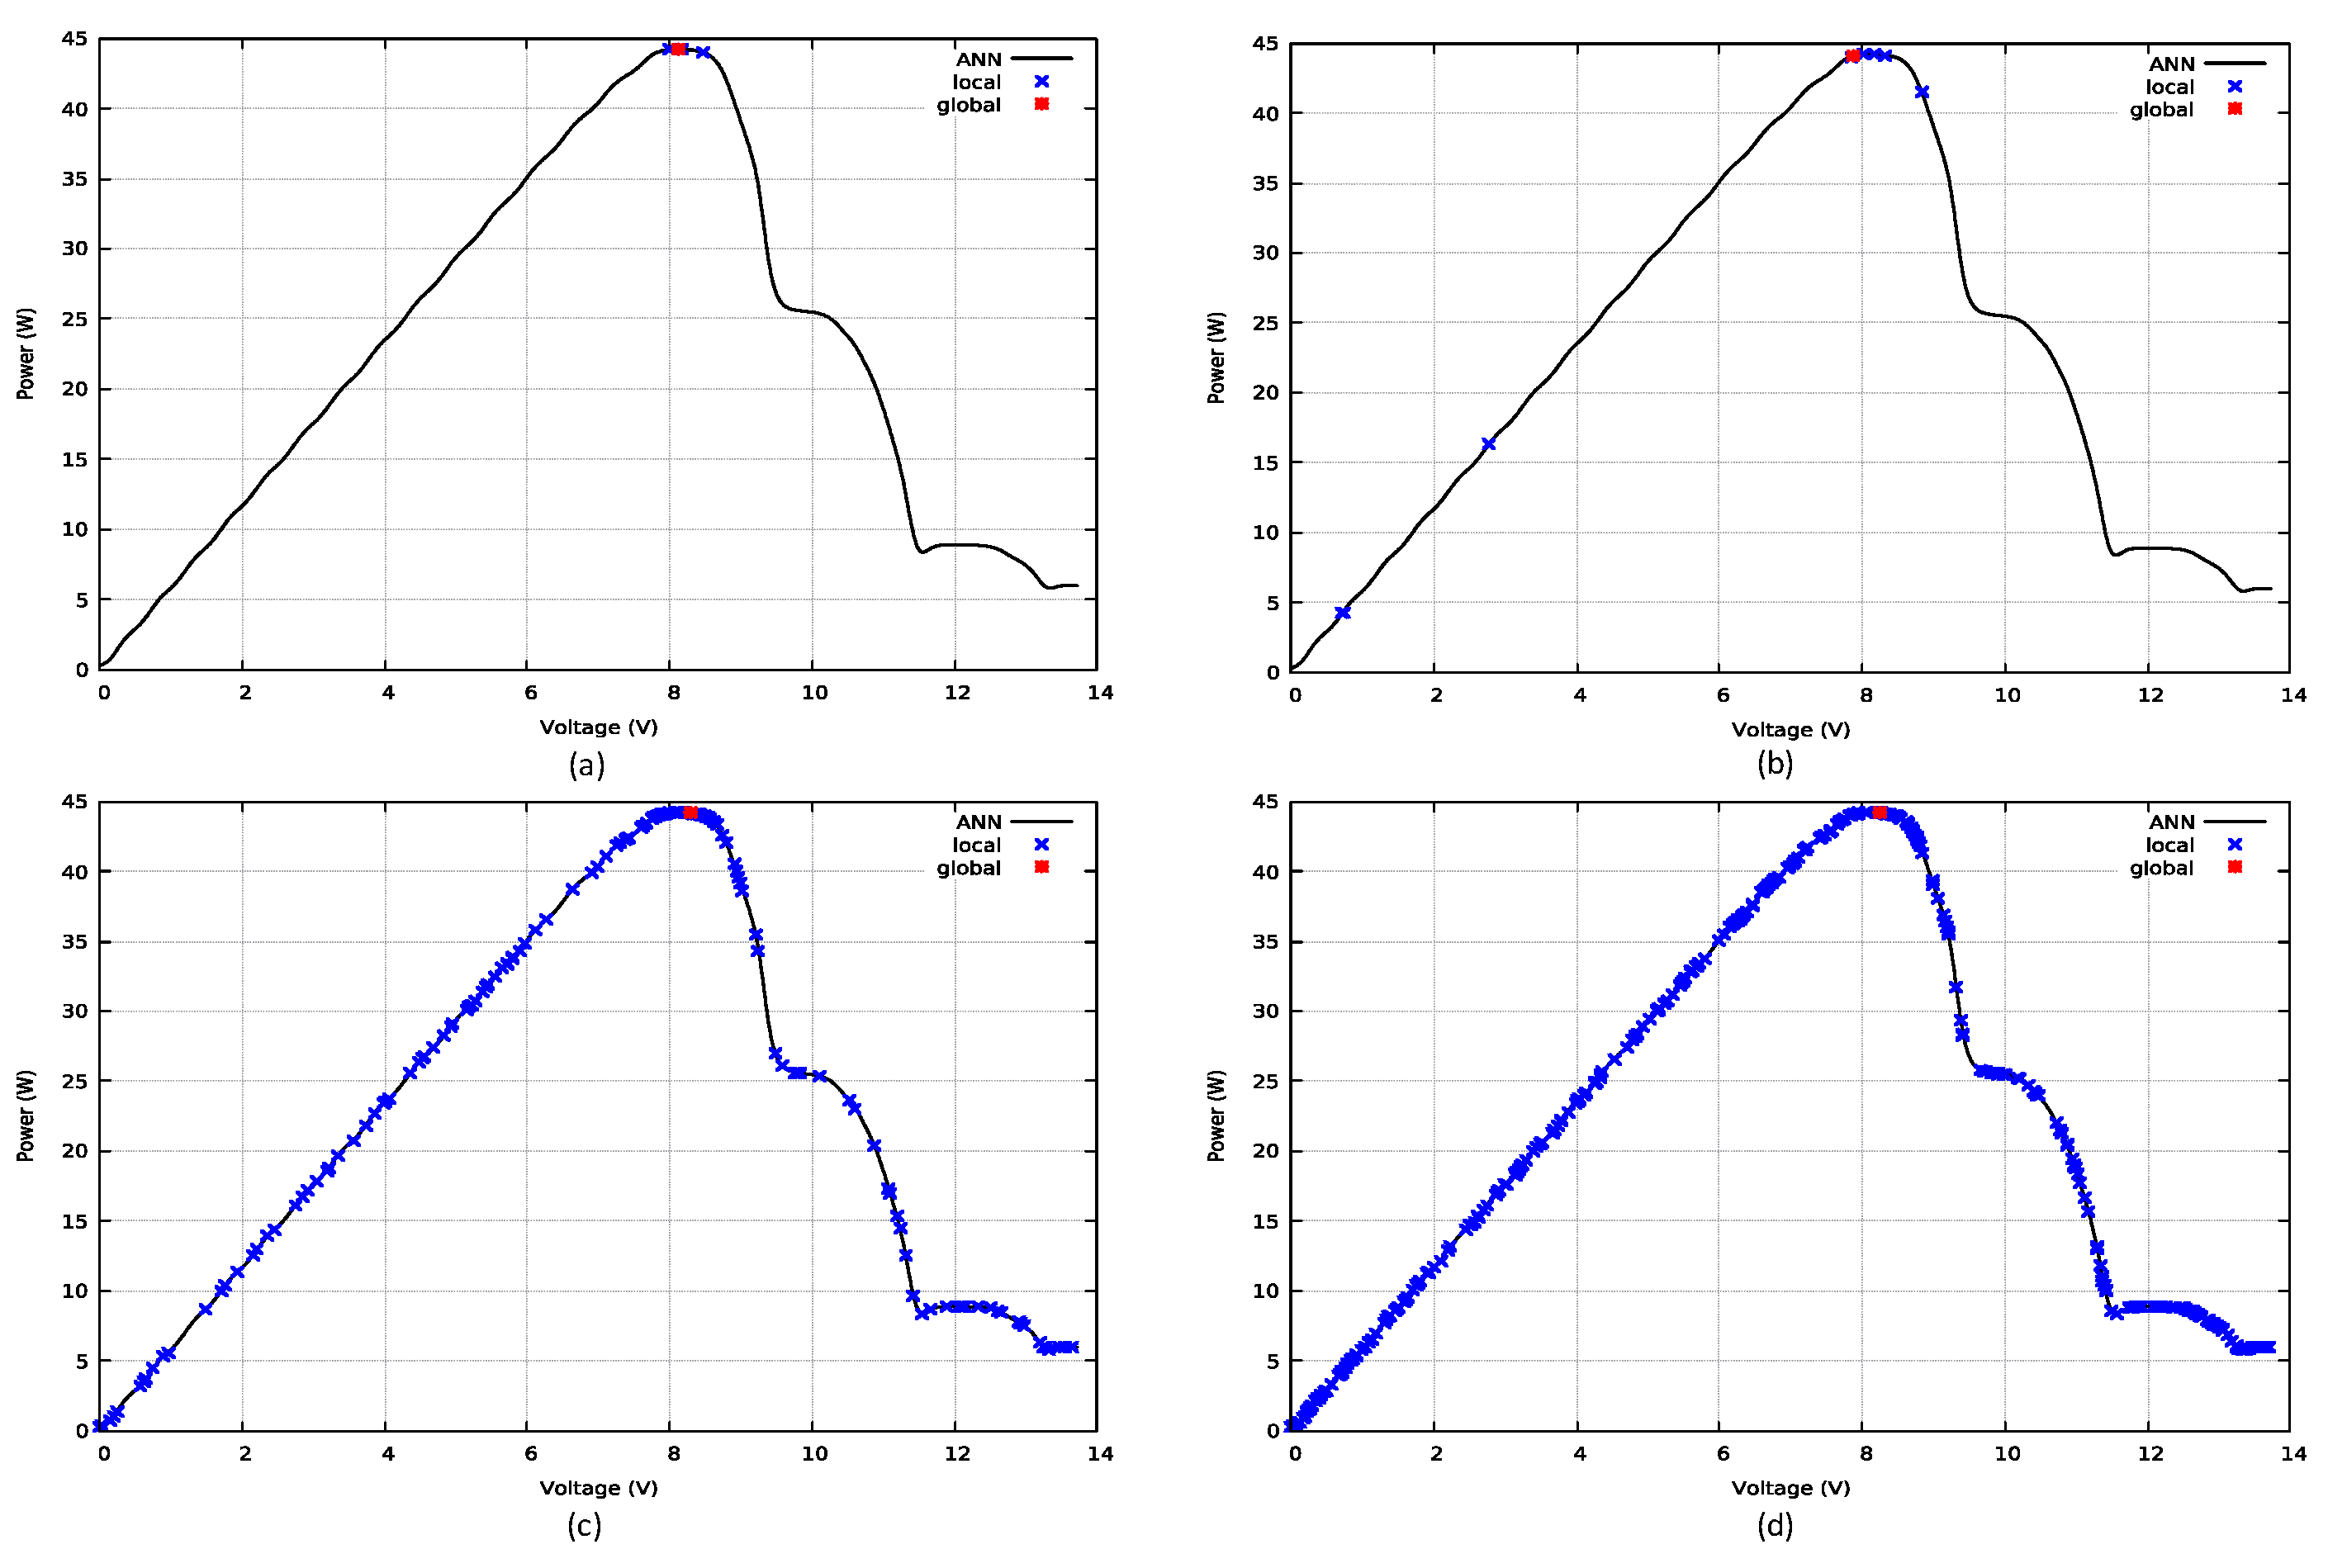
4.2.4. Results for Test Function 3
5. Conclusions
Author Contributions
Funding
Conflicts of Interest
References
- Chang, W.D. Multimodal function optimizations with multiple maximums and multiple minimums using an improved PSO algorithm. Appl. Soft. Comput. 2017, 60, 60–72. [Google Scholar] [CrossRef]
- Kaczmarczyk, V.; Bradac, Z.; Fiedler, P. A Heuristic Algorithm to Compute Multimodal Criterial Function Weights for Demand Management in Residential Areas. Energies 2017, 10, 1049. [Google Scholar] [CrossRef]
- Vieira, D.A.G.; Lisboa, A.C. Line search methods with guaranteed asymptotical convergence to an improving local optimum of multimodal functions. Eur. J. Oper. Res. 2014, 235, 38–46. [Google Scholar] [CrossRef]
- Tuo, S.; Zhang, J.; Yong, L.; Yuan, X.; Liu, B.; Xu, X.; Deng, F. A harmony search algorithm for high-dimensional multimodal optimization problems. Digit. Signal Process. 2015, 46, 151–163. [Google Scholar] [CrossRef]
- Thakur, M. A new genetic algorithm for global optimization of multimodal continuous functions. J. Comput. Sci. 2014, 5, 298–311. [Google Scholar] [CrossRef]
- Teo, J.C.; Tan, R.H.G.; Mok, V.H.; Ramachandaramurthy, V.K.; Tan, C. Impact of Partial Shading on the P-V Characteristics and the Maximum Power of a Photovoltaic String. Energies 2018, 11, 1860. [Google Scholar] [CrossRef]
- Bouselham, L.; Hajji, M.; Hajji, B.; Bouali, H. A New MPPT-based ANN for Photovoltaic System under Partial Shading Conditions. Energy. Proced. 2017, 111, 924–933. [Google Scholar] [CrossRef]
- Abu Eldahab, Y.E.; Saad, N.H.; Zekry, A. Enhancing the tracking techniques for the global maximum power point under partial shading conditions. Renew. Sustain. Energy Rev. 2017, 73, 1173–1183. [Google Scholar] [CrossRef]
- Li, G.; Jin, Y.; Akram, M.W.; Chen, X.; Ji, J. Application of bio-inspired algorithms in maximum power point tracking for PV systems under partial shading conditions. Renew. Sustain. Energy Rev. 2018, 81, 840–873. [Google Scholar] [CrossRef]
- Chaieb, H.; Sakly, A. A novel MPPT method for photovoltaic application under partial shaded conditions. Sol. Energy 2018, 159, 291–299. [Google Scholar] [CrossRef]
- Belhachat, F.; Larbes, C. Global maximum power point tracking based on ANFIS approach for PV array configurations under partial shading conditions. Renew. Sustain. Energy Rev. 2017, 77, 875–889. [Google Scholar] [CrossRef]
- Algarín, C.R.; Giraldo, J.T.; Álvarez, O.R. Fuzzy Logic Based MPPT Controller for a PV System. Energies 2017, 10, 2036. [Google Scholar] [CrossRef]
- Algarín, C.R.; Hernández, D.S.; Leal, D.R. A Low-Cost Maximum Power Point Tracking System Based on Neural Network Inverse Model Controller. Electronics 2018, 7, 4. [Google Scholar] [CrossRef]
- Viloria-Porto, J.; Robles-Algarín, C.; Restrepo-Leal, D. A novel approach for an MPPT controller based on the ADALine network trained with the RTRL algorithm. Energies 2018, 11, 3407. [Google Scholar] [CrossRef]
- Kheldoun, A.; Bradai, R.; Boukenoui, R.; Mellit, A. A new Golden Section method-based maximum power point tracking algorithm for photovoltaic systems. Energy Convers. Manag. 2016, 111, 125–136. [Google Scholar] [CrossRef]
- Gayathri, R.; Ezhilarasi, G.A. Golden section search based maximum power point tracking strategy for a dual output DC-DC converter. Ain Shams Eng. J. 2017, 9, 2617–2630. [Google Scholar] [CrossRef]
- Chaves, E.N.; Reis, J.H.; Coelho, E.A.A.; Freitas, L.C.G.; Júnior, J.B.V.; Freitas, L.C. Simulated Annealing MPPT in Partially Shaded PV Systems. IEEE. Lat. Am. Trans. 2016, 14, 235–241. [Google Scholar] [CrossRef]
- Lyden, S.; Haque, M.E. A Simulated Annealing Global Maximum Power Point Tracking Approach for PV Modules under Partial Shading Conditions. IEEE. Trans. Power. Electron. 2016, 31, 4171–4181. [Google Scholar] [CrossRef]
- Rahmat, M.K.; Jovanovic, S.; Lo, K.L. Reliability and Availability Modelling of Uninterruptible Power Supply Systems Using Monte-Carlo Simulation. Int. J. Energy Convers. 2017, 5, 60–66. [Google Scholar] [CrossRef]
- Passino, K.M.; Yurkovich, S. Fuzzy Control; Addison-Wesley: Menlo Park, CA, USA, 1997; pp. 23–51. [Google Scholar]
- Hagan, M.T.; Demuth, H.B.; Beale, M.H.; De Jesús, O. Neural Network Design, 2nd ed.; Oklahoma State University: Stillwater, OK, USA, 2014; pp. 36–50. [Google Scholar]
- Haykin, S. Neural Networks: A Comprehensive Foundation, 2nd ed.; Prentice Hall: Upper Saddle River, NJ, USA, 1998; pp. 23–28. [Google Scholar]
- Hen Hu, Y.; Hwang, J.-N. Handbook of Neural Network Signal Processing; CRC Press LLC: Boca Raton, FL, USA, 2002; pp. 42–45. [Google Scholar]
- Wang, G.; Tan, Z.; Tan, Q.; Yang, S.; Lin, H.; Ji, X.; Gejirifu, D.; Song, X. Multi-objective robust scheduling optimization model of wind, photovoltaic power, and bess based on the Pareto principle. Sustainability 2019, 11, 305. [Google Scholar] [CrossRef]
- Nasirudin, A.; Chao, R.-M.; Utama, I.K.A.P. Solar powered boat design optimization. Procedia Eng. 2017, 194, 260–267. [Google Scholar] [CrossRef]
- Ozgonenel, O.; Karagol, S.; Terzi, U.K. A novel approach for distributed renewable generation and shunt capacitor placing in smart-grid. IEEE Pes. Innov. Smart 2015, 2015, 7028983. [Google Scholar] [CrossRef]
- Khanjarpanah, H.; Jabbarzadeh, A. Sustainable wind plant location optimization using fuzzy cross-efficiency data envelopment analysis. Energy 2019, 170, 1004–1018. [Google Scholar] [CrossRef]
- Zhang, W.; Maleki, A.; Rosen, M.A.; Liu, J. Sizing a stand-alone solar-wind-hydrogen energy system using weather forecasting and a hybrid search optimization algorithm. Energy Convers. Manag. Energy 2019, 180, 609–621. [Google Scholar] [CrossRef]
- Malathy, S.; Ramaprabha, R. A two-stage tracking algorithm for PV systems subjected to partial shading conditions. Int. J. Renew. Energy Res. 2018, 8, 2249–2256. [Google Scholar]
- Wang, F.; Zhu, T.; Zhuo, F.; Yi, H.; Fan, Y. Enhanced simulated annealing-based global MPPT for different PV systems in mismatched conditions. J. Power Electron. 2017, 17, 1327–1337. [Google Scholar] [CrossRef]
- Lyden, S.; Haque, M.E. A comprehensive study of the key parameters of the Simulated Annealing method for maximum power point tracking in photovoltaic systems. In Proceedings of the IEEE Power and Energy Society General Meeting, Boston, MA, USA, 17–21 July 2016; Volume 2016, p. 7741788. [Google Scholar] [CrossRef]
- Demuth, H.B.; Hagan, M.T.; Beale, M.H. Neural Network Toolbox User’s Guide R2013b; The MathWorks, Inc.: Natick, MA, USA, 2013; pp. 129–188. [Google Scholar]


| Test Functions | R |
|---|---|
| Function 0 | |
| Function 1 | |
| Function 2 | |
| Function 3 |
| Test Functions | Local Maximums | Global Maximum |
|---|---|---|
| Function 0 | [5.11, 66.19], [10.76, 114.72] | [18.5056, 194.412] |
| Function 1 | [4.97, 49.74], [10.33, 64.13], [13.06, 57.02] | [18.2847, 97.3037] |
| Function 2 | [9.82, 27.12], [12.46, 10.60] | [4.82874, 31.8543] |
| Function 3 | [9.82, 25.73], [12.31, 8.80] | [8.19883, 44.2902] |
| Components | GSS | Error | SA T = 0.5 | Error | SA T = 100 | Error | SA T = 1000 | Error |
|---|---|---|---|---|---|---|---|---|
| x | 18.479162 | 0.14% | 18.530024 | 0.13% | 18.465574 | 0.22% | 18.575342 | 0.37% |
| gf(x) | 194.370331 | 0.02% | 194.357605 | 0.03% | 194.370087 | 0.02% | 194.324768 | 0.04% |
| Time (ms) | 0.189 | 2.175 | 7.904 | 10.585 | ||||
| Iterations | 9 | 160 | 675 | 900 |
| Components | GSS | Error | SA T = 0.5 | Error | SA T = 100 | Error | SA T = 1000 | Error |
|---|---|---|---|---|---|---|---|---|
| x | 18.279242 | 0.03% | 18.396032 | 0.61% | 18.433100 | 0.81% | 18.035101 | 1.36% |
| f(x) | 96.871460 | 0.44% | 96.812531 | 0.50% | 96.776138 | 0.54% | 96.801155 | 0.52% |
| Time (ms) | 0.178 | 2.514 | 8.113 | 9.580 | ||||
| Iterations | 8 | 160 | 675 | 900 |
| Components | GSS | Error | SA T = 0.5 | Error | SA T = 100 | Error | SA T = 1000 | Error |
|---|---|---|---|---|---|---|---|---|
| x | 4.836398 | 0.16% | 5.019549 | 3.95% | 4.780378 | 1.00% | 4.792931 | 0.74% |
| f(x) | 31.715771 | 0.43% | 31.506104 | 1.09% | 31.707682 | 0.46% | 31.711351 | 0.45% |
| Time (ms) | 0.188 | 1.429 | 4.046 | 5.41 | ||||
| Iterations | 10 | 160 | 675 | 900 |
| Components | GSS | Error | SA T = 0.5 | Error | SA T = 100 | Error | SA T = 1000 | Error |
|---|---|---|---|---|---|---|---|---|
| x | 8.110684 | 1.08% | 7.864448 | 4.08% | 8.432590 | 2.85% | 8.252893 | 0.66% |
| f(x) | 44.196526 | 0.21% | 44.063797 | 0.51% | 44.038975 | 0.57% | 44.173416 | 0.26% |
| Time (ms) | 0.280 | 2.018 | 4.019 | 8.82 | ||||
| Iterations | 9 | 160 | 675 | 900 |
© 2019 by the authors. Licensee MDPI, Basel, Switzerland. This article is an open access article distributed under the terms and conditions of the Creative Commons Attribution (CC BY) license (http://creativecommons.org/licenses/by/4.0/).
Share and Cite
Guillot, J.; Restrepo-Leal, D.; Robles-Algarín, C.; Oliveros, I. Search for Global Maxima in Multimodal Functions by Applying Numerical Optimization Algorithms: A Comparison between Golden Section and Simulated Annealing. Computation 2019, 7, 43. https://doi.org/10.3390/computation7030043
Guillot J, Restrepo-Leal D, Robles-Algarín C, Oliveros I. Search for Global Maxima in Multimodal Functions by Applying Numerical Optimization Algorithms: A Comparison between Golden Section and Simulated Annealing. Computation. 2019; 7(3):43. https://doi.org/10.3390/computation7030043
Chicago/Turabian StyleGuillot, Jordan, Diego Restrepo-Leal, Carlos Robles-Algarín, and Ingrid Oliveros. 2019. "Search for Global Maxima in Multimodal Functions by Applying Numerical Optimization Algorithms: A Comparison between Golden Section and Simulated Annealing" Computation 7, no. 3: 43. https://doi.org/10.3390/computation7030043
APA StyleGuillot, J., Restrepo-Leal, D., Robles-Algarín, C., & Oliveros, I. (2019). Search for Global Maxima in Multimodal Functions by Applying Numerical Optimization Algorithms: A Comparison between Golden Section and Simulated Annealing. Computation, 7(3), 43. https://doi.org/10.3390/computation7030043