Optical Boundaries for LED-Based Indoor Positioning System


Abstract
1. Introduction
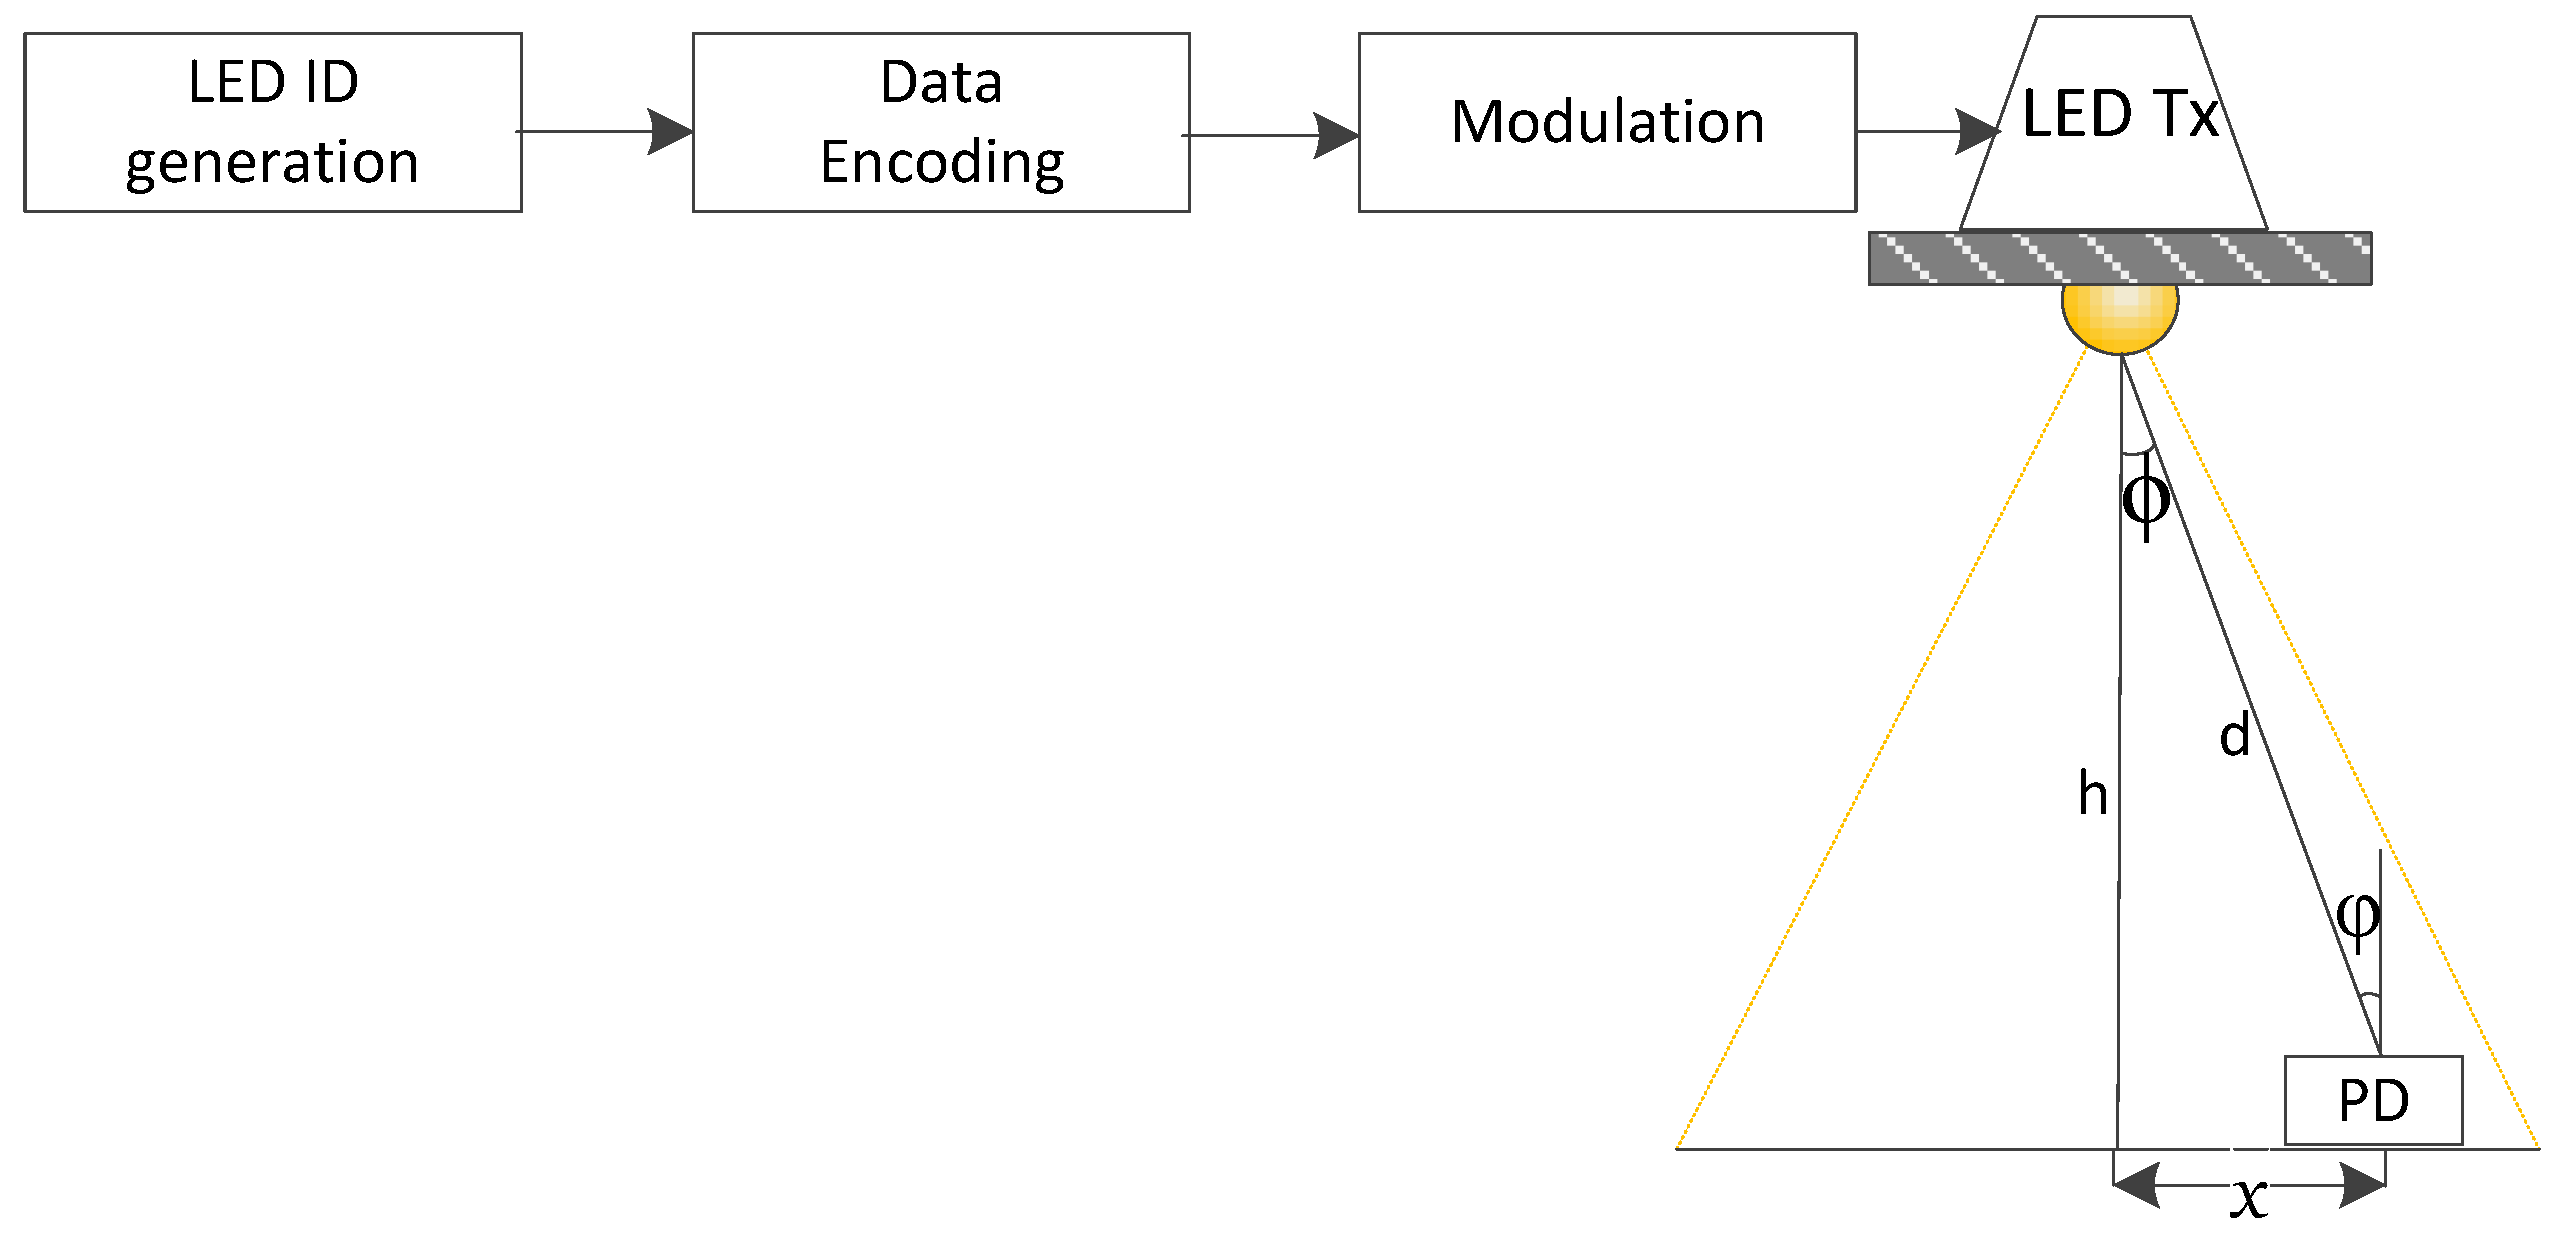
2. System Model
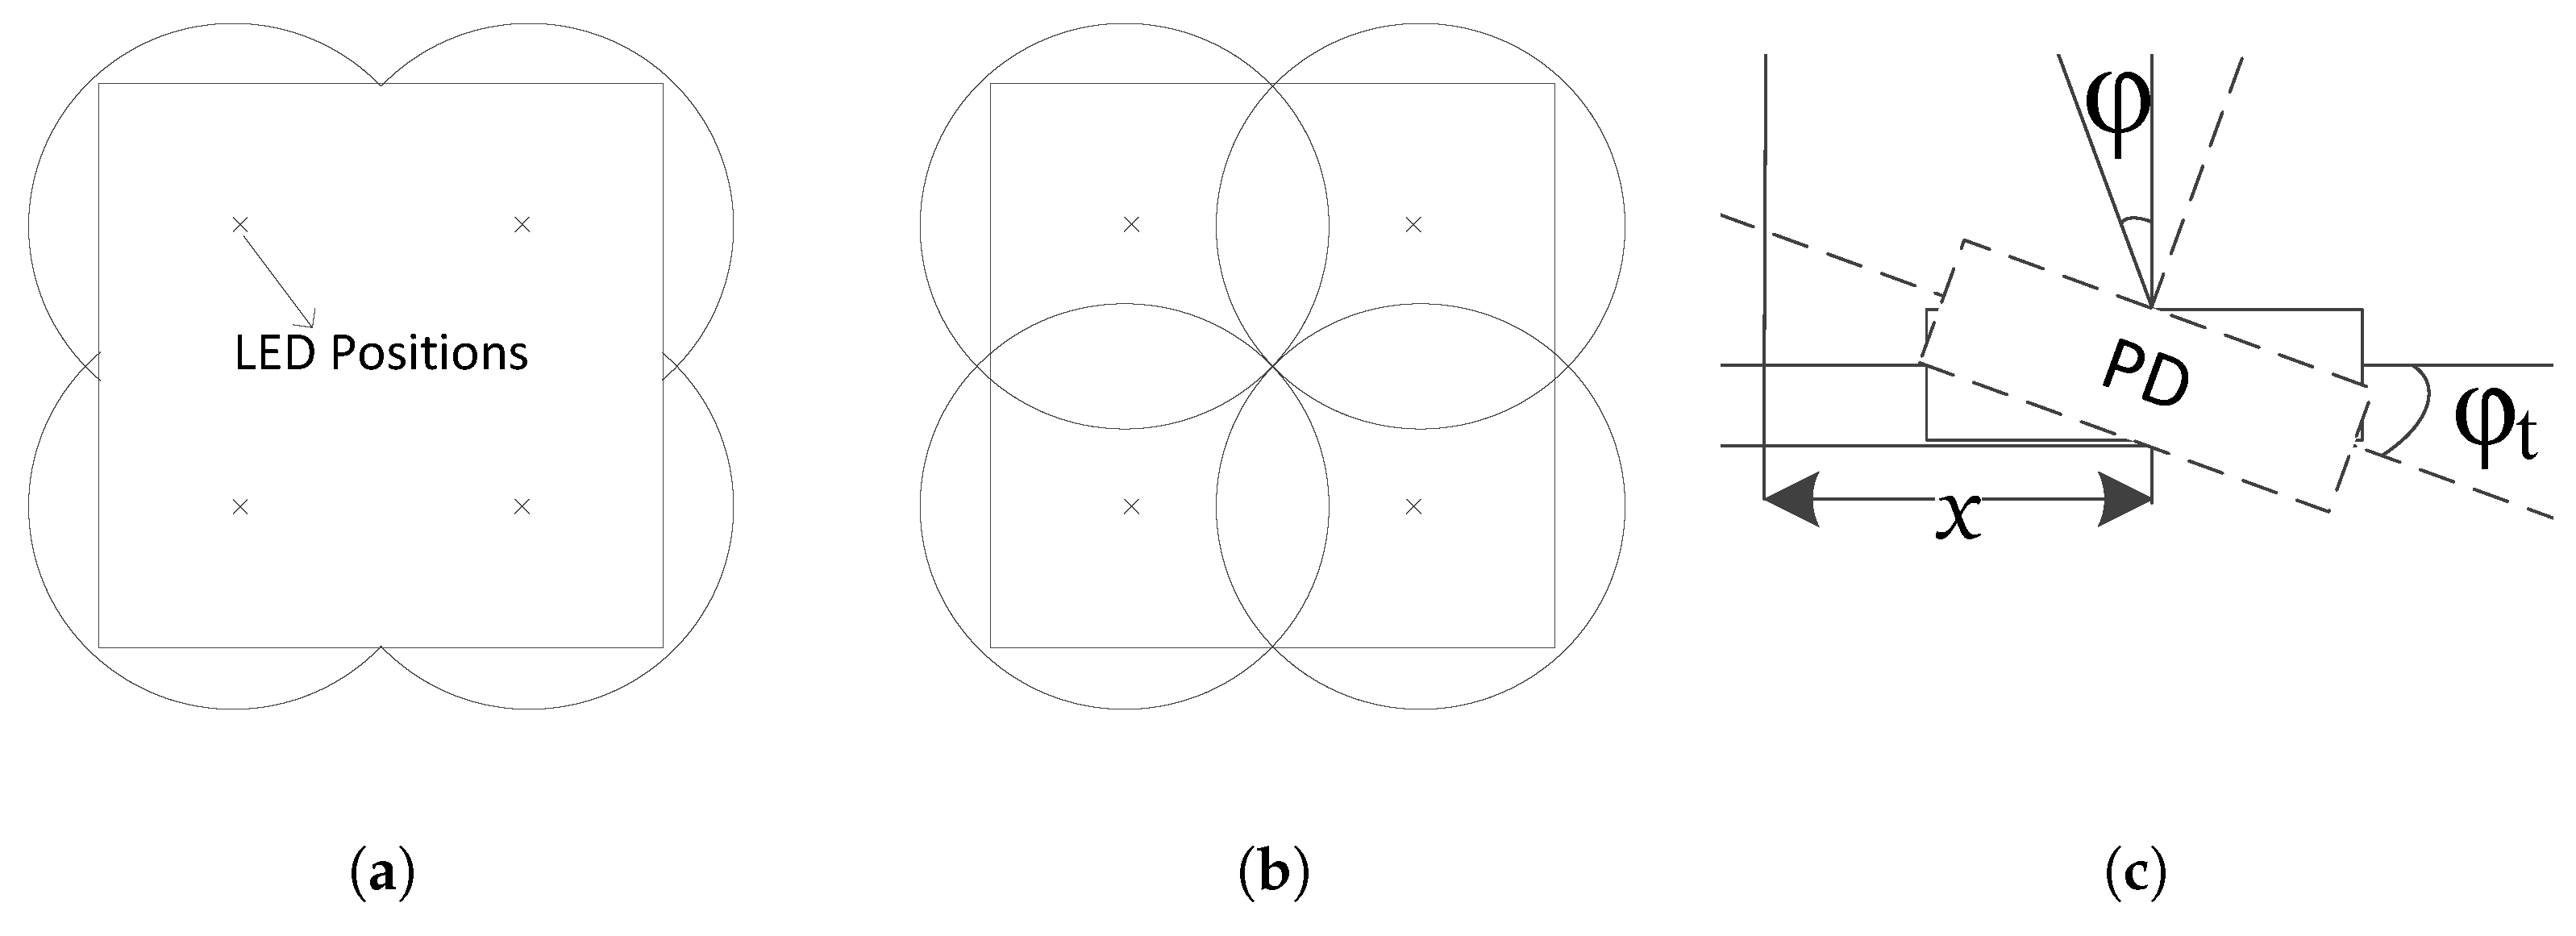
Problem Description
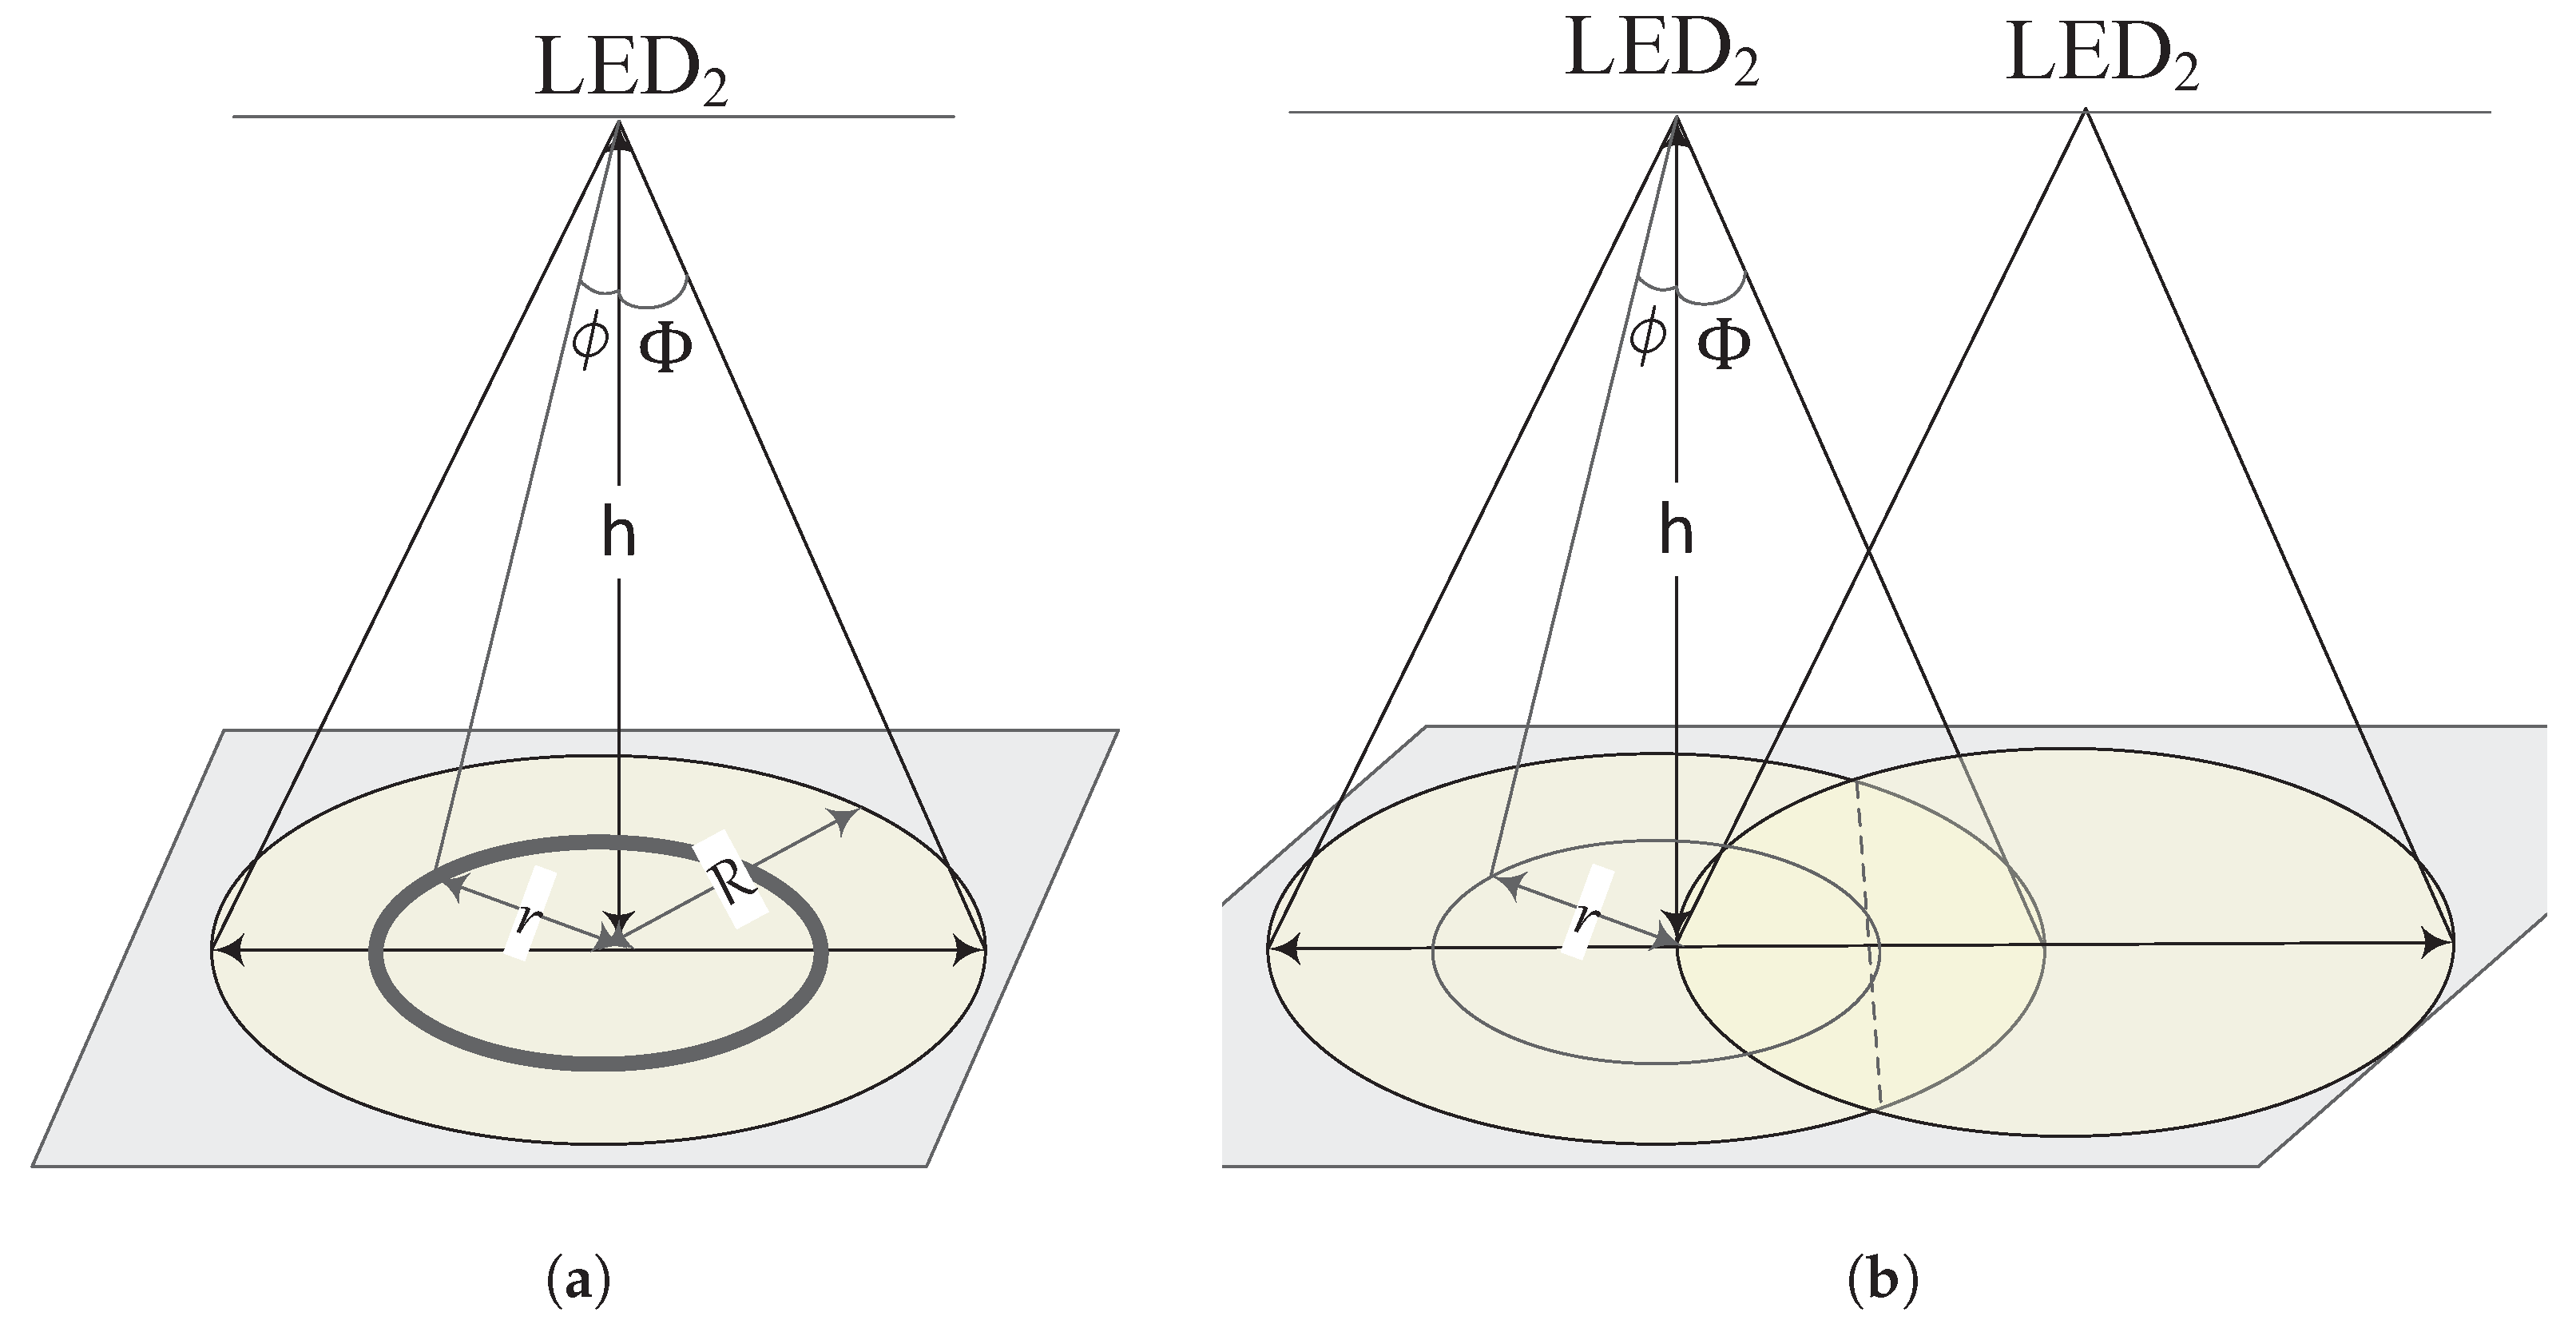
3. Optical Boundary Definition
3.1. Noise Determination for the System Model
3.2. Threshold Angle for Optical Boundary
4. Investigations Showing the Effect of Defined Optical Boundaries
4.1. Boundary Based Positioning Protocol
4.2. Quantifying Effect of Full Angle Positioning Boundary
4.3. Positioning Delay Due to Tilt
4.4. Accuracy of the Positioning System
| Algorithm 1 Computation of positioning error. |
|
5. Results and Discussions
5.1. Estimation of Total Receiver Noise
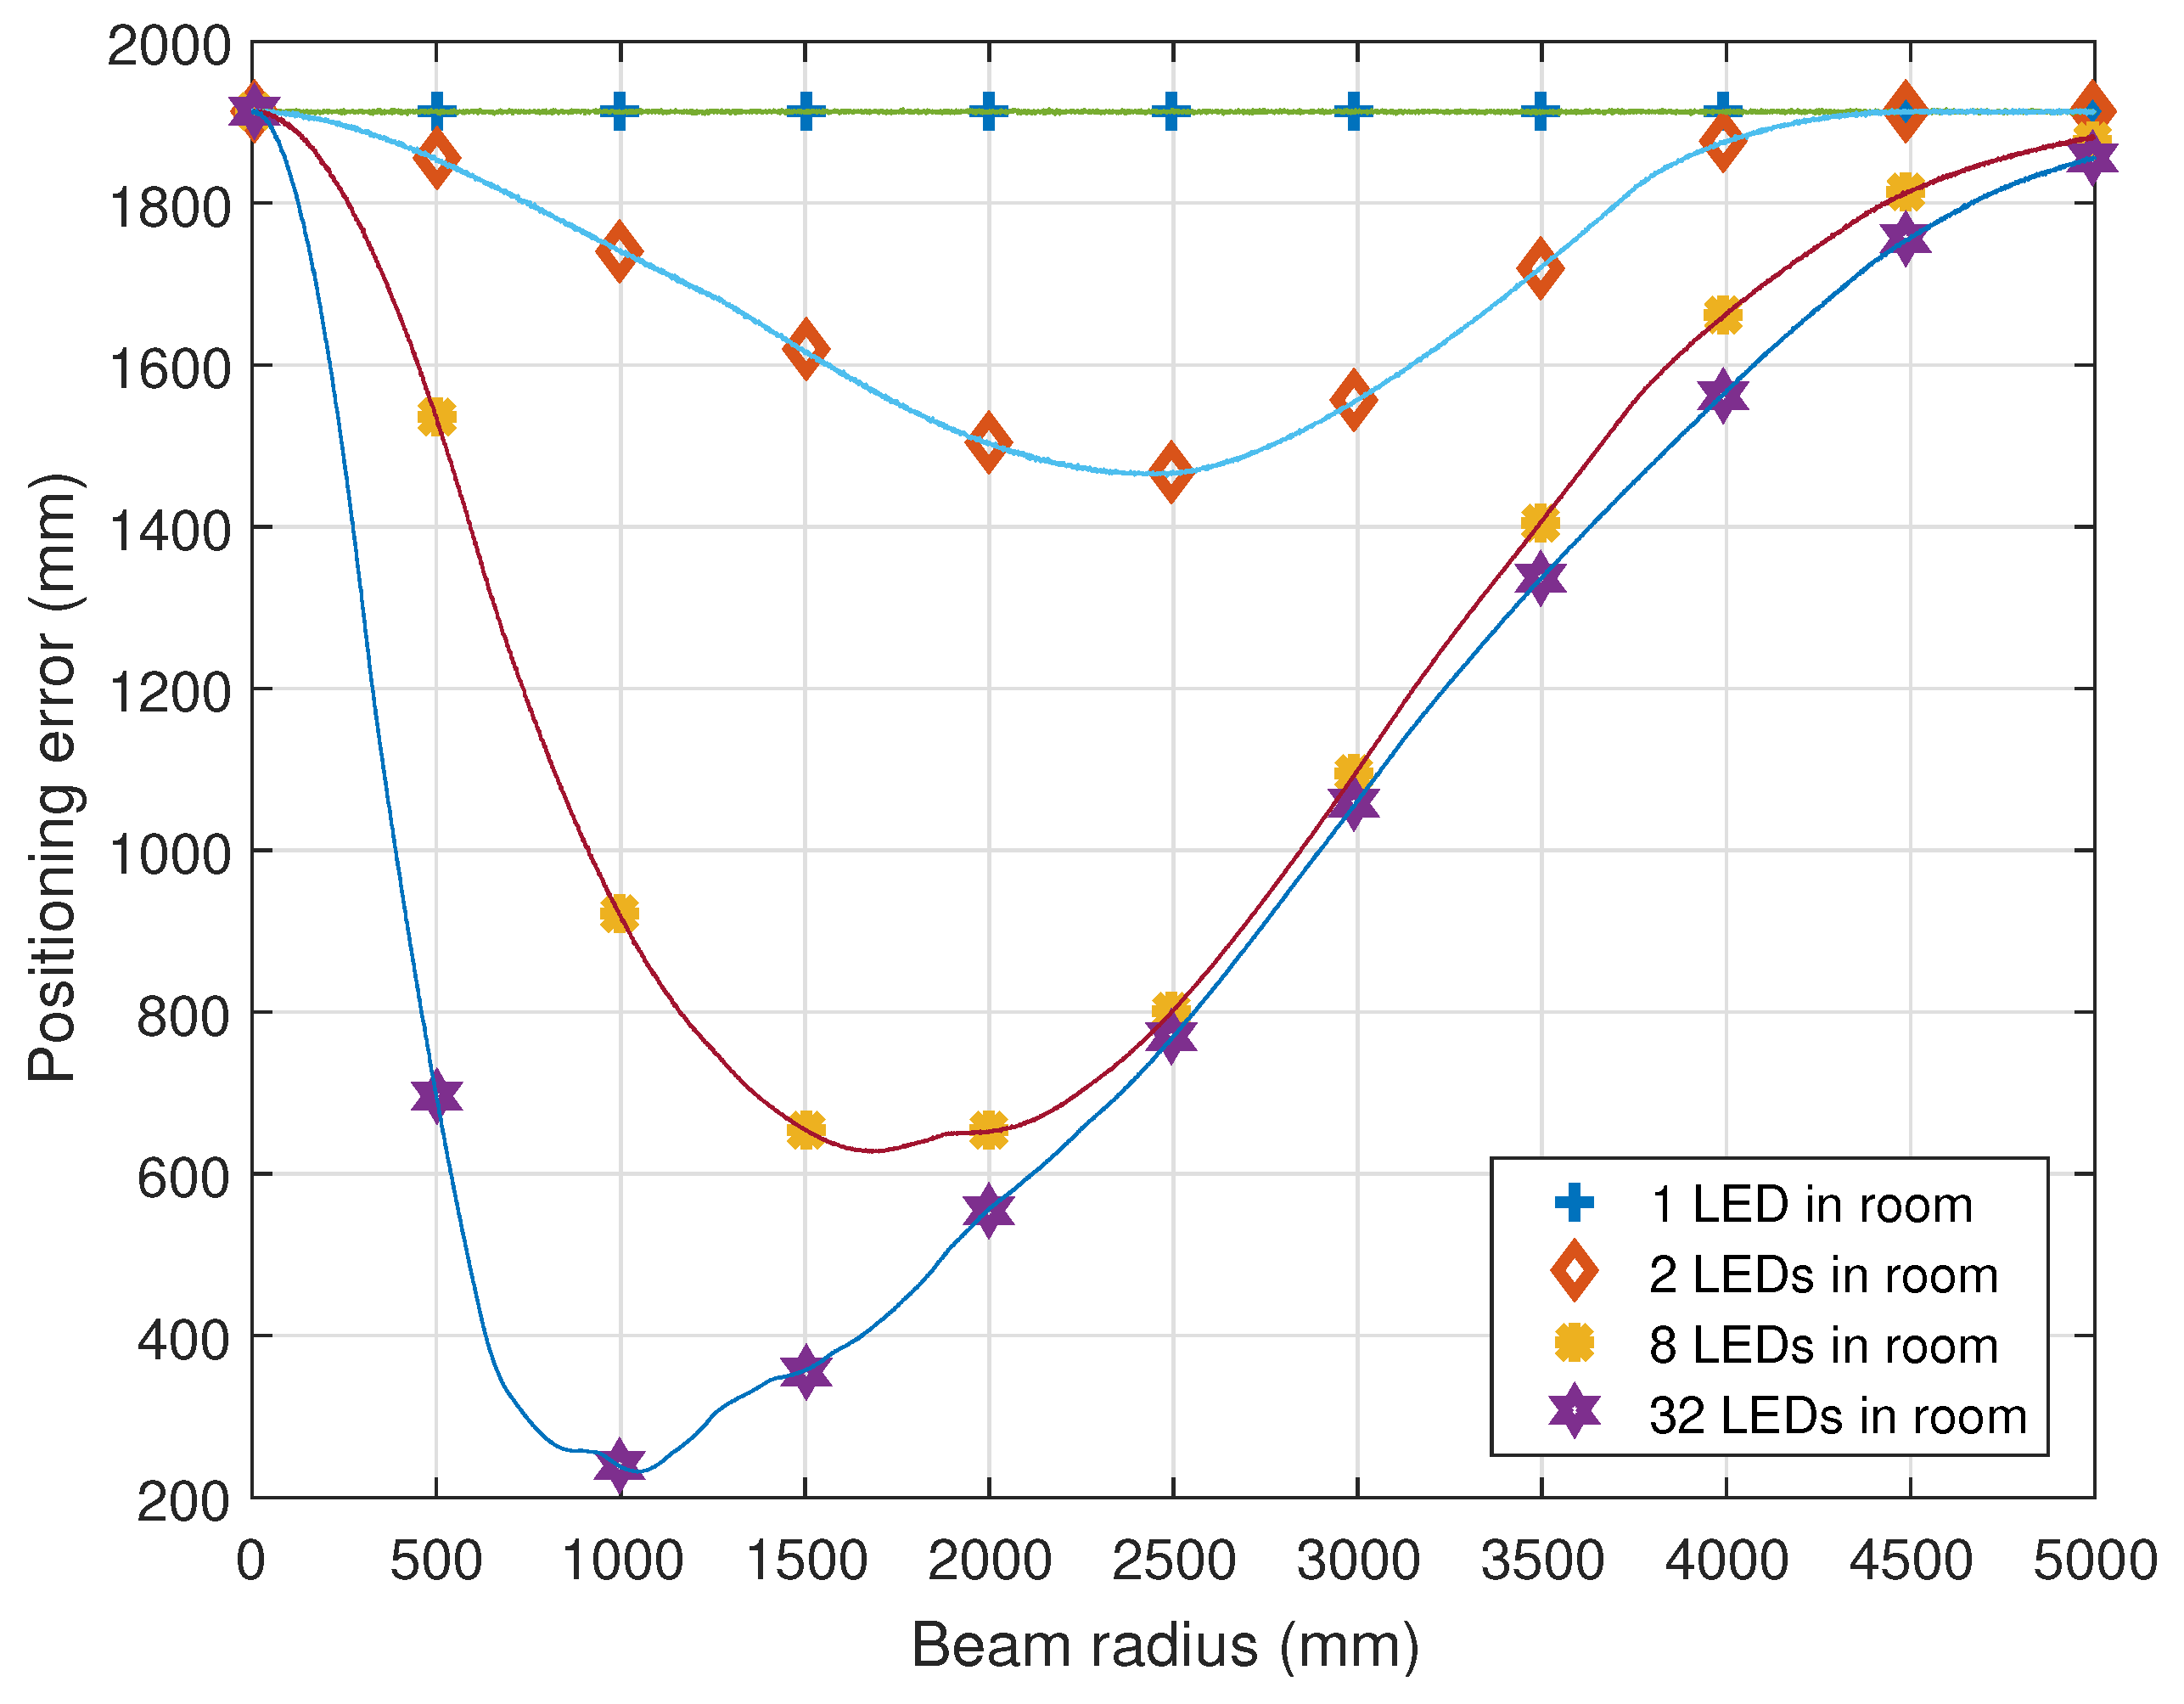
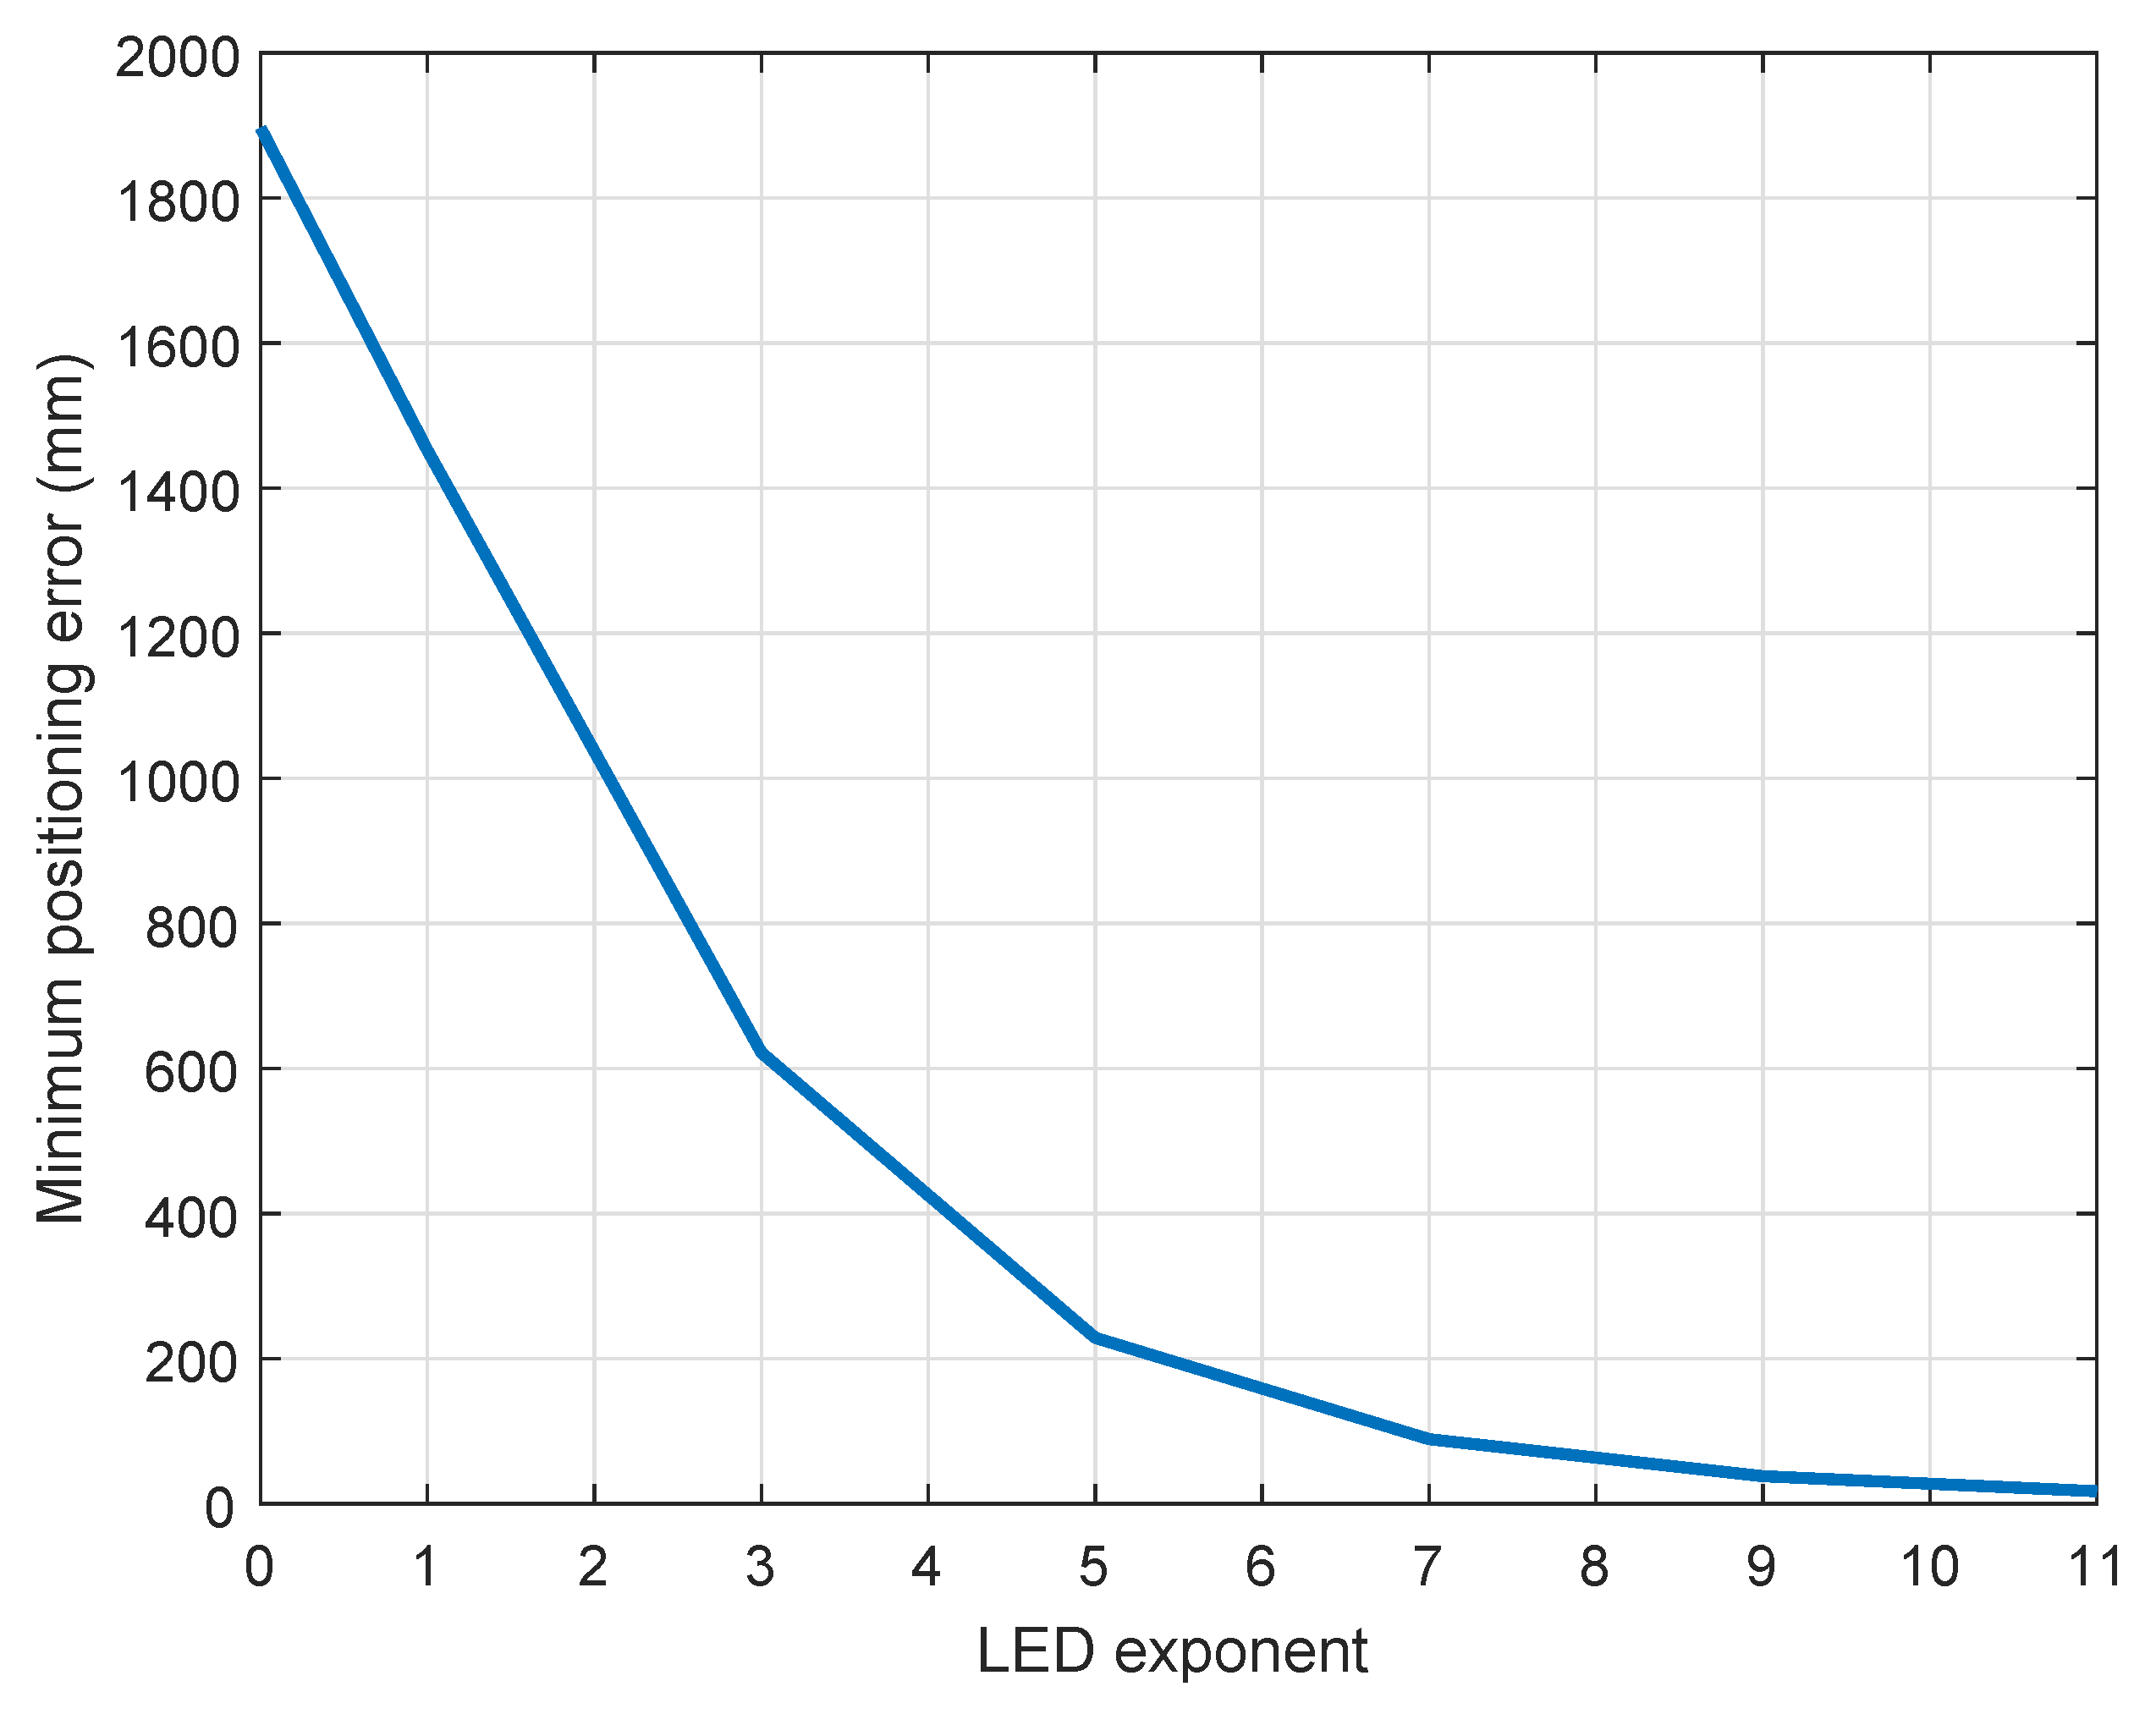
5.2. Effect of Optical Boundaries on Positioning Error
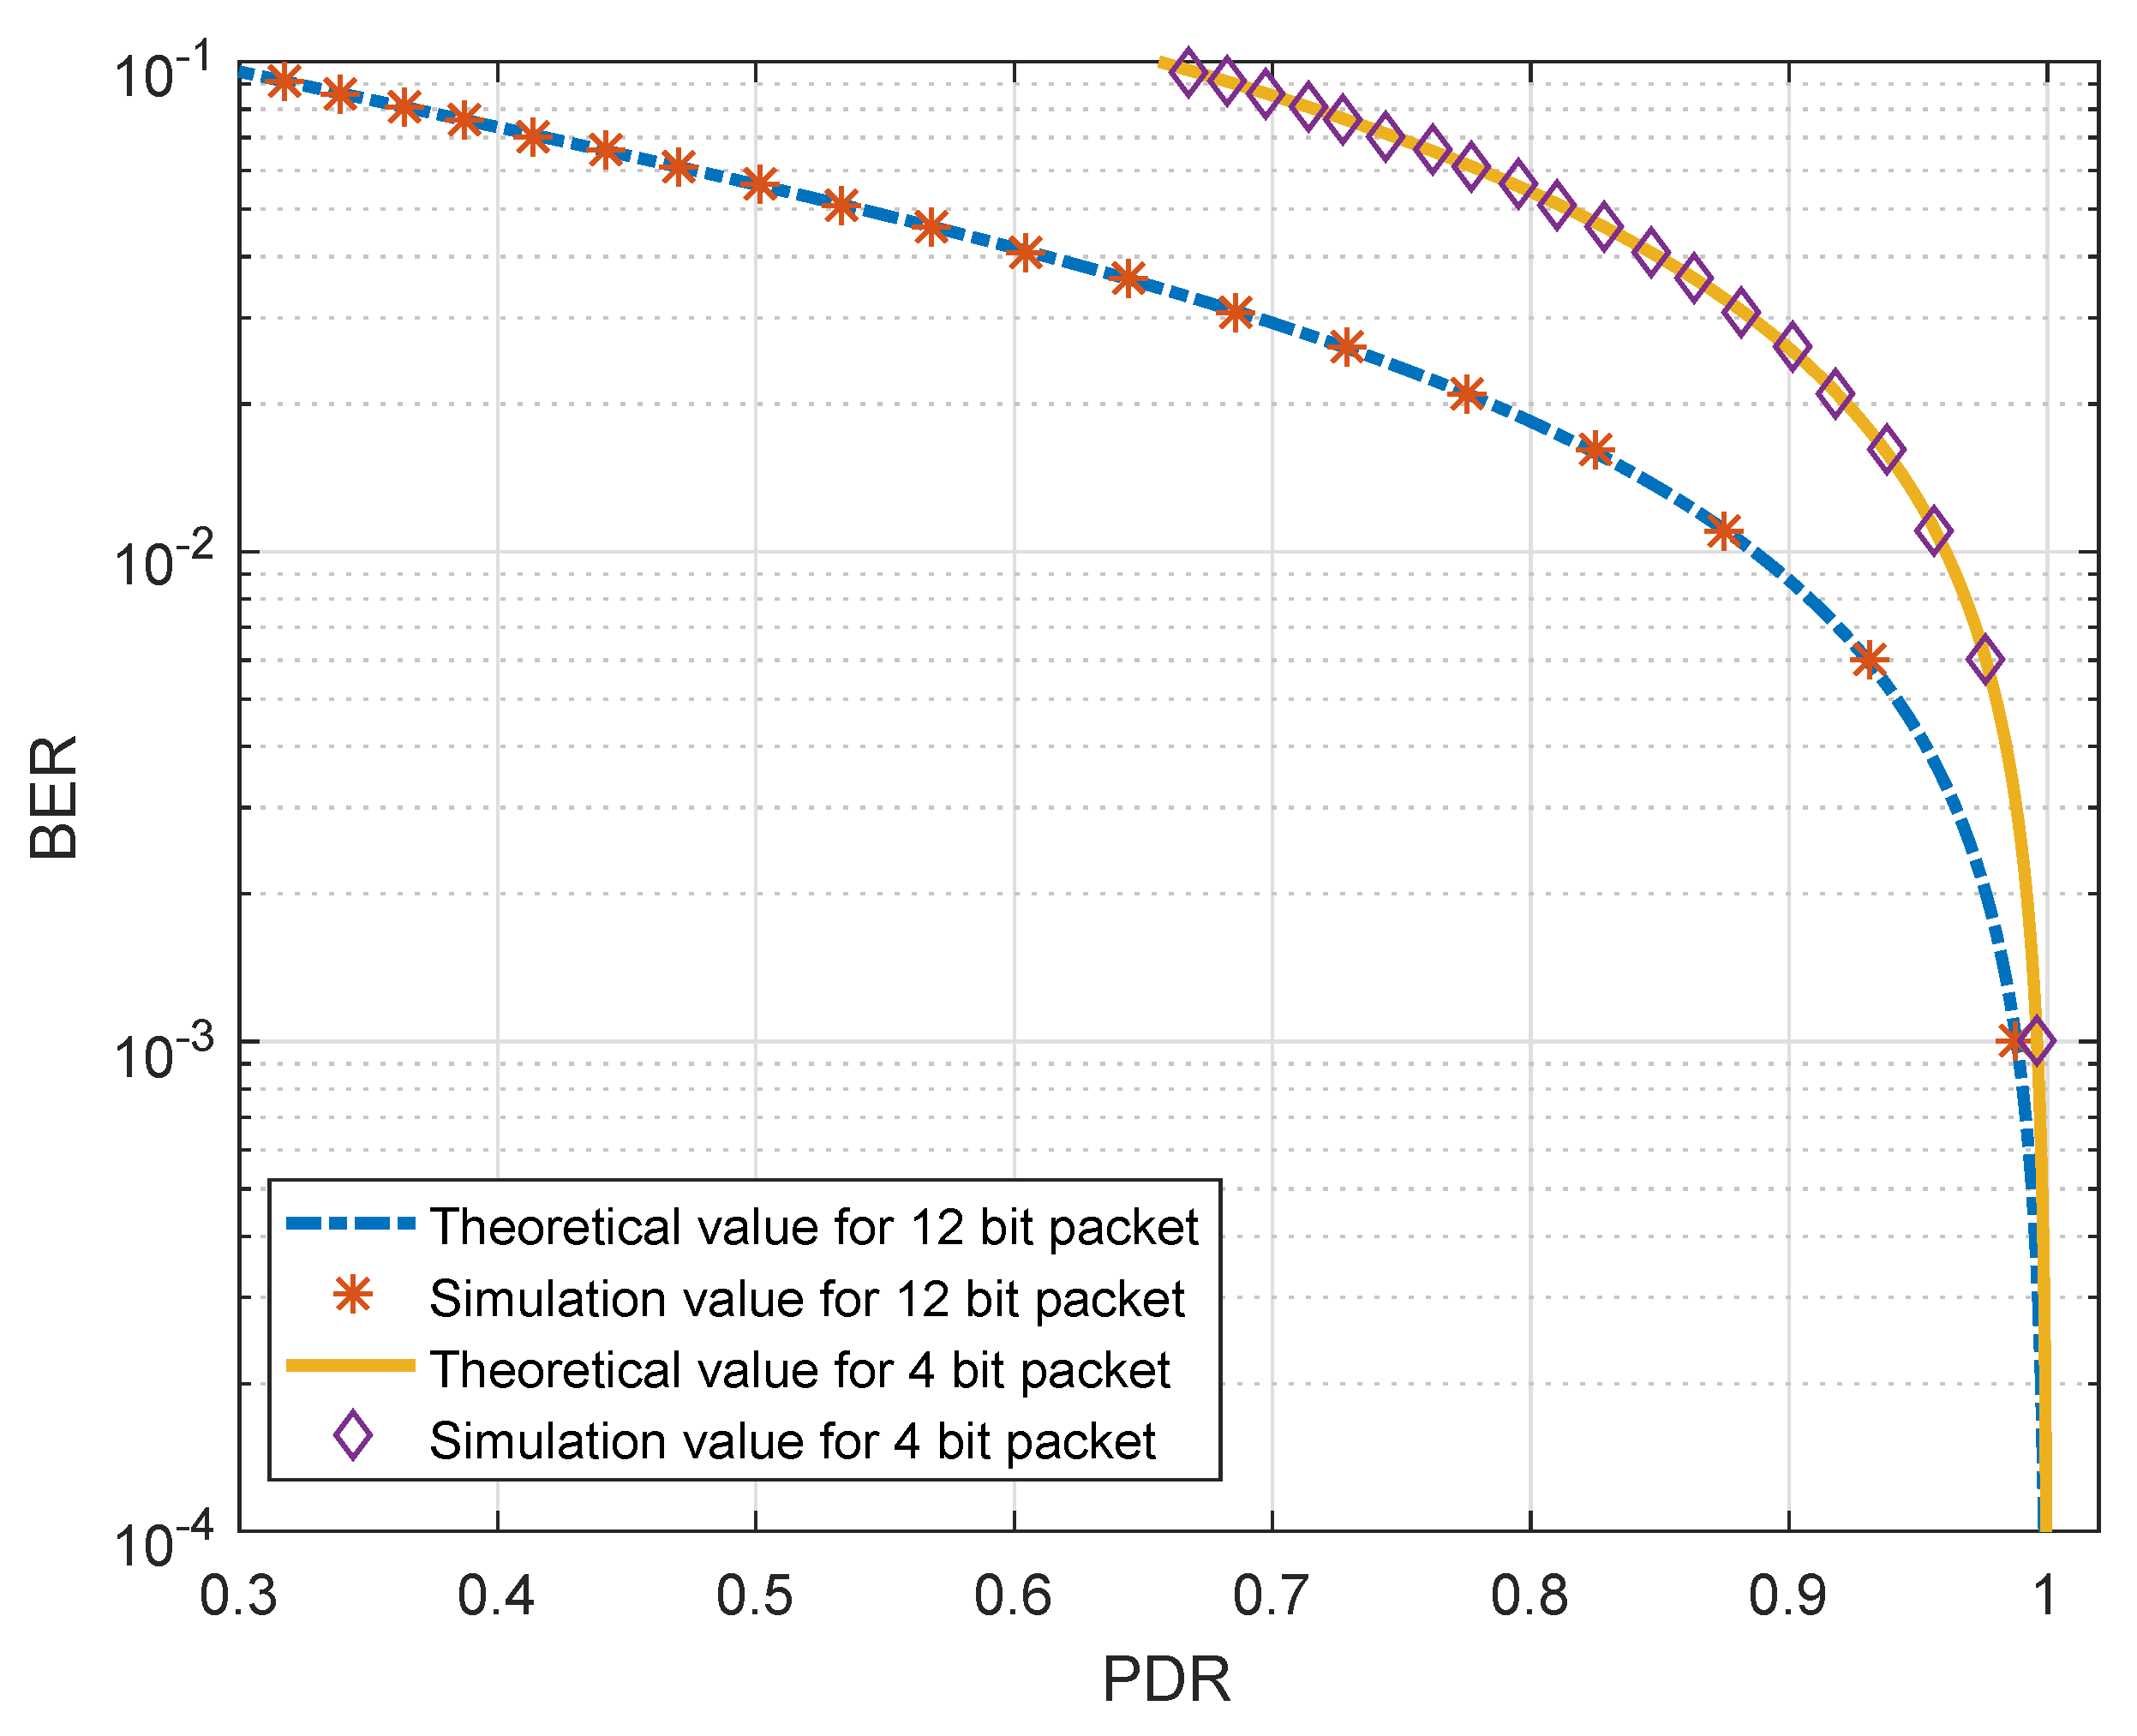
5.3. PDR vs. BER Relationship
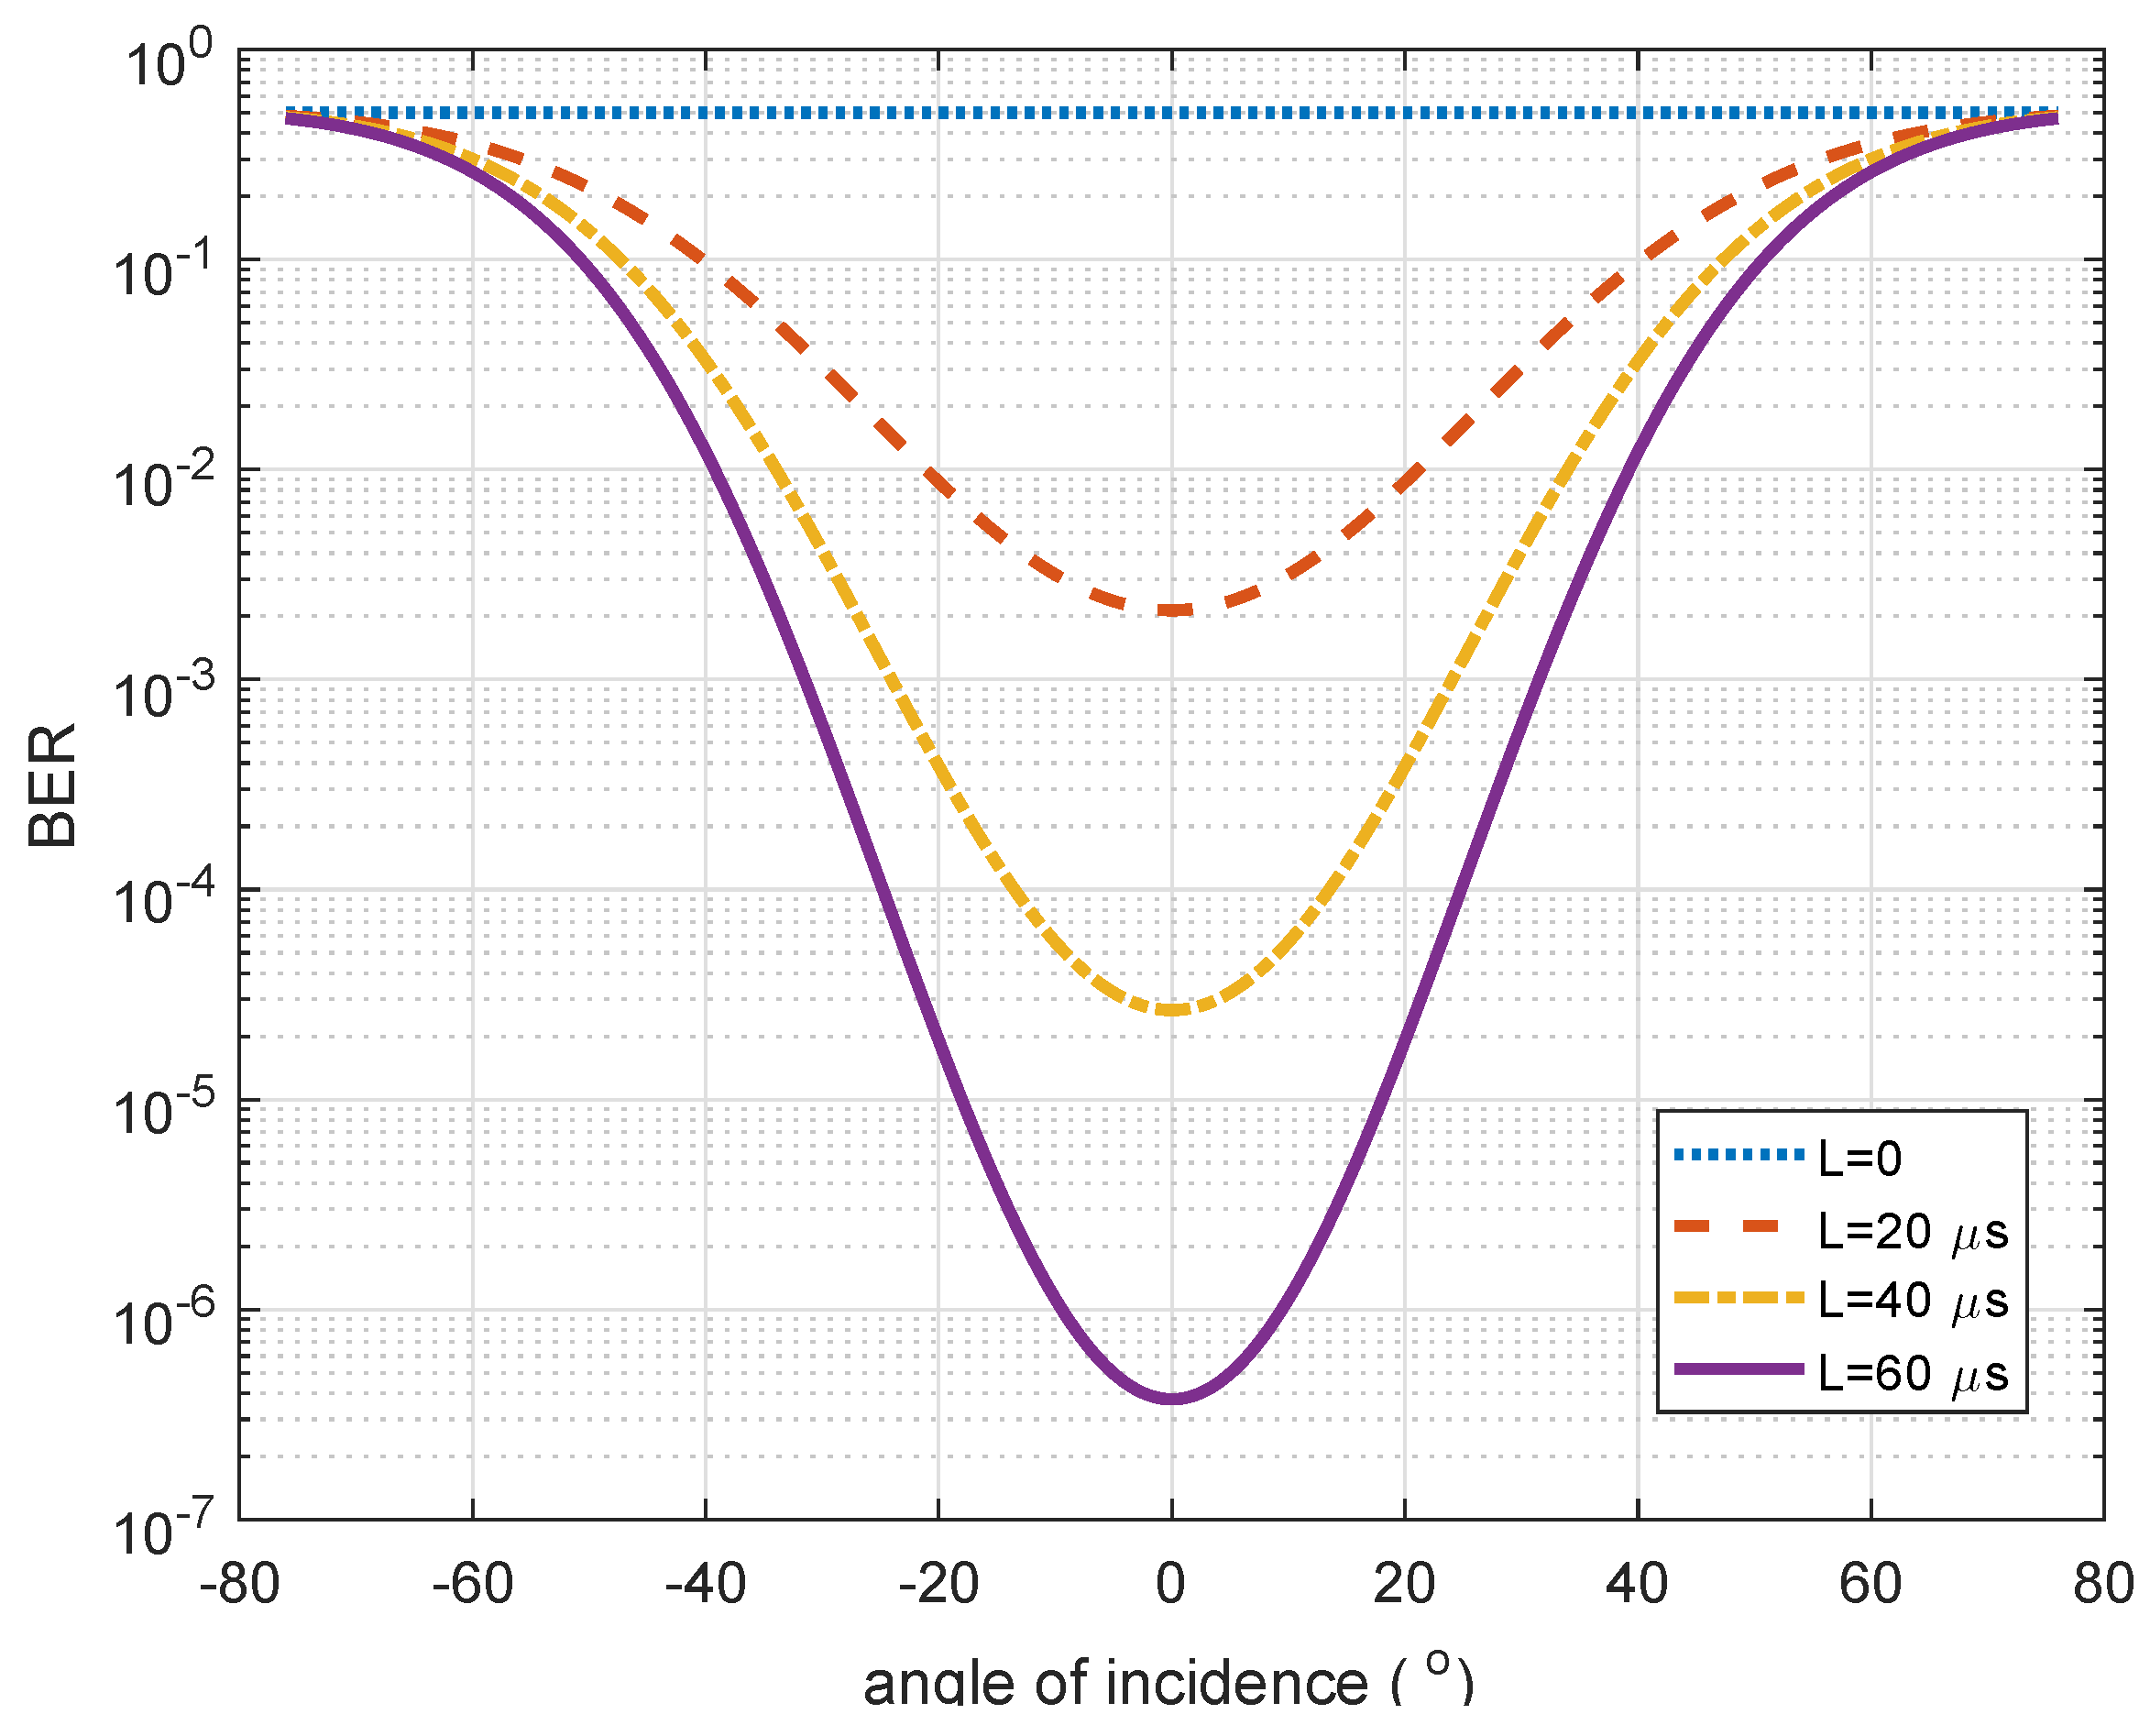
5.4. Effect of Encoding Duration on BER
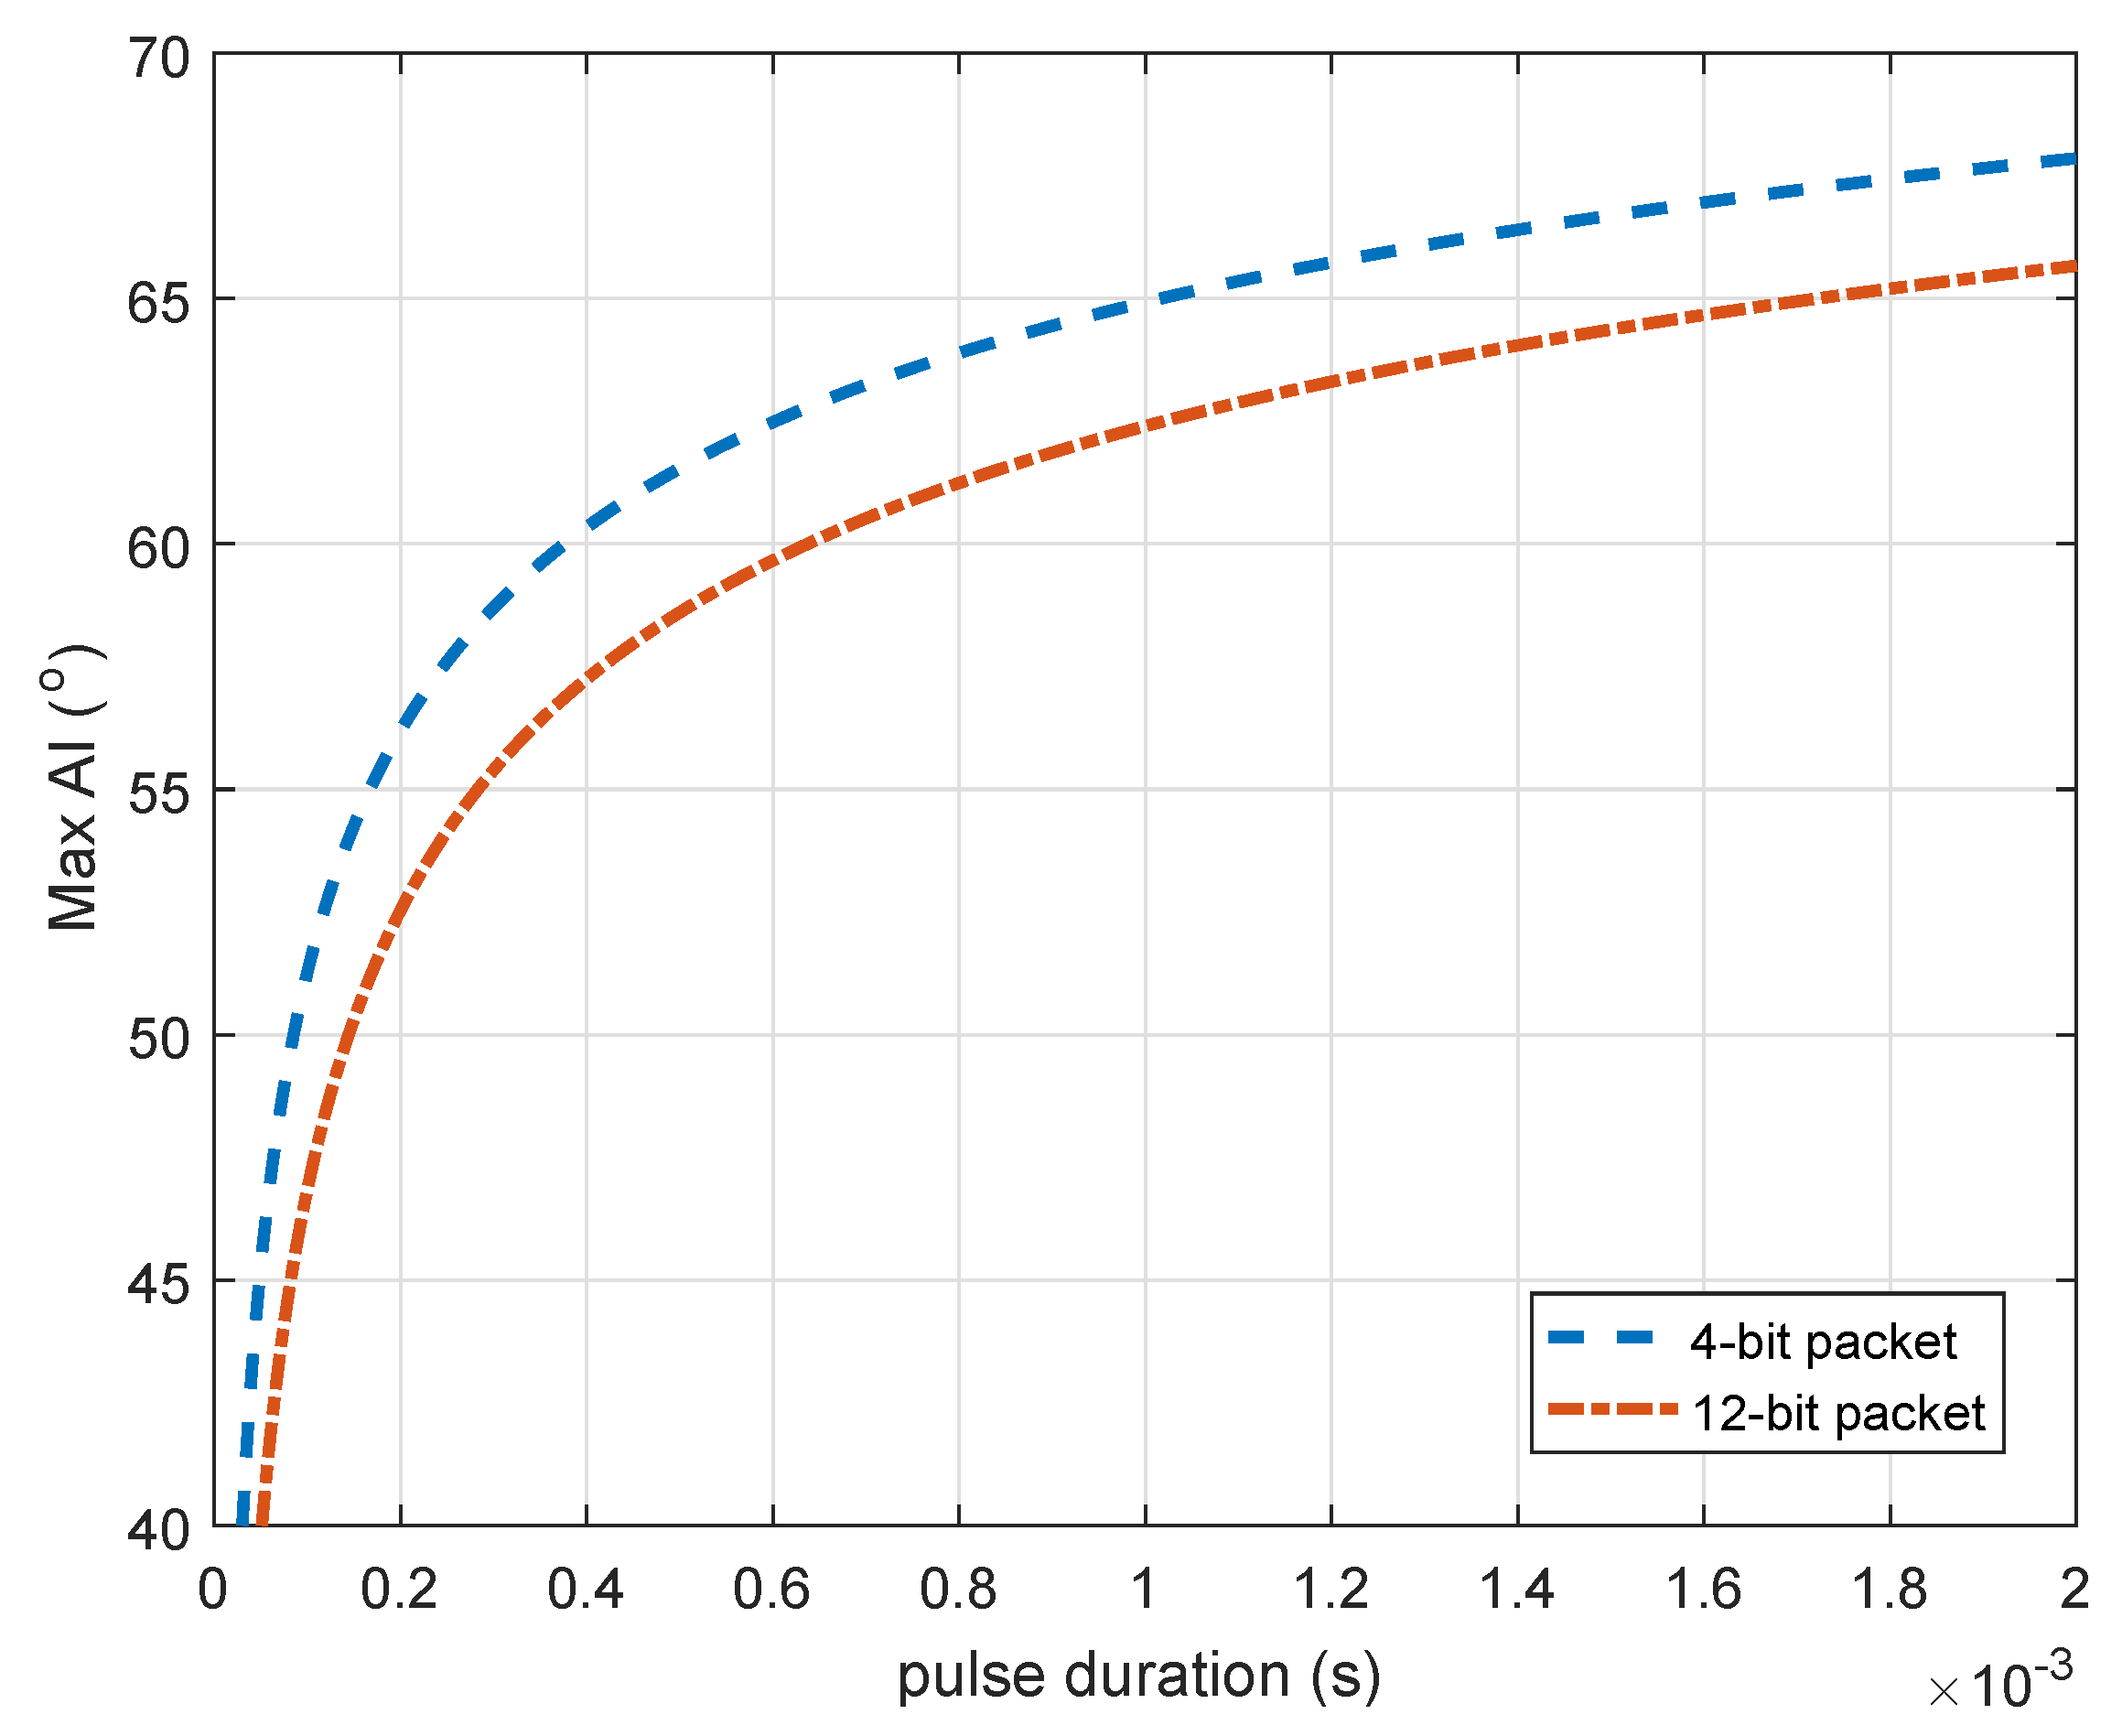
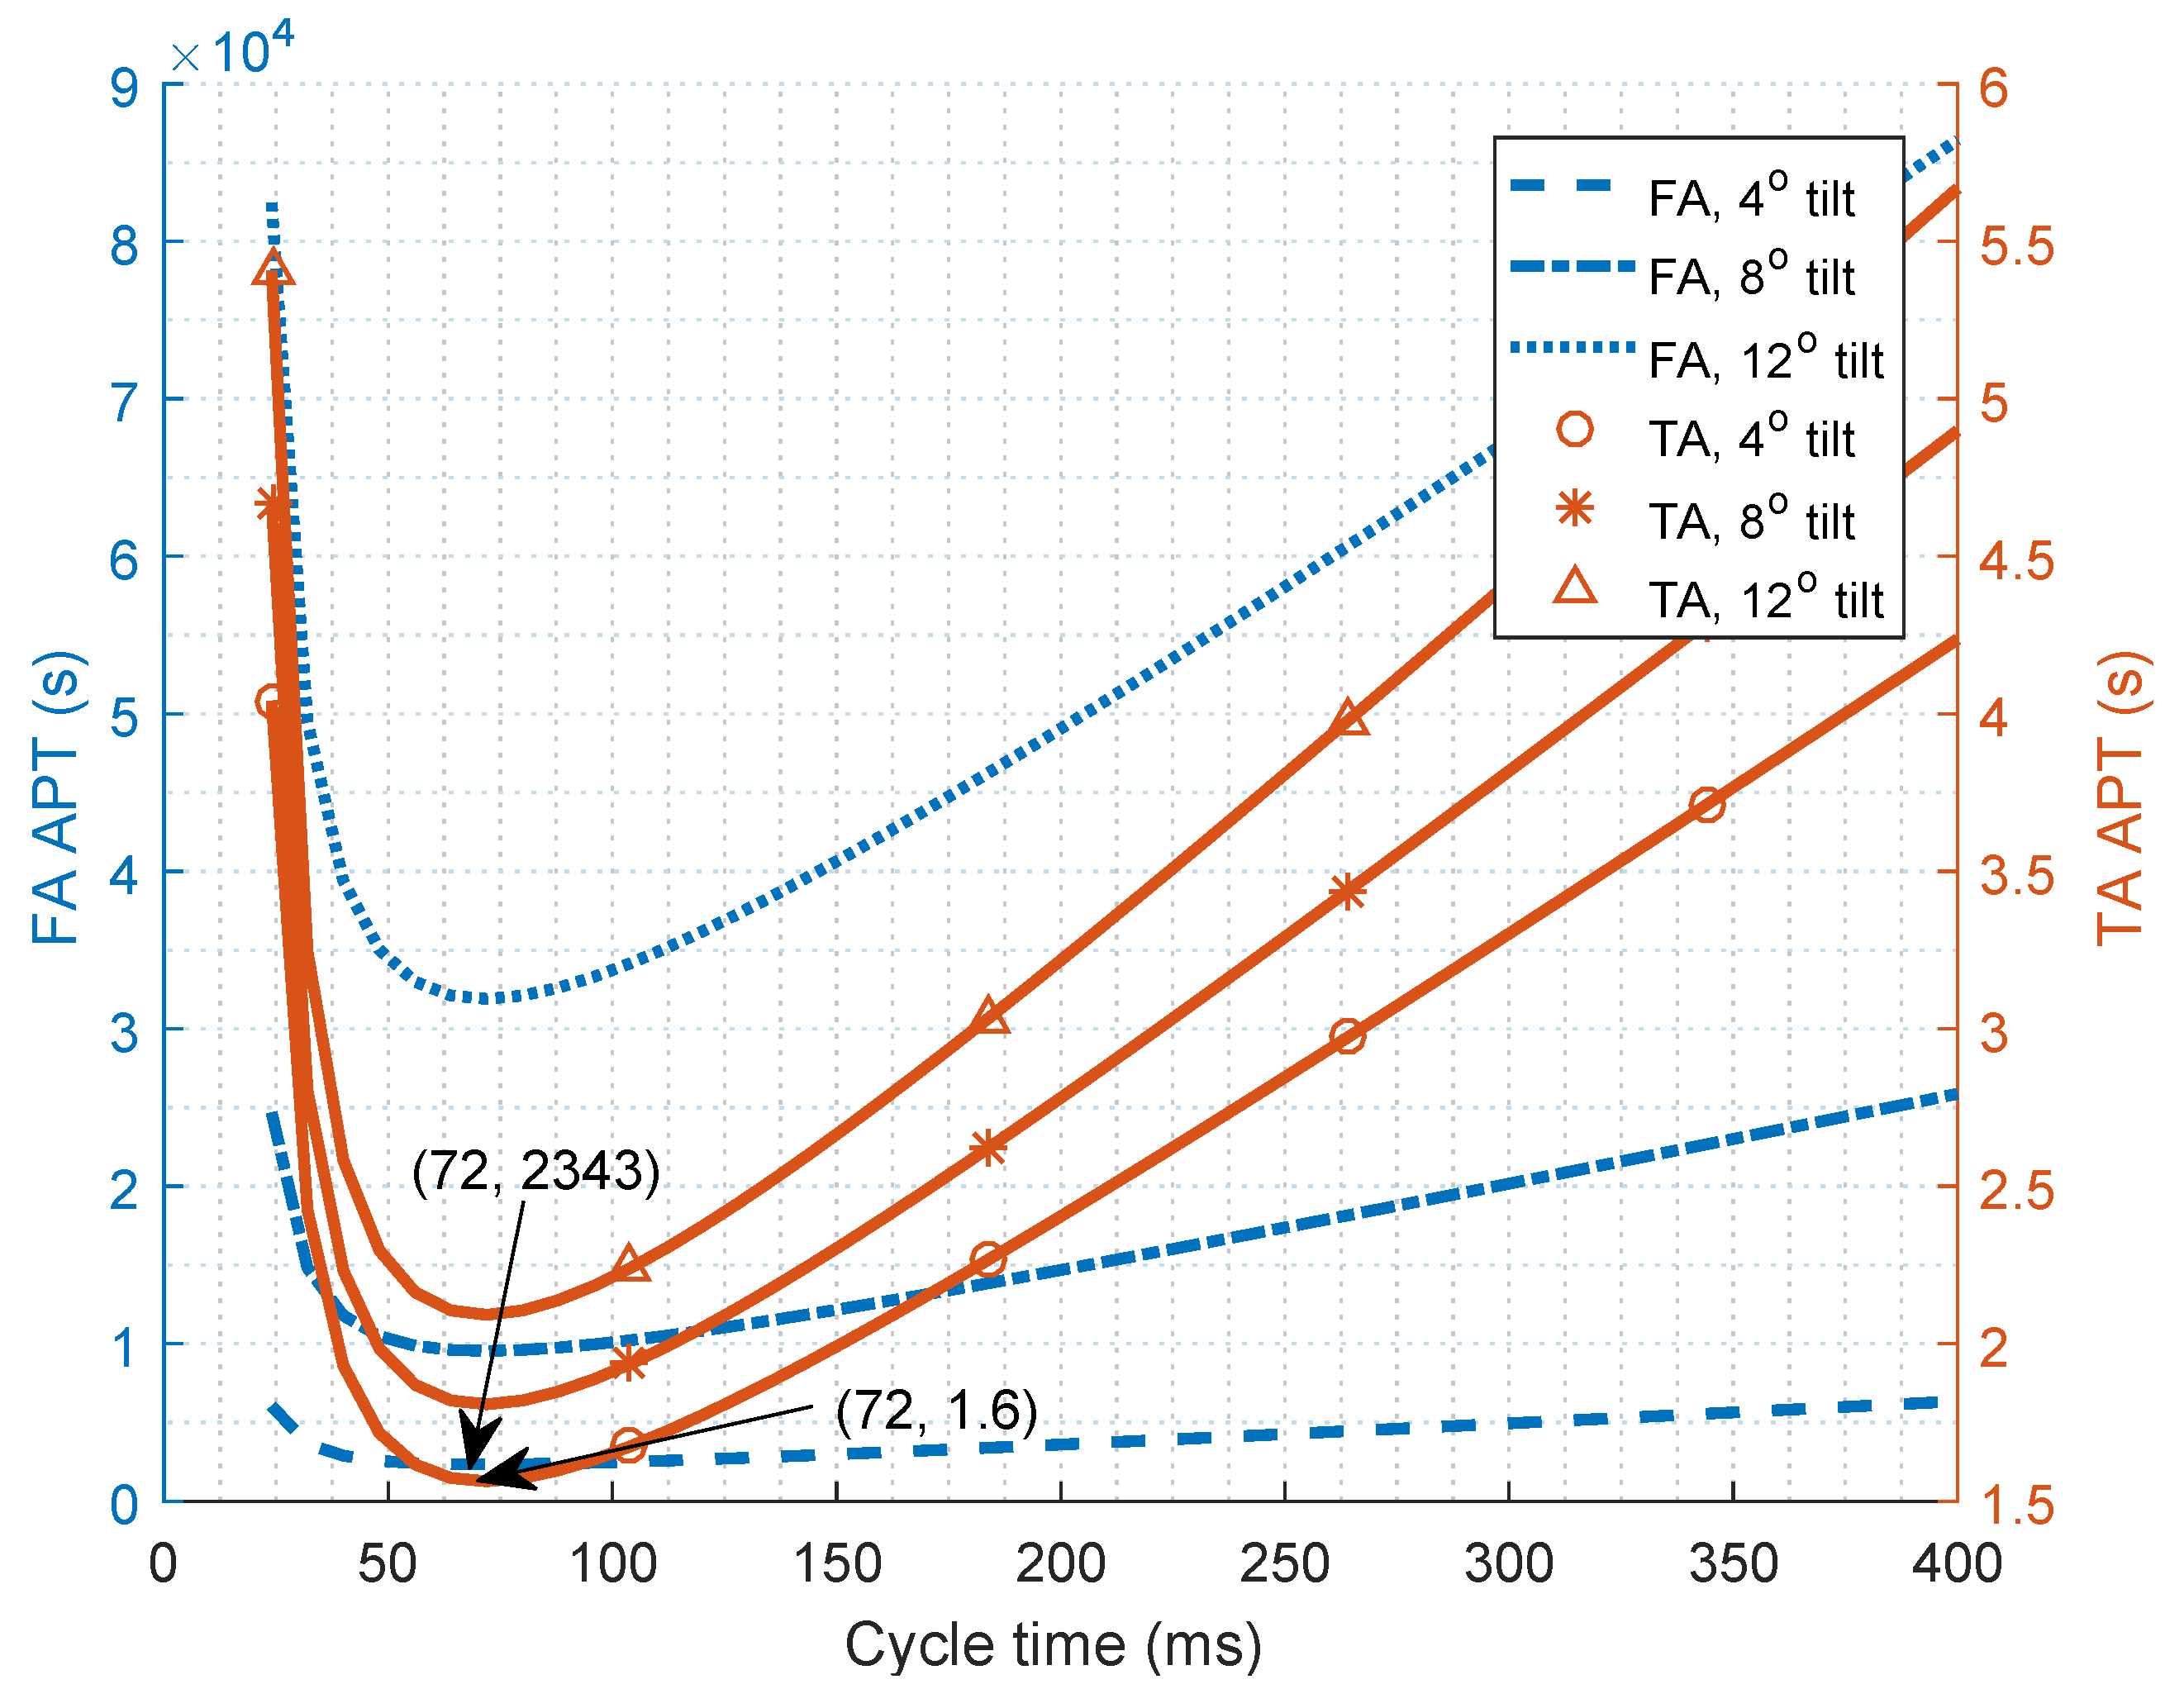
5.5. Defined Threshold Angle to Reduce for Positioning Delay
5.6. Defining Optical Boundaries to Compensate for Receiver Tilt
6. Conclusions
Author Contributions
Funding
Acknowledgments
Conflicts of Interest
Abbreviations
| LED | Light emitting diode |
| IPS | Indoor positioning system |
| RF | Radio frequency |
| RSS | Received signal strength |
| AoA | Angle of arrival |
| ToA | Time of arrival |
| TDoA | Time difference of arrival |
| PDoA | Phase difference of arrival |
| ES | Experimental setup |
| APD | Avalanche photo-diode |
| TIA | Trans-impedance amplifier |
| LNA | Low noise amplifier |
| PC | Personal computer |
| OWC | Optical wireless communication |
| MLEM | Multiple LED estimation model |
| PDM | Packet duration multiplexing |
| PD | Photo detector |
| BER | Bit error rate |
| SNR | signal-to-noise ratio |
| OOK | On-off keying |
| PDR | Packet delivery ratio |
| PWM | Pulse width modulation |
| BPC | Biphase coding |
| APT | Average positioning time |
References
- Hwang, I.; Jang, Y.J. Process Mining to Discover Shoppers? Pathways at a Fashion Retail Store Using a WiFi-Base Indoor Positioning System. IEEE Trans. Autom. Sci. Eng. 2017, 14, 1786–1792. [Google Scholar] [CrossRef]
- Rantakokko, J.; Rydell, J.; Strömbäck, P.; Händel, P.; Callmer, J.; Törnqvist, D.; Gustafsson, F.; Jobs, M.; Gruden, M. Accurate and reliable soldier and first responder indoor positioning: Multisensor systems and cooperative localization. IEEE Wirel. Commun. 2011, 18, 10–18. [Google Scholar] [CrossRef]
- Zhuang, Y.; Hua, L.; Qi, L.; Yang, J.; Cao, P.; Cao, Y.; Wu, Y.; Thompson, J.; Haas, H. A survey of positioning systems using visible LED lights. IEEE Commun. Surv. Tutor. 2018, 20, 1963–1988. [Google Scholar] [CrossRef]
- Correa, A.; Barcelo, M.; Morell, A.; Vicario, J.L. A review of pedestrian indoor positioning systems for mass market applications. Sensors 2017, 17, 1927. [Google Scholar] [CrossRef] [PubMed]
- Fang, J.; Yang, Z.; Long, S.; Wu, Z.; Zhao, X.; Liang, F.; Jiang, Z.L.; Chen, Z. High-speed indoor navigation system based on visible light and mobile phone. IEEE Photonics J. 2017, 9, 1–11. [Google Scholar] [CrossRef]
- Rabadan, J.; Guerra, V.; Rodríguez, R.; Rufo, J.; Luna-Rivera, M.; Perez-Jimenez, R. Hybrid visible light and ultrasound-based sensor for distance estimation. Sensors 2017, 17, 330. [Google Scholar] [CrossRef] [PubMed]
- Wu, F.; Liang, Y.; Fu, Y.; Geng, C. A New Indoor Positioning System Using Artificial Encoded Magnetic Fields. J. Navig. 2018, 71, 299–316. [Google Scholar] [CrossRef]
- Kim, H.S.; Kim, D.R.; Yang, S.H.; Son, Y.H.; Han, S.K. An indoor visible light communication positioning system using a RF carrier allocation technique. J. Lightw. Technol. 2013, 31, 134–144. [Google Scholar] [CrossRef]
- Nakajima, M.; Haruyama, S. New indoor navigation system for visually impaired people using visible light communication. EURASIP J. Wirel. Commun. Netw. 2013, 2013, 1–10. [Google Scholar] [CrossRef]
- Vongkulbhisal, J.; Chantaramolee, B.; Zhao, Y.; Mohammed, W.S. A fingerprinting-based indoor localization system using intensity modulation of light emitting diodes. Microw. Opt. Technol. Lett. 2012, 54, 1218–1227. [Google Scholar] [CrossRef]
- Cossu, G.; Presi, M.; Corsini, R.; Choudhury, P.; Khalid, A.M.; Ciaramella, E. A visible light localization aided optical wireless system. In Proceedings of the IEEE GLOBECOM Workshops (GC Wkshps), Houston, TX, USA, 5–9 December 2011; pp. 802–807. [Google Scholar]
- Del Campo-Jimenez, G.; Perandones, J.M.; Lopez-Hernandez, F.J. A VLC-based beacon location system for mobile applications. In Proceedings of the IEEE International Conference on Localization and GNSS (ICL-GNSS), Turin, Italy, 25–27 June 2013; pp. 1–4. [Google Scholar]
- Xu, W.; Wang, J.; Shen, H.; Zhang, H.; You, X. Indoor positioning for multiphotodiode device using visible-light communications. IEEE Photonics J. 2016, 8, 1–11. [Google Scholar] [CrossRef]
- Zhou, Z.; Kavehrad, M.; Deng, P. Indoor positioning algorithm using light-emitting diode visible light communications. Opt. Eng. 2012, 51, 085009. [Google Scholar] [CrossRef]
- Luo, J.; Fan, L.; Li, H. Indoor Positioning Systems Based on Visible Light Communication: State of the Art. IEEE Commun. Surv. Tutor. 2017, 19, 2871–2893. [Google Scholar] [CrossRef]
- Dividis, K. Design and Prototyping of a Visible Light Indoor Positioning System; Stan Ackermans Institute: Delft, The Netherlands, 2007. [Google Scholar]
- Zhang, W.; Kavehrad, M. A 2-D indoor localization system based on visible light LED. In Proceedings of the IEEE Photonics Society Summer Topical Meeting Series, Seattle, WA, USA, 9–11 July 2012; pp. 80–81. [Google Scholar]
- Sertthin, C.; Tsuji, E.; Nakagawa, M.; Kuwano, S.; Watanabe, K. A switching estimated receiver position scheme for visible light based indoor positioning system. In Proceedings of the 4th IEEE International Symposium on Wireless Pervasive Computing (ISWPC), Melbourne, Australia, 11–13 February 2009; pp. 1–5. [Google Scholar]
- Lee, Y.U.; Kavehrad, M. Long-range indoor hybrid localization system design with visible light communications and wireless network. In Proceedings of the IEEE Photonics Society Summer Topical Meeting Series, Seattle, WA, USA, 9–11 July 2012; pp. 82–83. [Google Scholar]
- Jung, S.Y.; Hann, S.; Park, S.; Park, C.S. Optical wireless indoor positioning system using light emitting diode ceiling lights. Microw. Opt. Technol. Lett. 2012, 54, 1622–1626. [Google Scholar] [CrossRef]
- Lim, J. Ubiquitous 3D positioning systems by LED-based visible light communications. IEEE Wirel. Commun. 2015, 22, 80–85. [Google Scholar] [CrossRef]
- Kail, G.; Maechler, P.; Preyss, N.; Burg, A. Robust asynchronous indoor localization using LED lighting. In Proceedings of the IEEE International Conference on Acoustics, Speech and Signal Processing (ICASSP), Florence, Italy, 4–9 May 2014; pp. 1866–1870. [Google Scholar]
- Wang, C.; Wang, L.; Chi, X.; Liu, S.; Shi, W.; Deng, J. The research of indoor positioning based on visible light communication. China Commun. 2015, 12, 85–92. [Google Scholar] [CrossRef]
- Kim, B.Y.; Cho, J.S.; Park, Y.; Kim, K.D. Implementation of indoor positioning using LED and dual PC cameras. In Proceedings of the 4th IEEE International Conference on Ubiquitous and Future Networks (ICUFN), Phuket, Thailand, 4–6 July 2012; pp. 476–477. [Google Scholar]
- Biagi, M.; Vegni, A.M.; Little, T.D. LAT indoor MIMO-VLC Localize, access and transmit. In Proceedings of the IEEE International Workshop on Optical Wireless Communications (IWOW), Pisa, Italy, 22 Octobet 2012; pp. 1–3. [Google Scholar]
- Vegni, A.M.; Biagi, M. An indoor localization algorithm in a small-cell LED-based lighting system. In Proceedings of the IEEE International Conference on Indoor Positioning and Indoor Navigation (IPIN) 2012, Sydney, Australia, 13–15 November 2012; pp. 1–7. [Google Scholar]
- Yang, S.H.; Kim, D.R.; Kim, H.S.; Son, Y.H.; Han, S.K. Indoor positioning system based on visible light using location code. In Proceedings of the IEEE Fourth International Conference on Communications and Electronics (ICCE), Hue, Vietnam, 1–3 August 2012; pp. 360–363. [Google Scholar]
- Yoshino, M.; Haruyama, S.; Nakagawa, M. High-accuracy positioning system using visible LED lights and image sensor. In Proceedings of the IEEE Radio and Wireless Symposium, Orlando, FL, USA, 22–24 January 2008; pp. 439–442. [Google Scholar]
- Tanaka, T.; Haruyama, S. New position detection method using image sensor and visible light LEDs. In Proceedings of the Second IEEE International Conference on Machine Vision (ICMV), Dubai, UAE, 28–30 December 2009; pp. 150–153. [Google Scholar]
- Rahman, M.S.; Haque, M.M.; Kim, K.D. Indoor positioning by LED visible light communication and image sensors. Int. J. Electr. Comput. Eng. 2011, 1, 161–170. [Google Scholar] [CrossRef]
- Xu, Y.; Zhao, J.; Shi, J.; Chi, N. Reversed Three-Dimensional Visible Light Indoor Positioning Utilizing Annular Receivers with Multi-Photodiodes. Sensors 2016, 16, 1254. [Google Scholar] [CrossRef]
- Nasar, A.W.; Sohail, M.; Bokhari, S.M.A.; Kasi, J.K.; Kasi, A.K. Implementation of visible light communication based system for indoor positioning. MATTER Int. J. Sci. Technol. 2017, 3, 67–80. [Google Scholar] [CrossRef]
- Peng, Q.; Guan, W.; Wu, Y.; Cai, Y.; Xie, C.; Wang, P. Three-dimensional high-precision indoor positioning strategy using Tabu search based on visible light communication. Opt. Eng. 2018, 57, 016101. [Google Scholar] [CrossRef]
- Jung, S.Y.; Hann, S.; Park, C.S. TDOA-based optical wireless indoor localization using LED ceiling lamps. IEEE Trans. Consum. Electron. 2011, 57, 1592–1597. [Google Scholar] [CrossRef]
- Do, T.H.; Yoo, M. TDOA-based indoor positioning using visible light. Photonic Netw. Commun. 2014, 27, 80–88. [Google Scholar] [CrossRef]
- Choi, Y.H.; Park, I.H.; Kim, Y.H.; Kim, J.Y. Novel LBS technique based on visible light communications. In Proceedings of the IEEE International Conference on Consumer Electronics (ICCE), Las Vegas, NV, USA, 13–16 January 2012; pp. 576–577. [Google Scholar]
- Nah, J.; Parthiban, R.; Jaward, M. Visible light communications localization using TDOA-based coherent heterodyne detection. In Proceedings of the 4th IEEE International Conference on Photonics (ICP), Melaka, Malaysia, 28–30 October 2013; pp. 247–249. [Google Scholar]
- Panta, K.; Armstrong, J. Indoor localisation using white LEDs. Electron. Lett. 2012, 48, 228–230. [Google Scholar] [CrossRef]
- Kuo, Y.S.; Pannuto, P.; Hsiao, K.J.; Dutta, P. Luxapose: Indoor positioning with mobile phones and visible light. In Proceedings of the 20th Annual International Conference on Mobile Computing and Networking, Maui, HI, USA, 7–11 September 2014; pp. 447–458. [Google Scholar]
- Lee, S.; Jung, S.Y. Location awareness using angle-of-arrival based circular-PD-array for visible light communication. In Proceedings of the 18th Asia-Pacific Conference on Communications (APCC), Jeju Island, Korea, 15–17 October 2012; pp. 480–485. [Google Scholar]
- Liu, X.; Makino, H.; Maeda, Y. Basic study on indoor location estimation using visible light communication platform. In Proceedings of the 30th IEEE Annual International Conference of the Engineering in Medicine and Biology Society, Vancouver, BC, Canada, 20–25 August 2008; pp. 2377–2380. [Google Scholar]
- Kim, H.S.; Kim, D.R.; Yang, S.H.; Son, Y.H.; Han, S.K. Inter-cell interference mitigation and indoor positioning system based on carrier allocation visible light communication. In Proceedings of the 5th International Conference on Signal Processing and Communication Systems (ICSPCS), Honolulu, HI, USA, 12–14 December 2011; pp. 1–7. [Google Scholar]
- Arafa, A.; Dalmiya, S.; Klukas, R.; Holzman, J.F. Angle-of-arrival reception for optical wireless location technology. Opt. Express 2015, 23, 7755–7766. [Google Scholar] [CrossRef] [PubMed]
- Yang, S.H.; Jung, E.M.; Han, S.K. Indoor location estimation based on LED visible light communication using multiple optical receivers. IEEE Commun. Lett. 2013, 17, 1834–1837. [Google Scholar] [CrossRef]
- Luo, P.; Zhang, M.; Zhang, X.; Cai, G.; Han, D.; Li, Q. An indoor visible light communication positioning system using dual-tone multi-frequency technique. In Proceedings of the 2nd International Workshop on Optical Wireless Communications (IWOW), Newcastle upon Tyne, UK, 21 October 2013; pp. 25–29. [Google Scholar]
- Jung, S.Y.; Choi, C.K.; Heo, S.H.; Lee, S.R.; Park, C.S. Received signal strength ratio based optical wireless indoor localization using light emitting diodes for illumination. In Proceedings of the IEEE International Conference on Consumer Electronics (ICCE), Las Vegas, NV, USA, 11–14 January 2013; pp. 63–64. [Google Scholar]
- Li, L.; Hu, P.; Peng, C.; Shen, G.; Zhao, F. Epsilon: A visible light based positioning system. In Proceedings of the 11th USENIX Symposium on Networked Systems Design and Implementation (NSDI 14), Seattle, WA, USA, 2–4 April 2014; pp. 331–343. [Google Scholar]
- Zhang, W.; Chowdhury, M.S.; Kavehrad, M. Asynchronous indoor positioning system based on visible light communications. Opt. Eng. 2014, 53, 045105. [Google Scholar] [CrossRef]
- Rahaim, M.; Prince, G.B.; Little, T.D. State estimation and motion tracking for spatially diverse VLC networks. In Proceedings of the IEEE Globecom Workshops (GC Wkshps), Anaheim, CA, USA, 3–7 December 2012; pp. 1249–1253. [Google Scholar]
- Aminikashani, M.; Gu, W.; Kavehrad, M. Indoor positioning with OFDM visible light communications. In Proceedings of the 13th IEEE Annual Consumer Communications & Networking Conference (CCNC), Las Vegas, NV, USA, 9–12 January 2016; pp. 505–510. [Google Scholar]
- Yamaguchi, S.; Mai, V.V.; Thang, T.C.; Pham, A.T. Design and performance evaluation of VLC indoor positioning system using optical orthogonal codes. In Proceedings of the IEEE Fifth International Conference on Communications and Electronics (ICCE), Danang, Vietnam, 30 July–1 August 2014; pp. 54–59. [Google Scholar]
- Kim, Y.; Hwang, J.; Lee, J.; Yoo, M. Position estimation algorithm based on tracking of received light intensity for indoor visible light communication systems. In Proceedings of the Third International Conference on Ubiquitous and Future Networks (ICUFN), Dalian, China, 15–17 June 2011; pp. 131–134. [Google Scholar]
- Gu, W.; Zhang, W.; Wang, J.; Kashani, M.; Kavehrad, M. Three dimensional indoor positioning based on visible light with gaussian mixture sigma-point particle filter technique. In Proceedings of the Broadband Access Communication Technologies IX, San Francisco, CA, USA, 7–12 February 2015. [Google Scholar]
- Gu, W.; Aminikashani, M.; Deng, P.; Kavehrad, M. Impact of multipath reflections on the performance of indoor visible light positioning systems. J. Lightw. Technol. 2016, 34, 2578–2587. [Google Scholar] [CrossRef]
- Jeong, E.M.; Yang, S.H.; Kim, H.S.; Han, S.K. Tilted receiver angle error compensated indoor positioning system based on visible light communication. Electron. Lett. 2013, 49, 890–892. [Google Scholar] [CrossRef]
- Luo, Z.; Zhang, W.; Zhou, G. Improved Spring Model-Based Collaborative Indoor Visible Light Positioning; Springer: Berlin, Germany, 2016; Volume 23, pp. 479–486. [Google Scholar]
- Pergoloni, S.; Mohamadi, Z.; Vegni, A.M.; Ghassemlooy, Z.; Biagi, M. Metameric Indoor Localization Schemes Using Visible Lights. J. Lightw. Technol. 2017, 35, 2933–2942. [Google Scholar] [CrossRef]
- Zhang, R.; Zhong, W.D.; Kemao, Q.; Zhang, S. A Single LED Positioning System Based on Circle Projection. IEEE Photonics J. 2017, 9, 1–9. [Google Scholar] [CrossRef]
- Nakazawa, Y.; Makino, H.; Nishimori, K.; Wakatsuki, D.; Komagata, H. Indoor positioning using a high-speed, fish-eye lens-equipped camera in visible light communication. In Proceedings of the IEEE International Conference on Indoor Positioning and Indoor Navigation (IPIN), Montbeliard-Belfort, France, 28–31 October 2013; pp. 1–8. [Google Scholar]
- Yang, Z.; Wang, Z.; Zhang, J.; Huang, C.; Zhang, Q. Wearables can afford: Light-weight indoor positioning with visible light. In Proceedings of the 13th Annual International Conference on Mobile Systems, Applications, and Services, Florence, Italy, 18–22 May 2015; pp. 317–330. [Google Scholar]
- Hossan, M.; Chowdhury, M.Z.; Islam, A.; Jang, Y.M. A novel indoor mobile localization system based on optical camera communication. Wirel. Commun. Mob. Comput. 2018, 2018, 9353428. [Google Scholar] [CrossRef]
- Zhang, R.; Zhong, W.D.; Qian, K.; Wu, D. Image Sensor Based Visible Light Positioning System with Improved Positioning Algorithm. IEEE Access 2017, 5, 6087–6094. [Google Scholar] [CrossRef]
- Chen, L.W.; Chen, C.R.; Chen, D.E. VIPS: A video-based indoor positioning system with centimeter-grade accuracy for the IoT. In Proceedings of the IEEE International Conference on Pervasive Computing and Communications Workshops (PerCom Workshops), Kona, HI, USA, 13–17 March 2017; pp. 63–65. [Google Scholar]
- Lin, B.; Ghassemlooy, Z.; Lin, C.; Tang, X.; Li, Y.; Zhang, S. An Indoor Visible Light Positioning System Based on Optical Camera Communications. IEEE Photonics Technol. Lett. 2017, 29, 579–582. [Google Scholar] [CrossRef]
- Zheng, Y.; Shen, G.; Li, L.; Zhao, C.; Li, M.; Zhao, F. Travi-navi: Self-deployable indoor navigation system. IEEE/ACM Trans. Netw. 2017, 25, 2655–2669. [Google Scholar] [CrossRef]
- Popoola, O.R.; Sinanovic, S. Design and Analysis of Collision Reduction Algorithms for LED-based Indoor Positioning with Simulation and Experimental Validation. IEEE Access 2018, 6, 10754–10770. [Google Scholar] [CrossRef]
- Di Renzo, M.; Haas, H.; Ghrayeb, A.; Sugiura, S.; Hanzo, L. Spatial modulation for generalized MIMO: Challenges, opportunities, and implementation. Proc. IEEE 2014, 102, 56–103. [Google Scholar] [CrossRef]
- Winzer, P.J.; Essiambre, R.J. Advanced optical modulation formats. Proc. IEEE 2006, 94, 952–985. [Google Scholar] [CrossRef]
- Zeng, L.; O’Brien, D.C.; Le Minh, H.; Faulkner, G.E.; Lee, K.; Jung, D.; Oh, Y.; Won, E.T. High data rate multiple input multiple output (MIMO) optical wireless communications using white LED lighting. IEEE J. Sel. Areas Commun. 2009, 27, 10754–10770. [Google Scholar] [CrossRef]
- Jalajakumari, A.V.; Xie, E.; McKendry, J.; Gu, E.; Dawson, M.D.; Haas, H.; Henderson, R.K. High-speed integrated digital to light converter for short range visible light communication. IEEE Photonics Technol. Lett. 2017, 29, 118–121. [Google Scholar] [CrossRef]
- Uysal, M.; Miramirkhani, F.; Narmanlioglu, O.; Baykas, T.; Panayirci, E. IEEE 802.15. 7r1 reference channel models for visible light communications. IEEE Commun. Mag. 2017, 55, 212–217. [Google Scholar] [CrossRef]
- Islim, M.S.; Ferreira, R.X.; He, X.; Xie, E.; Videv, S.; Viola, S.; Watson, S.; Bamiedakis, N.; Penty, R.V.; White, I.H.; et al. Towards 10 Gb/s orthogonal frequency division multiplexing-based visible light communication using a GaN violet micro-LED. Photonics Res. 2017, 5, A35–A43. [Google Scholar] [CrossRef]
- Fletcher, A.S.; Hamilton, S.A.; Moores, J.D. Undersea laser communication with narrow beams. IEEE Commun. Mag. 2015, 53, 49–55. [Google Scholar] [CrossRef]
- Zafar, F.; Bakaul, M.; Parthiban, R. Laser-Diode-Based Visible Light Communication: Toward Gigabit Class Communication. IEEE Commun. Mag. 2017, 55, 144–151. [Google Scholar] [CrossRef]
- Popoola, O.; Ogunkoya, F.; Popoola, W.; Ramirez-Iniguez, R.; Sinanović, S. Indoor localization based on multiple LEDs position estimation. In Proceedings of the 17th IEEE International Workshop on Signal Processing Advances in Wireless Communications (SPAWC), Edinburgh, UK, 3–6 July 2016; pp. 1–6. [Google Scholar]
- Lee, Y.U.; Kavehrad, M. Two hybrid positioning system design techniques with lighting LEDs and ad-hoc wireless network. IEEE Trans. Consum. Electron. 2012, 58, 1176–1184. [Google Scholar] [CrossRef]
- Ajmani, M.; Sinanović, S.; Boutaleb, T. Optical Wireless Communication Based Indoor Positioning Algorithms: Performance Optimisation and Mathematical Modelling. Computation 2019, 7, 1. [Google Scholar] [CrossRef]
- Popoola, O.R.; Popoola, W.O.; Ramirez-Iniguez, R.; Sinanovic, S. Optimization of duty cycles for LED based indoor positioning system. In Proceedings of the IEEE International Conference for Students on Applied Engineering (ICSAE), Newcastle upon Tyne, UK, 20–21 October 2016; pp. 368–372. [Google Scholar] [CrossRef]
- Gu, W.; Zhang, W.; Kavehrad, M.; Feng, L. Three-dimensional light positioning algorithm with filtering techniques for indoor environments. Opt. Eng. 2014, 53, 107107. [Google Scholar] [CrossRef]
- Ghassemlooy, Z.; Popoola, W.; Rajbhandari, S. Optical Wireless Communications: System and Channel Modelling with MATLAB®; CRC Press: Boca Raton, FL, USA, 2012. [Google Scholar]
- Dimitrov, S.; Haas, H. Principles of LED Light Communications: Towards Networked Li-Fi; Cambridge University Press: Cambridge, UK, 2015. [Google Scholar]
- Kahn, J.M.; Barry, J.R. Wireless infrared communications. Proc. IEEE 1997, 85, 265–298. [Google Scholar] [CrossRef]
- Freude, W.; Schmogrow, R.; Nebendahl, B.; Winter, M.; Josten, A.; Hillerkuss, D.; Koenig, S.; Meyer, J.; Dreschmann, M.; Huebner, M.; et al. Quality metrics for optical signals: Eye diagram, Q-factor, OSNR, EVM and BER. In Proceedings of the 14th IEEE International Conference on Transparent Optical Networks (ICTON), Coventry, UK, 2–5 July 2012; pp. 1–4. [Google Scholar]
- Ibrahim, M.H.; Shaban, H.A.; Aly, M.H. Effect of different weather conditions on BER performance of single-channel free space optical links. Opt.-Int. J. Light Electron Opt. 2017, 137, 291–297. [Google Scholar] [CrossRef]
- Popoola, O.R.; Popoola, W.O.; Ramirez-Iniguez, R.; Sinanović, S. Design of improved IR protocol for LED indoor positioning system. In Proceedings of the 13th International Wireless Communications and Mobile Computing Conference (IWCMC), Valencia, Spain, 26–30 June 2017; pp. 882–887. [Google Scholar]
- Semiconductors, V. Data Fotmats for IR Remote Control; Vishay: Malvern, PA, USA, 2013; pp. 7–11. [Google Scholar]
- Masson, A.E.; Hignett, S.; Gyi, D.E. Anthropometric Study to Understand Body Size and Shape for Plus Size People at Work. Procedia Manuf. 2015, 3, 5647–5654. [Google Scholar] [CrossRef]
- Augmented, S.L. Application Note: Implementation of Transmitters and Receivers for Infrared Remote Control Protocols with MCUs of the STM32F0 and STM32F3 Series. 2016. Available online: www.st.com (accessed on 11 November 2017).
- Albrecht, H.; Wötzel, C.; Erasmus, L.; Kleinpeter, M.; König, N.; Pöllmann, W. Day-to-day variability of maximum walking distance in MS patients can mislead to relevant changes in the Expanded Disability Status Scale (EDSS): Average walking speed is a more constant parameter. Mult. Scler. 2001, 7, 105–109. [Google Scholar] [CrossRef]


| Algorithm | Reference | Accuracy | Complexity | Receiver System | |
|---|---|---|---|---|---|
| Exp Results | Sim Results | ||||
| Proximity | [9] | 1–2 m | Low | Mobile phone | |
| [16] | m | Medium | Exp-Setup, dsPIC Board | ||
| [12] | 4.5 m | Medium | MSP 430 | ||
| [17] | 0.01–0.48 m | Low | |||
| [18] | 0.3–0.6 m | Medium | |||
| [19] | 0.4 m | Medium | Exp-Setup, RF, LED | ||
| Fingerprinting | [20] | 5 cm | Low | Exp-Setup + E4832A | |
| [21] | 10 cm | Medium | |||
| [22] | 10 cm | Low | |||
| [10] | 15–20 cm | Medium | Exp-Setup, Covered | ||
| [23] | 10 cm | Medium | |||
| [24] | 85 cm | Medium | |||
| [25] | 1–2 cm | Medium | |||
| [26] | 20–80 cm | Low | |||
| [27] | 1.69 cm | Medium | |||
| [28] | 7 cm | Low | |||
| [29] | 5 cm | Medium | Camera, Robot | ||
| [30] | 5 cm | High | Exp-Setup | ||
| [31] | 1.3 cm | High | Exp-Setup, mobile robot | ||
| [32] | 10 cm | Medium | |||
| [33] | 10 cm | Medium | |||
| TDoA | [34] | 2–5 cm | High | ||
| [35] | 1 cm | High | |||
| [36] | 3.9 cm | Medium | |||
| [37] | 0.3 cm | Medium | |||
| [38] | 2 cm | High | |||
| [6] | - cm | ||||
| AoA | [11] | 1–2 m | Medium | Exp-Setup, 5331 APD | |
| [39] | 0.3 m | Medium | Mobile phone | ||
| [40] | 5–30 cm | High | |||
| [41] | 10 cm | High | Tripod, protractor, PC | ||
| [42] | 8 cm | High | |||
| [43] | 5 cm | Medium | |||
| RSS | [44] | 1.5 cm | Medium | Exp-Setup, S6801, TIA, LNA | |
| [34] | 5 cm | Medium | |||
| [45] | 5 cm | Medium | |||
| [46] | 1.12 cm | Low | |||
| [8] | 2.4 cm | Medium | Exp-Setup | ||
| [47] | 0.4 cm | Medium | Mobile phone | ||
| [48] | 5.9 cm | Low | |||
| [49] | 5 cm | Medium | |||
| [50] | 0.3–20 cm | Medium | |||
| [51] | 0.08 cm | Low | |||
| [52] | 30 mm | Medium | |||
| [13] | 9 cm | Low | Si APD S5343, Exp-Setup | ||
| [53] | 90 cm | Low | |||
| [54] | 6 cm | Medium | |||
| [55] | 1.66 cm | Low | No information | ||
| [14] | 0.5–7.3 cm | Medium | Camera | ||
| [17] | 5 cm | Low | |||
| [56] | 6 cm | Medium | |||
| [57] | 0.0001 m | ||||
| [58] | 25.12 cm | ||||
| Image | [28] | 7 cm | Medium | ||
| [59] | 10 cm | High | |||
| [29] | 5 cm | High | 9 | ||
| [39] | 10 cm | High | |||
| [60] | 30 cm | Medium | |||
| [30] | 1.5 cm | Medium | |||
| [61] | 10 cm | High | Smartphone | ||
| [62] | 14 cm | High | Exp-Setup, Mobile phone | ||
| [63] | m | ||||
| [64] | 6.6 cm | High | Mobile camera | ||
| [65] | 9 steps | High | Camera, Mobile phones | ||
| Light Emitting Diode (LED) | SFH 4554 | TSFF 5510 |
|---|---|---|
| Half angle | ||
| Peak wavelength | 860 nm | 870 nm |
| Total radiant power | 70 mW | 55 mW |
| Rise and fall time , | 12 ns | 15 ns |
| Photodetector (PD) | TSOP 38238 | |
| Peak wavelength | 950 nm | |
| Minimum irradiance | mW/m2 | |
| Detector physical area A | 1 cm2 | |
| Refractive index n | ||
| Field of View | ||
| Scheme | Modifier | Symbol 1 | Symbol 0 |
|---|---|---|---|
| BPC | - | ||
| PWM | Additive | ||
| PWM | Gain | ||
| PWM | Power |
| Variable | Value |
|---|---|
| vn − vf | 4.575 V |
| σn | 281.28 mV |
| σf | 175 mV |
| h | 1 m |
| Pr | 10.23 μW |
| ϕ | 0° |
© 2019 by the authors. Licensee MDPI, Basel, Switzerland. This article is an open access article distributed under the terms and conditions of the Creative Commons Attribution (CC BY) license (http://creativecommons.org/licenses/by/4.0/).
Share and Cite
Popoola, O.R.; Sinanović, S.; Popoola, W.O.; Ramirez-Iniguez, R. Optical Boundaries for LED-Based Indoor Positioning System. Computation 2019, 7, 7. https://doi.org/10.3390/computation7010007
Popoola OR, Sinanović S, Popoola WO, Ramirez-Iniguez R. Optical Boundaries for LED-Based Indoor Positioning System. Computation. 2019; 7(1):7. https://doi.org/10.3390/computation7010007
Chicago/Turabian StylePopoola, Olaoluwa Rotimi, Sinan Sinanović, Wasiu O. Popoola, and Roberto Ramirez-Iniguez. 2019. "Optical Boundaries for LED-Based Indoor Positioning System" Computation 7, no. 1: 7. https://doi.org/10.3390/computation7010007
APA StylePopoola, O. R., Sinanović, S., Popoola, W. O., & Ramirez-Iniguez, R. (2019). Optical Boundaries for LED-Based Indoor Positioning System. Computation, 7(1), 7. https://doi.org/10.3390/computation7010007