Article

Reduction Potential Predictions for Some 3-Aryl-Quinoxaline-2-Carbonitrile 1,4-Di-N-Oxide Derivatives with Known Anti-Tumor Properties

by
Eric M. Miller
,
Cody J. Brazel
,
Krystina A. Brillos-Monia
,
Philip W. Crawford
,
Hannah C. Hufford
,
Michael R. Loncaric
,
Monica N. Mruzik
,
Austin W. Nenninger
and
Christina M. Ragain
*
Department of Chemistry and Physics, Southeast Missouri State University, Cape Girardeau, MO 63701, USA
*
Author to whom correspondence should be addressed.
Computation 2019, 7(1), 6; https://doi.org/10.3390/computation7010006
Submission received: 11 December 2018 / Revised: 24 December 2018 / Accepted: 9 January 2019 / Published: 10 January 2019
(This article belongs to the Section Computational Chemistry)

Abstract

:
The ability for DFT: B3LYP calculations using the 6-31g and lanl2dz basis sets to predict the electrochemical properties of twenty (20) 3-aryl-quinoxaline-2-carbonitrile 1,4-di-N-oxide derivatives with varying degrees of cytotoxic activity in dimethylformamide (DMF) was investigated. There was a strong correlation for the first reduction and moderate-to-low correlation of the second reduction of the diazine ring between the computational and the experimental data, with the exception of the derivative containing the nitro functionality. The four (4) nitro group derivatives are clear outliers in the overall data sets and the derivative E4 is ill-behaved. The remaining three (3) derivatives containing the nitro groups had a strong correlation between the computational and experimental data; however, the computational data falls substantially outside of the expected range.

1. Introduction

The study of quinoxaline 1,4-di-N-oxide derivatives has been the source of worldwide interest within the last few decades, increasing over time due to their potential pharmaceutical properties that range from anti-tumor [1,2,3] to anti-trypanosomal [4,5,6]. Commonly, the quinoxaline 1,4-di-N-oxide derivatives lead to the destruction of pathogens, including fungal [7,8], parasitic [4,5,6], and even mycobacterial [9]. The exact mechanism of the bioactivity against many pathogens is still not understood; therefore, research into the origins and mechanisms underlying the bioactivity will benefit the pharmaceutical community. Research has commonly demonstrated that for homologous series the ease of reduction for quinoxaline 1,4-di-N-oxide derivatives is often correlated with increased bioactivity [6,10,11,12,13]. Previous studies have demonstrated that some quinoxaline 1,4-di-N-oxide derivatives can form radicals capable of cleaving DNA under hypoxic conditions [14,15]. This free radical mechanism is believed to cause oxidative stress at the target cells and is presumed a common underlying mechanism for the bioactivity of many quinoxaline 1,4-di-N-oxide derivatives [16,17,18,19]. Scheme 1 shows the first (Wave 1) and second (Wave 2) reduction of the diazine ring in the parent quinoxaline 1,4-di-N-oxide molecule.
Because of the common correlation between the reduction potentials and bioactivity, voltammetric analyses of quinoxaline 1,4-di-N-oxide derivatives of interest has become a standard method of analysis. However, we propose that computational methods provide a powerful tool that can predict the electrochemical properties of quinoxaline 1,4-di-N-oxide derivatives. Several computational methods have been previously used to investigate the reduction potentials or the HOMO/LUMO energy gap for quinones and other small organic molecules [21,22,23]. Several computational studies on quinoxaline derivatives have investigated the thermodynamic properties, the effects of substitution, and predictions of the polymerization of quinoxalines in engineering [23,24,25]. In 2012, Sheng and coworkers reported the anti-tumor properties for several series of 3-aryl-quinoxaline-2-carbonitrile 1,4-di-N-oxide derivatives including the twenty (20) 3-aryl-quinoxaline-2-carbonitrile 1,4-di-N-oxide derivatives investigated computationally in this study [26]. The twenty (20) 3-aryl-quinoxaline-2-carbonitrile 1,4-di-N-oxide derivatives of interest are shown in Table 1. The twenty (20) derivatives were demonstrated to have varying anti-tumor activities under hypoxic conditions [26]. Recently, we reported the measurement of the reduction potentials for this unique series of twenty (20) 3-aryl-quinoxaline-2-carbonitrile 1,4-di-N-oxide derivatives [27] and the comparison of the reduction potentials to the previously published anti-tumor properties [26]. For this series of quinoxaline 1,4-di-N-oxide derivatives no correlation between their reduction potentials and their bioactivities was found [27]. The lack of correlation didn’t completely rule out a bioreduction mechanism. It did suggest that other factors such as membrane permeability, stereochemistry, diffusion, or target binding may play an important role in the in vivo mechanism [27,28,29]. Additionally, preliminary computational data was reported for five (5) of the 3-aryl-quinoxaline-2-carbonitrile 1,4-di-N-oxide derivatives. A strong correlation was shown for the four (4) derivatives without a nitro group between the predicted and experimentally measured reduction potentials [27]. Here, we present a computational study that analyzed the ability for two simple and common basis sets (6-31G and lanl2dz) that require limited computational resources to predict the reduction potentials for the twenty (20) 3-aryl-quinoxaline-2-carbonitrile 1,4-di-N-oxide derivatives.

2. Materials and Methods

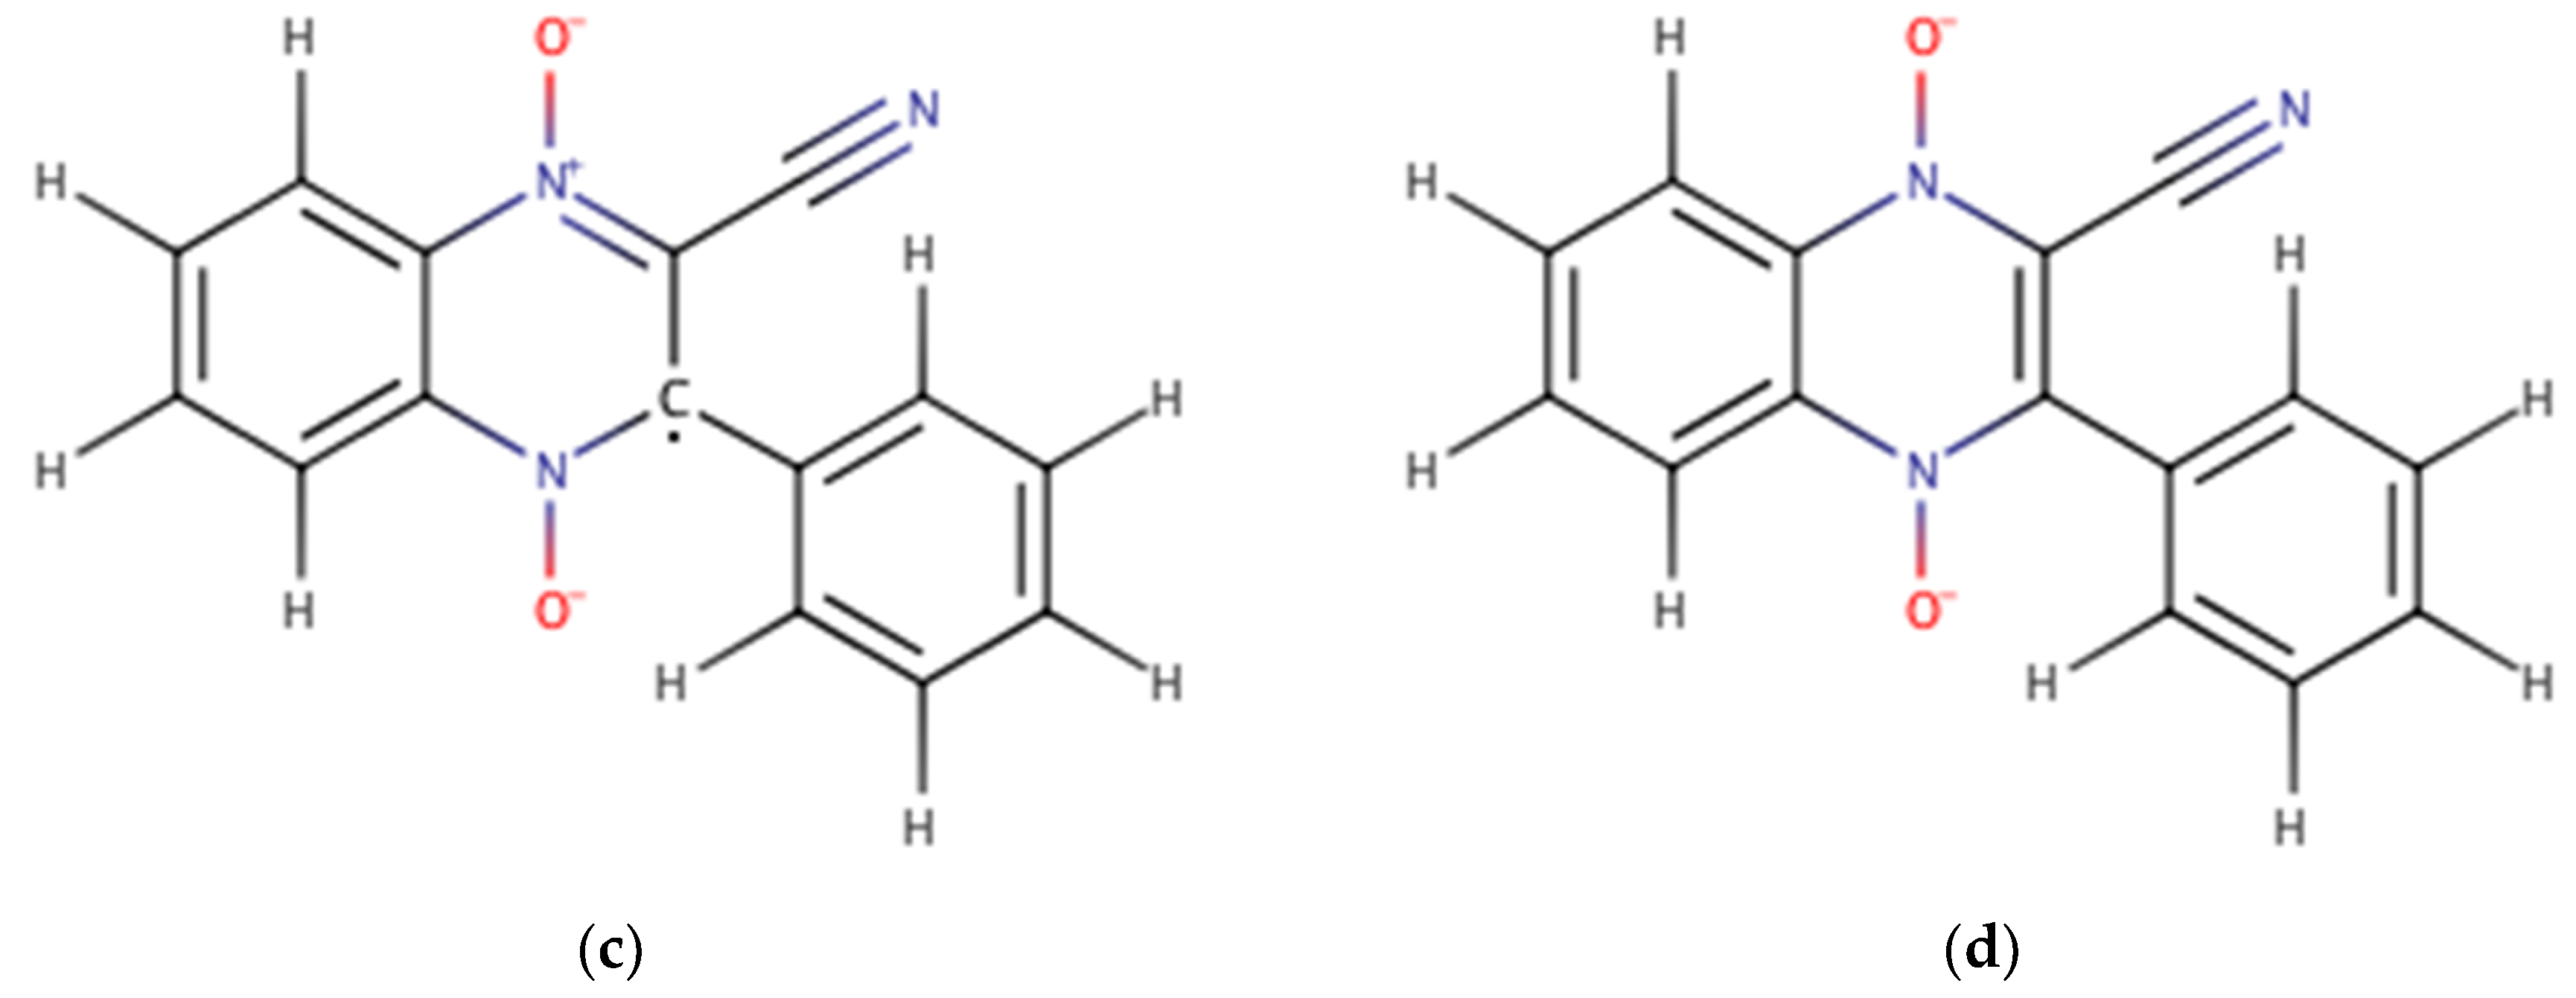
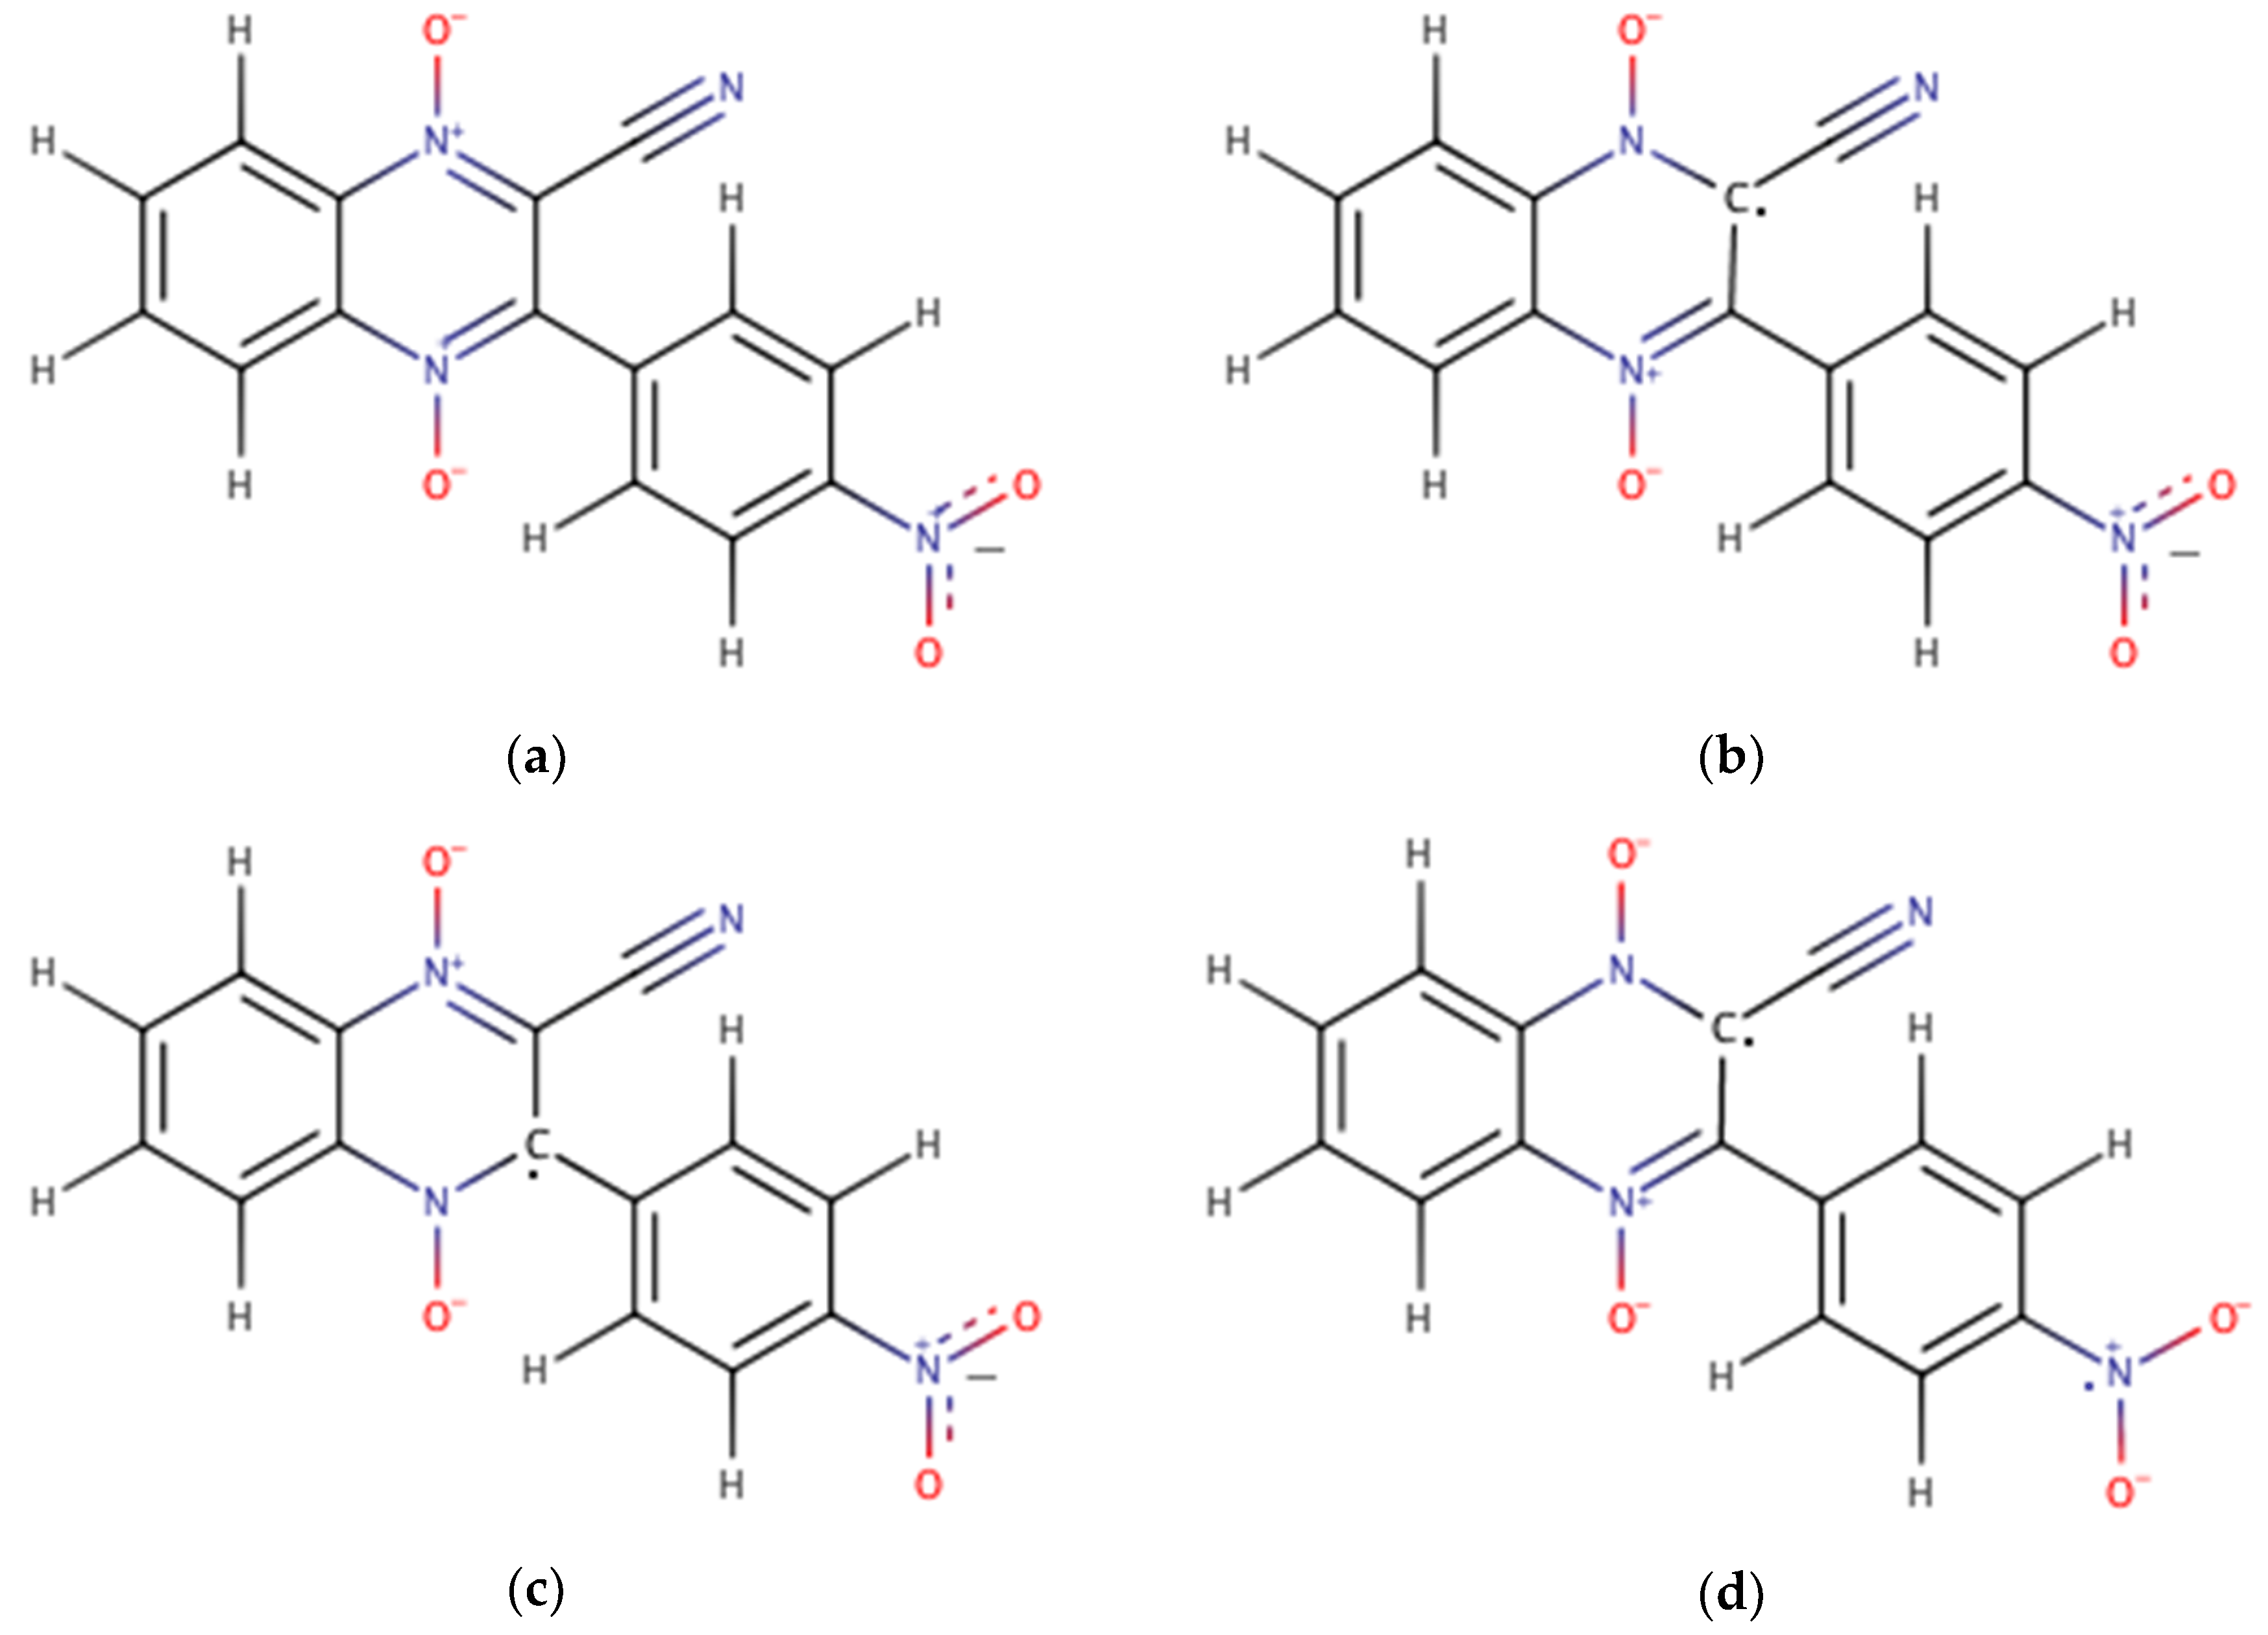
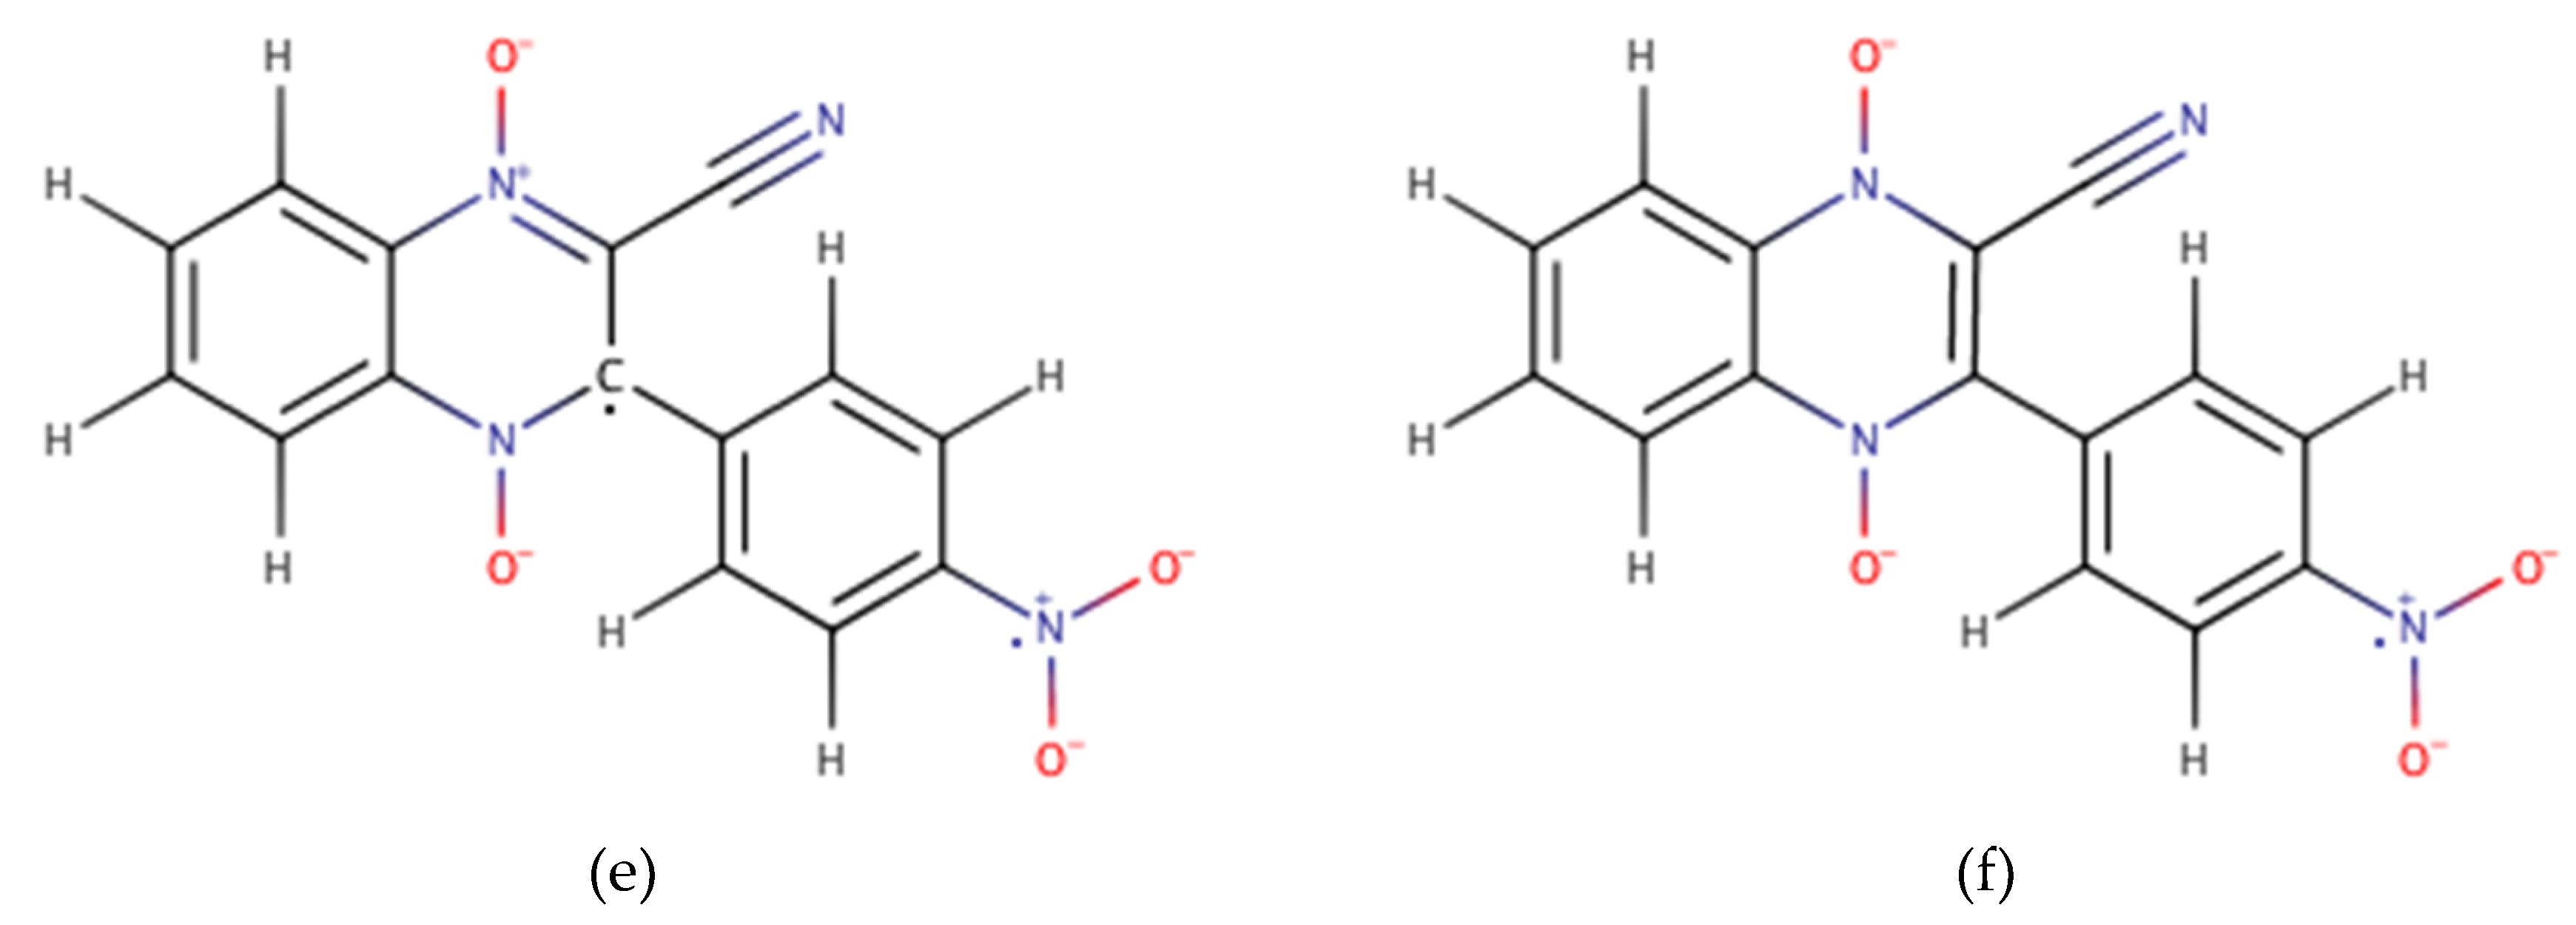
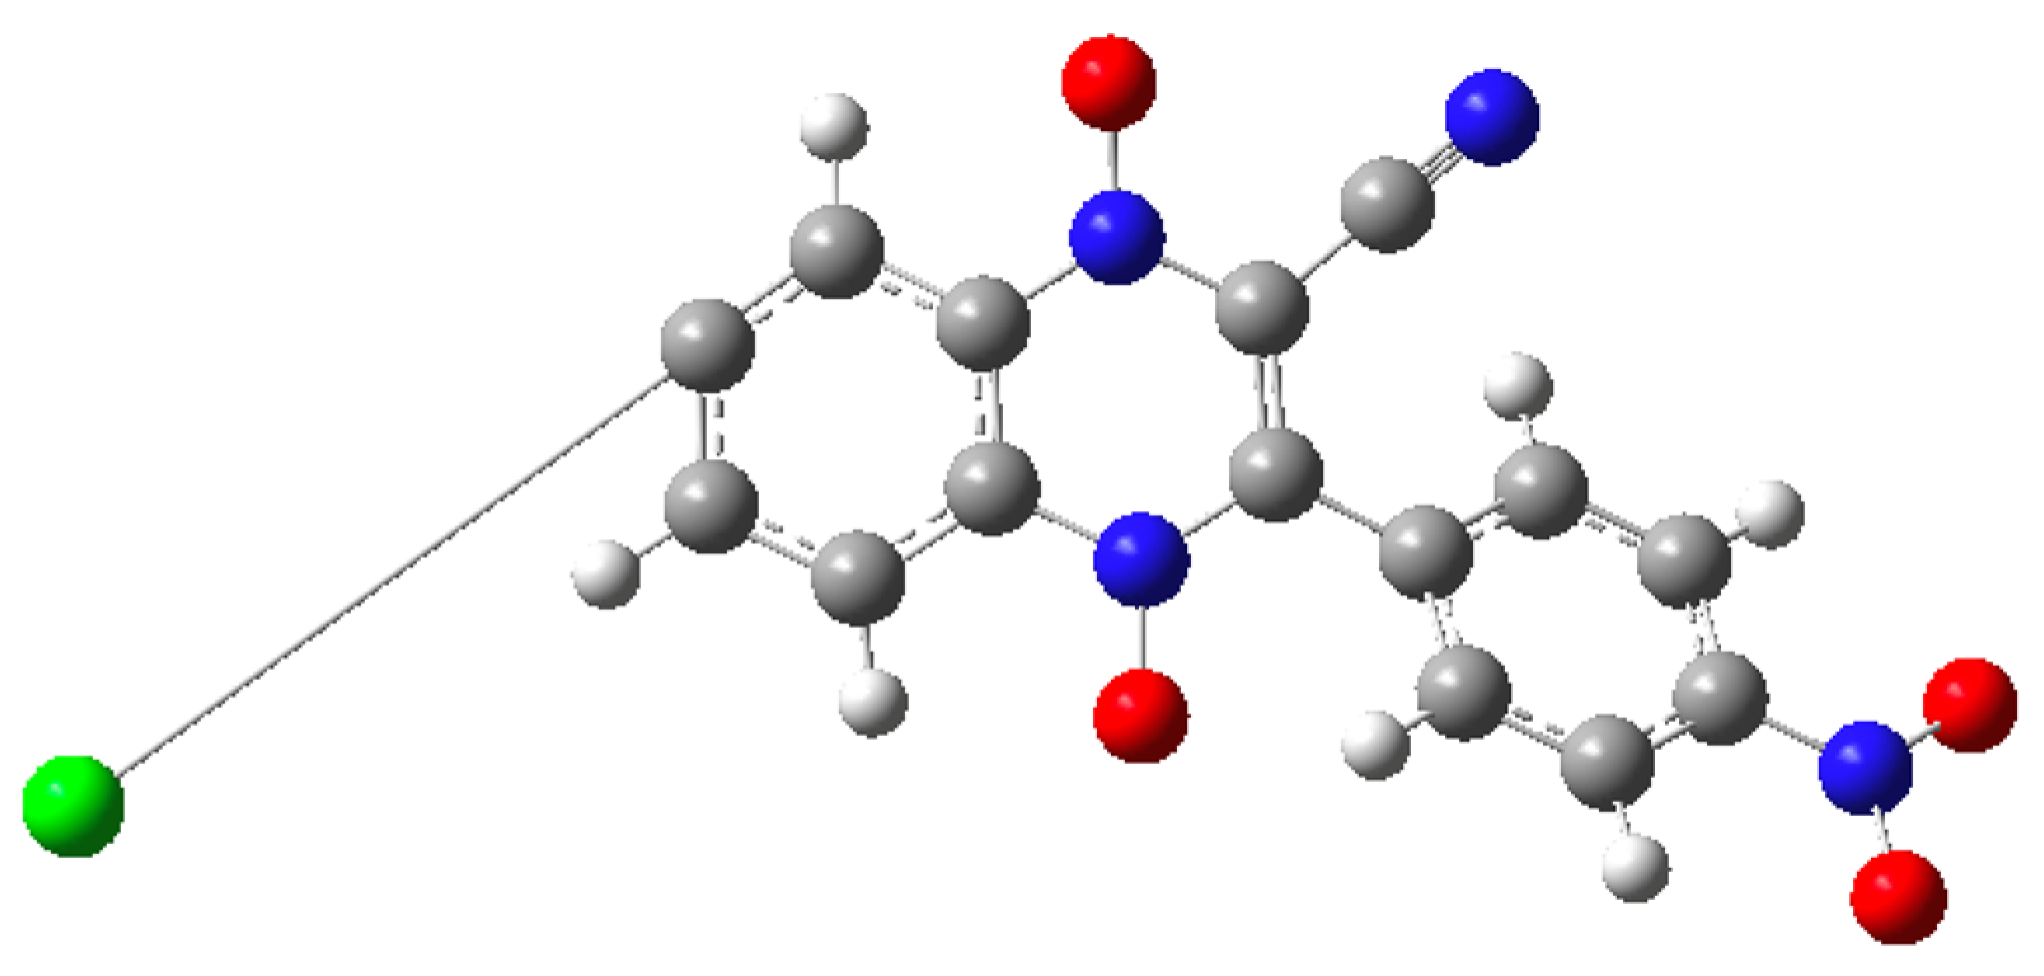
2.1. Building the Derivatives

All structures for the twenty (20) 3-aryl-quinoxaline-2-carbonitrile 1,4-di-N-oxide derivatives were drawn in GaussView 5 [30]. For the derivatives without the nitro functional group (A1–D4), four (4) individual structures were drawn: the original neutral molecule, two (2) possible anion products from the first N-oxide reduction wave (Wave 1) and the dianion product from the second N-oxide reduction wave (Wave 2). Figure 1 shows 2D structures created with MarvinSketch for each of the four (4) individual structures for molecule A1 [20]. The original neutral molecule is shown in Figure 1a. The two (2) possible structures for the product of Wave 1 had the radical attached to either C2, the carbon adjacent to the cyano or nitrile group, (Figure 1b) or to C3, the carbon adjacent to the phenyl or aryl group, (Figure 1c). Lastly, the dianion product following Wave 2 is shown in Figure 1d. Figure A1 in Appendix A shows the 3D structures optimized in Gaussian 09 for the same four (4) individual structures for A1.
For the derivatives containing the nitro group (E1–E4), six (6) structures were created: the original neutral molecules, two (2) possible anion products from Wave 1, two (2) possible dianion products from the nitro group reduction (Nitro Wave), and the trianion product at the end of Wave 2. Figure 2 shows 2D structures created with MarvinSketch for each of the six (6) individual structures for molecule E1 [20]. The original neutral molecule is shown in Figure 2a. The two (2) possible structures for the product of Wave 1 have the radical assigned either to the C2, the carbon adjacent to either the nitrile group, (Figure 2b) or to C3, the carbon adjacent to the aryl group, (Figure 2c). The two (2) possible products following the Nitro Wave results in a one radical electron on the nitro group and one radical electron on either the C2 (Figure 2d) or C3 (Figure 2e). The trianion structure following Wave 2 is shown in Figure 2f. Figure A2 in Appendix A shows the 3D structures optimized in Gaussian 09 for the same six (6) individual structures of E1.

2.2. DFT Calculations

All DFT: B3LYP calculations were carried out in Gaussian 09 [31]. To find the lowest energy configuration, each individual structure was optimized in gas phase using two common basis sets: 6-31g and lanl2dz. Next, a frequency calculation was performed to correct for thermal artifacts. The energy (Eg) for each structure in the gas phase was found by summing the optimization energy (Eopt) and the thermal correction factor (FThermal).
E g = E o p t + F T h e r m a l
Next, an energy calculation was performed by solvating the gas phase optimized structure in dimethylformamide (DMF) to find the energy of the solvated molecule (Esolv). The integral equation formalism variant of the Polarizable Continuum Model (IEFPCM), which is the default solvent model in Gaussian 09 was used [32,33,34]. The change in Gibbs free energy of solvation (ΔGsolv) was then found by subtracting energy of the gas phase molecule (Eg) from the energy of the solvated molecule (Esolv) [35,36].
Δ G s o l v =   E s o l v E g
The change in Gibbs free energy between the individual derivative and the reduction product is found by comparing the Eg for the structures varying by one electron. For example, the change in Gibbs Free Energy of Wave 1 (ΔGred,wave1 (g)) is found by subtracting the energy in the gas phase of the neutral structure (Eg,n) from the energy anion product (Eg,a) [35,36].
Δ G r e d , w a v e 1 ( g ) =   E g , a E g , n
Figure 3a shows a visual representation of the thermodynamic cycles used to calculate the change in Gibbs Free Energy associated with the reduction of Wave 1 and Wave 2, ΔGred,wave1(solv) and ΔGred,wave2(solv) respectively. Figure 3b shows the modified thermodynamic cycles used for the E1-E4 derivatives to solve for the change in the Gibbs Free Energy associated with the reduction of Wave 1, Wave 2 and the Nitro Wave.
For Wave 1,
Δ G r e d , w a v e 1 ( s o l v ) = Δ G s o l v ,   n + Δ G r e d , w a v e 1 ( g ) + Δ G s o l v ,   a
where ∆𝐺𝑠𝑜𝑙𝑣,𝑛 is the change in Gibbs Free Energy of solvation of the neutral molecule, Δ G r e d , w a v e 1 ( g ) is the change in Gibbs Free Energy of the reduction in the gas phase and Δ G s o l v , a is the change in Gibbs free energy of solvation for the radical anion.
The ΔGred values were used to calculate the reduction potentials for comparison to the experimental data. For example, Equation (5) shows the calculation of the reduction potential for Wave 1 (εred,wave 1) from the ΔGred,wave 1 where F is Farade’s constant (96,485 C/mole) and n is the number of electrons per reduction.
ε r e d , w a v e   1 = Δ G r e d , w a v e 1   ( s o l n ) n F

2.3. Ferrocene/Ferrocenium Reference

Ferrocene (Fc) and the ferrocenium ion (Fc+) were constructed in Gaussian View 5. The DFT calculations were carried out as described for the quinoxaline 1,4-di-N-oxide derivatives. A Fc/Fc+ electrode was used in the previous experiment [27], so the calculated reduction potential for the Fc/Fc+ reaction (εFc/Fc+) was used as the reference for the calculated reduction potentials.
ε c e l l = ε r e d , w a v e   1 ε F c / F c +
The zero for the reduction potential was adjusted by subtracting 0.7 V, which is the difference between the potentials of the standard hydrogen electrode (SHE) in DMF and the Fc/Fc+ electrode, from the cell potential [37].
ε c e l l = ε c e l l 0.7

3. Results and Discussion

3.1. Computationally Predicted Raw Chemical Potentials

The calculated reduction potentials for the twenty (20) quinoxaline 1,4-Di-N-oxide derivatives are tabulated in Table 2. For 16 of the derivatives (A1–D4), they were very well behaved. For A1–D4, the appearance of the optimized structures looked as expected. Additionally, their calculated reduction potentials were all similar and within the expected range. The derivatives that contained the nitro group (E1–E4) were not well behaved. The E4 trianion structure could not be optimized with the 6-31G basis set. During the optimization process the chlorine R1 group would “dissociate” from the structure as shown in Figure 4. Neither the lanl2dz or 6-31G basis sets were able to successfully calculate the chemical potentials for the nitro group containing derivatives E1–E4 in the expected range.
The optimization energy, solvation energy, and frequency corrections were found to be the same for all derivatives after the Wave 1 reduction whether the radical electron was place on the C2 or C3. This supports the hypothesis asserted by Crawford et al. 1986 [38] and Miller et al., 2017 [27] that the electron isn’t localized on a single carbon but is instead in resonance between adjacent carbons (C2 and C3). Figure 5 shows the anion products in resonance resulting in delocalization of the radical electron between C2 and C3.

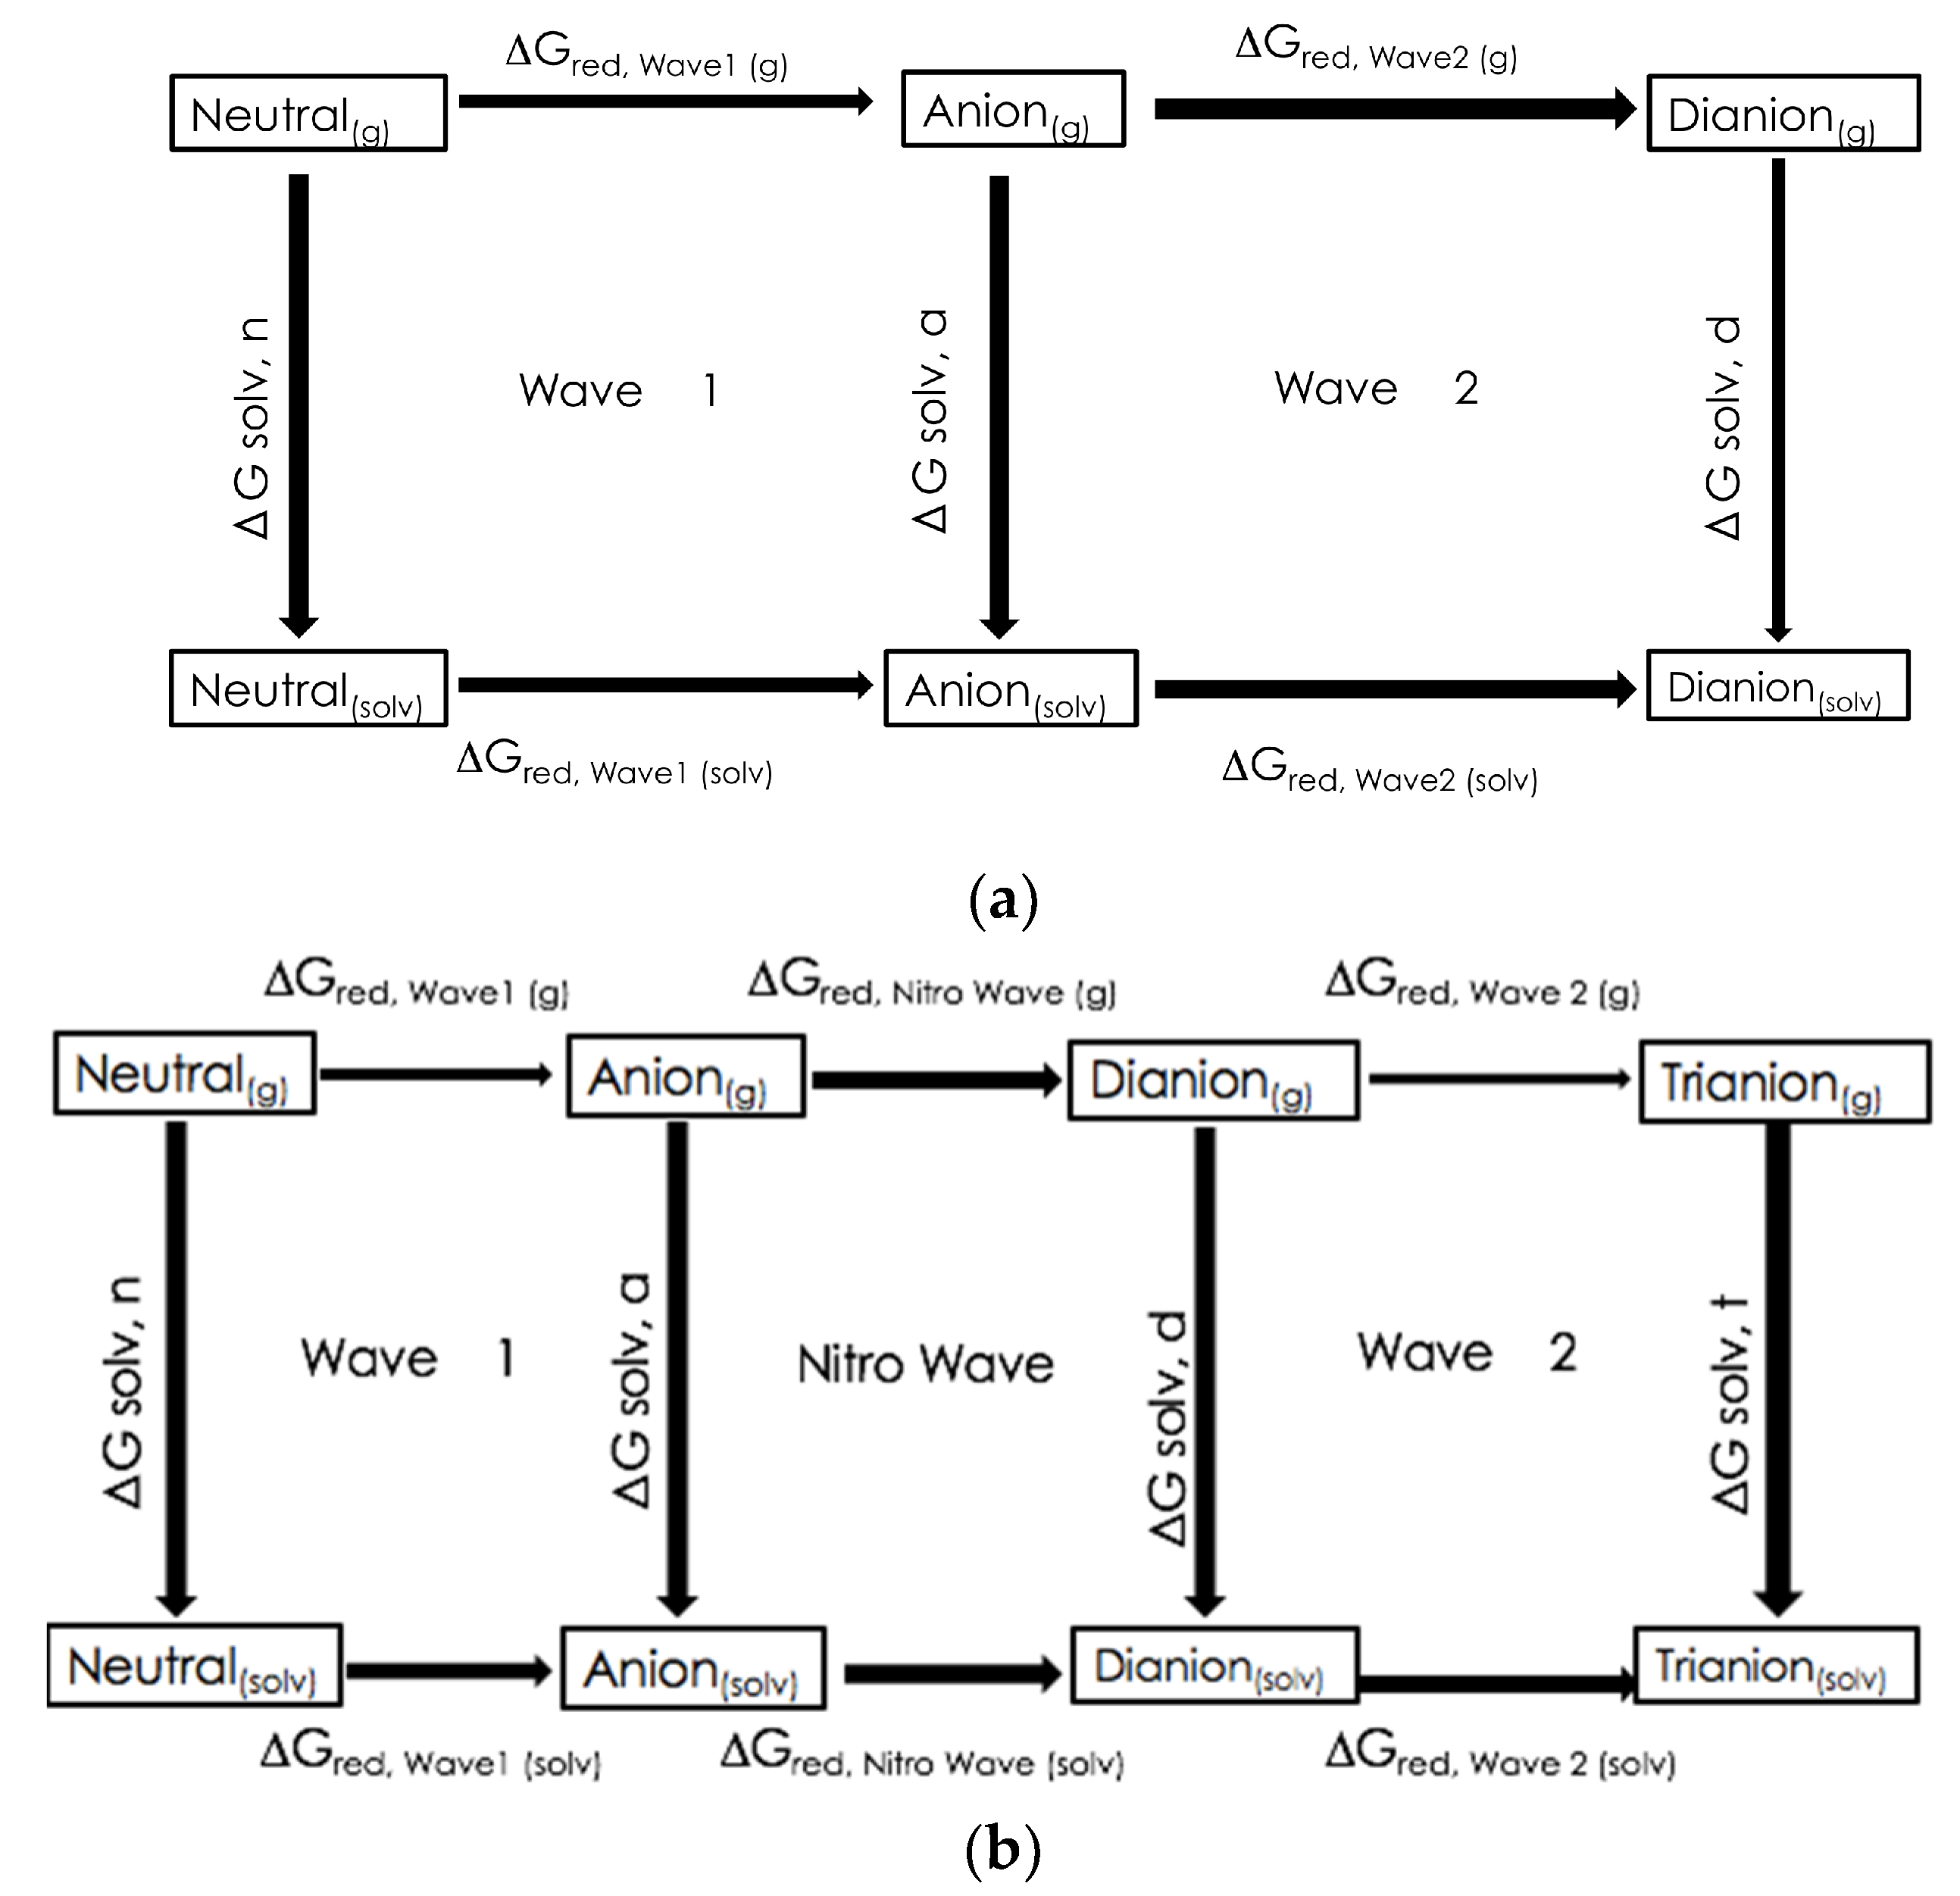
3.2. Computationally Predicted Electrochemical Cell Reaction Potentials

The experimental potentials are calculated versus the ferrocene/ferrocenium electrode redox couple. The ferrocene/ferrocenium reduction potential was calculated to be 5.180 V and 5.514 V with the 6-31G and lanl2dz basis sets. Table 3 shows the calculated reduction potentials versus the ferrocene/ferrocenium redox couple with the standard hydrogen potential set to zero. As the reference experimental data set the ferrocene/ferrocenium redox couple to zero, Table 4 shows the data after a correction to set the ferrocene/ferrocenium redox couple to zero.

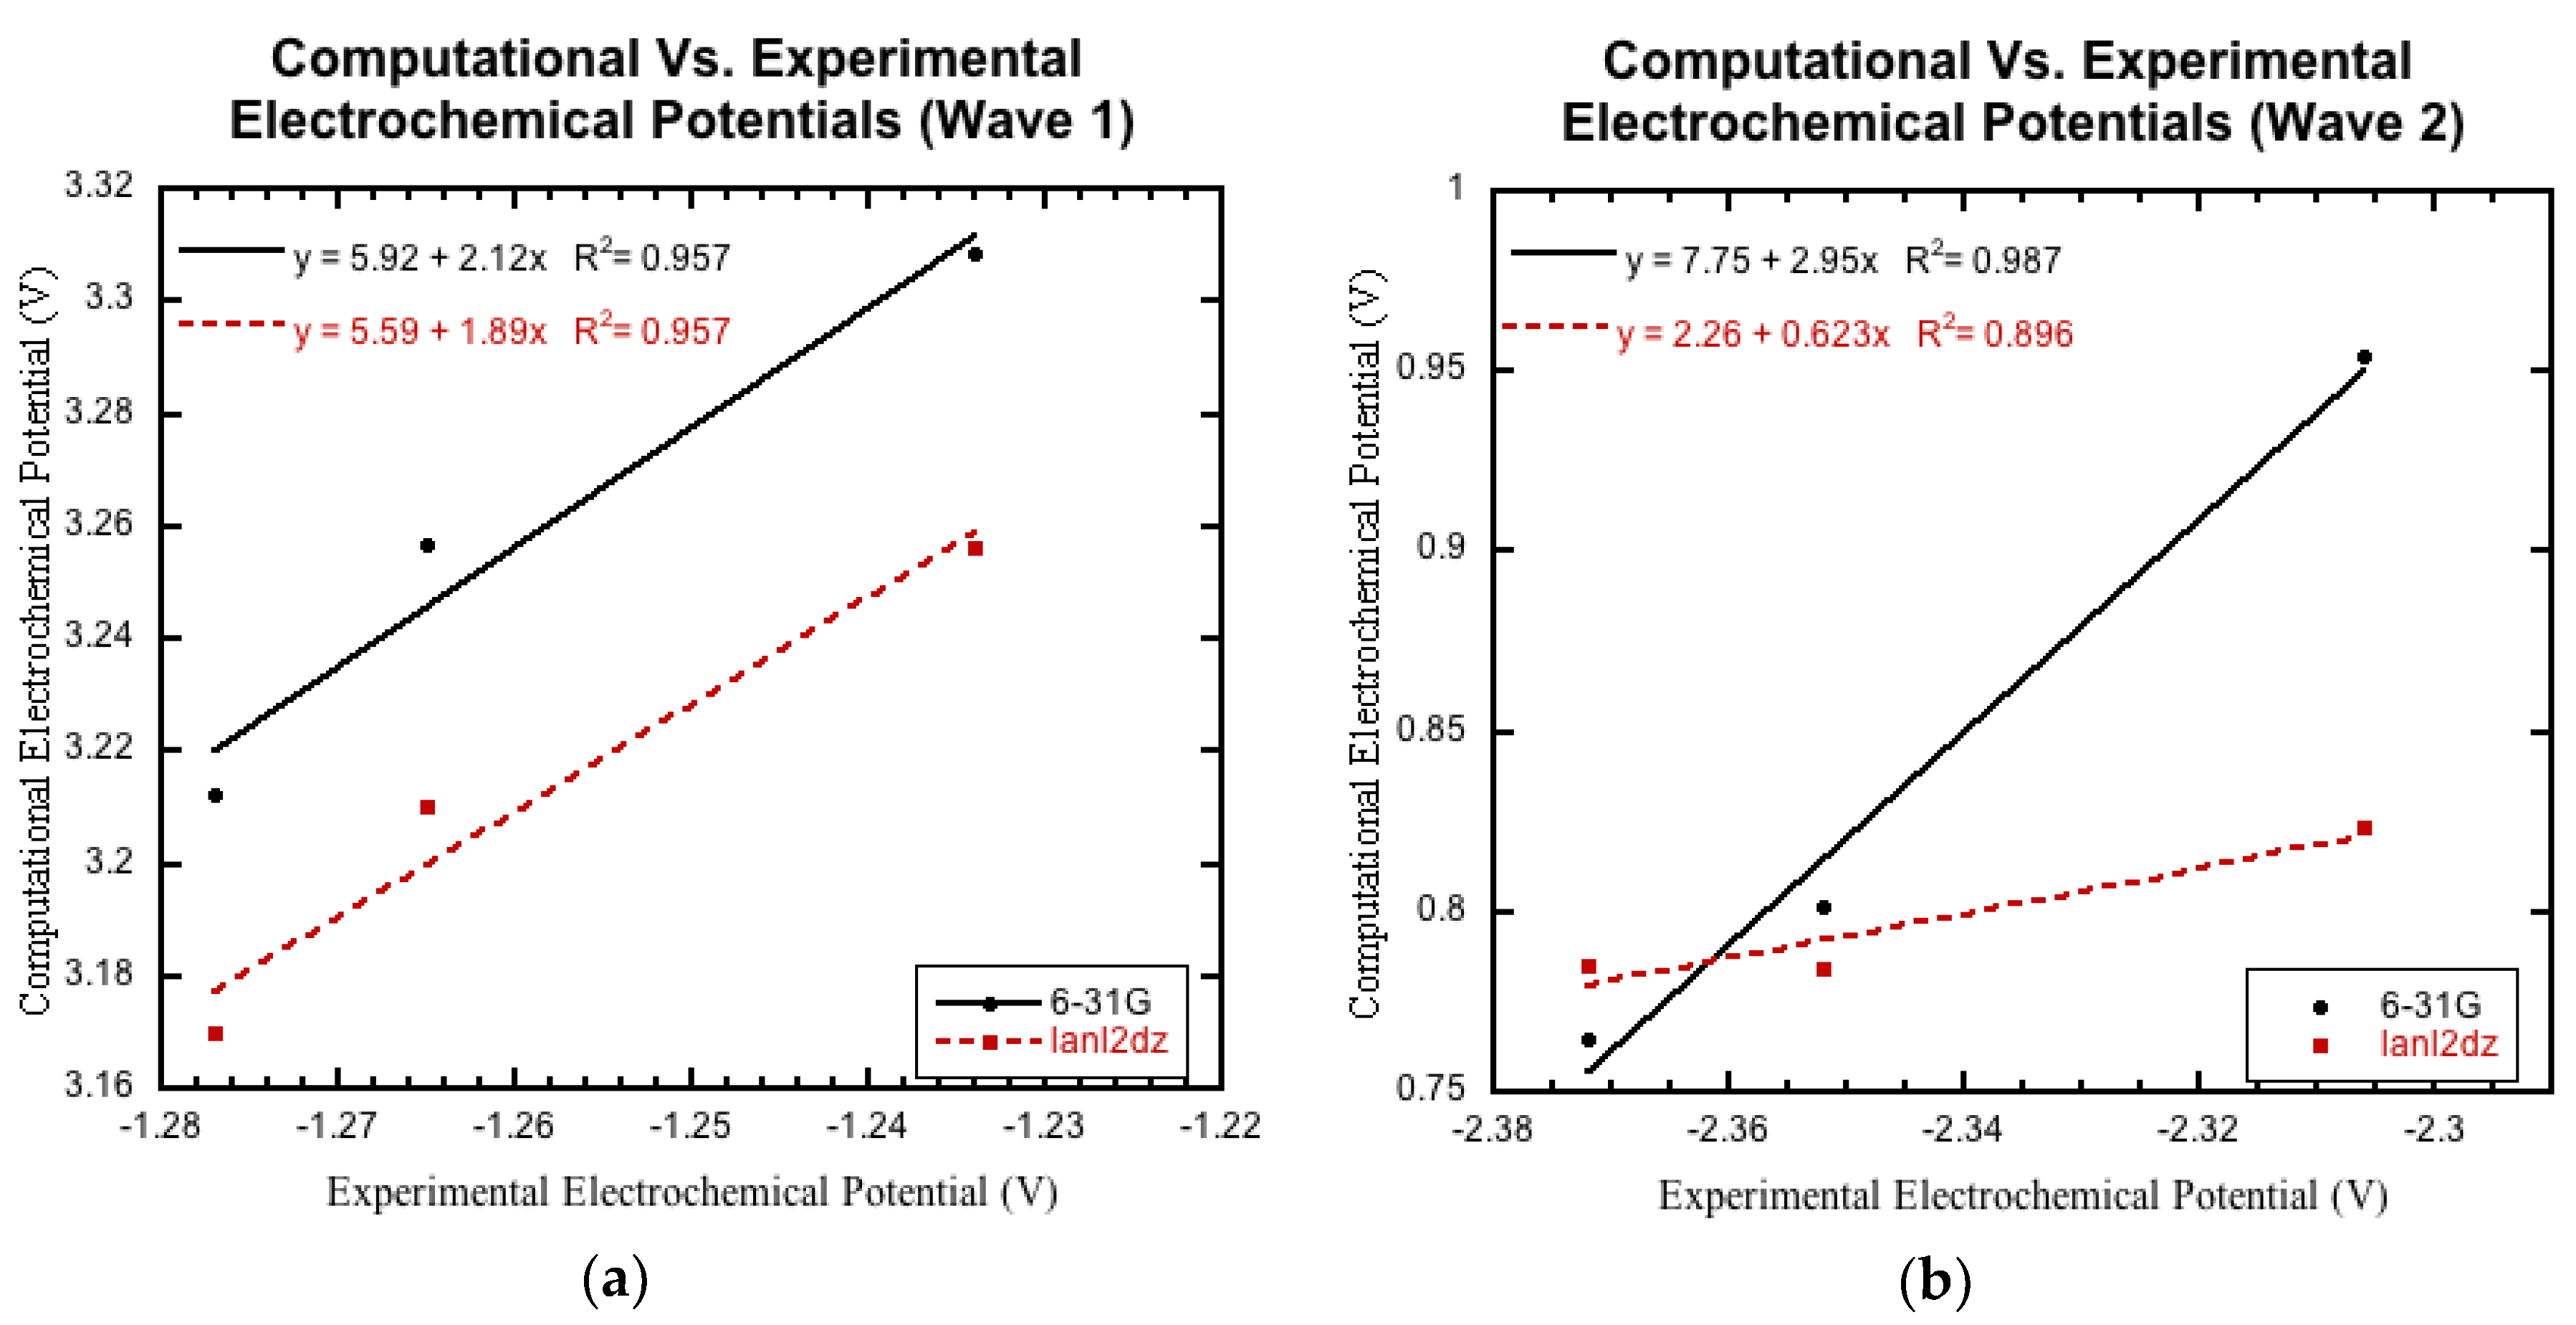
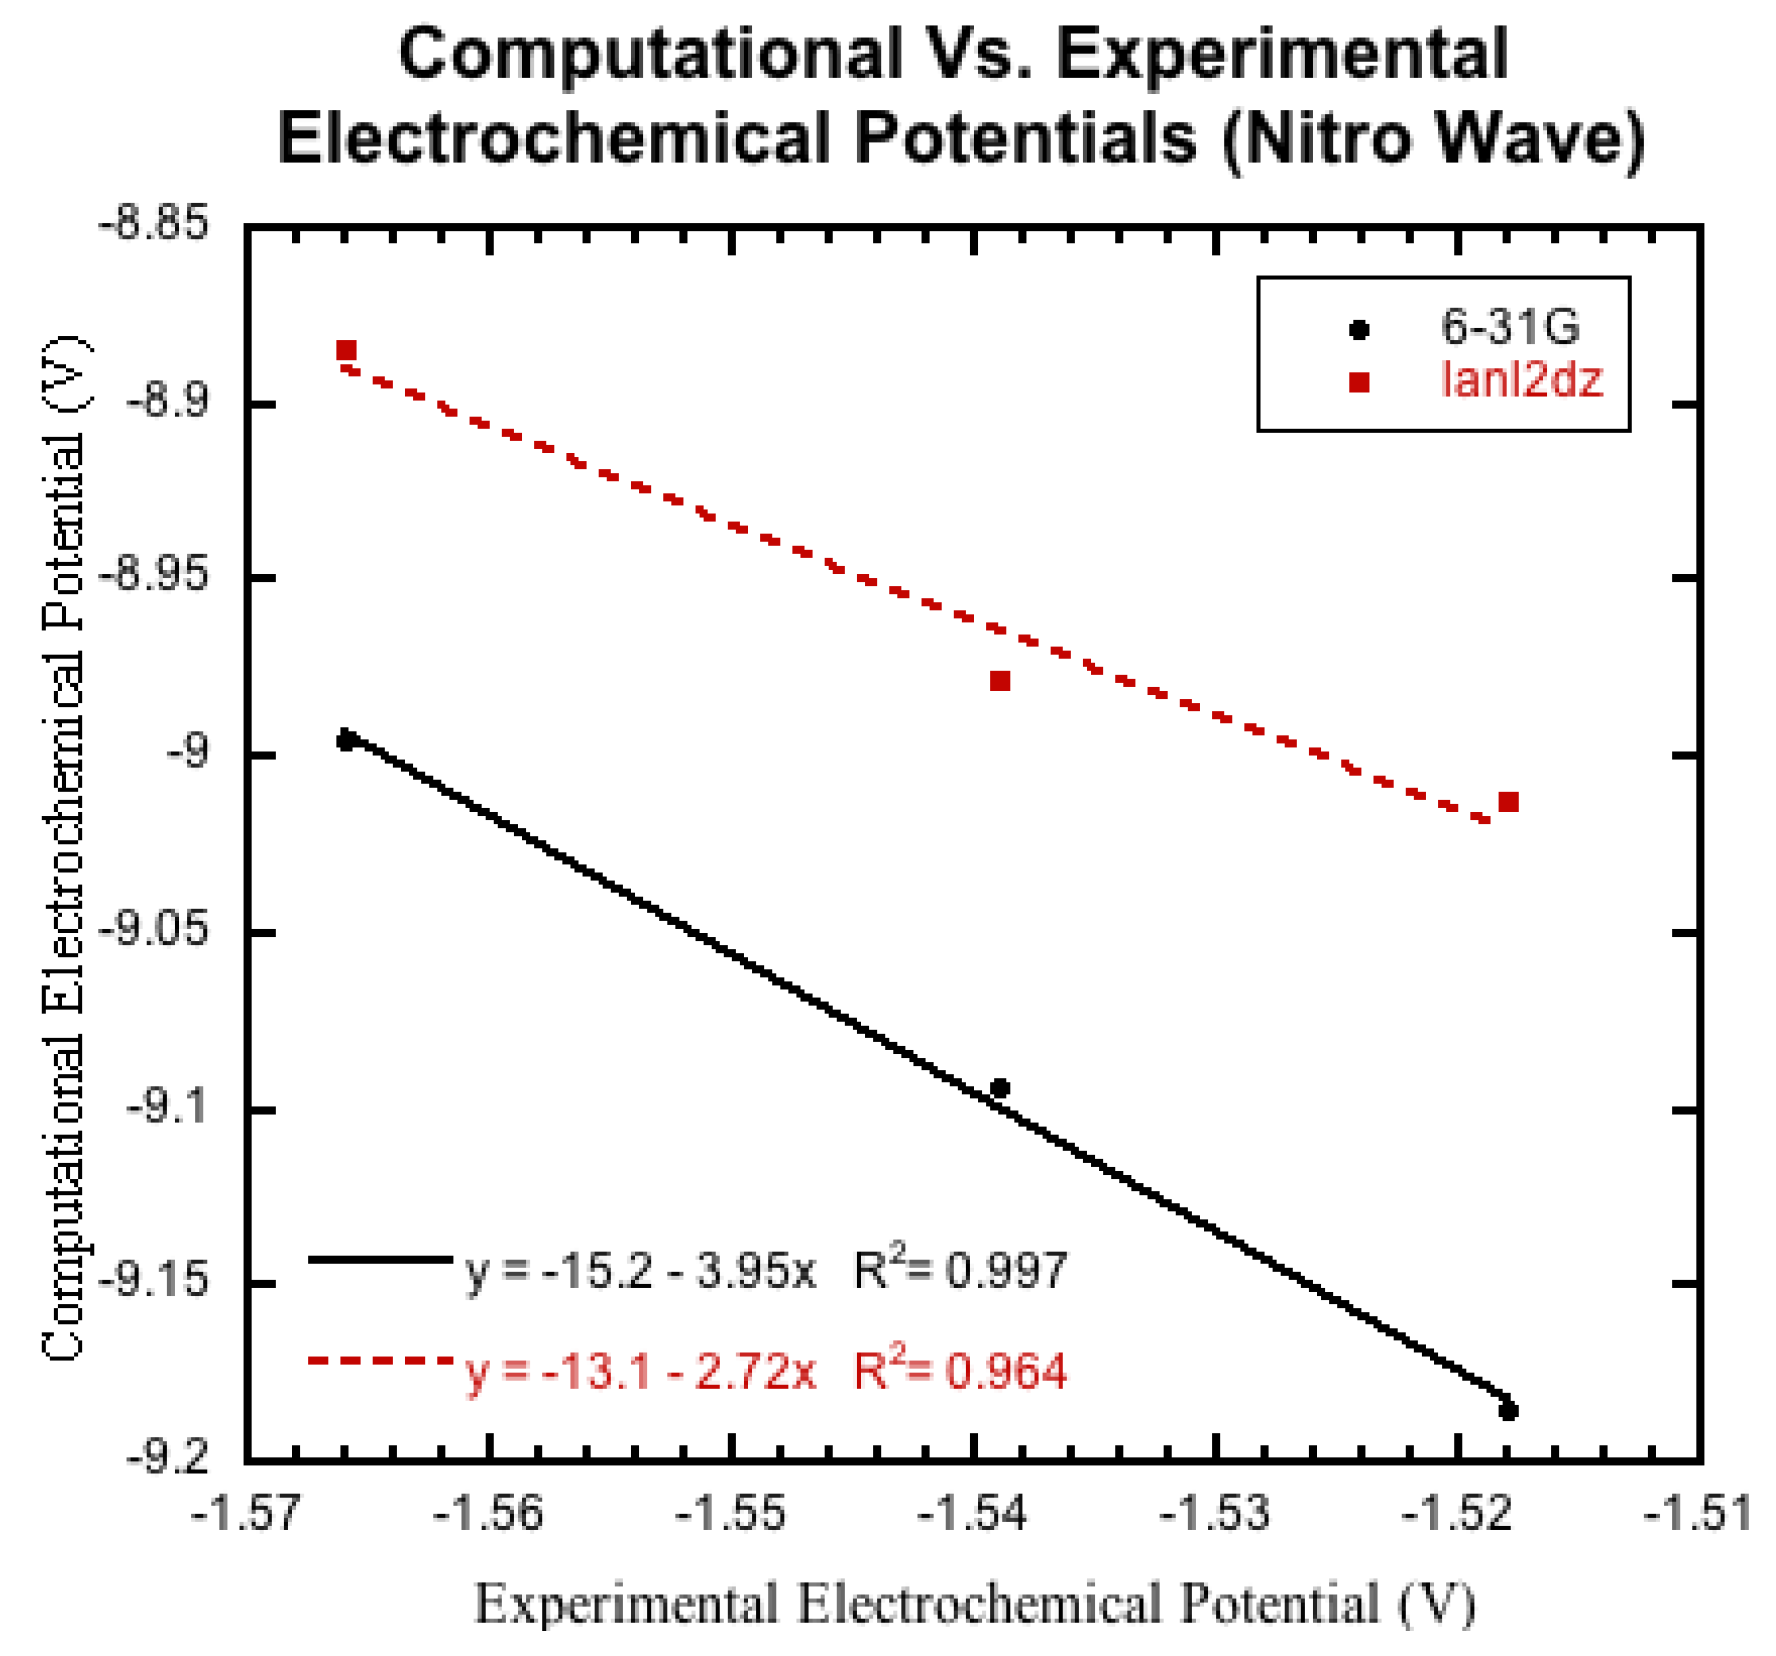
3.3. Comparison to Experimental Electrochemical Data

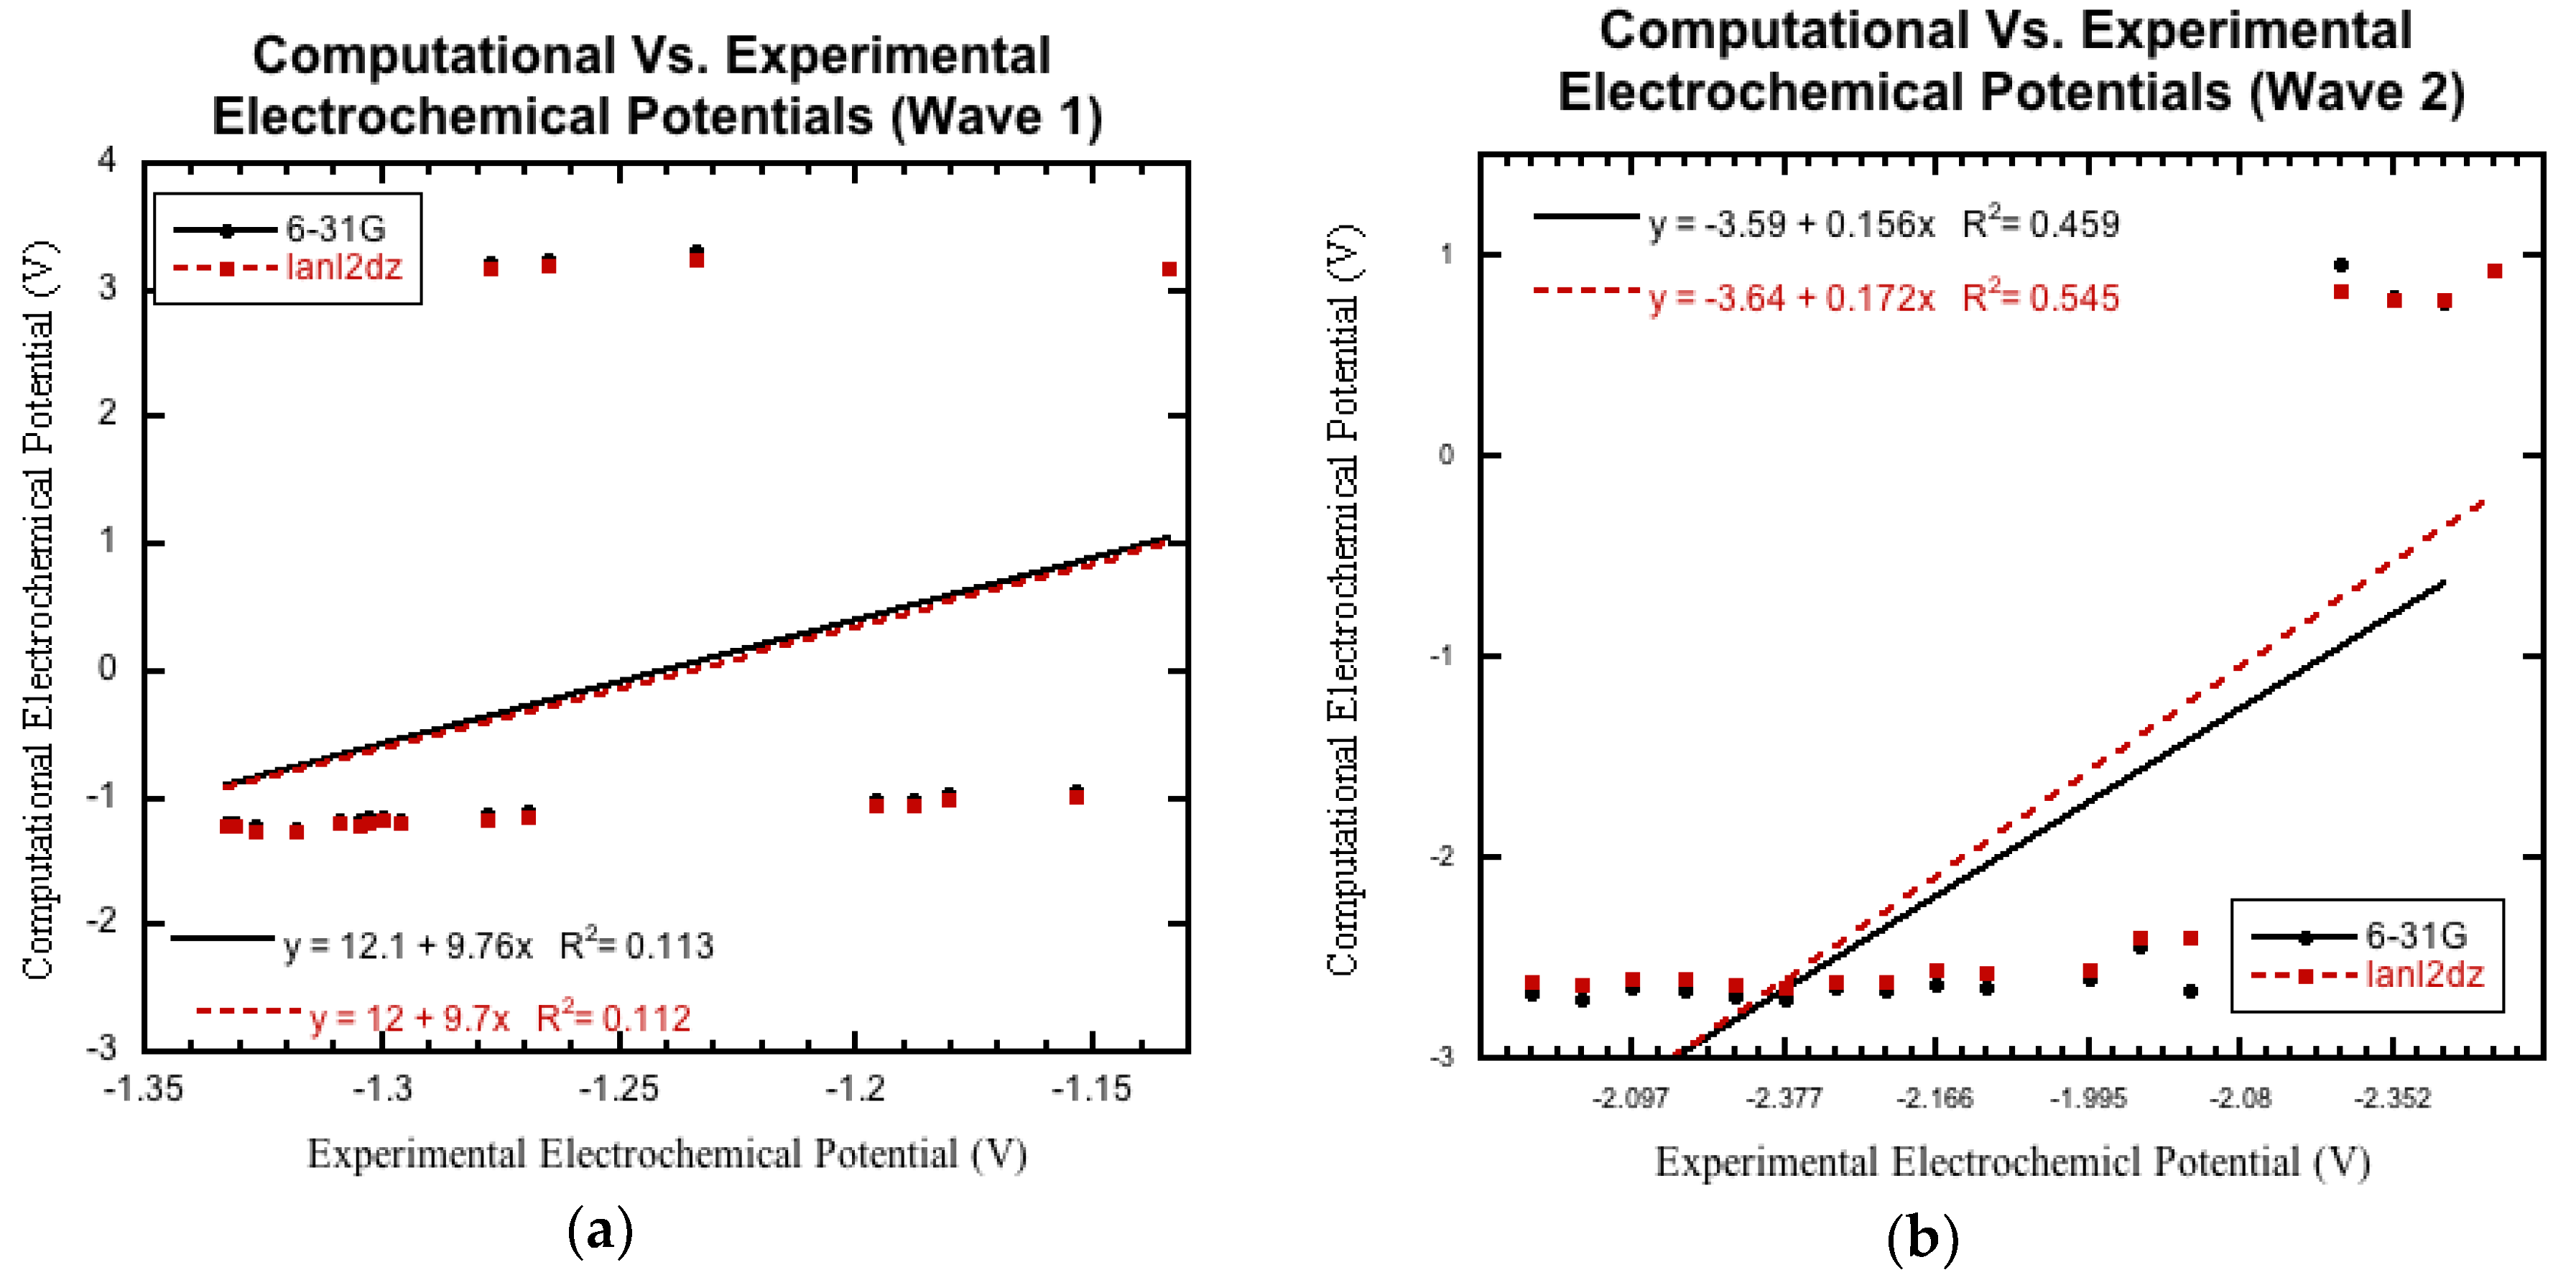
3.3.1. Initial Comparison

Table 5 lists the reference experimental data. In the experimental data, Wave 1 is reversible for all compounds except C3. This irreversibility clearly makes C3 an outlier in the experimental data since its experimental value was determined differently than the other 19 compounds. Additionally, C3 has no reported Wave 2 value. For this reason, C3 is not considered in the analysis of either computational data set.
Figure 6 shows the comparison of (a) Wave 1 and (b) Wave 2 of the computational and experimental data set, excluding C3. The lanl2dz data is shown in black and the 6-31G data is shown in red. The figures clearly demonstrate that neither basis set is able to predict the reduction potentials for all nineteen (19) derivatives with experimental values. Evaluation of the outliers quickly revealed that the outliers in each data set were the four derivatives containing the nitro group (E1–E4). For the remainder of our analysis, we will discuss the non-nitro containing derivatives (A1–D4) separately from the nitro-containing derivatives (E1–E4).

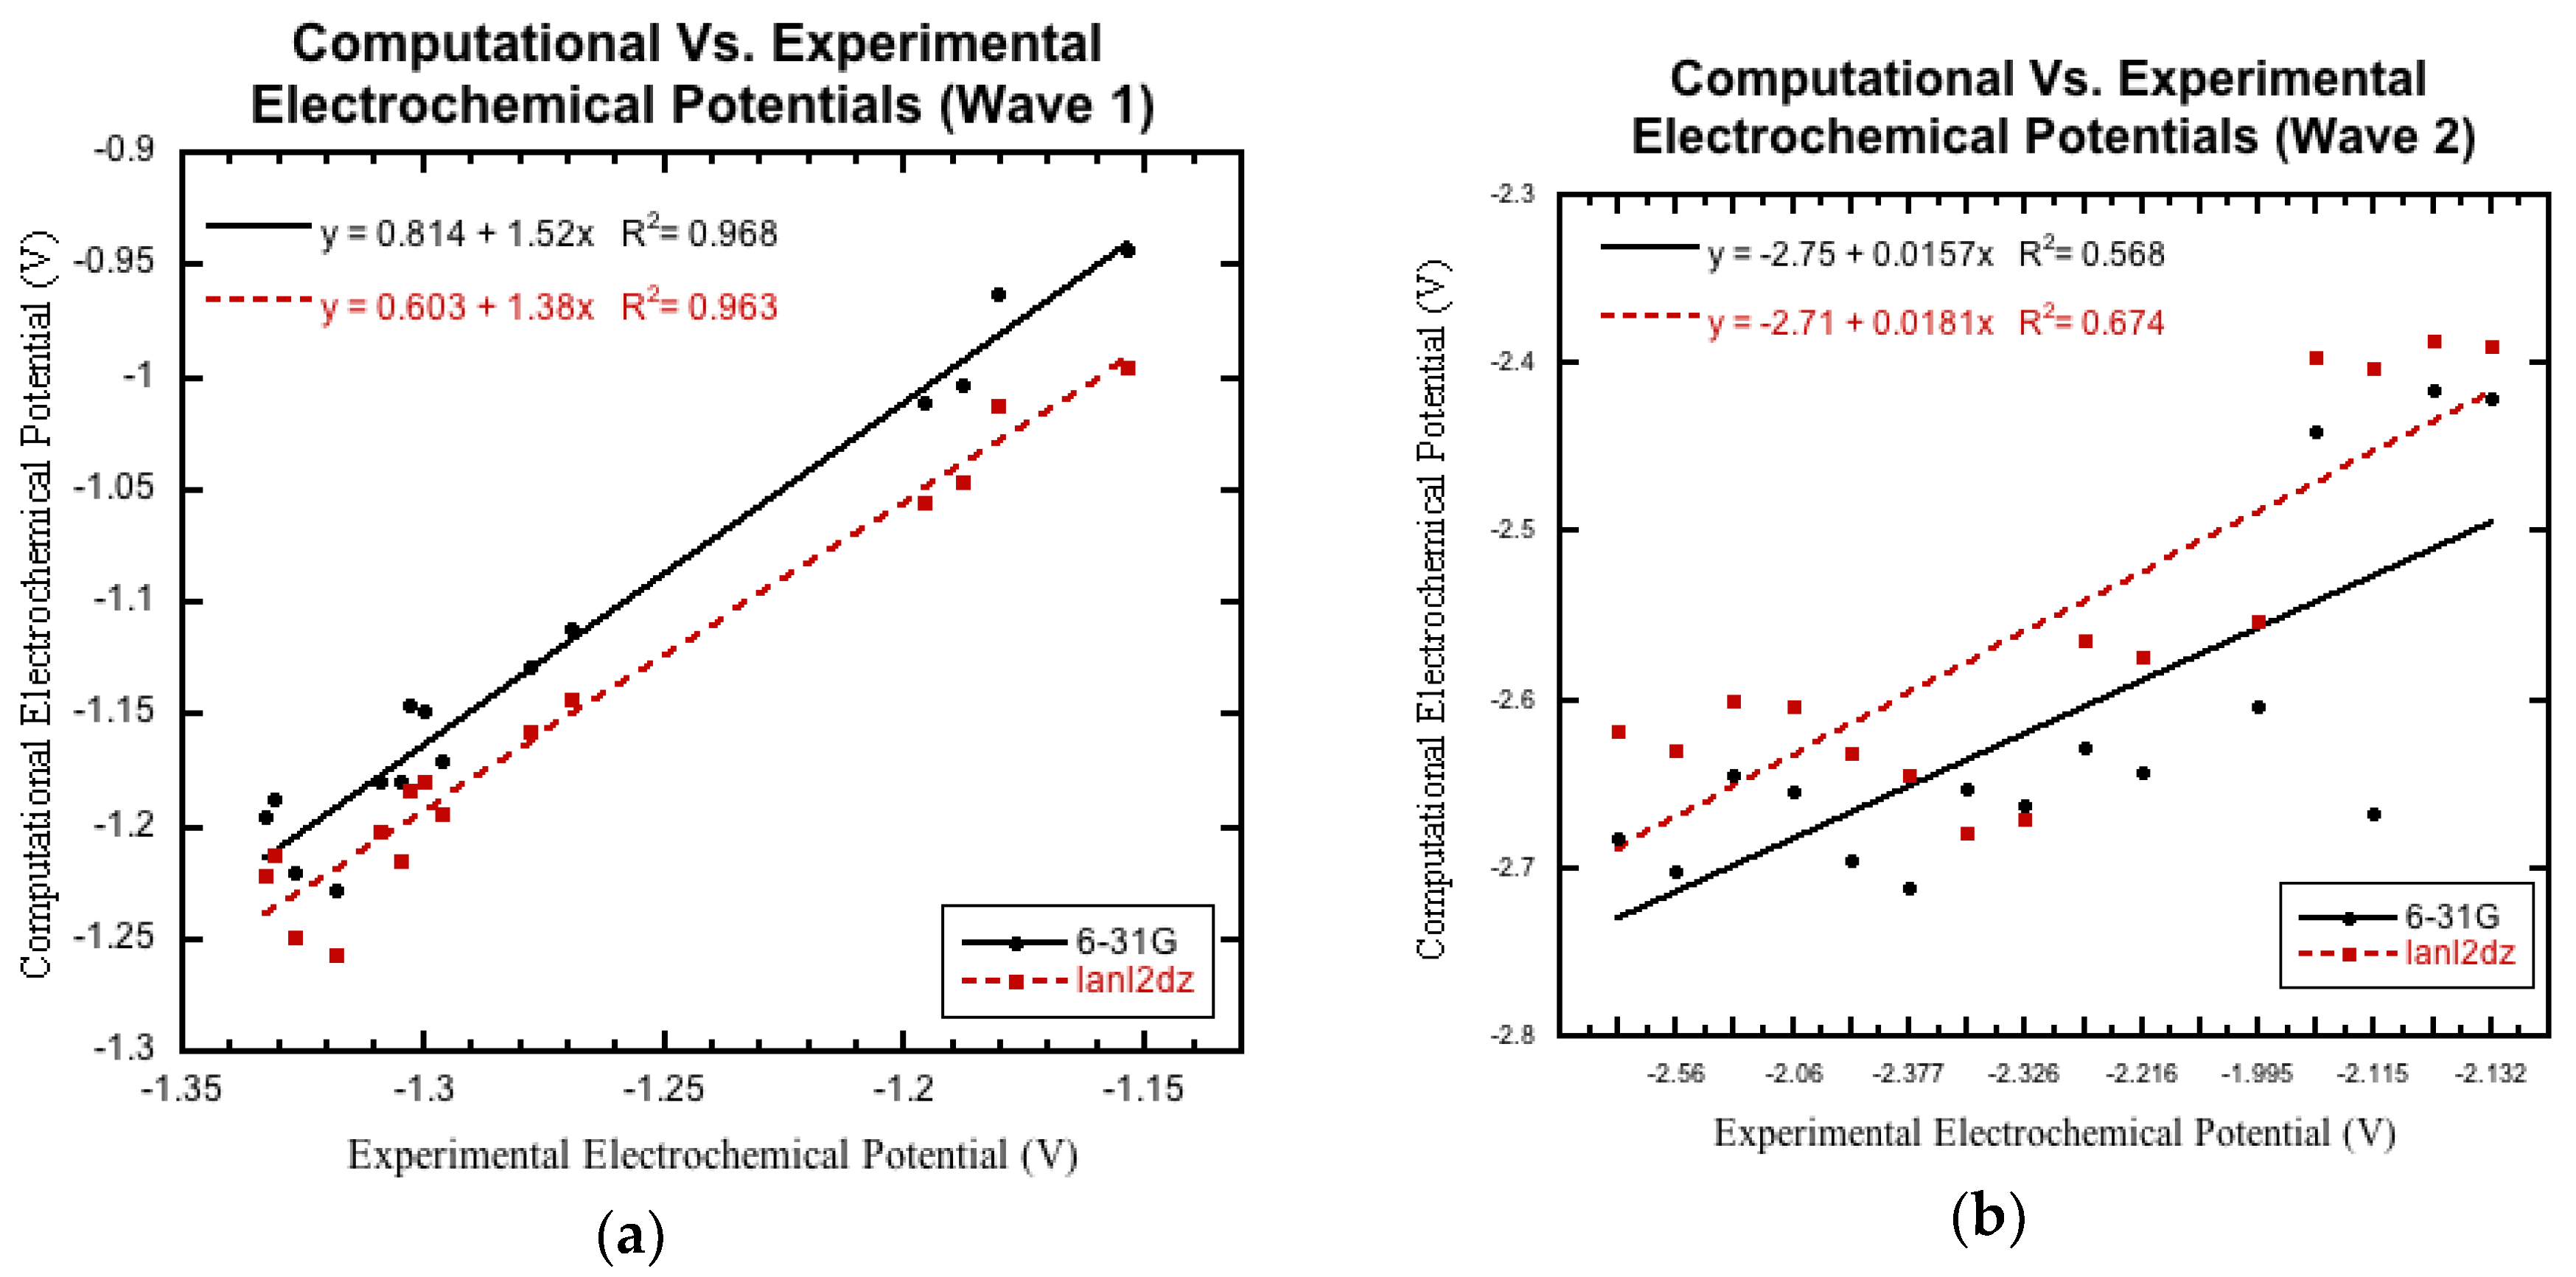
3.3.2. Non-Nitro Containing Derivatives

Figure 7 shows the correlation between predicted and experimental values of Wave 1 (a) and Wave 2 (b) for the basis sets 6-31G (black) and lanl2dz (red) basis sets for derivatives A1-D4, excluding C3. For Wave 1, both basis sets give a strong correlation (r2 > 0.96). The range of the Wave 1 values for A1-D4 was −0.9437 V to −1.2280 V for 6-31G and −0.9956 V to −1.2573 V for lanl2dz. The computational range therefore was similar to the experimental range of −1.154 V to −1.333 V. The slope of the correlation was 1.38 and 1.52 for the lanl2dz and 6-31G data set respective comparisons. The slope sign indicates that the basis set is accurately predicting the direction of change in the reduction potential caused by changing the functional groups. The magnitude of the slope indicates that the computationally predicted values were differing with respect to the different functional groups more than was observed in the experiment.
Wave 2 had only a moderate agreement with experimental results for derivatives A1−D4, excluding C3. The r2 values were determined to be 0.674 and 0.568 for lanl2dz and 6-31G basis sets, respectively. The values for Wave 2 ranged from −2.3864 V to −2.7082 V for lanl2dz and −2.415 V to −2.7013 V for 6-31G. The predicted values were slightly shifted from the experimentally observed values of −1.995 V to −2.377 V. The Wave 2 experimental values were not reversible and so the experimental Wave 2 peaks are reported as the value of the cathodic peak. The slope for the correlations was found to be 0.0181 and 0.0157 for the comparisons for the predicted to experimental data sets for lanl2dz and 6-31G respectively. The slopes are positive indicating the accurate prediction of the direction of change from changing the functional groups. However, the magnitude of the slope value indicates that the predicted values do not change as much as the experimental values with respect to the identity of the chemical functional groups.

3.3.3. Nitro Containing Derivatives

Figure 8 shows the correlation between predicted and experimental values of Wave 1 (a) and Wave 2 (b) for the basis sets 6-31G (black) and lanl2dz (red) basis sets for derivatives E1-E3. With the 6-31G basis set, the final structure required to calculate the Wave 2 for E4 would not optimize. The Nitro Wave and Wave 2 could not be calculated for E4 with the 6-31G basis set. Additionally, E4 appeared to be an outlier for the lanl2dz waves and Wave 1 with 6-31G. We opted to exclude E4 from the analysis for both data sets. The Wave 1 values were determined to be 3.1827 V to 3.2560 V and 3.1881 to 3.3083 V for lanl2dz and 6-31G basis sets, respectively. Both ranges are completely outside of the expected values. The experimental data range was found to be −1.134 to −1.277 V. Despite the values being out of the expected range, there was a high correlation between the computational data and experimental data (r2 > 0.95) for both basis sets. The Wave 2 had similar results. The range of the Wave 2 values ranged from −8.6752 V to −9.0124 V for lanl2dz and −0.76466 V to 0.95426 V for 6-31G. The experimental results were found to be −2.141 V to −2.372. Again, despite the values being out of the expected range, there was a strong correlation to the experimental values (r2 > 0.89) for both basis sets.
Figure 9 shows the correlation of the Nitro Wave for the basis sets 6-31G (black) and lanl2dz (red) for E1–E3. For the Nitro Wave, the experimental data range was −1.518 V to −1.566 V. The computational data was completely outside of the expected range. The predicted values ranged from −8.8838 V to −9.0124 V for lanl2dz and −8.9948 V to −9.1849 V for 6–31 G. Despite the predicted values falling outside of the expected range, there was a strong correlation for the Nitro Wave for E1–E3 for both basis sets (r2 > 0.96).

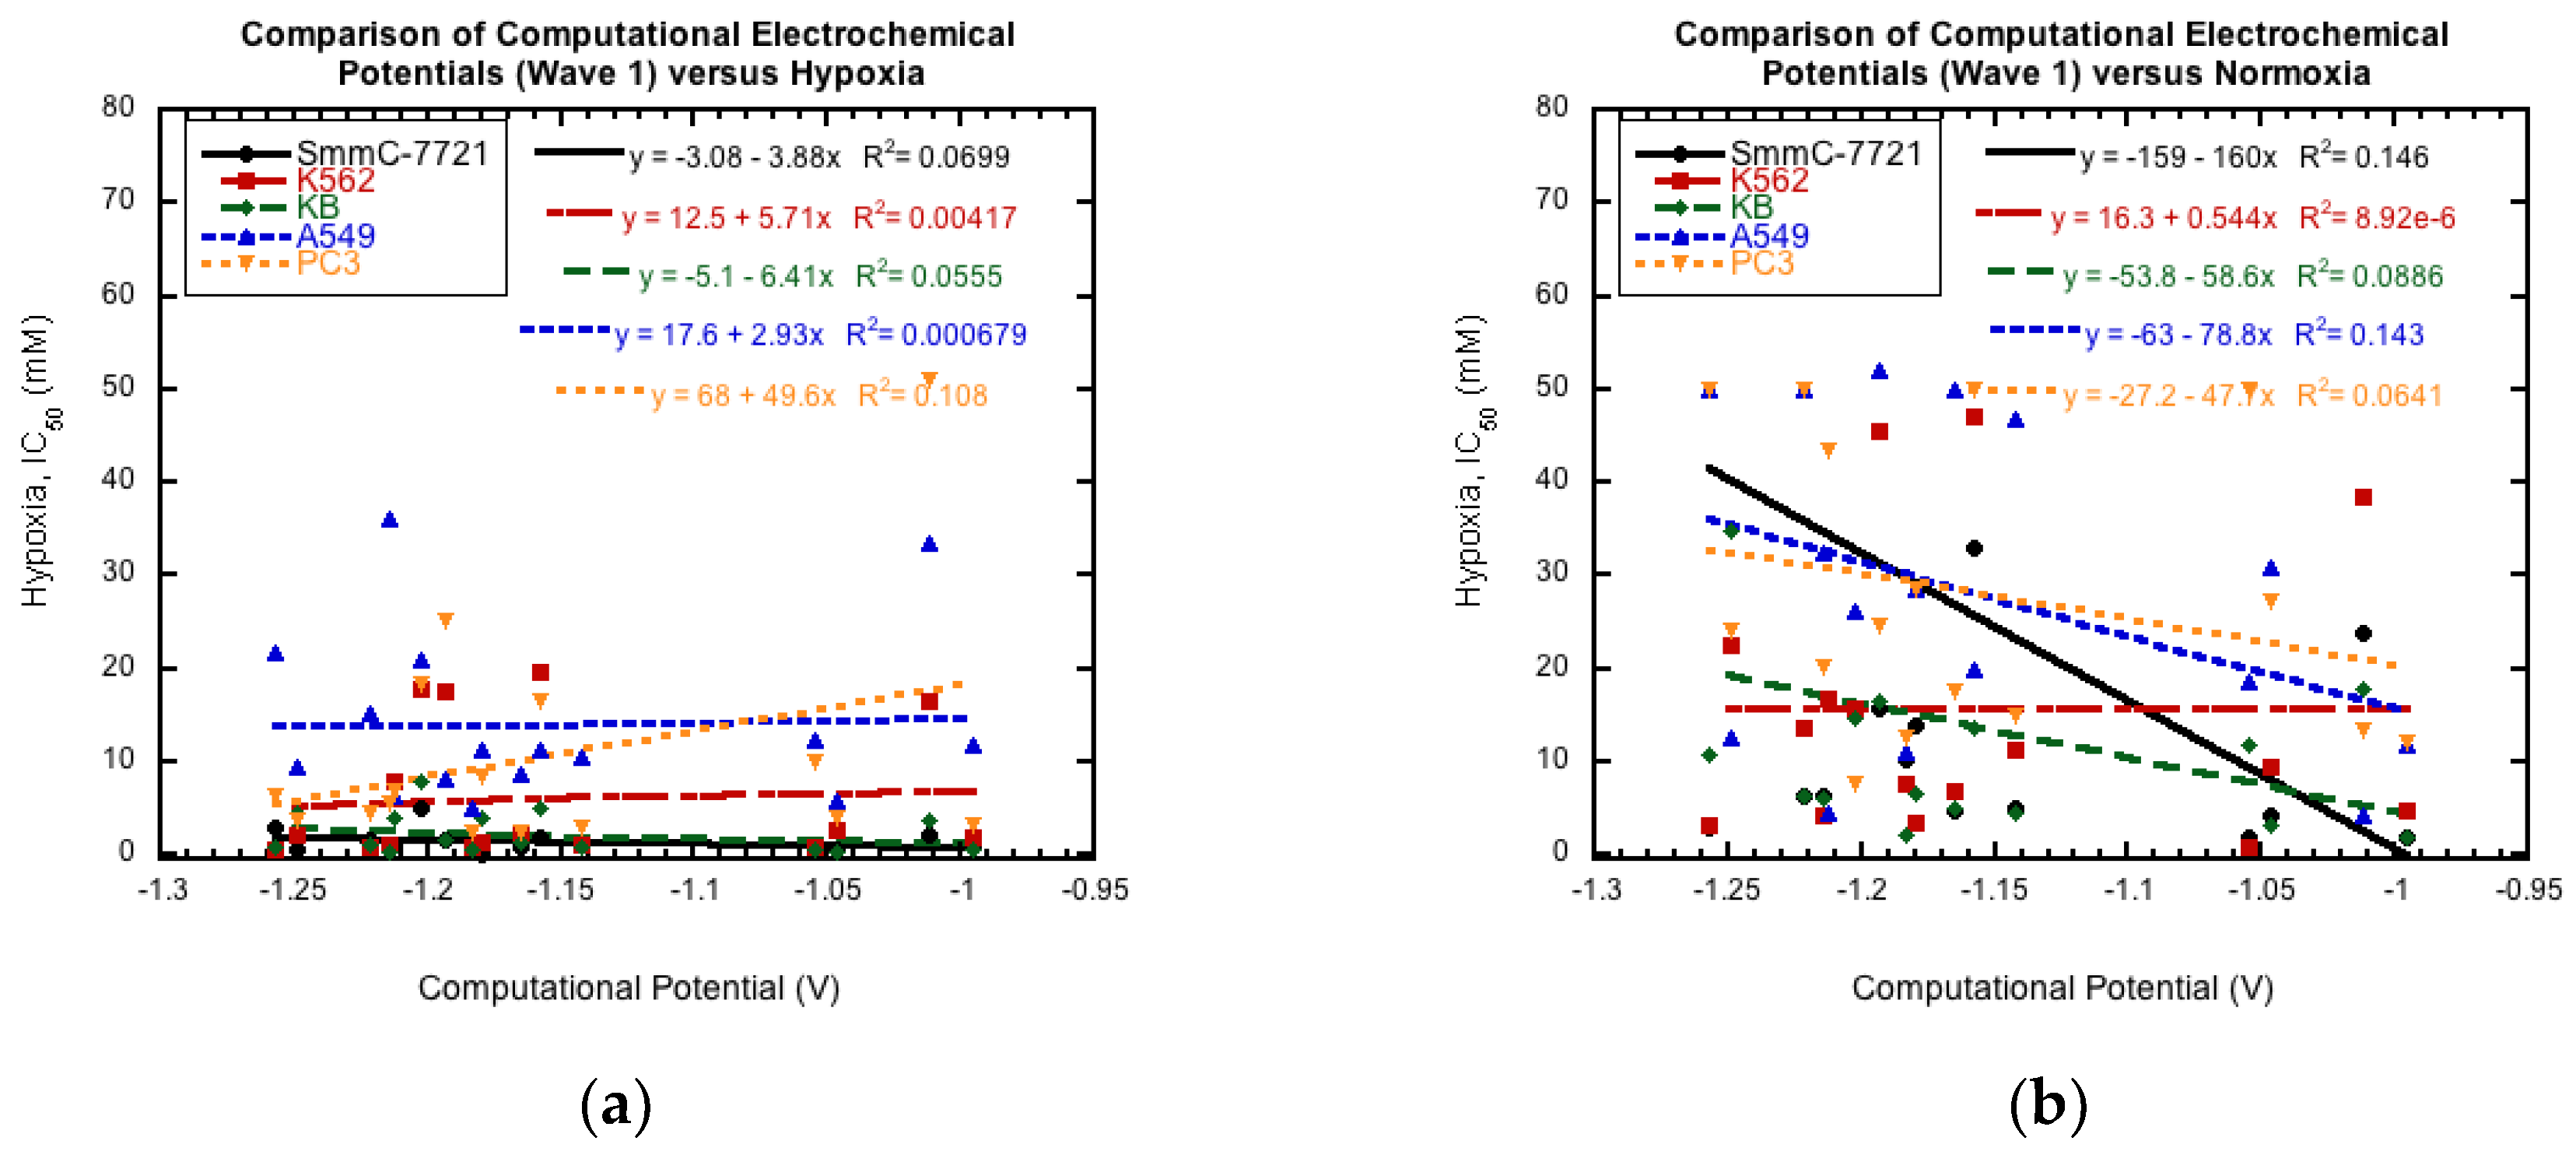
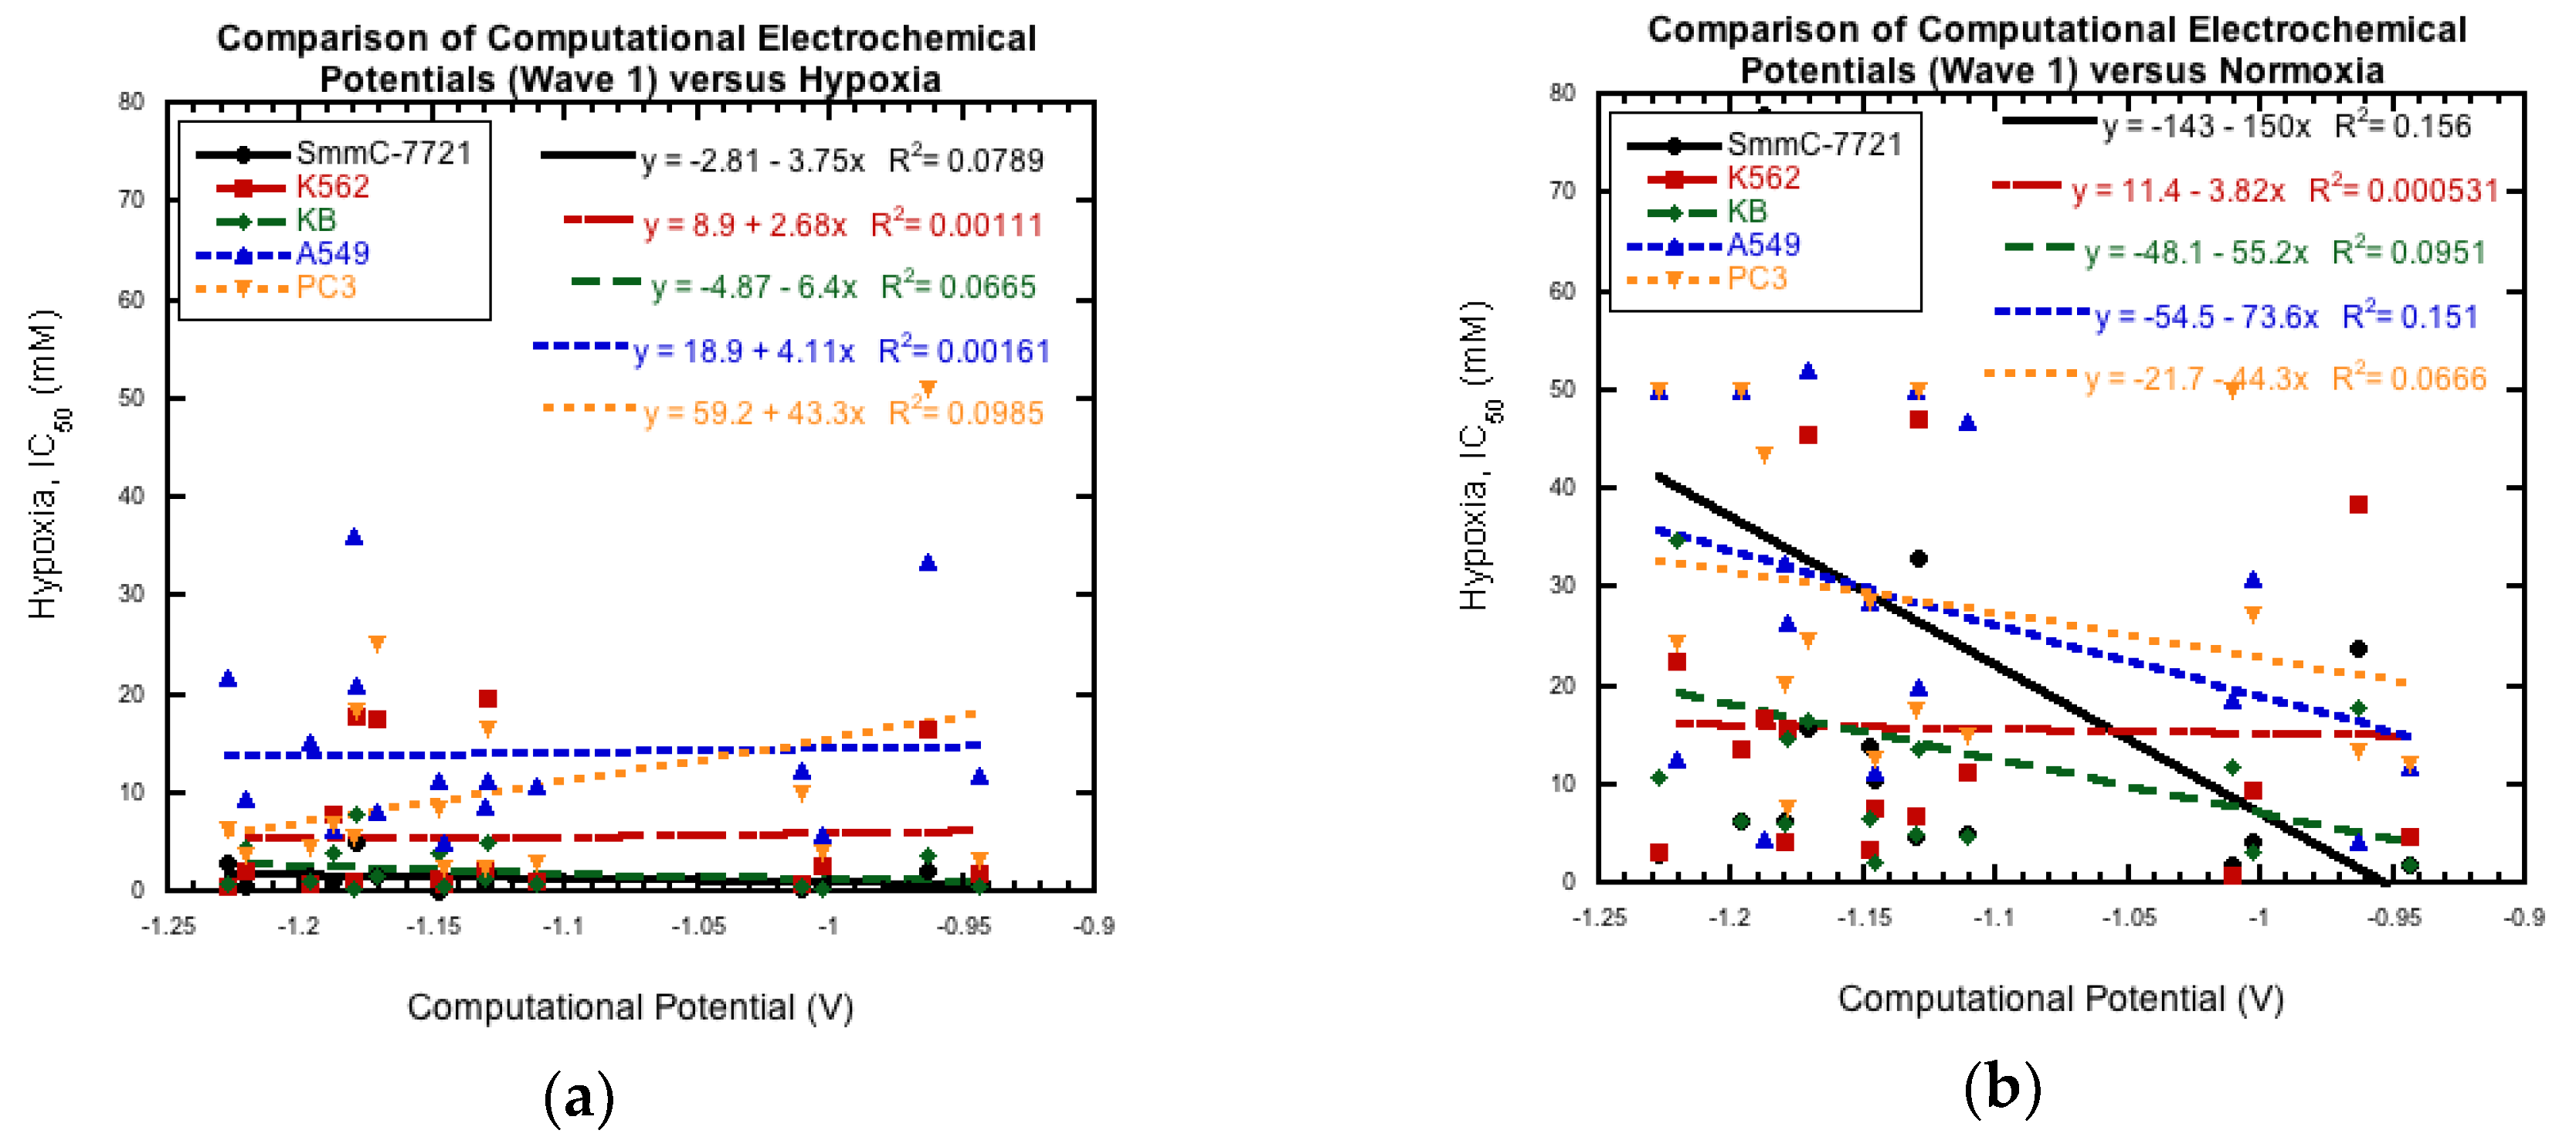
3.4. Comparison to Cytotoxicity

While previous studies have often demonstrated a link between the experimental reduction potentials and the anti-tumor properties for quinoxaline 1,4-di-N-oxide derivatives, no correlation was found for this unique set of twenty derivatives [27]. Due to the correlation of the experimental and computational reduction potentials (Wave 1) for A1-D1 shown in Figure 7a, no correlation was expected between the anti-tumor properties and the predicted Wave 1 reduction potentials. Figure 10 and Figure 11 clearly demonstrate that there is no correlation between the computationally predicted Wave 1 potentials for A1-D4 and the anti-tumor activity under hypoxic and normoxic conditions. The anti-tumor activity was defined based on the previously reported IC50 values for five cancer cell lines: SmmC-7721, K562, KB, A549 and PC3 [26]. In the study, hypoxia was defined as 3% oxygen and normoxia was defined as 20% oxygen [26].

4. Conclusions

The analysis of the ability of DFT: B3LYP calculations with the simple basis sets 6-31g and lanl2dz that require limited computational resources to predict the experimental electrochemical potentials of these quinoxaline 1,4-Di-N-oxide derivatives has demonstrated limited usefulness. The presence of the nitro group dramatically changed the magnitude of the predicted values; therefore, the derivatives with the nitro group (E1–E4) were considered separately than the derivatives without the nitro group (A1–D4). Both basis sets predicted values of Wave 1 in the correct range and had a strong correlation for derivatives without the nitro group (A1–D4). For these compounds (A1–D4), the Wave 2 values were slightly outside of the expected range and had moderate-to-low correlation between the computational and experimental results. For the nitro group compounds (E1–E4), derivative E4 proved ill-behaved. One of the individual structures couldn’t be optimized for the 6-31G basis set. If this derivative (E4) was ignored, there was a strong correlation between experimental and computational data sets for Wave 1, Wave 2, and the Nitro wave, despite the E1–E3 computational values being substantially outside of the predicted values. Given the limited usefulness of the 6–31 g and lanl2dz to predict the experimental electrochemical potentials for this set of quinoxaline 1,4-Di-N-oxide derivatives and the clear impact of the nitro group on the results, we plan to investigate more complex basis sets in the future.

Author Contributions

Conceptualization, P.W.C. and C.M.R.; Data curation, E.M.M.; Formal analysis, E.M.M., H.C.H. and C.M.R.; Funding acquisition, P.W.C. and C.M.R.; Investigation, E.M.M., K.A.B.-M., M.N.M., A.W.N. and C.M.R.; Methodology, PW.C. and C.M.R.; Project administration, C.M.R.; Supervision, P.W.C. and C.M.R.; Validation, C.J.B., H.C.H., M.R.L. and C.M.R.; Visualization, H.C.H., A.W.N. and C.M.R.; Writing—original draft, E.M.M., P.W.C. and C.M.R.; Writing—review & editing, E.M.M., P.W.C. and C.M.R.

Funding

This work was supported by a grant funded by Southeast Missouri State University’s Grants and Research Funding Committee.

Acknowledgments

The authors acknowledge Victor Batista from Yale University for his guidance.

Conflicts of Interest

The authors declare no conflict of interest.

Appendix A

Figure A1. The individual structures for molecule A1 optimized using the 6-31g basis set: (a) the neutral molecule; (b) the possible anion product from Wave 1 with the radical on C2 (c) the possible anion product of Wave 1 with the radical on C3, and (d) the dianion product of Wave 2. Chemical structures created in GaussView 5 [30] and optimized in Gaussian 09 [31].
Computation 07 00006 g0a1
Figure A2. The individual structures for molecule E1 optimized using the 6-31g basis set: (a) the neutral molecule; (b) the possible anion product of Wave 1 with the radical on C2; (c) the possible anion product of Wave 1 with the radicals on C3; (d) the possible dianion product of the Nitro Wave with radicals on C2 and on the nitro group; (e) the possible dianion product of the Nitro Wave with radicals on C3 and on the nitro group; and (f) the trianion product of Wave 2. Chemical structures created in GaussView 5 [30] and optimized in Gaussian 09 [31].
Computation 07 00006 g0a2

References

  1. Anderson, R.F.; Yadav, P.; Shinde, S.S.; Hong, C.R.; Pullen, S.M.; Reynisson, J.; Wilson, W.R.; Hay, M.P. Radical Chemistry and Cytotoxicity of Bioreductive 3-Substituted Quinoxaline Di-N-Oxides. Chem. Res. Toxicol. 2016, 29, 1310–1324. [Google Scholar] [CrossRef] [PubMed]
  2. Zarranz, B.; Jaso, A.; Aldana, I.; Monge, A. Synthesis and Anticancer Activity Evaluation of New 2-Alkylcarbonyl and 2-Benzoyl-3-trifluoromethyl-quinoxaline 1,4-Di-N-oxide Derivatives. Bioorg. Med. Chem. 2004, 12, 3711–3721. [Google Scholar] [CrossRef] [PubMed]
  3. Amin, K.M.; Ismail, M.M.F.; Noaman, E.; Soliman, D.H.; Ammar, Y.A. New quinoxaline 1,4-di-N-oxides. Part 1: Hypoxia-selective cytotoxins and anticancer agents derived from quinoxaline 1,4-di-N-oxides. Bioorg. Med. Chem. 2006, 14, 6917–6923. [Google Scholar] [CrossRef] [PubMed]
  4. Estevez, T.; Quilano, M.; Burguete, A.; Cabanillas, B.; Zimic, M.; Malaga, E.; Verastegui, M.; Pérez-Silanes, S.; Aldana, I.; Monge, A. Trypanocidal Properties, Structure-activity Relationship and Computational Studies of Quinoxaline 1,4-di-N-Oxide Derivatives. Exp. Parasitol. 2011, 127, 745–751. [Google Scholar] [CrossRef] [PubMed]
  5. Ancizu, S.; Moreno, E.; Torres, E.; Burguete, A.; Pérez-Silanes, S.; Benítez, D.; Villar, R.; Solano, B.; Marín, A.; Aldana, I.; et al. Heterocyclic-2-carboxylic Acid (3-Cyano-1,4-di-N-oxidequinoxalin-2-yl)amide Derivatives as Hits for the Development of Neglected Disease Drugs. Molecules 2009, 14, 2256–2272. [Google Scholar] [CrossRef] [PubMed] [Green Version]
  6. Torres, E.; Moreno-Viguri, E.; Galiano, S.; Devarapally, G.; Crawford, P.W.; Azqueta, A.; Arbillaga, L.; Varela, J.; Birriel, E.; Di Maio, R.; et al. Novel Quinoxaline 1,4-Di-N-Oxide Derivatives as New Potential Antichagasic Agents. Eur. J. Med. Chem. 2013, 66, 324–334. [Google Scholar] [CrossRef] [PubMed]
  7. Soliman, D.H. Anti-bacterial and Anti-fungal Activities of New Quinoxaline 1,4-di-N-Oxide Derivatives. Int. J. Org. Chem. 2013, 3, 65–72. [Google Scholar] [CrossRef]
  8. Carta, A.; Paglietta, G.; Nikookar, M.E.R.; Sanna, P.; Sechi, L.; Zanetti, S. Novel Substituted Quinoxaline 1,4-Dioxides with in vitro Antimycobacterial and Anticandida Activity. Eur. J. Med. Chem. 2002, 37, 355–366. [Google Scholar] [CrossRef]
  9. Vicente, E.; Pérez-Silanes, S.; Lima, L.M.; Ancizu, S.; Burguete, A.; Solano, B.; Villar, R.; Aldana, I.; Monge, A. Against Mycobacterium tuberculosis of New Quinoxaline 1,4-di-N-Oxides. Biorgan. Med. Chem. 2009, 17, 385–389. [Google Scholar] [CrossRef]
  10. Crawford, P.W.; Scamehorn, R.G.; Hollstein, U.; Ryan, M.D.; Kovacic, P. Cyclic Voltammetry of Phenazines and Quinoxalines Including Mono- and Di-N-Oxides. Relation to Structure and Antimicrobial Activity. Chem.-Biol. Interact. 1986, 60, 67–84. [Google Scholar] [CrossRef]
  11. Perez-Silanes, S.; Devarapally, G.; Torres, E.; Moreno, E.; Aldana, I.; Monge, A.; Crawford, P.W. Cyclic Voltammetric Study of Some Anti-Chagas Active Quinoxaline 1,4-Di-N-Oxide-2-Ketone Derivatives. Helv. Chim. Acta 2013, 96, 217–227. [Google Scholar] [CrossRef]
  12. Moreno, E.; Pérez-Silanes, S.; Gouravaram, S.; Macharam, A.; Ancizu, S.; Torres, E.; Aldana, I.; Monge, A.; Crawford, P.W. 1,4-Di-N-oxide quinoxaline-2-carboxamide: Cyclic voltammetry and relationship between electrochemical behavior, structure and anti-tuberculosis activity. Electrochim. Acta 2011, 56, 3270–3275. [Google Scholar] [CrossRef] [Green Version]
  13. Ryan, M.D.; Scamehorn, R.G.; Kovacic, P. Charge Transfer in the Mechanism of Drug Action Involving Quinoxaline Di-N-Oxides. J. Pharm. Sci. 1985, 74, 492–495. [Google Scholar] [CrossRef] [PubMed]
  14. Carta, A.; Corona, P.; Loriga, M. Quinoxaline 1,4-Dioxide: A Versatile Scaffold Endowed with Manifold Activities. Curr. Med. Chem. 2005, 12, 2259–2272. [Google Scholar] [CrossRef] [PubMed]
  15. Cheng, G.; Sa, W.; Cao, C.; Guo, L.; Hao, H.; Liu, Z.; Wang, X.; Yuan, Z. Quinoxaline 1,4-di-N-Oxides: Biological Activities and Mechanisms of Action. Front. Pharmacol. 2016, 7, 1–21. [Google Scholar] [CrossRef] [PubMed]
  16. Tocher, J.H.; Edwards, D. I Electrochemical Characteristics of NitroHeterocyclic Compounds of Biological Interest VIII. Stability of Nitro Radical Anions from Cyclic Voltammetric Studies. Free Radic. Res. Commun. 1992, 16, 19–25. [Google Scholar] [CrossRef]
  17. Tocher, J.H.; Edwards, D. I Electrochemical Characteristics of Nitro-Heterocyclic Compounds of Biological Interest IV. Lifetime of the Metronidazole Radical Anion. Free Radic. Res. Commun. 1989, 6, 39–45. [Google Scholar] [CrossRef]
  18. Tocher, J.H.; Edwards, D. I Electrochemical Characteristics of NitroHeterocyclic Compounds of Biological Interest I. The Influence of Solvent. Free Radic. Res. Commun. 1988, 4, 269–276. [Google Scholar] [CrossRef]
  19. Bollo, S.; Nunez-Vergara, L.J.; Martinez, C.; Chauviere, G.; Perie, J.; Squella, J.A. Volatmmetric Study of Nitro Radical Anion Generated from Some Nitrofuran Compounds of Pharmacological Significance. Electroanalysis 2003, 15, 19–25. [Google Scholar] [CrossRef]
  20. MarvinSketch; ChemAxon Ltd.: Budapest, Hungary, 2018.
  21. Aguilar-Martínez, M.; Cuevas, G.; Jiménez-Estrada, M.; González, I.; Lotina-Hennsen, B.; Macías-Ruvalcaba, N. An Experimental and Theoretical Study of the Substituent Effects on the Redox Properties of 2-[(R-phenyl)amine]-1,4-naphthalenediones in Acetonitrile. J. Org. Chem. 1999, 64, 3684–3694. [Google Scholar] [CrossRef]
  22. Hodgson, J.L.; Namazian, M.; Bottle, S.E.; Coote, M.L. One-Electron Oxidation and Reduction Potentials of Nitroxide Antioxidants:  A Theoretical Study. J. Phys. Chem. A 2007, 111, 13595–13605. [Google Scholar] [CrossRef] [PubMed]
  23. Ribeiro da Silva, M.D.M.C.; Gomes, J.R.B.; Gonçalves, J.M.; Sousa, E.A.; Pandey, S.; Acree, W.E. Thermodynamic Properties of Quinoxaline-1,4-Dioxide Derivatives: A Combined Experimental and Computational Study. J. Org. Chem. 2004, 69, 2785–2792. [Google Scholar] [CrossRef] [PubMed] [Green Version]
  24. Lauria, A.; Almerico, A.M.; Barone, G. The influence of substitution in the quinoxaline nucleus on 1,3-dipolar cycloaddition reactions: A DFT study. Comput. Theor. Chem. 2013, 1013, 116–122. [Google Scholar] [CrossRef]
  25. Mishra, A.; Verma, C.; Srivastava, V.; Lgaz, H.; Quraishi, M.A.; Ebenso, E.E.; Chung, I.-M. Chemical, Electrochemical and Computational Studies of Newly Synthesized Novel and Environmental Friendly Heterocyclic Compounds as Corrosion Inhibitors for Mild Steel in Acidic Medium. J. Bio- Tribo-Corros. 2018, 4, 32. [Google Scholar] [CrossRef]
  26. Hu, Y.; Xia, Q.; Shangguan, S.; Liu, X.; Hu, Y.; Sheng, R. Synthesis and Biological Evaluation of 3-Aryl-quinoxaline-2-carbonitrile 1,4-di-N-Oxide Derivatives as Hypoxic Selective Anti-tumor Agents. Molecules 2012, 17, 9683–9696. [Google Scholar] [CrossRef] [PubMed]
  27. Miller, M.E.; Xia, Q.; Cella, E.M.; Nenninger, W.A.; Mruzik, N.M.; Brillos-Monia, A.K.; Hu, Z.Y.; Sheng, R.; Ragain, M.C.; Crawford, W.P. Voltammetric Study of Some 3-Aryl-quinoxaline-2-carbonitrile 1,4-di-N-oxide Derivatives with Anti-Tumor Activities. Molecules 2017, 22. [Google Scholar] [CrossRef] [PubMed]
  28. Hansch, C.; Leo, A.; Hoekman, D. Exploring QSAR.; Fundamentals and Applications in Chemistry and Biology; American Chemical Society: Washington, DC, USA, 1995. [Google Scholar]
  29. Kunz, K.R.; Iyengar, B.S.; Dorr, R.T.; Alberts, D.S.; Remers, W.A. Structure activity relationship for mitomycin C and mitomycin A analogs. J. Med. Chem. 1991, 34, 2281–2286. [Google Scholar] [CrossRef]
  30. Dennington, R.; Keith, T.; Millam, J. Millam GaussView, Version 5; Semichem Inc.: Shawnee Mission, KS, USA, 2016. [Google Scholar]
  31. Frisch, M.J.; Trucks, G.W.; Schlegel, H.B.; Scuseria, G.E.; Robb, M.A.; Cheeseman, J.R.; Scalmani, G.; Barone, V.; Petersson, G.A.; Nakatsuji, H.; et al. Gaussian 09, Revision 5.0.9; Gaussian, Inc.: Wallingford CT, USA, 2016. [Google Scholar]
  32. Miertuš, S.; Scrocco, E.; Tomasi, J. Electrostatic interaction of a solute with a continuum. A direct utilizaion of AB initio molecular potentials for the prevision of solvent effects. Chem. Phys. 1981, 55, 117–129. [Google Scholar] [CrossRef]
  33. Miertus̃, S.; Tomasi, J. Approximate evaluations of the electrostatic free energy and internal energy changes in solution processes. Chem. Phys. 1982, 65, 239–245. [Google Scholar] [CrossRef]
  34. Pascual-ahuir, J.L.; Silla, E.; Tuñon, I. GEPOL: An improved description of molecular surfaces. III. A new algorithm for the computation of a solvent-excluding surface. J. Comput. Chem. 1994, 15, 1127–1138. [Google Scholar] [CrossRef]
  35. Palma, J.L.; Batista, V.S. Tutorial on Ab Initio Redox Potential Calculations. 2016. Available online: http://ursula.chem.yale.edu/~batista/classes/tutorials/redoxpotentials.pdf (accessed on 10 January 2019).
  36. Karlsson, C.; Jämstorp, E.; Strømme, M.; Sjödin, M. Computational Electrochemistry Study of 16 Isoindole-4,7-diones as Candidates for Organic Cathode Materials. J. Phys. Chem. C 2012, 116, 3793–3801. [Google Scholar] [CrossRef]
  37. Sawyer, D.T.; Sobkowiak, A.; Roberts, J.L. Elecrochemistry for Chemists, 2nd ed.; Wiley-Interscience Publication: New York, NY, USA, 1995; ISBN 978-0-471-59468-0. [Google Scholar]
  38. Crawford, P.W.; Carlos, E.; Ellegood, J.C.; Cheng, C.C.; Dong, Q.; Liu, D.F.; Luo, Y.L. The electrochemistry of antineoplastic furanquinones: Electrochemical properties of benzo[b]naphtho[2,3-d]furan-6,11-dione derivatives. Electrochim. Acta 1996, 41, 2399–2403. [Google Scholar] [CrossRef]
Scheme 1. The first (Wave 1) and second reduction (Wave 2) of the diazine ring in quinoxaline 1,4-di-N-oxide. Chemical structures drawn in MarvinSketch [20].
Computation 07 00006 sch001
Figure 1. The individual structures for molecule A1: (a) the neutral molecule; (b) the possible anion product from Wave 1 with the radical on C2 (c) the possible anion product of Wave 1 with the radical on C3; and (d) the dianion product of Wave 2. Chemical structures drawn in MarvinSketch [20].
Computation 07 00006 g001aComputation 07 00006 g001b
Figure 2. The individual structures for molecule E1: (a) the neutral molecule; (b) the possible anion product of Wave 1 with the radical on C2; (c) the possible anion product of Wave 1 with the radical on C3; (d) the possible dianion product of the Nitro Wave with radicals on C2 and on the nitro group; (e) the possible dianion product of the Nitro Wave with radicals on C3 and on the nitro group; and (f) the trianion product of Wave 2. Chemical structures drawn in MarvinSketch [20].
Computation 07 00006 g002aComputation 07 00006 g002b
Figure 3. A visual representation of the thermodynamic cycles used to calculate Gred: (a) Wave 1 (1st N-oxide reduction) and Wave 2 (2nd N-oxide reduction) for derivatives A1–D4 and (b) Wave 1 (1st N-oxide reduction), Nitro Wave (nitro group reduction) and Wave 2 (2nd N-oxide reduction) for derivatives E1–E4.
Computation 07 00006 g003
Figure 4. The presence of the chlorine atom in the R1 group, when an NO2 is present on the R2 group results in a dissociation of the chlorine from the rest of the molecule, moving directly away from the nearby oxygen. Chemical structure created in GaussView 5 [30] and optimized in Gaussian 09 [31].
Computation 07 00006 g004
Figure 5. The anion structures of derivative A1 in resonance after accepting an extra electron during Wave 1. Chemical structures drawn in MarvinSketch [20].
Computation 07 00006 g005
Figure 6. The computationally derived reduction potentials for (a) Wave 1 (1st N-oxide reduction) and (b) Wave 2 (2nd N-oxide reduction) compared to the previously reported experimentally measured data [27]. The basis set for lanl2dz is shown in red and 6-31g basis set is shown in black. Derivative C3 is excluded.
Computation 07 00006 g006
Figure 7. The computationally derived reduction potentials for (a) Wave 1 (1st N-oxide reduction) and (b) Wave 2 (2nd N-oxide reduction) compared to the previously reported experimentally measured data [27]. The basis set for lanl2dz is shown in red and 6-31g basis set is shown in black. Derivatives C3 and E1–E4 are excluded.
Computation 07 00006 g007
Figure 8. The computationally derived reduction potentials for (a) Wave 1 (1st N-oxide reduction) and (b) Wave 2 (2nd N-oxide reduction) compared to the previously reported experimentally measured data [27]. The basis set for lanl2dz is shown in red and 6–31 g basis set is shown in black. Derivatives E1–E3 included.
Computation 07 00006 g008
Figure 9. The computationally derived reduction potentials for Nitro Wave compared to the previously reported experimentally measured data [27]. The basis set for lanl2dz is shown in red and 6-31g basis set is shown in black. Derivatives E1–E3 included.
Computation 07 00006 g009
Figure 10. The computationally predicted reduction potentials from lanl2dz for Wave 1 (1st N-oxide reduction) and compared to the previously reported IC50 (μM) for five cancer cell lines [26] under (a) hypoxic and (b) normoxic conditions for A1–D4. Hypoxia = 3% oxygen, Normoxia = 20% oxygen.
Computation 07 00006 g010
Figure 11. The computationally derived reduction potentials from 6-31g for Wave 1 (1st N-oxide reduction) and compared to the previously reported IC50 (μM) for five cancer cell lines [26] under (a) hypoxic and (b) normoxic conditions for A1–D4. Hypoxia = 3% oxygen, Normoxia = 20% oxygen.
Computation 07 00006 g011
Table 1. Structures of the 3-aryl-quinoxaline-2-carbonitrile 1,4-di-N-oxide derivatives [26,27].
Computation 07 00006 i001
CompoundR1R2
A1HH
A2CH3H
A3OCH3H
A4ClH
B1H3-CH3
B2CH33-CH3
B3OCH33-CH3
B4Cl3-CH3
C1H3-Cl
C2CH33-Cl
C3OCH33-Cl
C4Cl3-Cl
D1H4-Br
D2CH34-Br
D3OCH34-Br
D4Cl4-Br
E1H4-NO2
E2CH34-NO2
E3OCH34-NO2
E4Cl4-NO2
Table 2. The half-cell reaction potentials in volts for Wave 1, Nitro Wave, and Wave 2 calculated using the BYL3P DFT lanl2dz and 6-31g basis sets in Gaussian 09.
Wave 1Nitro Wave (E1–E4 Only)Wave 2
CompoundsLanl2dz6-31gLanl2dz6-31gLanl2dz6-31g
A13.6006 3.2891 - - - - - - - - - - 2.1763 1.7774
A23.5453 3.2395 - - - - - - - - - - 2.1618 1.7652
A33.5818 3.2723 - - - - - - - - - - 2.2294 1.8321
A43.7477 3.4570 - - - - - - - - - - 2.3981 2.0192
B13.5920 3.2807 - - - - - - - - - - 2.1636 1.7586
B23.5370 3.2319 - - - - - - - - - - 2.0861 1.7480
B33.5729 3.2639 - - - - - - - - - - 2.2190 1.8172
B43.7390 3.4489 - - - - - - - - - - 2.3920 1.7917
C13.6516 3.3487 - - - - - - - - - - 2.1944 1.8146
C23.6111 3.3141 - - - - - - - - - - 2.1161 1.8077
C33.6295 3.3292 - - - - - - - - - - 2.2472 1.8647
C43.7986 3.5162 - - - - - - - - - - 2.4078 2.0440
D13.6364 3.3307 - - - - - - - - - - 2.1920 1.8055
D23.5797 3.2800 - - - - - - - - - - 2.1228 1.7977
D33.6150 3.3119 - - - - - - - - - - 2.2407 1.8561
D43.7825 3.4970 - - - - - - - - - - 2.4046 2.0388
E18.05027.7682−4.2182−4.72495.61765.4141
E28.00437.7169−4.1840−4.63345.57845.2614
E37.96447.6723−4.0895−4.53495.57975.2245
E47.97697.6480−3.8809- - - - -5.7205- - - - -
Table 3. The electrochemical cell reaction potentials (εcell) in volts with the standard hydrogen electrode (SHE) reduction potential set to zero for Wave 1, Nitro Wave, and Wave 2 calculated using DFT: BYL3P with lanl2dz and 6-31g basis sets in Gaussian 09.
Wave 1Nitro Wave (E1–E4 Only)Wave 2
Compounds Lanl2dz6-31g Lanl2dz 6-31g Lanl2dz 6-31g
A1−1.9136 −1.8908 - - - - - - - - - - −3.3379 −3.4025
A2−1.9690 −1.9404 - - - - - - - - - - −3.3524 −3.4147
A3−1.9325 −1.9076 - - - - - - - - - - −3.2848 −3.3479
A4−1.7666 −1.7230 - - - - - - - - - - −3.1161 −3.1607
B1−1.9223 −1.8993 - - - - - - - - - - −3.3507 −3.4213
B2−1.9773 −1.9480 - - - - - - - - - - −3.4282 −3.4319
B3−1.9413 −1.9160 - - - - - - - - - - −3.2952 −3.3627
B4−1.7752 −1.7310 - - - - - - - - - - −3.1222 −3.3882
C1−1.8626 −1.8312 - - - - - - - - - - −3.3199 −3.3654
C2−1.9032 −1.8658 - - - - - - - - - - −3.3982 −3.3722
C3−1.8847 −1.8507 - - - - - - - - - - −3.2671 −3.3152
C4−1.7156 −1.6637 - - - - - - - - - - −3.1064 −3.1359
D1−1.8778 −1.8492 - - - - - - - - - - −3.3233 −3.3744
D2−1.9346 −1.8999 - - - - - - - - - - −3.3915 −3.3822
D3−1.8993 −1.8680 - - - - - - - - - - −3.2735 −3.3238
D4−1.7318 −1.6829 - - - - - - - - - - −3.1097 −3.1411
E12.53602.5883−9.7324−9.90490.103410.23426
E22.49012.5369−9.6982−9.81330.064230.08157
E32.45022.4924−9.6038−9.71480.065480.04466
E42.46272.4681−9.3952- - - - - 0.20624- - - - -
Table 4. The electrochemical cell reaction potentials (ε’cell) in volts with the ferrocene/ferrocenium reduction potential set to zero for Wave 1, Nitro Wave, and Wave 2 calculated using DFT: BYL3P with lanl2dz and 6-31g basis sets in Gaussian 09.
Wave 1Nitro Wave (E1–E4 Only)Wave 2
Compounds Lanl2dz 6-31g Lanl2dz 6-31g Lanl2dz 6-31g
A1−1.1936 −1.1708 - - - - - - - - - - −2.6179 −2.6825
A2−1.2490 −1.2204 - - - - - - - - - - −2.6324 −2.6947
A3−1.2125 −1.1876 - - - - - - - - - - −2.5648 −2.6279
A4−1.0466 −1.0030 - - - - - - - - - - −2.3961 −2.4407
B1−1.2023 −1.1793 - - - - - - - - - - −2.6307 −2.7013
B2−1.2573 −1.2280 - - - - - - - - - - −2.7082 −2.7119
B3−1.2213 −1.1960 - - - - - - - - - - −2.5752 −2.6427
B4−1.0552 −1.0110 - - - - - - - - - - −2.4022 −2.6682
C1−1.1426 −1.1112 - - - - - - - - - - −2.5999 −2.6454
C2−1.1832 −1.1458 - - - - - - - - - - −2.6782 −2.6522
C3−1.1647 −1.1307 - - - - - - - - - - −2.5471 −2.5952
C4−0.9956 −0.9437 - - - - - - - - - - −2.3864 −2.4159
D1−1.1578 −1.1292 - - - - - - - - - - −2.6033 −2.6544
D2−1.2146 −1.1799 - - - - - - - - - - −2.6715 −2.6622
D3−1.1793 −1.1480 - - - - - - - - - - −2.5535 −2.6038
D4−1.0118 −0.9629 - - - - - - - - - - −2.3897 −2.4211
E13.2560 3.3083−9.0124−9.18490.823410.95426
E23.21013.2569−8.9782−9.09330.784230.80157
E33.17023.2124−8.8838−8.99480.785480.76466
E43.18273.1881−8.6752- - - - - 0.92624- - - - -
Table 5. Cyclic voltammetric data of the 3-aryl-quinoxaline-2-carbonitrile 1,4-di-N-oxide derivatives [27]. Substrate, 1.0 mM; TBAP, 0.1 M; DMF; Pt working electrode; Ag/AgNO3 reference electrode; Pt wire electrode; 100 mV/s; room temperature; E vs. (Fc/Fc+)/V; currents reported in µA; voltammograms recorded with a CH Instruments Model 620 Electrochemistry Analyzer.
Wave 1Nitro Wave (E1–E4 Only)Wave 2
CompoundsE1/2 (V)E1/2 (V)Epc (V)
A1−1.296- - - - -−2.163
A2−1.327- - - - -−2.310
A3−1.331- - - - -−2.166
A4−1.188- - - - -−1.973
B1−1.309- - - - -−2.56 b
B2−1.318- - - - -−2.377
B3−1.333- - - - -−2.216
B4−1.196- - - - -−2.115
C1−1.269- - - - -−2.097
C2−1.303- - - - -−2.125
C3−1.401 a- - - - -No Value
C4−1.154- - - - -−2.080
D1−1.278- - - - -−2.06 b
D2−1.305- - - - -−2.326
D3−1.300- - - - -−1.995
D4−1.181- - - - -−2.132
E1−1.234−1.518−2.306
E2−1.265−1.539−2.352
E3−1.277−1.566−2.372
E4−1.134−1.514−2.141
a Irreversible; b Shoulder.

