Critical Issues in Modelling Lymph Node Physiology
Abstract
:1. Introduction
2. Major Structural Elements of a Paradigmatic Lymph Node
3. Computational Models of FRC- and Blood Vascular Networks of Lymph Nodes
3.1. Cellular Potts Modelling of the FRC Network
3.2. Modelling Blood Vascular Network
3.2.1. Initial Data
3.3. Algorithm of Network Graph Generation
- Step 1.
- Graph topology organisation. In this step we generate the basis points and edges of connections.
- Step 2.
- Local edge length optimization. In this step we use the algorithm from [7] just for a local (i.e., for neighbouring nodes) adjustment of the mismatch of the model and target graph edges lengths. In this and the next steps, the following parameter from Step 1 is used: blos (length of segmentation of the vessels). It’s the canonical length of segments of the vessels graph.
- Step 3.
- Global network structure optimization. In this step we use a modified algorithm from [7] for (i) minimization of the edge length deviation from the real data for all neighbouring nodes; (ii) pushing apart disconnected nodes from each other to prevent merger of the vessels; and (iii) shifting the nodes away from the prohibited domains associated with other LN structures.
| // Initialise the data arrays |
| // Specify the segmentation accuracy, vessels radius and decreasing, processing zone size |
| // Attach the input and output vessels |
| // simple lines, splitted into 100 segments |
| // In this loop, we create new vessels, growing from input and output vessels |
| // sc defines the number of segments for current generating line |
| // we used points pmXX to avoid helical structures while the second and |
| // third parts of graph construction. |
| // In this cycle in each loop we create two sub-vessels for each |
| // couple [lx1, lx2], created while previous loop |
| // here we connect the inner and outer parts of vessel |
3.4. Integrative Geometric Model of Vascular Networks
4. Lymph Dynamics in Conduit Elements of FRC Network
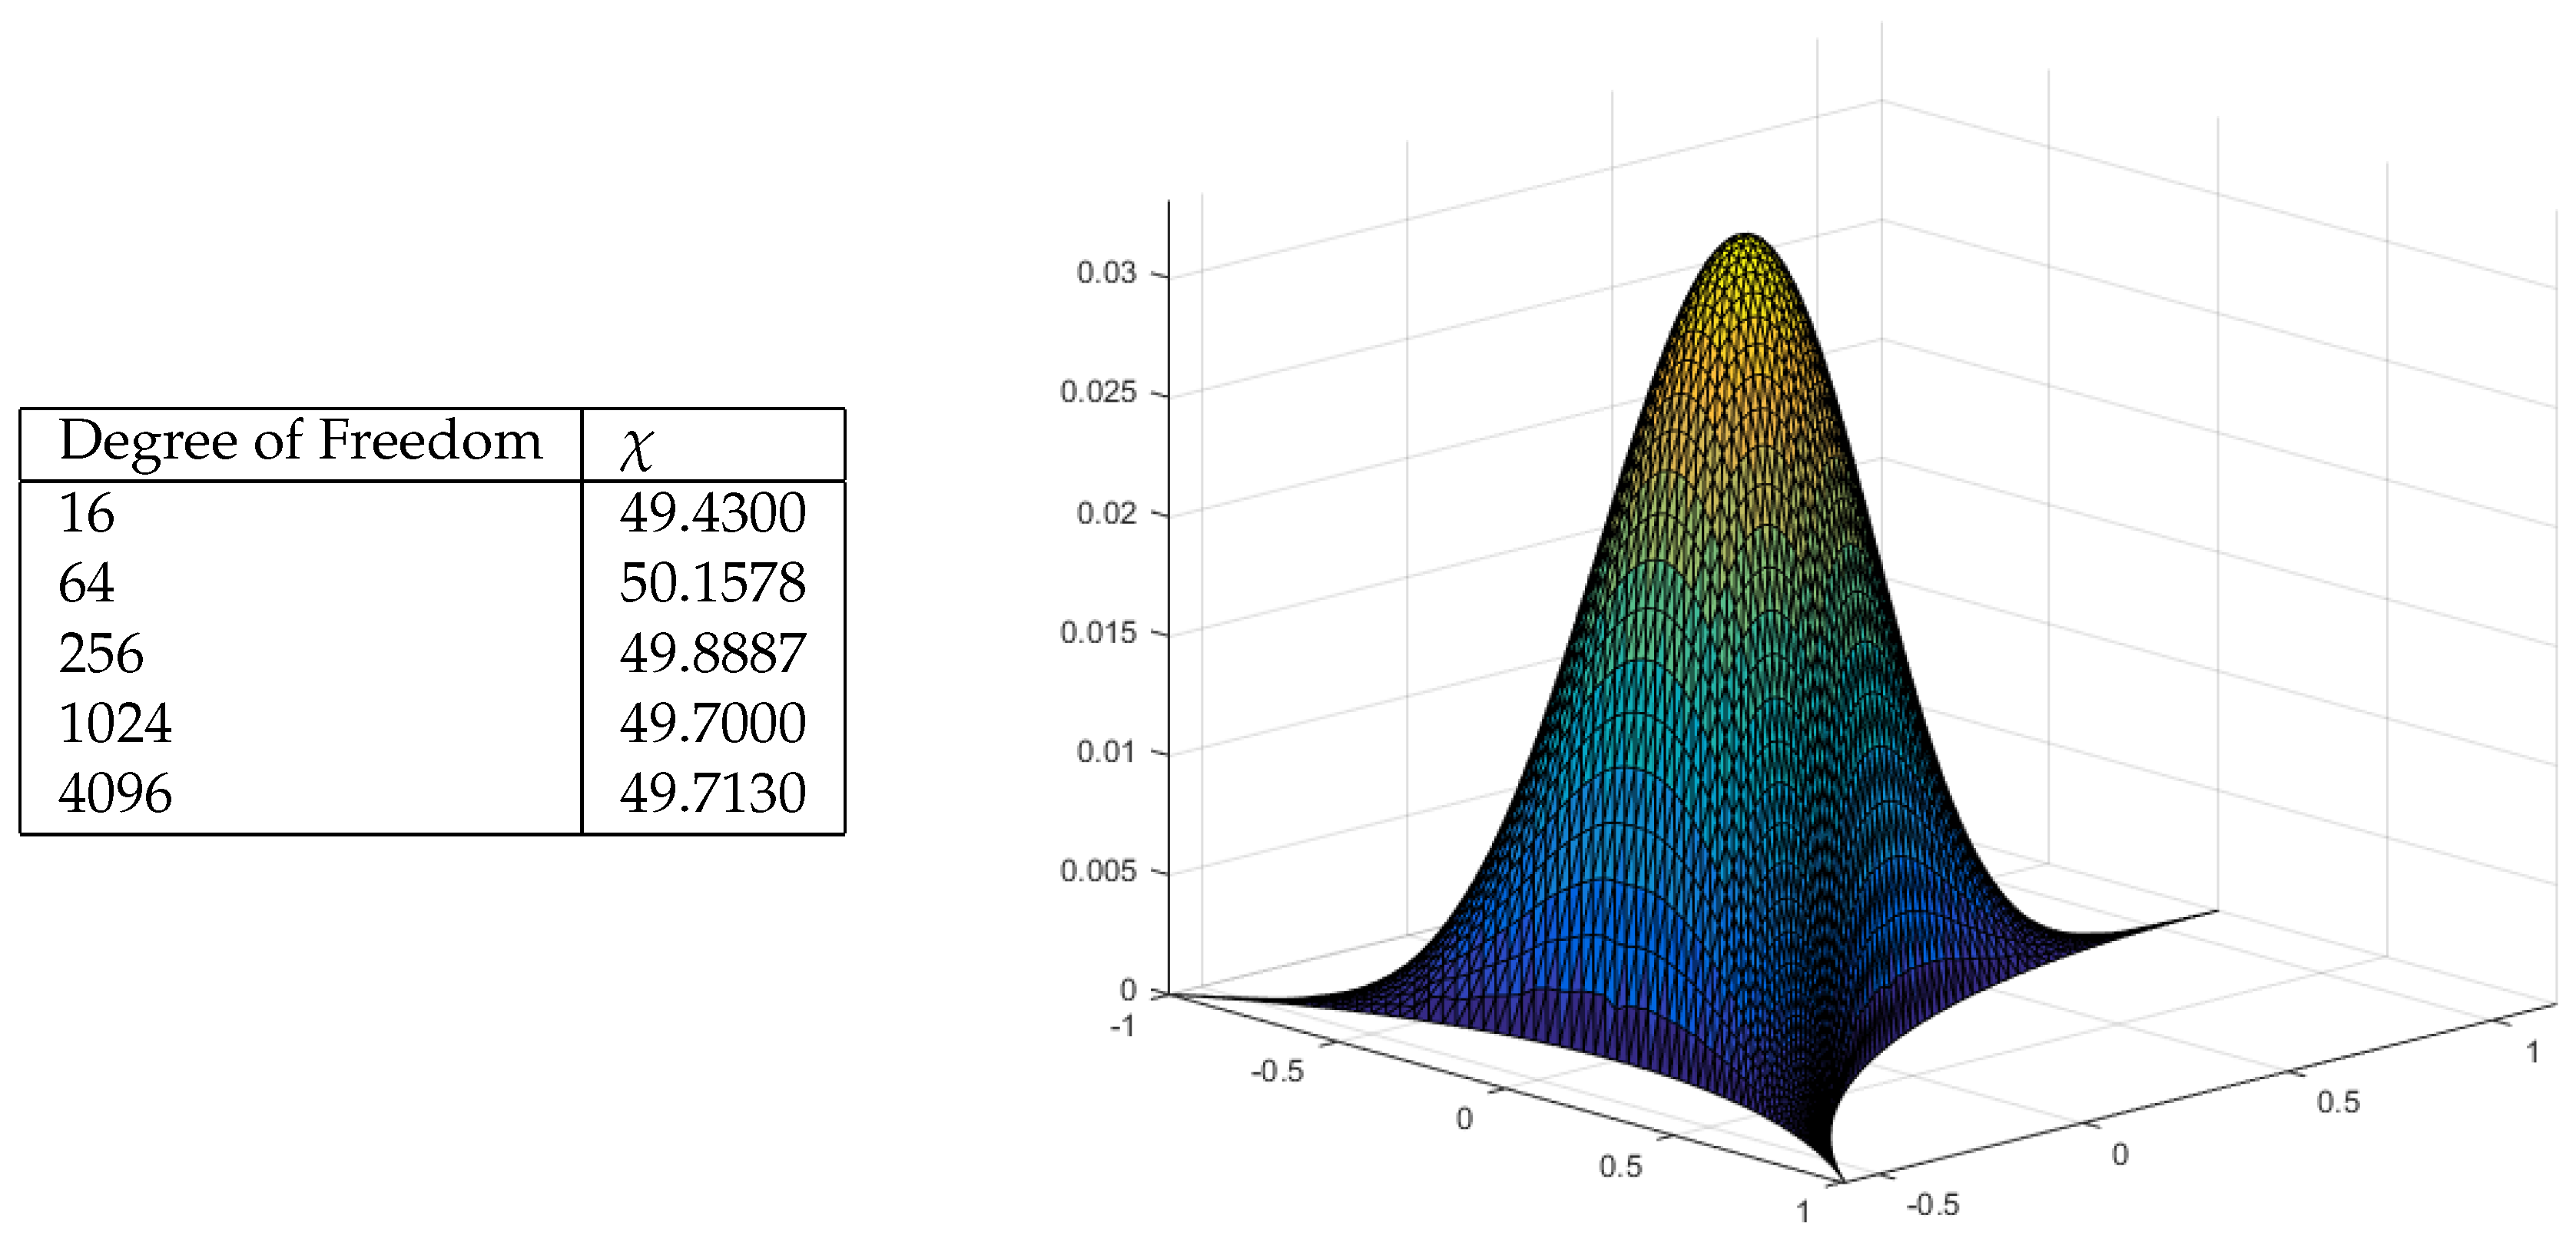
4.1. Transport Through a Single Conduit
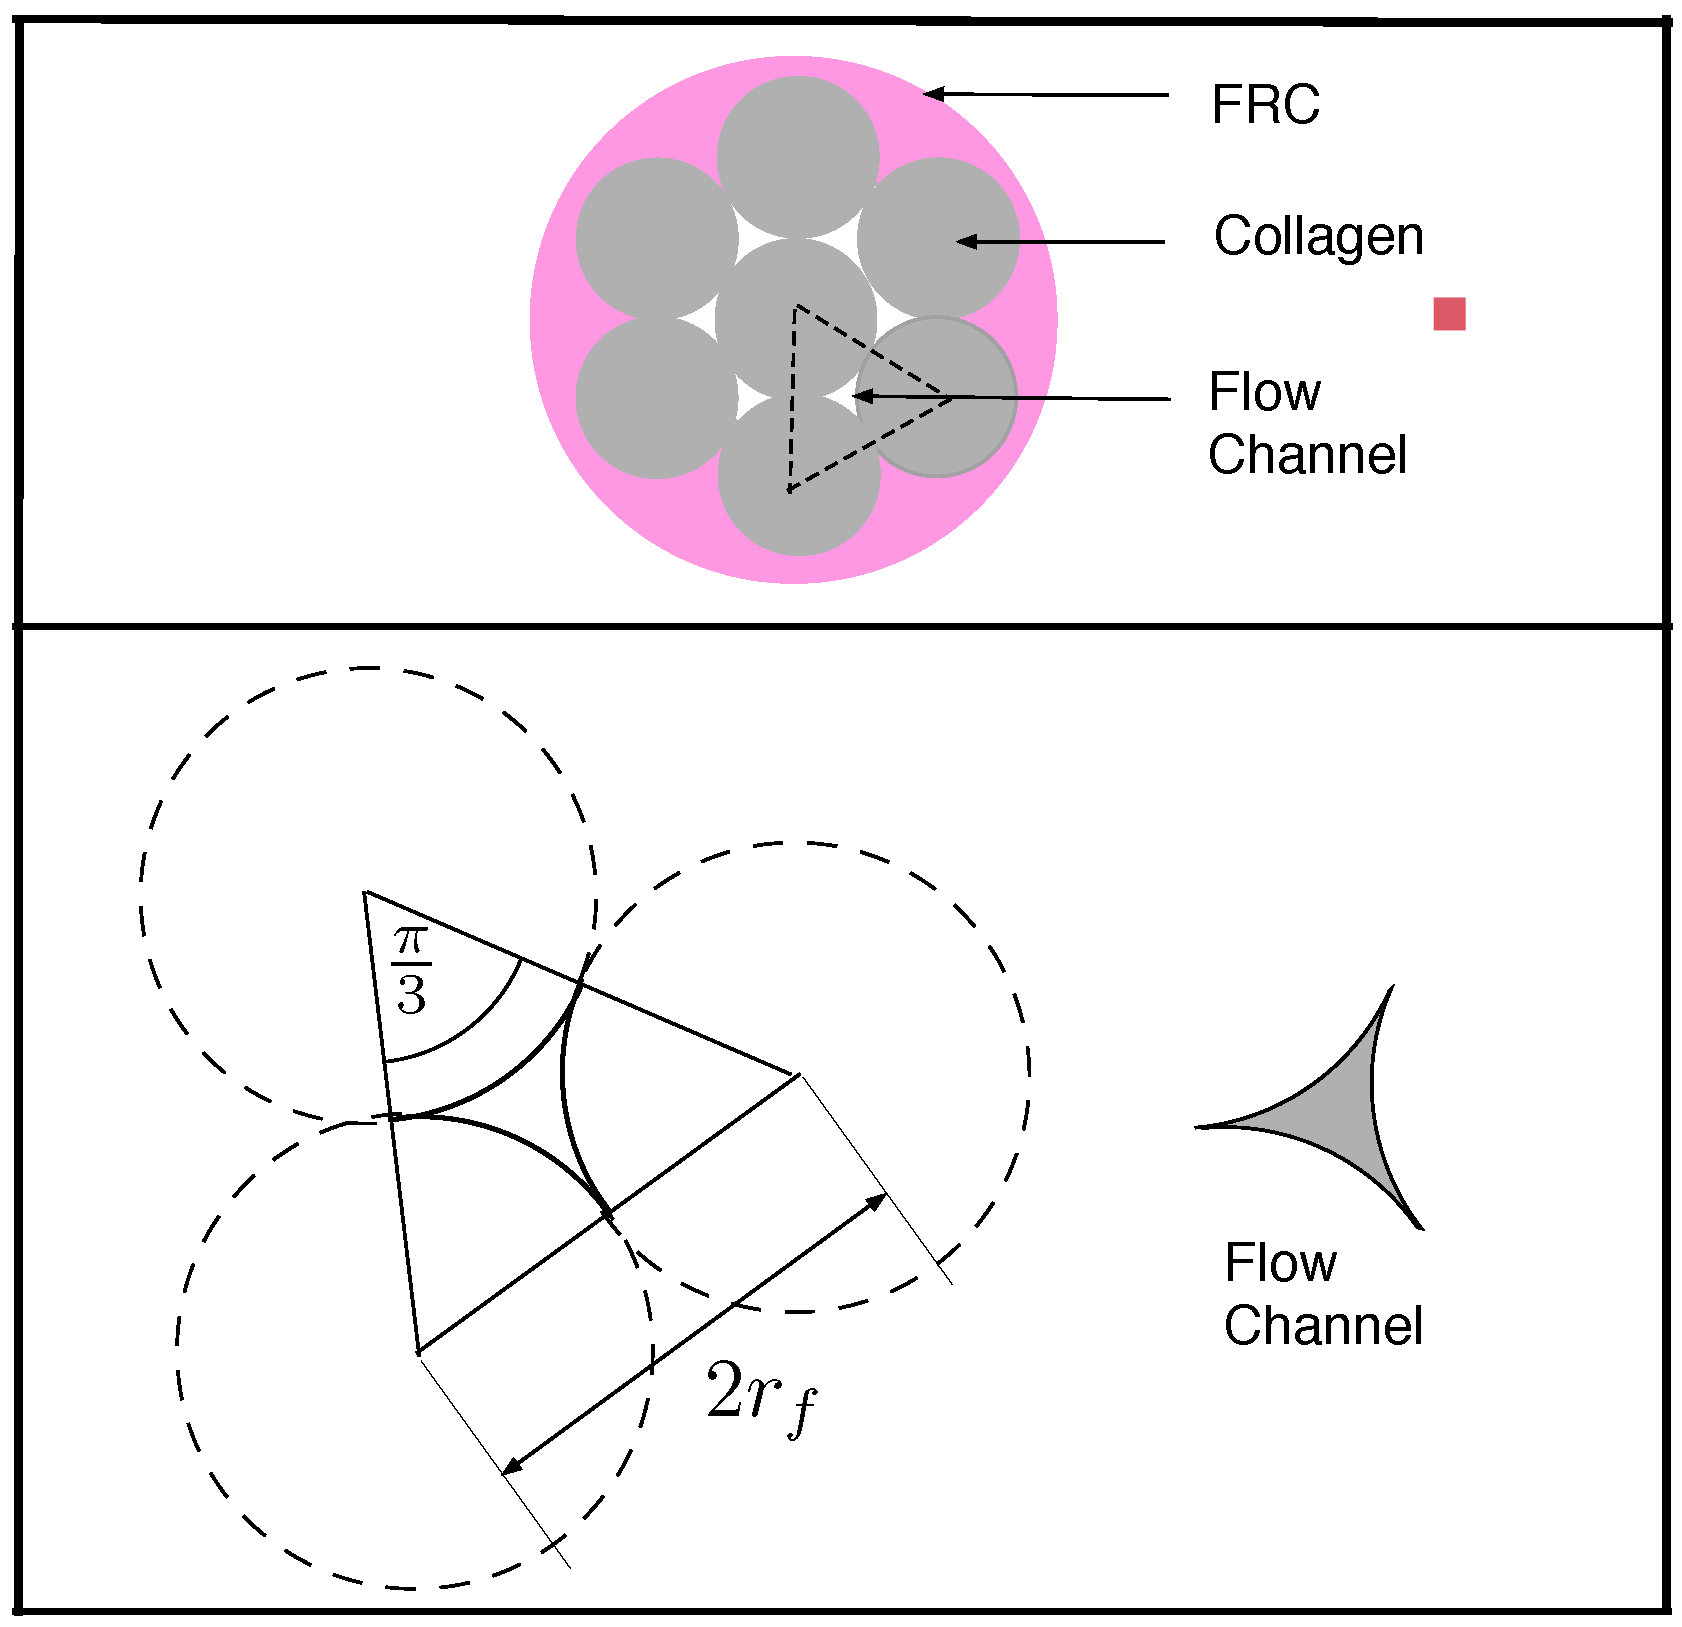
4.2. Diffusive Transport in an FRC Conduit
5. Modelling Lymph Flow in Conduit System of FRC Network in Idealized LN
5.1. Normal FRC Network
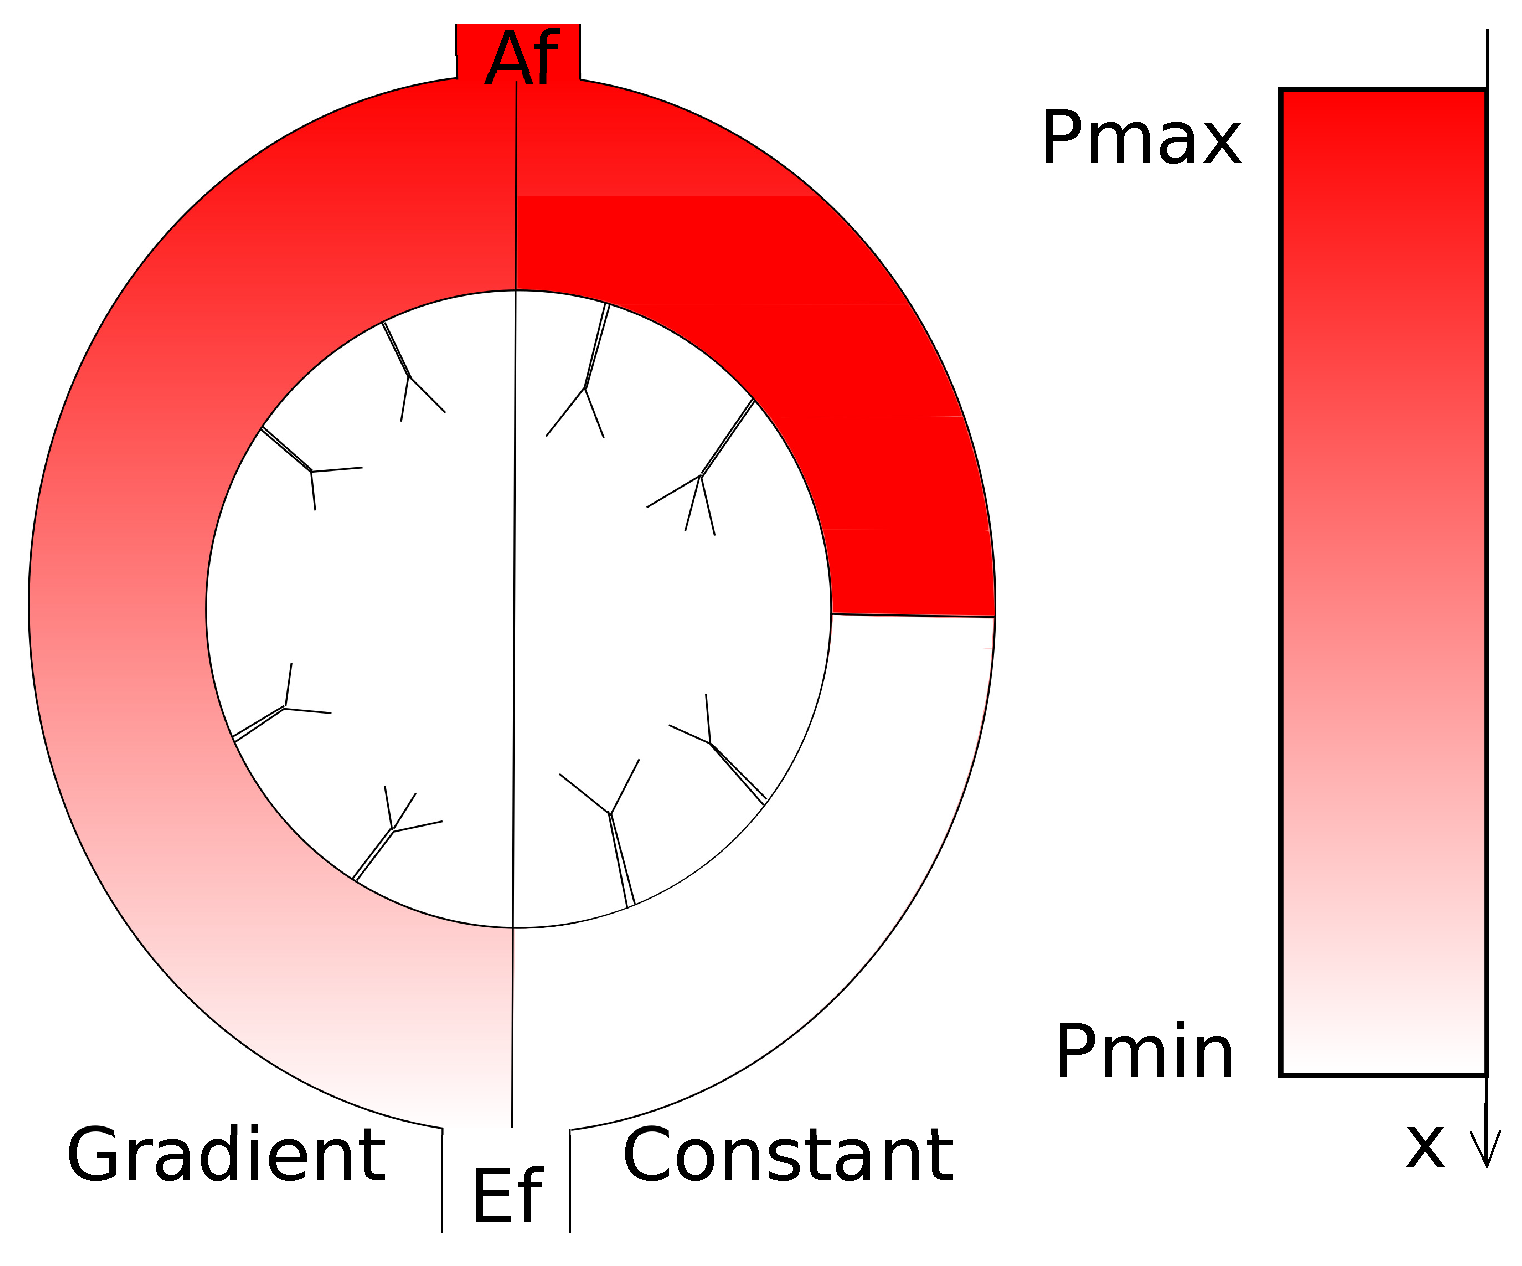
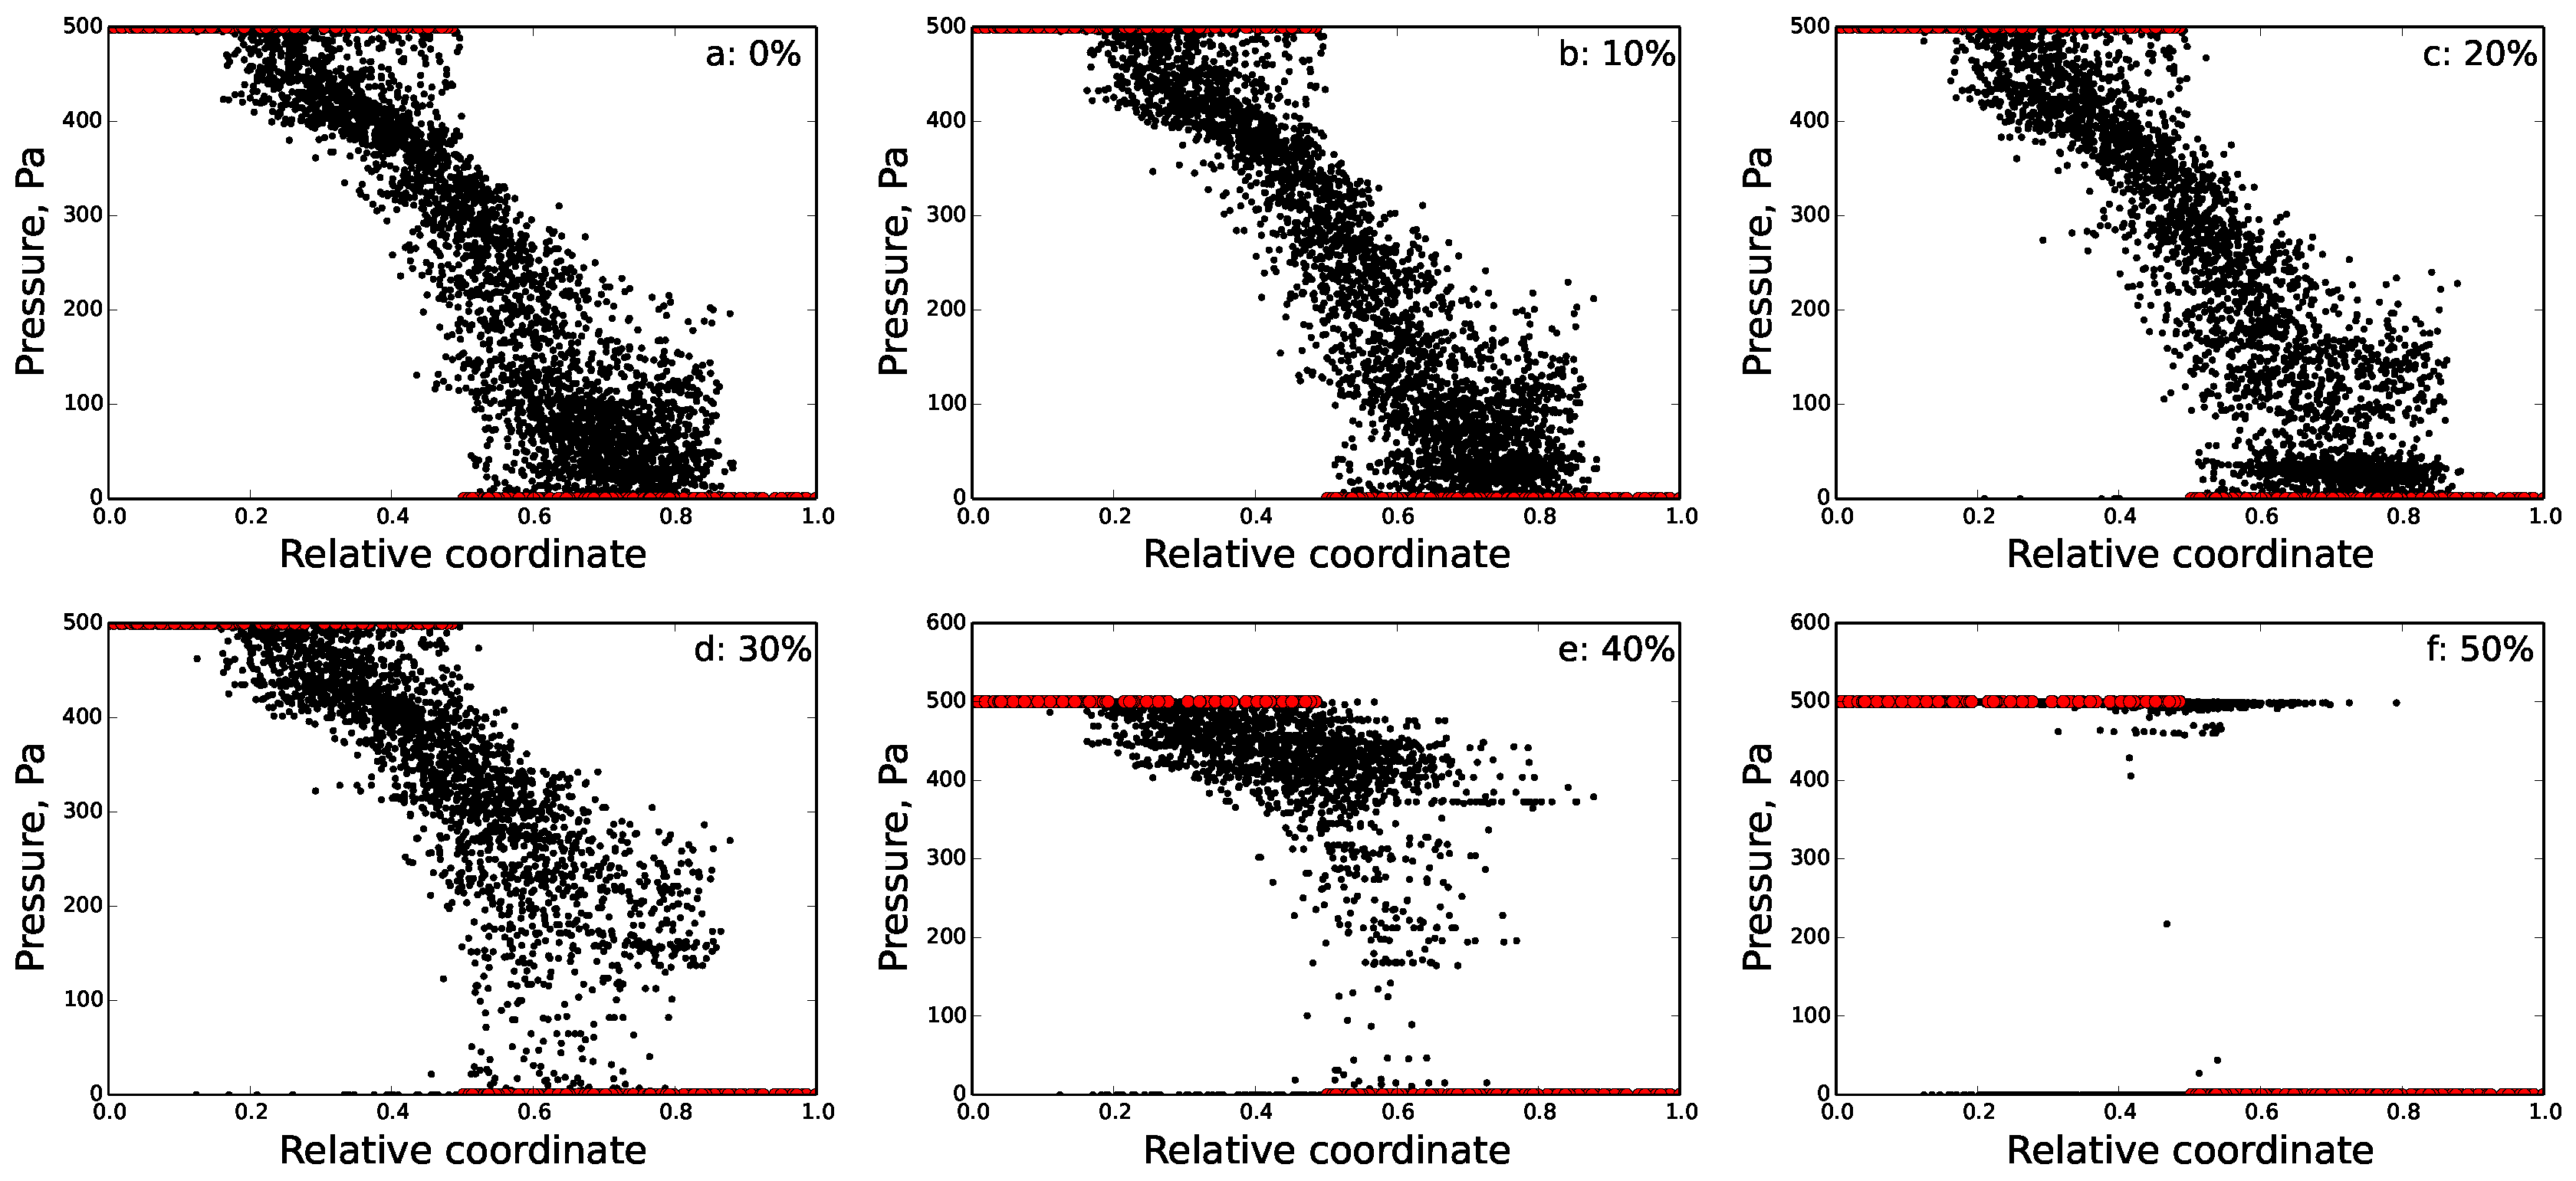
5.2. Disrupted FRC Network
6. Percolation Robustness of the FRC Network
6.1. Graph Measures
6.2. Percolation Threshold
7. Discussion
Acknowledgments
Author Contributions
Conflicts of Interest
Abbreviations
| FRC | Fibroblastic reticular cell |
| SCS | Subcapsular sinus |
| LN | lymph node |
References
- Junt, T.; Scandella, E.; Ludewig, B. Form follows function: Lymphoid tissue microarchitecture in antimicrobial immune defence. Nat. Rev. Immunol. 2008, 8, 764–775. [Google Scholar] [CrossRef] [PubMed]
- Margaris, K.N.; Black, R.A. Modelling the lymphatic system: Challenges and opportunities. J. R. Soc. Interface 2014, 9, 601–612. [Google Scholar] [CrossRef] [PubMed]
- Jafarnejad, M.; Woodruff, M.C.; Zawieja, D.C.; Carroll, M.C.; Moore, J.E., Jr. Modeling lymph flow and fluid exchange with blood vessels in lymph nodes. Lymphat. Res. Biol. 2015, 13, 234–247. [Google Scholar] [CrossRef] [PubMed]
- Cooper, L.J.; Heppell, J.P.; Clough, G.F.; Ganapathisubramani, B.; Roose, T. An Image-Based Model of Fluid Flow Through Lymph Nodes. Bull. Math. Biol. 2016, 78, 52–71. [Google Scholar] [CrossRef] [PubMed]
- Kislitsyn, A.; Savinkov, R.; Novkovic, M.; Onder, L.; Bocharov, G. Computational Approach to 3D Modeling of the Lymph Node Geometry. Computation 2015, 3, 222–234. [Google Scholar] [CrossRef]
- Bocharov, G.; Danilov, A.; Vassilevski, Y.; Marchuk, G.I.; Chereshnev, V.A.; Ludewig, B. Reaction-diffusion modelling of interferon distribution in secondary lymphoid organs. Math. Model. Nat. Phenom. 2011, 6, 13–26. [Google Scholar] [CrossRef]
- Savinkov, R.; Kislitsyn, A.; Watson, D.J.; van Loon, R.; Sazonov, I.; Novkovic, M.; Onder, L.; Bocharov, G. Data-driven modelling of the FRC network for studying the fluid flow in the conduit system. Eng. Appl. Artif. Intell. 2016. [Google Scholar] [CrossRef]
- Kumar, V.; Scandella, E.; Danuser, R.; Onder, L.; Nitschke, M.; Fukui, Y.; Halin, C.; Ludewig, B.; Stein, J.V. Global lymphoid tissue remodelling during a viral infection is orchestrated by a B cell-lymphotoxin-dependent pathway. Blood 2010, 115, 4725–4733. [Google Scholar] [CrossRef] [PubMed]
- Malhotra, D.; Fletcher, A.L.; Turley, S.J. Stromal and hematopoietic cells in secondary lymphoid organs: Partners in immunity. Immunol. Rev. 2013, 251, 160–176. [Google Scholar] [CrossRef] [PubMed]
- Cremasco, V.; Woodruff, M.C.; Onder, L.; Cupovic, J.; Nieves-Bonilla, J.M.; Schildberg, F.A.; Chang, J.; Cremasco, F.; Harvey, C.J.; Wucherpfennig, K.; et al. B cell homeostasis and follicle confines are governed by fibroblastic reticular cells. Nat. Immunol. 2014, 15, 973–981. [Google Scholar] [CrossRef] [PubMed]
- Chang, J.E.; Turley, S.J. Stromal infrastructure of the lymph node and coordination of immunity. Trends Immunol. 2015, 36, 30–39. [Google Scholar] [CrossRef] [PubMed]
- Chai, Q.; Onder, L.; Scandella, E.; Gil-Cruz, C.; Perez-Shibayama, C.; Cupovic, J.; Danuser, R.; Sparwasser, T.; Luther, S.A.; Thiel, V.; et al. Maturation of lymph node fibroblastic reticular cells from myofibroblastic precursors is critical for antiviral immunity. Immunity 2013, 38, 1013–1024. [Google Scholar] [CrossRef] [PubMed]
- Fletcher, A.L.; Acton, S.E.; Knoblich, K. Lymph node fibroblastic reticular cells in health and disease. Nat. Rev. Immunol. 2015, 15, 350–361. [Google Scholar] [CrossRef] [PubMed]
- Novkovic, M.; Onder, L.; Cupovic, J.; Abe, J.; Bomze, D.; Cremasco, V.; Scandella, E.; Stein, J.V.; Bocharov, G.; Turley, S.J.; et al. Topological Small-World Organization of the Fibroblastic Reticular Cell Network Determines Lymph Node Functionality. PLoS Biol. 2016, 14, e1002515. [Google Scholar] [CrossRef] [PubMed]
- Luther, S.A.; Tang, H.L.; Hyman, P.L.; Farr, A.G.; Cyster, J.G. Coexpression of the chemokines ELC and SLC by T zone stromal cells and deletion of the ELC gene in the plt/plt mouse. Proc. Natl. Acad. Sci. USA 2000, 97, 12694–12699. [Google Scholar] [CrossRef] [PubMed]
- Link, A.; Vogt, T.K.; Favre, S.; Britschgi, M.R.; Acha-Orbea, H.; Hinz, B.; Cyster, J.G.; Luther, S.A. Fibroblastic reticular cells in lymph nodes regulate the homeostasis of naive T cells. Nat. Immunol. 2007, 8, 1255–1265. [Google Scholar] [CrossRef] [PubMed]
- Mueller, S.N.; Germain, R.N. Stromal cell contributions to the homeostasis and functionality of the immune system. Nat. Rev. Immunol. 2009, 9, 618–629. [Google Scholar] [CrossRef] [PubMed]
- Sixt, M.; Kanazawa, N.; Selg, M.; Samson, T.; Roos, G.; Reinhardt, D.P.; Pabst, R.; Lutz, M.B.; Sorokin, L. The conduit system transports soluble antigens from the afferent lymph to resident dendritic cells in the T cell area of the lymph node. Immunity 2005, 22, 19–29. [Google Scholar] [CrossRef] [PubMed]
- Onder, L.; Danuser, R.; Scandella, E.; Firner, S.; Chai, Q.; Hehlgans, T.; Stein, J.V.; Ludewig, B. Endothelial cell-specific lymphotoxin-β receptor signaling is critical for lymph node and high endothelial venule formation. J. Exp. Med. 2013, 210, 465–473. [Google Scholar] [CrossRef] [PubMed]
- Girard, J.P.; Moussion, C.; Förster, R. HEVs, lymphatics and homeostatic immune cell trafficking in lymph nodes. Nat. Rev. Immunol. 2012, 12, 762–773. [Google Scholar] [CrossRef] [PubMed]
- Kelch, I.D.; Bogle, G.; Sands, G.B.; Phillips, A.R.; LeGrice, I.J.; Dunbar, P.R. Organ-wide 3D-imaging and topological analysis of the continuous microvascular network in a murine lymph node. Sci. Rep. 2015, 5, 16534. [Google Scholar] [CrossRef] [PubMed]
- Subramanian, N.; Torabi-Parizi, P.; Gottschalk, R.A.; Germain, R.N.; Dutta, B. Network representations of immune system complexity. Wiley Interdiscip. Rev. Syst. Biol. Med. 2015, 7, 13–38. [Google Scholar] [CrossRef] [PubMed]
- Heng, T.S.; Painter, M.W. Immunological Genome Project Consortium. The Immunological Genome Project: Networks of gene expression in immune cells. Nat. Immunol. 2008, 9, 1091–1094. [Google Scholar] [CrossRef] [PubMed]
- Kitano, H. Systems Biology: A brief overview. Science 2002, 295, 1662–1664. [Google Scholar] [CrossRef] [PubMed]
- Ludewig, B.; Stein, J.V.; Sharpe, J.; Cervantes-Barragan, L.; Thiel, V.; Bocharov, G. A global “imaging” view on systems approaches in immunology. Eur. J. Immunol. 2012, 42, 3116–3125. [Google Scholar] [CrossRef] [PubMed]
- Glazier, J.A.; Balter, A.; Poplawski, N.J. Magnetization to morphogenesis: A brief history of the Glazier-Graner-Hogeweg model. In Single-Cell-Based Models in Biology and Medicine; Anderson, A.R.A., Chaplain, M.A.J., Rejniak, K.A., Eds.; Mathematics and Biosciences in Interactions, Birkaüser: Basel, Switzerland, 2007; pp. 79–106. [Google Scholar]
- Balter, A.; Merks, R.M.H.; Poplawski, N.J.; Swat, M.; Glazier, J.A. The Glazier-Graner-Hogeweg model: Extensions, future directions, and opportunities for further study. In Single-Cell-Based Models in Biology and Medicine; Anderson, A.R.A., Chaplain, M.A.J., Rejniak, K.A., Eds.; Mathematics and Biosciences in Interactions, Birkaüser: Basel, Switzerland, 2007; pp. 151–167. [Google Scholar]
- Marée, A.F.M.; Grieneisen, V.A.; Hogeweg, P. The Cellular Potts Model and biophysical properties of cells, tissues and morphogenesis. In Single-Cell-Based Models in Biology and Medicine; Anderson, A.R.A., Chaplain, M.A.J., Rejniak, K.A., Eds.; Mathematics and Biosciences in Interactions, Birkaüser: Basel, Switzerland, 2007; pp. 107–136. [Google Scholar]
- Scianna, M.S.; Preziosi, L.P. Multiscale Developments of the Cellular Potts Model. SIAM J. Multiscale Model. Simul. 2012, 10, 1–43. [Google Scholar] [CrossRef]
- Merks, R.M.; Brodsky, S.V.; Goligorksy, M.S.; Newman, S.A.; Glazier, J.A. Cell elongation is key to in silico replication of in vitro vasculogenesis and subsequent remodeling. Dev. Biol. 2006, 289, 44–54. [Google Scholar] [CrossRef] [PubMed]
- Roozendaal, R.; Mebius, R.E.; Kraal, G. The conduit system of the lymph node. Int. Immunol. 2008, 20, 1483–1487. [Google Scholar] [CrossRef] [PubMed]
- Delves, P.; Martin, S.; Burton, D.; Roitt, I. Roitt’s Essential Immunology; Wiley: Somerset, UK, 2011; p. 239. [Google Scholar]
- Gertz, J.E.; Anderson, A.O.; Shaw, S. Cords, channels, corridors, conduits: Critical architectural elements facilitating cell interaction in the lymph node cortex. Immunol. Rev. 1997, 156, 11–24. [Google Scholar] [CrossRef]
- Ushiki, T. Collagen Fibers, Reticular Fibers and Elastic Fibers. A Comprehensive Understanding from a Morphological Viewpoint. Arch. Histol .Cytol. 2002, 65, 109–206. [Google Scholar] [CrossRef] [PubMed]
- Swartz, M.A.; Fleury, M.E. Interstitial flow and its effects in soft tissues. Annu. Rev. Biomed. Eng. 2007, 9, 229–256. [Google Scholar] [CrossRef] [PubMed]
- Pappenheimer, A.M., Jr.; Lundgren, H.P.; Williams, J.W. Studies on the Molecular Weight of Diphtheria Toxin, Antitoxin and their Reaction Products. J. Exp. Med. 1939, 71, 247–262. [Google Scholar] [CrossRef]
- Wolffa, C.; Wattiezb, R.; Jean-Marie Ruysschaerta, J.; Cabiauxa, V. Characterization of diphtheria toxins catalytic domain interaction with lipid membranes. Biochim. Biophys. Acta 2004, 1611, 166–177. [Google Scholar] [CrossRef] [PubMed]
- Bouta, E.M.; Wood, R.W.; Brown, E.B.; Rahimi, H.; Ritchlin, C.T.; Schwarz, E.M. In vivo quantification of lymph viscosity and pressure in lymphatic vessels and draining lymph nodes of arthritic joints in mice. J. Physiol. 2014, 92, 1213–1223. [Google Scholar] [CrossRef] [PubMed]
- UMFPACK. Available online: http://faculty.cse.tamu.edu/davis/suitesparse.html (accessed on 20 August 2016).
- Rodrigue, J.P.; Comtis, C.; Slack, B. The Geography of Transport Systems; Hofstra University Press: Hempstead, NY, USA, 2013; pp. 60–70. [Google Scholar]
- Humphries, M.D.; Gurney, K. Network ’Small-World-Ness’: A Quantitative Method for Determining Canonical Network Equivalence. PLoS ONE 2008, 3, e0002051. [Google Scholar] [CrossRef] [PubMed]
- Stauffer, D.; Aharony, A. Introduction to Percolation Theory; CRC Press: Boca Raton, FL, USA, 1994. [Google Scholar]
- Tomei, A.A.; Siegert, S.; Britschgi, M.R.; Luther, S.A.; Swartz, M.A. Fluid flow regulates stromal cell organization and CCL21 expression in a tissue-engineered lymph node microenvironment. J. Immunol. 2009, 183, 4273–4283. [Google Scholar] [CrossRef] [PubMed]
- Paul, W.E. The immune system—Complexity exemplified. Math. Model. Nat. Phenom. 2012, 7, 4–6. [Google Scholar] [CrossRef]
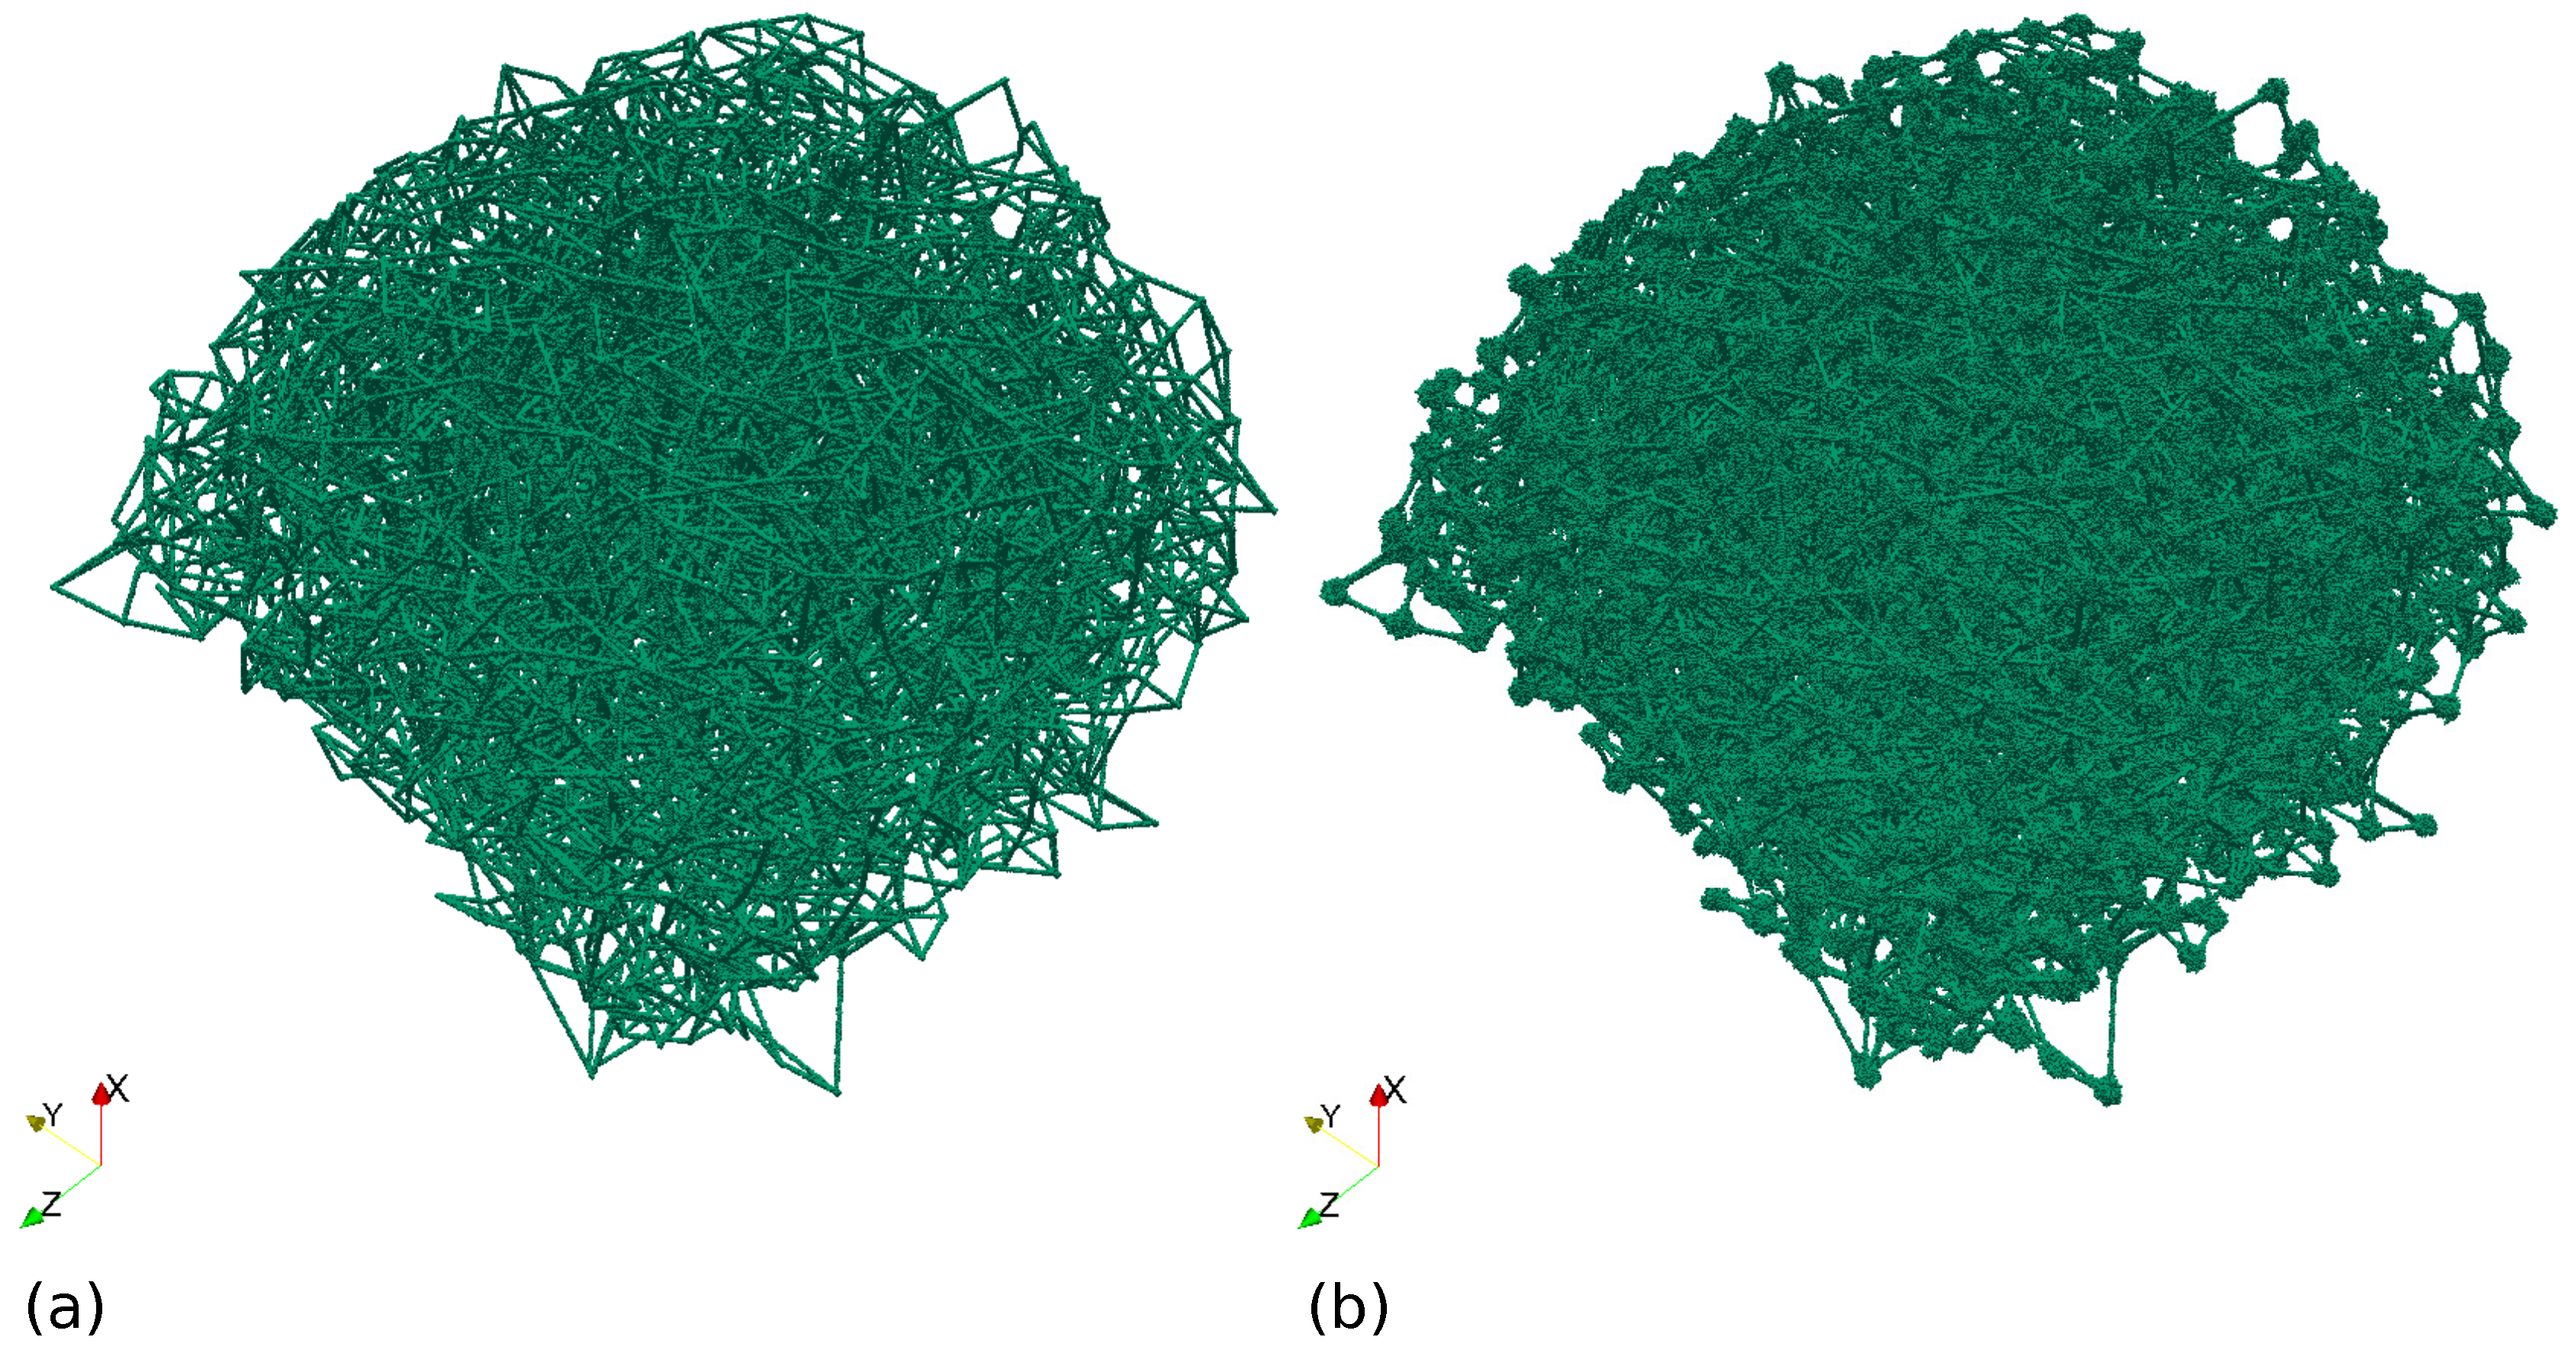

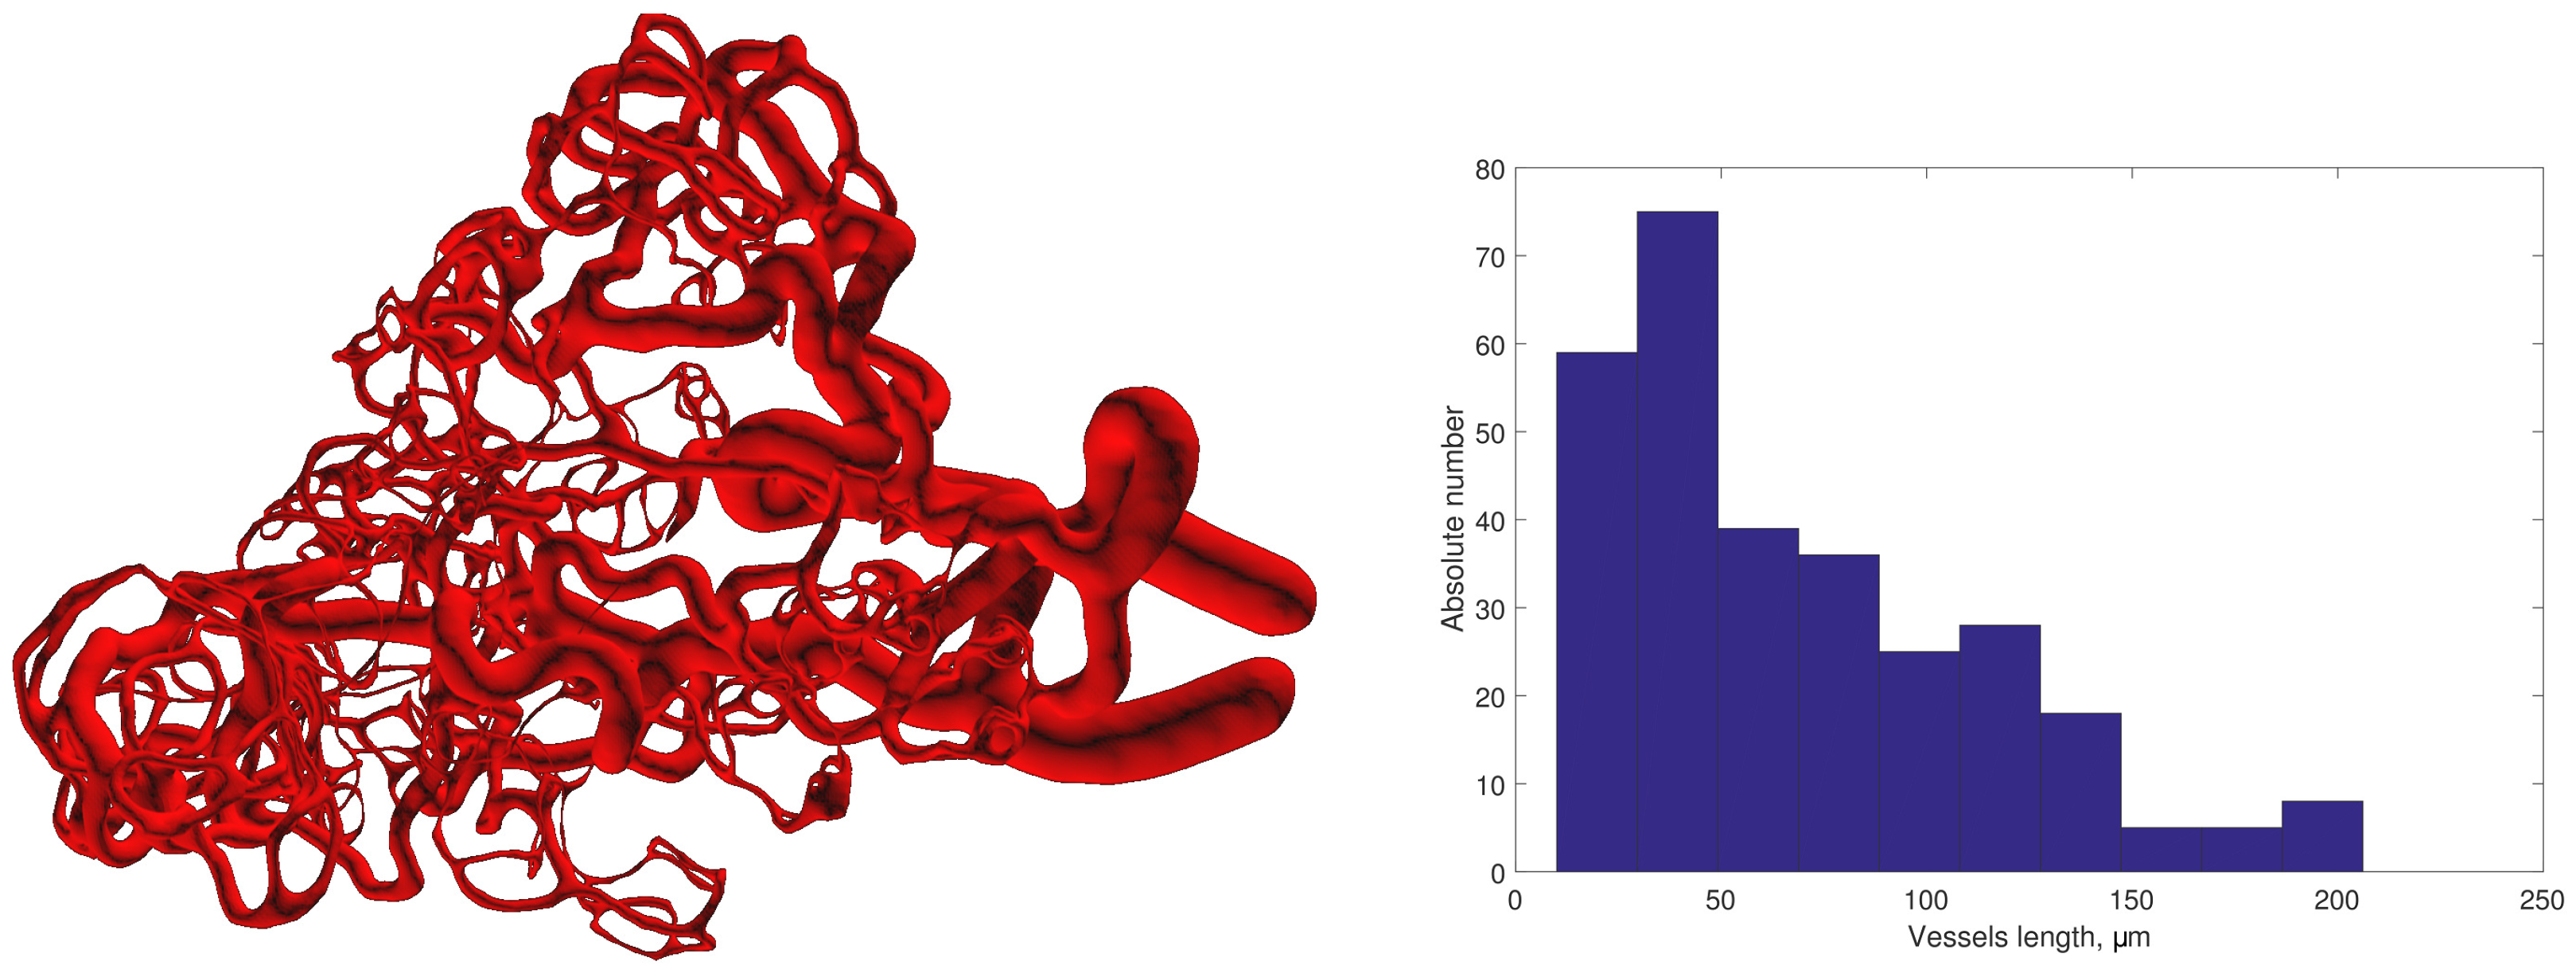
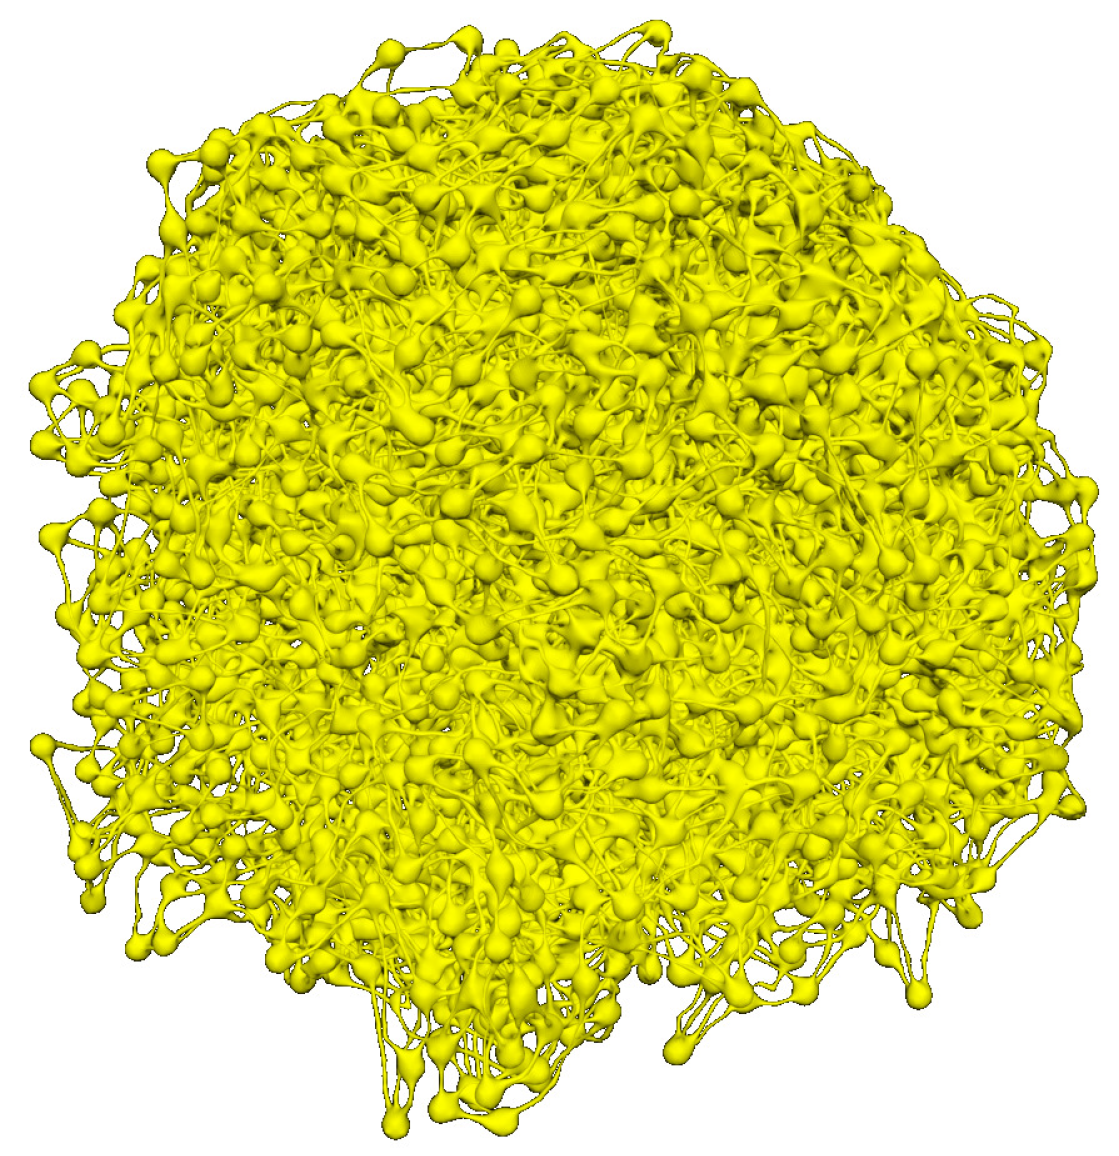

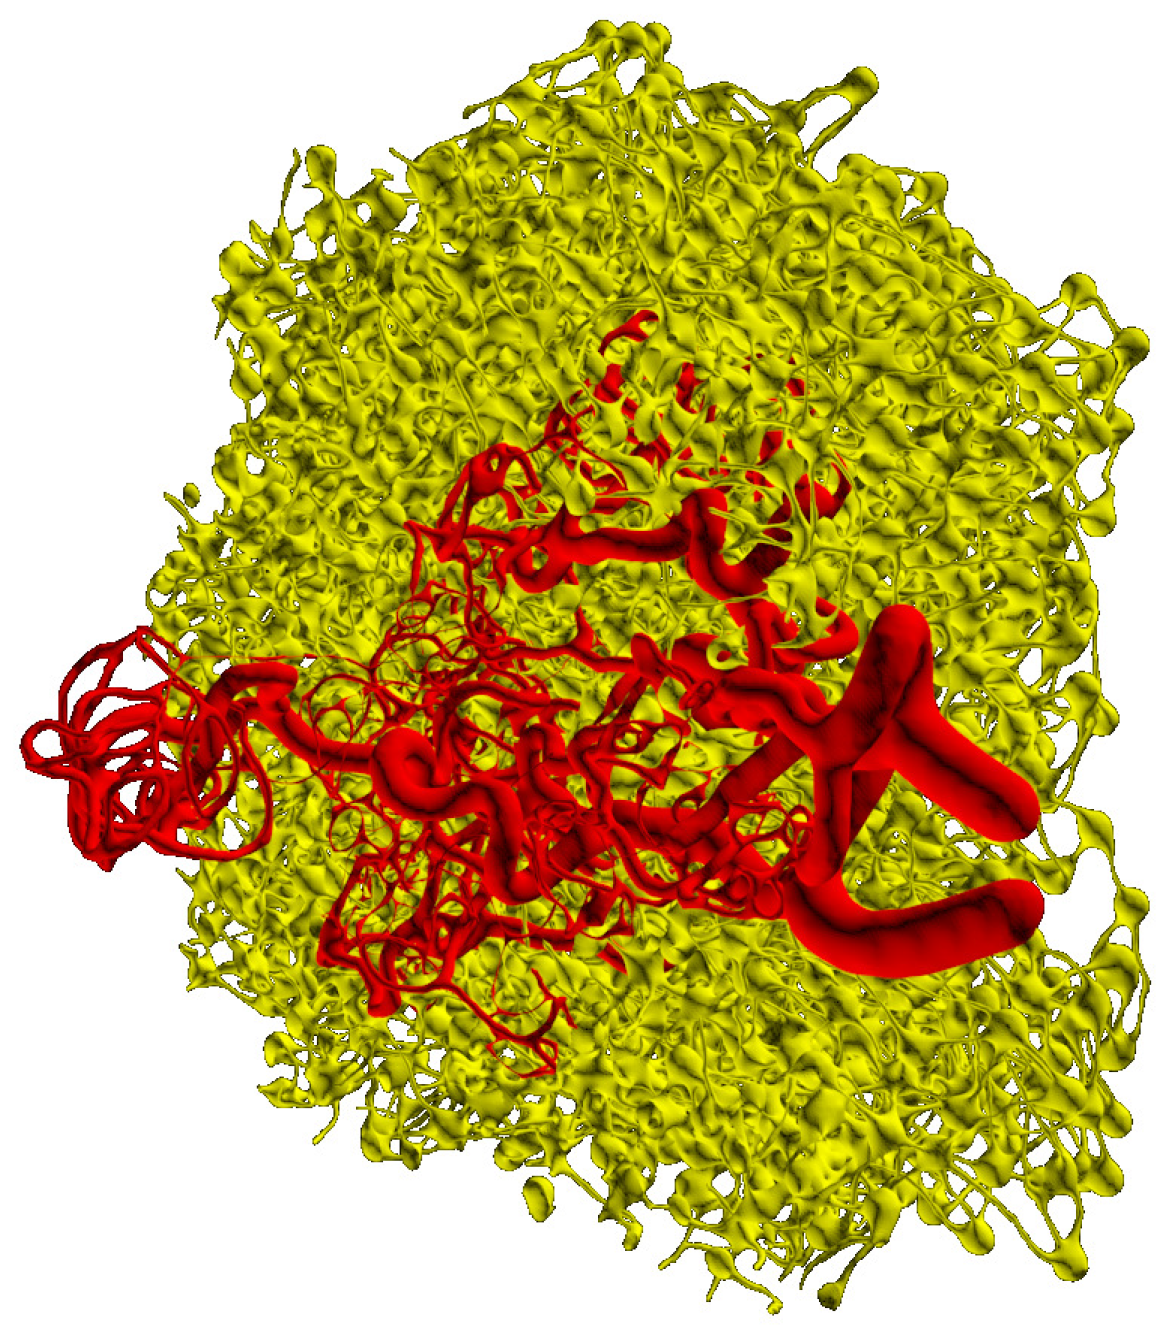




| Parameter | Description | Value |
|---|---|---|
| length of the voxel | 0.3 m | |
| sizes of computational domain | ||
| diameter of the conduits | 1.0 m | |
| number of FRCs in domain | 3374 | |
| volume fraction of reticular network | 4% | |
| adhesion energies | 0 a.u.e. | |
| spring modulus of FRCs | 10 a.u.e./px | |
| amplitude of intrinsic motility | 2 a.u.e. | |
| characteristic diameter of FRC body | 12 px |
| FRCn | Vascular Network | |
|---|---|---|
| Surface area | 1,131,209 m | 61,264 m |
| Relative volume | 7.98% | 1.71% |
| Damage (%) | Nodes | Edges | n-f Edges | Inputs | Outputs | Relative Outflow | Relative Sum. Flow |
|---|---|---|---|---|---|---|---|
| 0 | 3694 | 7253 | 0 | 164 | 156 | 1.0 | 1.0 |
| 10 | 3671 | 6528 | 29 | 156 | 147 | 0.82 | 0.84 |
| 20 | 3608 | 5802 | 108 | 143 | 132 | 0.615 | 0.653 |
| 30 | 3454 | 5077 | 1792 | 117 | 105 | 0.414 | 0.386 |
| 40 | 3135 | 4352 | 2138 | 94 | 78 | 0.16 | 0.149 |
| 50 | 2713 | 3626 | 2365 | 55 | 89 | 0.044 | 0.019 |
| 60 | 2202 | 2901 | 2443 | 16 | 85 | 0.0 | 0.0 |
| Damage (%) | Nodes | Edges | n-f Edges | Inputs | Outputs | Relative Outflow | Relative Sum. Flow |
|---|---|---|---|---|---|---|---|
| 0 | 3694 | 7253 | 0 | 169 | 151 | 1.0 | 1.0 |
| 10 | 3671 | 6528 | 27 | 157 | 146 | 0.854 | 0.845 |
| 20 | 3608 | 5802 | 110 | 140 | 135 | 0.678 | 0.66 |
| 30 | 3454 | 5077 | 226 | 109 | 113 | 0.49 | 0.398 |
| 40 | 3135 | 4352 | 346 | 85 | 87 | 0.33 | 0.23 |
| 50 | 2713 | 3626 | 454 | 68 | 76 | 0.26 | 0.149 |
| 60 | 2202 | 2901 | 599 | 46 | 55 | 0.185 | 0.095 |
| 70 | 1623 | 2176 | 512 | 34 | 41 | 0.135 | 0.074 |
| 80 | 1062 | 1451 | 254 | 13 | 25 | 0.072 | 0.039 |
| 90 | 513 | 725 | 76 | 5 | 13 | 0.028 | 0.013 |
© 2016 by the authors. Licensee MDPI, Basel, Switzerland. This article is an open access article distributed under the terms and conditions of the Creative Commons Attribution (CC BY) license ( http://creativecommons.org/licenses/by/4.0/).
Share and Cite
Grebennikov, D.; Van Loon, R.; Novkovic, M.; Onder, L.; Savinkov, R.; Sazonov, I.; Tretyakova, R.; Watson, D.J.; Bocharov, G. Critical Issues in Modelling Lymph Node Physiology. Computation 2017, 5, 3. https://doi.org/10.3390/computation5010003
Grebennikov D, Van Loon R, Novkovic M, Onder L, Savinkov R, Sazonov I, Tretyakova R, Watson DJ, Bocharov G. Critical Issues in Modelling Lymph Node Physiology. Computation. 2017; 5(1):3. https://doi.org/10.3390/computation5010003
Chicago/Turabian StyleGrebennikov, Dmitry, Raoul Van Loon, Mario Novkovic, Lucas Onder, Rostislav Savinkov, Igor Sazonov, Rufina Tretyakova, Daniel J. Watson, and Gennady Bocharov. 2017. "Critical Issues in Modelling Lymph Node Physiology" Computation 5, no. 1: 3. https://doi.org/10.3390/computation5010003
APA StyleGrebennikov, D., Van Loon, R., Novkovic, M., Onder, L., Savinkov, R., Sazonov, I., Tretyakova, R., Watson, D. J., & Bocharov, G. (2017). Critical Issues in Modelling Lymph Node Physiology. Computation, 5(1), 3. https://doi.org/10.3390/computation5010003


