Article

Evolution by Pervasive Gene Fusion in Antibiotic Resistance and Antibiotic Synthesizing Genes

Department of Biology, National University of Ireland Maynooth, Co. Kildare, Ireland
*
Author to whom correspondence should be addressed.
These authors contributed equally to this work.
Computation 2015, 3(2), 114-127; https://doi.org/10.3390/computation3020114
Submission received: 8 September 2014 / Revised: 10 March 2015 / Accepted: 11 March 2015 / Published: 26 March 2015
(This article belongs to the Special Issue Genomes and Evolution: Computational Approaches)

Abstract

:
Phylogenetic (tree-based) approaches to understanding evolutionary history are unable to incorporate convergent evolutionary events where two genes merge into one. In this study, as exemplars of what can be achieved when a tree is not assumed a priori, we have analysed the evolutionary histories of polyketide synthase genes and antibiotic resistance genes and have shown that their history is replete with convergent events as well as divergent events. We demonstrate that the overall histories of these genes more closely resembles the remodelling that might be seen with the children’s toy Lego, than the standard model of the phylogenetic tree. This work demonstrates further that genes can act as public goods, available for re-use and incorporation into other genetic goods.

1. Introduction

Phylogenetic analysis is the study of nested sets of evolutionary relationships among different species, genes or genomes, in a bid to understand the evolution of life on earth [1]. Evolution has long been described using bifurcating phylogenetic trees, consisting of nodes and branches and these trees, in a variety of forms have been the mainstay of phylogenetic studies ever since the publication of the Origin of Species [2]. Although this visualisation and analysis tool has been used for many years to represent vertical inheritance, several other evolutionary processes cannot be represented in this way [3]. Phylogenetic trees do not depict events such as horizontal gene transfer (HGT), recombination, hybridization or other reticulate events [4]. This has led to considerable interest in devising new ways to represent evolutionary data. In this manuscript, we present preliminary analyses of non-treelike evolutionary processes among sets of genes.
Sequence similarity networks (SSNs) are graphs or models used to visualise evolutionary relationships between nucleotide sequences, genes, chromosomes, genomes, or species [4]. SSNs provide both a visual and an analytical framework for representing these biological relationships [5,6]. Networks were traditionally used in non-scientific fields, for example, in the mapping of railroads [7] and more recently in friendship relationships on social network sites such as Facebook [8]. Recently, this approach has been adapted to better understand evolution [1,9,10,11,12]. Through the use of SSNs, Halary et al. [13] investigated a molecular dataset of 571,044 protein sequences from the three domains of life. Among other things, this study showed that, in the lyme-disease spirochete, Borrelia, plasmids play a different role than in most other eubacteria. Larremore et al. [6] used an SSN approach to analyze the var genes of the human malaria parasite Plasmodium falciparum. These genes are characterised by high rates of recombination and are not amenable to study using phylogenetic approaches. Larremore et al. [6] developed a rigorous network-based method for analyzing evolutionary constraints in var genes and this method is flexible enough to be applied more generally to any highly recombinant sequences. Fondi and Fani [14] constructed a network that illustrated horizontal flow of antibiotic resistance determinants at the bacterial community level, also underlining the power of HGT among bacteria and how this ‘horizontal flow’ is only weakly curtailed by both taxonomy and physical distance. These studies show the utility of SSNs as a means of seeing evolutionary events that are masked on phylogenetic trees.
Within SSNs, nodes represent species or genes, and their evolutionary relationships are represented by edges [9], which may be, for example, statements of homology, identified by BLAST [15]. SSNs are generally composed of one or more connected components (CCs). A CC consists of directly or indirectly related sequences, without the need for all sequences to display detectable homology to one another [12]. Genes identified as part of a clique, are usually, though not necessarily, functionally similar [16].
The structure and nature of SSNs are explicitly different to that of phylogenetic trees due to the inclusion of hybrid nodes [11]. Thus, SSNs can show extended relationships that would be impossible to see using phylogenetic trees. The addition of hybrid nodes means that SSNs can display composite genes, which is the focus of the current manuscript. A composite gene may arise as a consequence of recombination events such as horizontal gene transfer, gene fusion or fission, hybridisation or domain shuffling, whereby two previously separate genes recombine to create a new single gene [11,17]. For the purpose of this article, the focus lies on composite genes that have evolved by gene remodelling. Specifically, we look at events such as the fusion of two genes that have no detectable homology, or the fission of a single gene into more than one separate part [18,19]. The effect of gene fusion and fission are seen in the domain architecture of proteins when they occur in coding sequences [18]. Gene fusion in a coding region can result in the construction of a new protein, thus permitting the appearance of a new function via the amalgamation of peptide units into multi-domain proteins [20]. Gene fusion can occur by the simple deletion of the terminal region of one gene and the initial regulatory region of a neighboring gene [19]. Gene fission in a coding sequence can result in less complex proteins due to the loss or deletion of domains [19]. For gene fission to result in two functioning proteins, there must be a precise insertion of a regulatory sequence by double crossover. Gene fusion is a simpler genetic process; therefore fusion events are more prevalent than fission [21,22].
In this manuscript, SSNs are used to efficiently depict reticulate events that enabled the evolution of genes involved in infectious disease. Two cases will be discussed where SSNs, gene alignments and N-rooted graphs were employed in an attempt to unravel the evolution of the genes being investigated.
Case 1 uses the SSN approach followed by gene alignments to understand the evolution of polyketide biosynthetic genes. Polyketides are a family of secondary metabolites that confer a broad range of biological and pharmacological properties both harmful and beneficial [23]. Polyketide synthases (PKSs) are the enzymes that catalyze the process of polyketide biosynthesis. They facilitate the decarboxylative condensation of acyl-thioester units such as malonyl-CoA to yield polyketide metabolites [24]. Polyketide diversity is usually accomplished by the combinatorial activity of PKS domains. Insights into their evolutionary processes can provide us with an understanding of their diverse function.
Case 2 focuses on antibiotic resistance genes. Antibiotics remain our most important pharmacological tool in the management of infectious diseases [25]. Since the introduction of antibiotics 60 years ago, millions of metric tonnes have been produced for the treatment of people, animals and agriculture [26]. However, the use of antibiotics is associated with the rapid emergence of resistant strains [27]. Antibiotics kill off susceptible strains therefore providing a selective advantage to resistant organisms, ultimately reducing the clinical utility of the antibiotic [28]. As this resistance is usually genetically encoded, it is of interest to understand the role of gene remodelling in the emergence of these resistance genes.

2. Materials and Methods

2.1. Case 1

Protein sequences used for this case are derived from Kim and Yi [29] and the Streptomyces coelicolor genome. Kim and Yi [29] analysed 319 Actinobacterial genomes to predict 280 known type II PKS proteins. The full list of all Actinobacterial genomes and the 280 predicted type II PKSs is available in supplementary file S1.xlsx. A BLAST search was carried out on the 280 type II PKS proteins against the S. coelicolor (A3)2 genome (EMBL/GenBank databases accession number AL 645882) resulting in 143 significant hits from this genome (listed in S2.txt). The S. coelicolor genome was used, as it is an important species of Actinobacterium, which are soil dwelling organisms that are prolific producers of polyketides.

2.2. Case 2

A total of 1642 known antibiotic resistant genes were obtained from 110 genomes from the Comprehensive Antibiotic Resistance Database (CARD; http://arpcard.mcmaster.ca) [30], as of October 2013.

2.3. BLAST Analysis and Network Construction

An all-against-all BLAST search was carried out using the BLASTP program [15], setting an E-value stringency cut off at 1e−8. The BLAST output file (in -m8 format) was used as the input file for Cytoscape [31]. Cytoscape is an open source software project for integrating biomolecular interaction networks. The output from BLAST can be used as an “edge list” for network construction.

2.4. Identification of Composite Genes

The sequence similarity network (SSN) was searched for composite genes using the Python script FusedTriplets.py [32], set at an E-value threshold of 1e−20. FusedTriplets identifies the full set of non-transitive triplets. This involves three genes “A-B-C” that exist in a connected component where the composite gene “B” is identified if there exists two component genes A and C that meet the following criteria. Firstly, A and B are similar, with an E-value less than 1e−20 and B and C are similar with an E-value of less than 1e−20. Secondly, A and C BLAST matches on B do not overlap. Finally A and C do not match, with an E-value greater than 1e−8.

2.5. Investigation of Domain Architecture

The conserved domains and the function of each composite gene identified by FusedTriplets.py and their related component genes were investigated using NCBI Batch CD search tool [33]. Batch CD produced an output file of conserved domain hits along each sequence. The function of each domain was then obtained by searching the accession number listed within this output file.

2.6. BLAST Analysis and Sequence Alignments

Because we are dealing with partial homologs, the exact positions of sequence similarities were determined via the BLAST output file. Alignments of each composite gene with its related component gene(s) were constructed using MUSCLE [34]. False positives arise if the two component families align on the same region of the composite gene(s). Hence alignments were used to ensure no undetected distant homology was present between the regions where the two component genes align to the composite gene(s). The MUSCLE alignments were imported into the manual sequence alignment editor, Seaview [35] and merged into a single alignment.

2.7. N-Rooted Fusion Graph Construction

Fusion genes are properly represented on an evolutionary network by a node with an in-degree of two and an out-degree of one, phylogenetic trees cannot represent such nodes. Haggerty et al. [11] described the method of using an N-rooted fusion graph to depict a more accurate representation of the evolutionary history of these non-transitive sequences. Following this method proposed by Haggerty et al. [11], Seaview was used to construct two maximum likelihood trees. Using the alignment data, these trees were midpoint rooted and merged manually onto an N-rooted fusion graph using the Adobe Illustrator software (Adobe Systems, San Jose, CA, USA). The resulting graph provides a more complete picture of the evolutionary history of the fused genes. This graph contains two roots and the approximate location of the fusion event.

3. Results and Discussion

3.1. Case 1: Polyketide Biosynthetic Genes
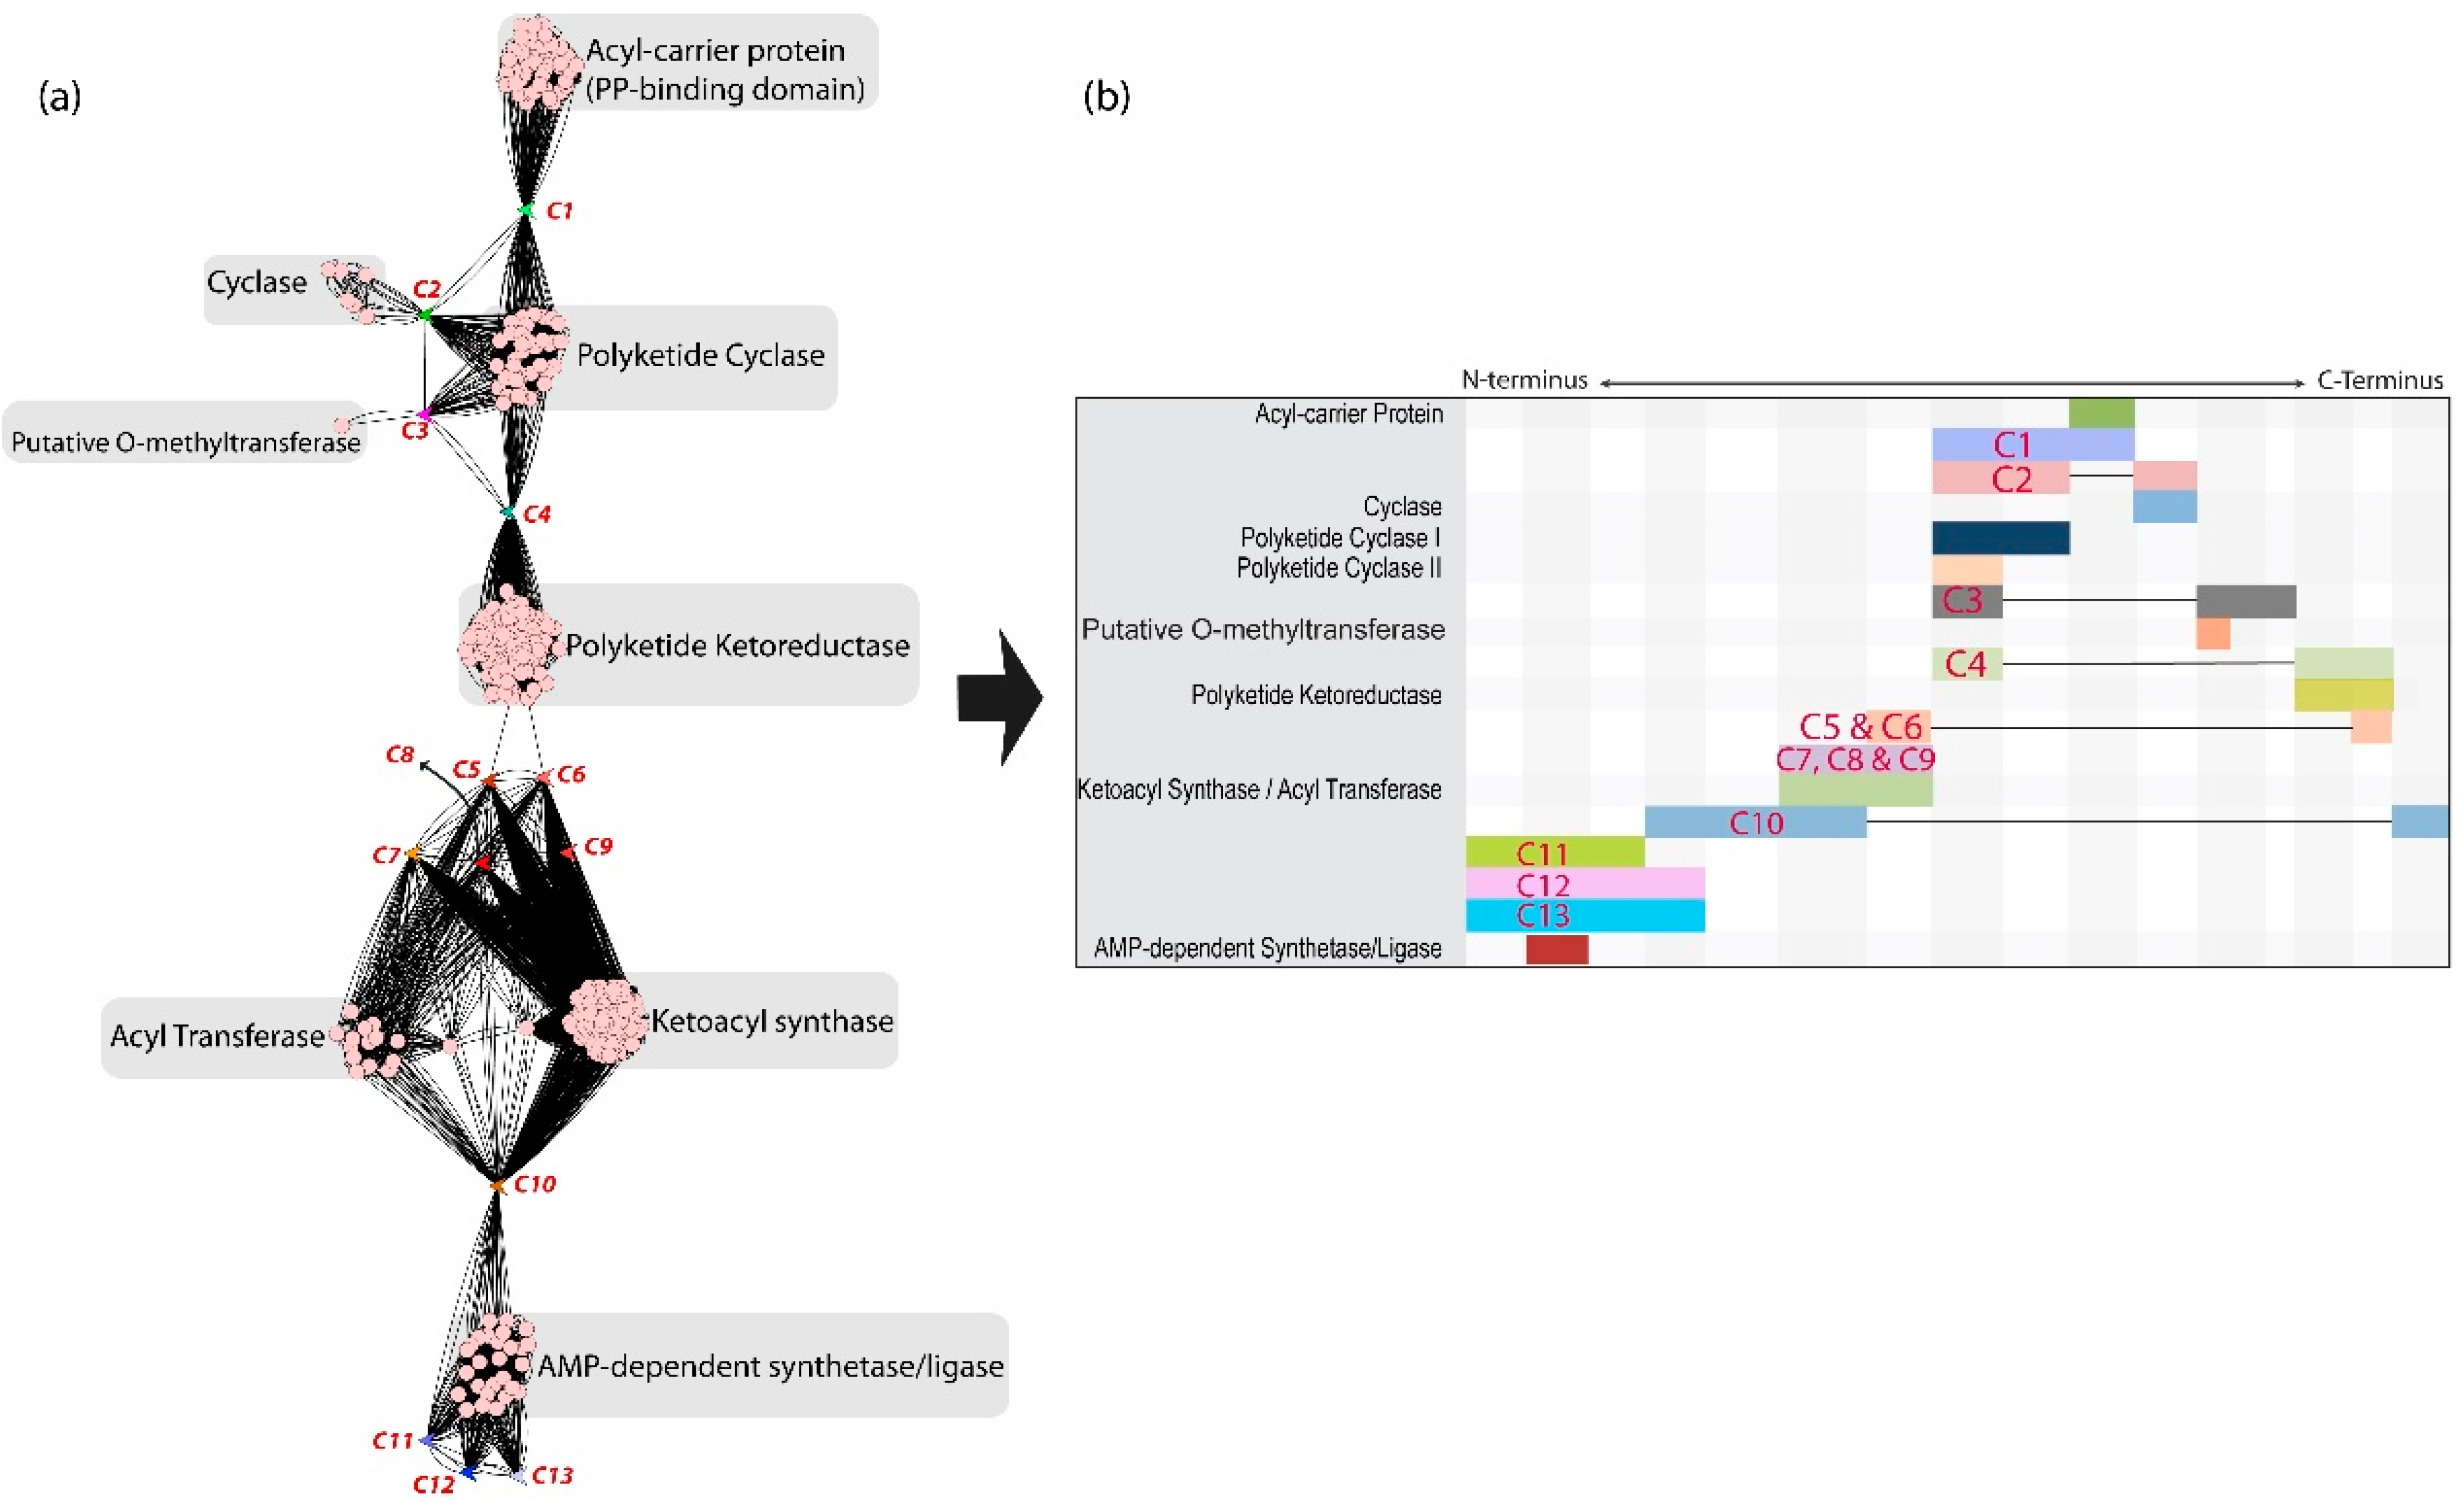
A total of 280 type II PKS gene sequences were gathered from the Kim and Yi [29] paper (see S1.xlsx). An all-against-all BLASTP search was carried out between these sequences and the S. coelicolor genome, which resulted in 143 significant hits from this genome (listed in S2.txt). A total of 423 gene sequences were used as the input for Cytoscape to create an SSN that consisted of 423 nodes and 22,903 edges (full edge list in S3.txt). The SSN is broken down into one giant connected component (GCC) and 10 smaller connected components. The GCC contains 348 nodes, which is 82% of the entire network. The network was searched for composite genes using the program FusedTriplets.py [32] with a threshold set at 1e−15. FusedTriplets.py detected 13 composite genes within the SSN, all of who are located within the GCC of the network (see Figure 1a). The domain composition of each of the composite genes was determined by carrying out a Batch BLAST of their sequences and the domain structures were manually inspected using the INTERPRO database (http://www.ebi.ac.uk/interpro/).
Figure 1. (a) Giant Connected Component (GCC) uniting 423 proteins. Composite proteins are indicated using the labels C1–C13. Communities within the GCC are labelled with their consensus function. Occasionally, members of a community are present in two different isoforms (e.g., “Polyketide Cyclases” are long form and short form); (b) A “lego diagram” of the block structure of the proteins and how gene remodelling provides a path connecting all the proteins in this GCC. Homologous protein parts are aligned in the same column. The rows are the different kinds of genes. Occasionally, in order to facilitate lining the blocks up, it was necessary to split the proteins. In those cases, black lines join contiguous protein parts.
Computation 03 00114 g001

3.2. Composite Gene 1 Analysis

As an example of the results we obtained, we will detail the evidence for the first composite protein in our dataset. Composite protein 1 (C1, Figure 1a,b) is 319 amino acids in length and contains an aromatase/cyclase-like domain and a phosphopantetheine binding domain (see Figure 1). The aromatase/cyclase domain participates in the diversification of aromatic polyketides by promoting polyketide cyclisation [36]. The phosphopantetheine binding domain serves as the attachment site of a 4'-phosphopantetheine prosthetic group. According to FusedTriplets.py, C1 was present in a non-transitive triplet with proteins from clique 2 and clique 3. The domain architecture of the proteins was verified using BLAST. All proteins in clique 2 solely contained the phosphopantetheine binding domain and all proteins in clique 3 only contained an aromatase/cyclase-like domain.
This result shows that C1 is comprised of a combination of domains from clique 2 and clique 3, indicating that it is encoded by a fusion of two genes derived from these two cliques. Therefore, based on the domain architecture of C1 it is reasonable to suggest that C1 is encoded by a fused gene.
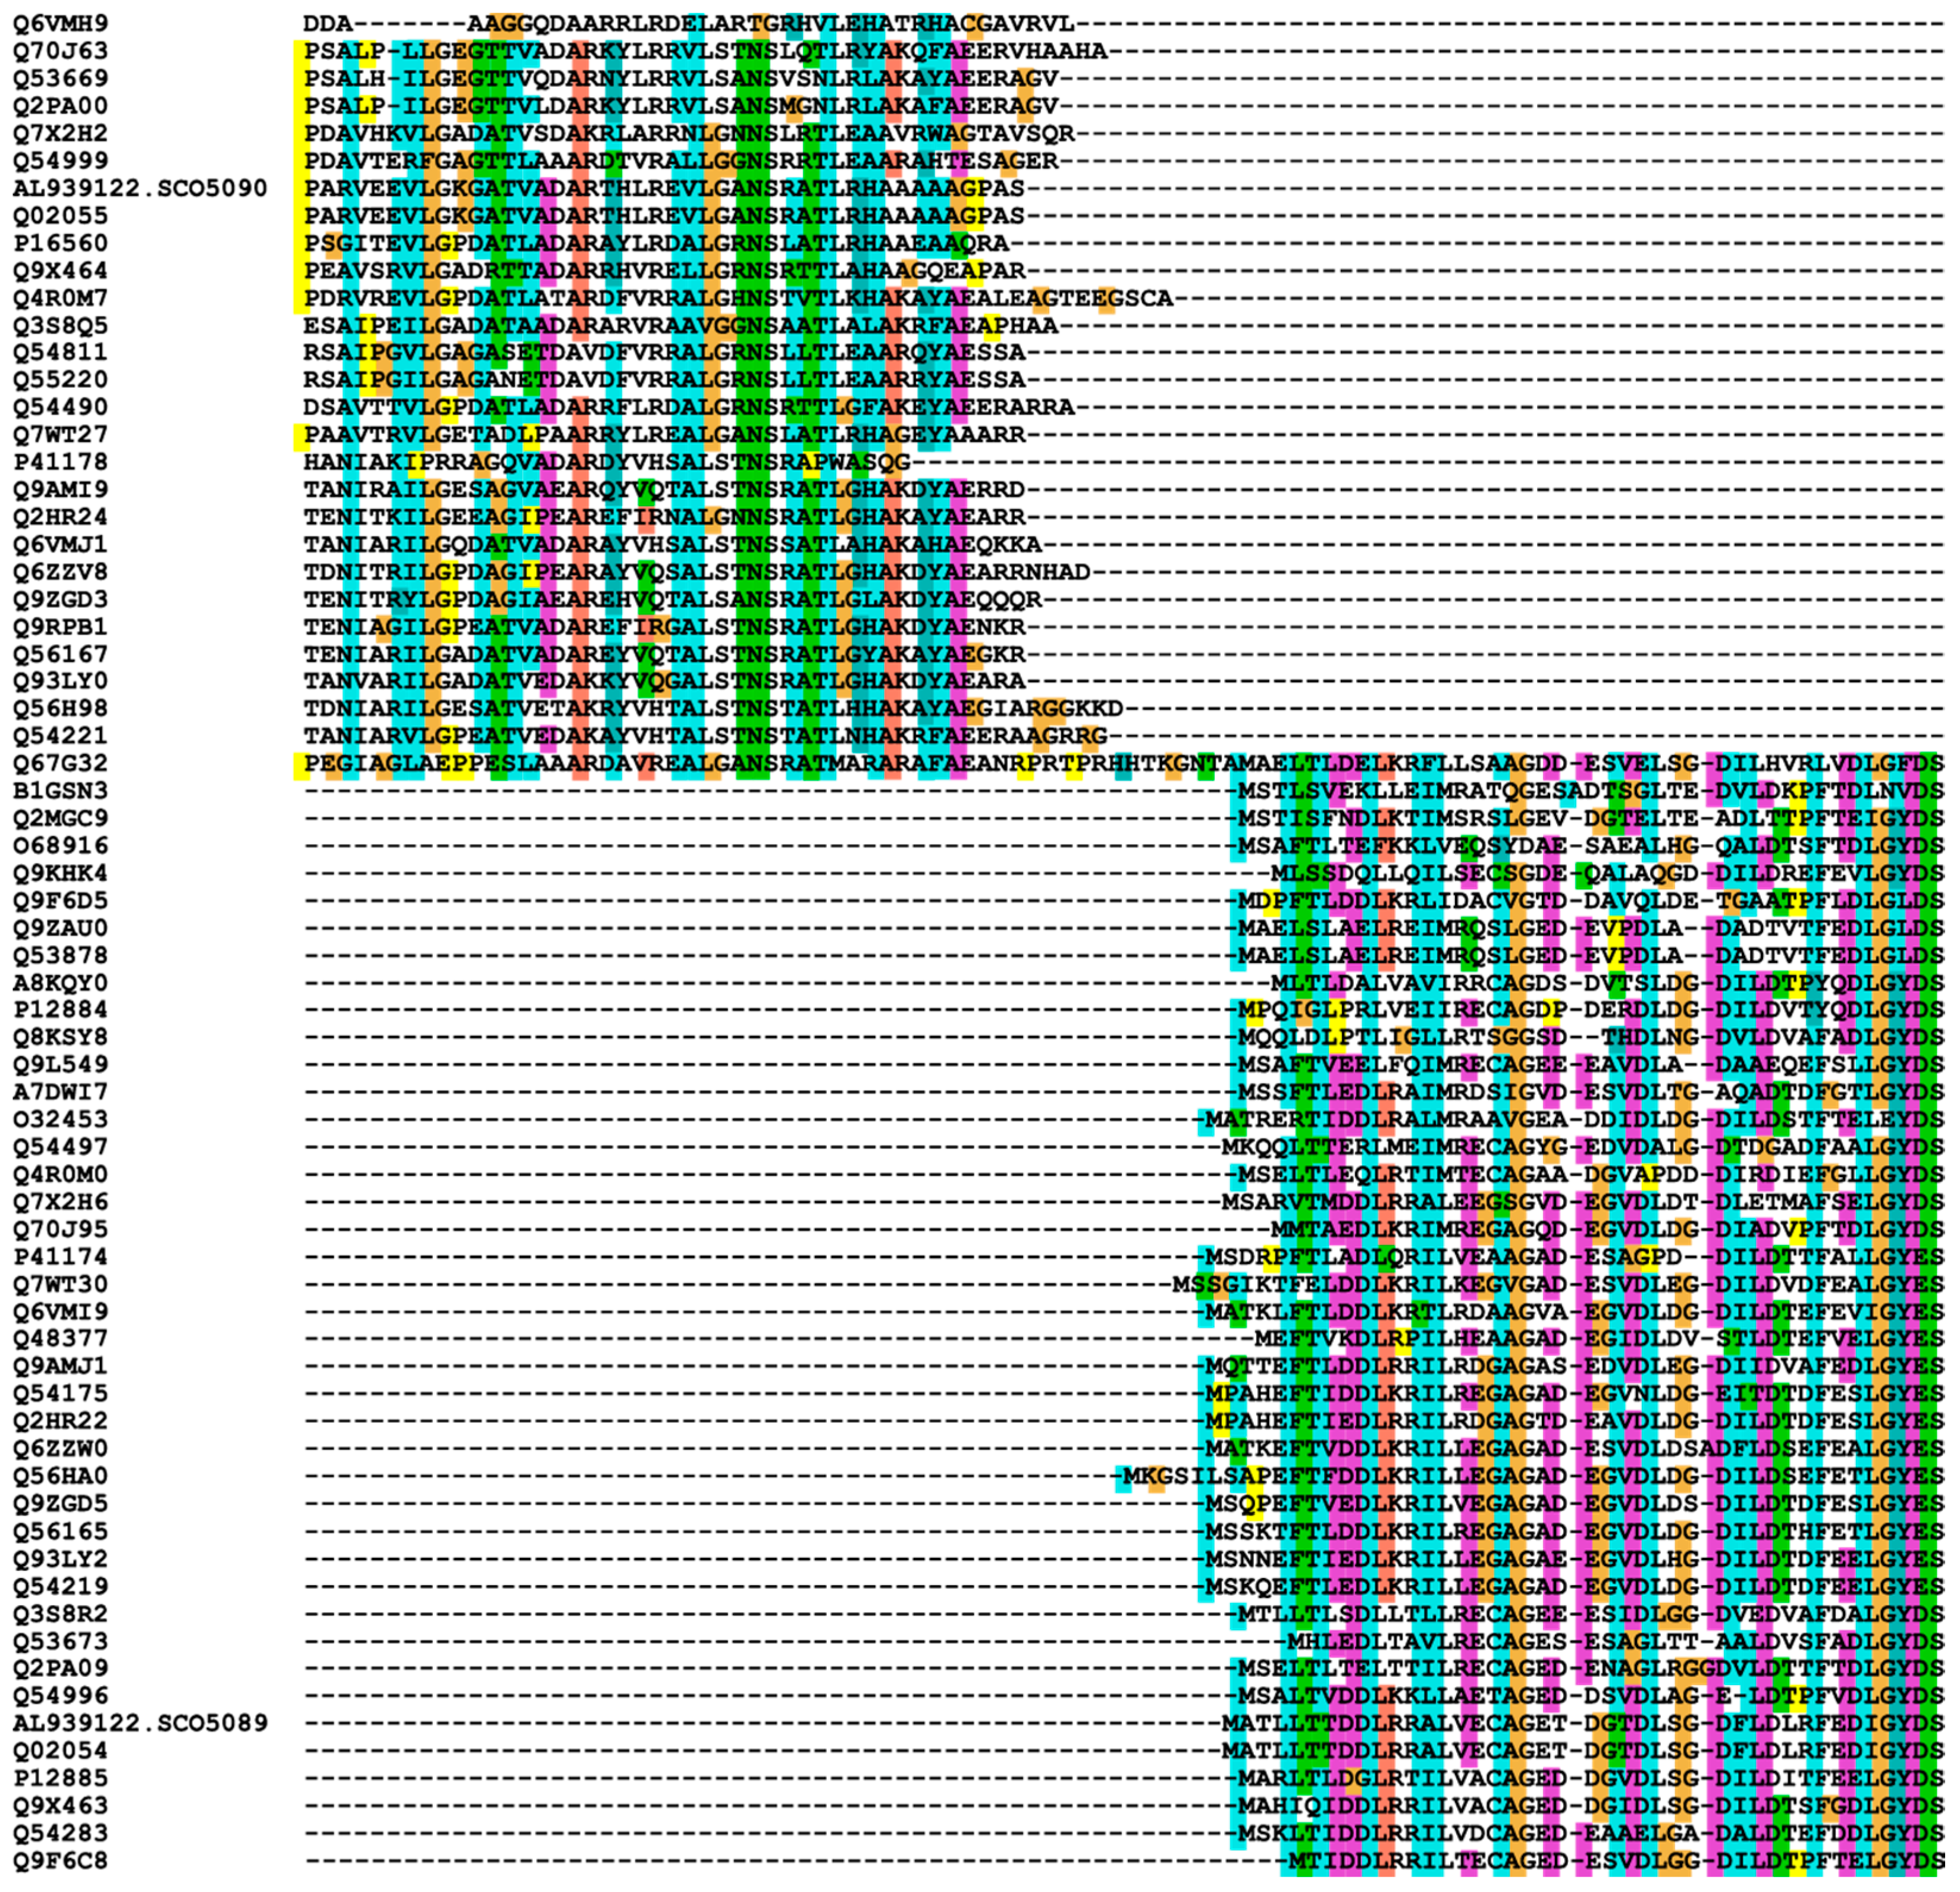
In order to further investigate the evolutionary history of these sequences, alignments were constructed using MUSCLE. An alignment of the sequences of clique 2 and C1 was merged with an alignment of clique 3 and C1. Seaview was used to visualise the resulting merged alignment. The result displays clique 2 aligning to the C-terminus of C1 and clique 3 aligned to the N-terminus of C1.
Figure 2 shows a section of the alignments that show the exact regions where each clique aligns to the composite protein.
Based on the FusedTriplets.py analysis, the domain architecture, and the alignments, it is likely that C1 is a fusion of two genes similar to those found in clique 2 and clique 3. The extent of gene remodelling in the giant connected component (GCC) of the SSN was investigated by aligning homologous blocks and merging the blocks according to the protein that spans the blocks.

3.3. GCC Analysis

Inspection of the network reveals a general pattern of protein mosaicism and a schematic of the result was created and is shown as Figure 1b. This schematic represents the polyketide proteins as a kind of “molecular lego”. The polyketide biosynthetic proteins are made up of domains with defined functions in the synthesis of polyketides. The domains act like blocks of lego and the proteins are shown to be sharing these blocks with each other. Overall, the connected component consists of communities (“Tribes” sensu Haggerty et al. [11]) held together by composite genes. Within the proteins domains act like biological lego blocks collectively forming the overall protein. However, in Figure 1b and Figure 3 it can be seen that the proteins themselves are acting as lego blocks keeping the connected component together. This genetic world of polyketide biosynthetic proteins is much more connected and complex than was initially thought.
Figure 2. Section of alignments of clique 2 and 3 to C1. Clique 3 includes the first 27 sequences which clearly align to the N-terminus of C1, shown here as Q67G32. Clique 2 includes the last 40 sequences that align to the C-terminus of C1. Figure taken from section of result shown on Seaview.
Computation 03 00114 g002
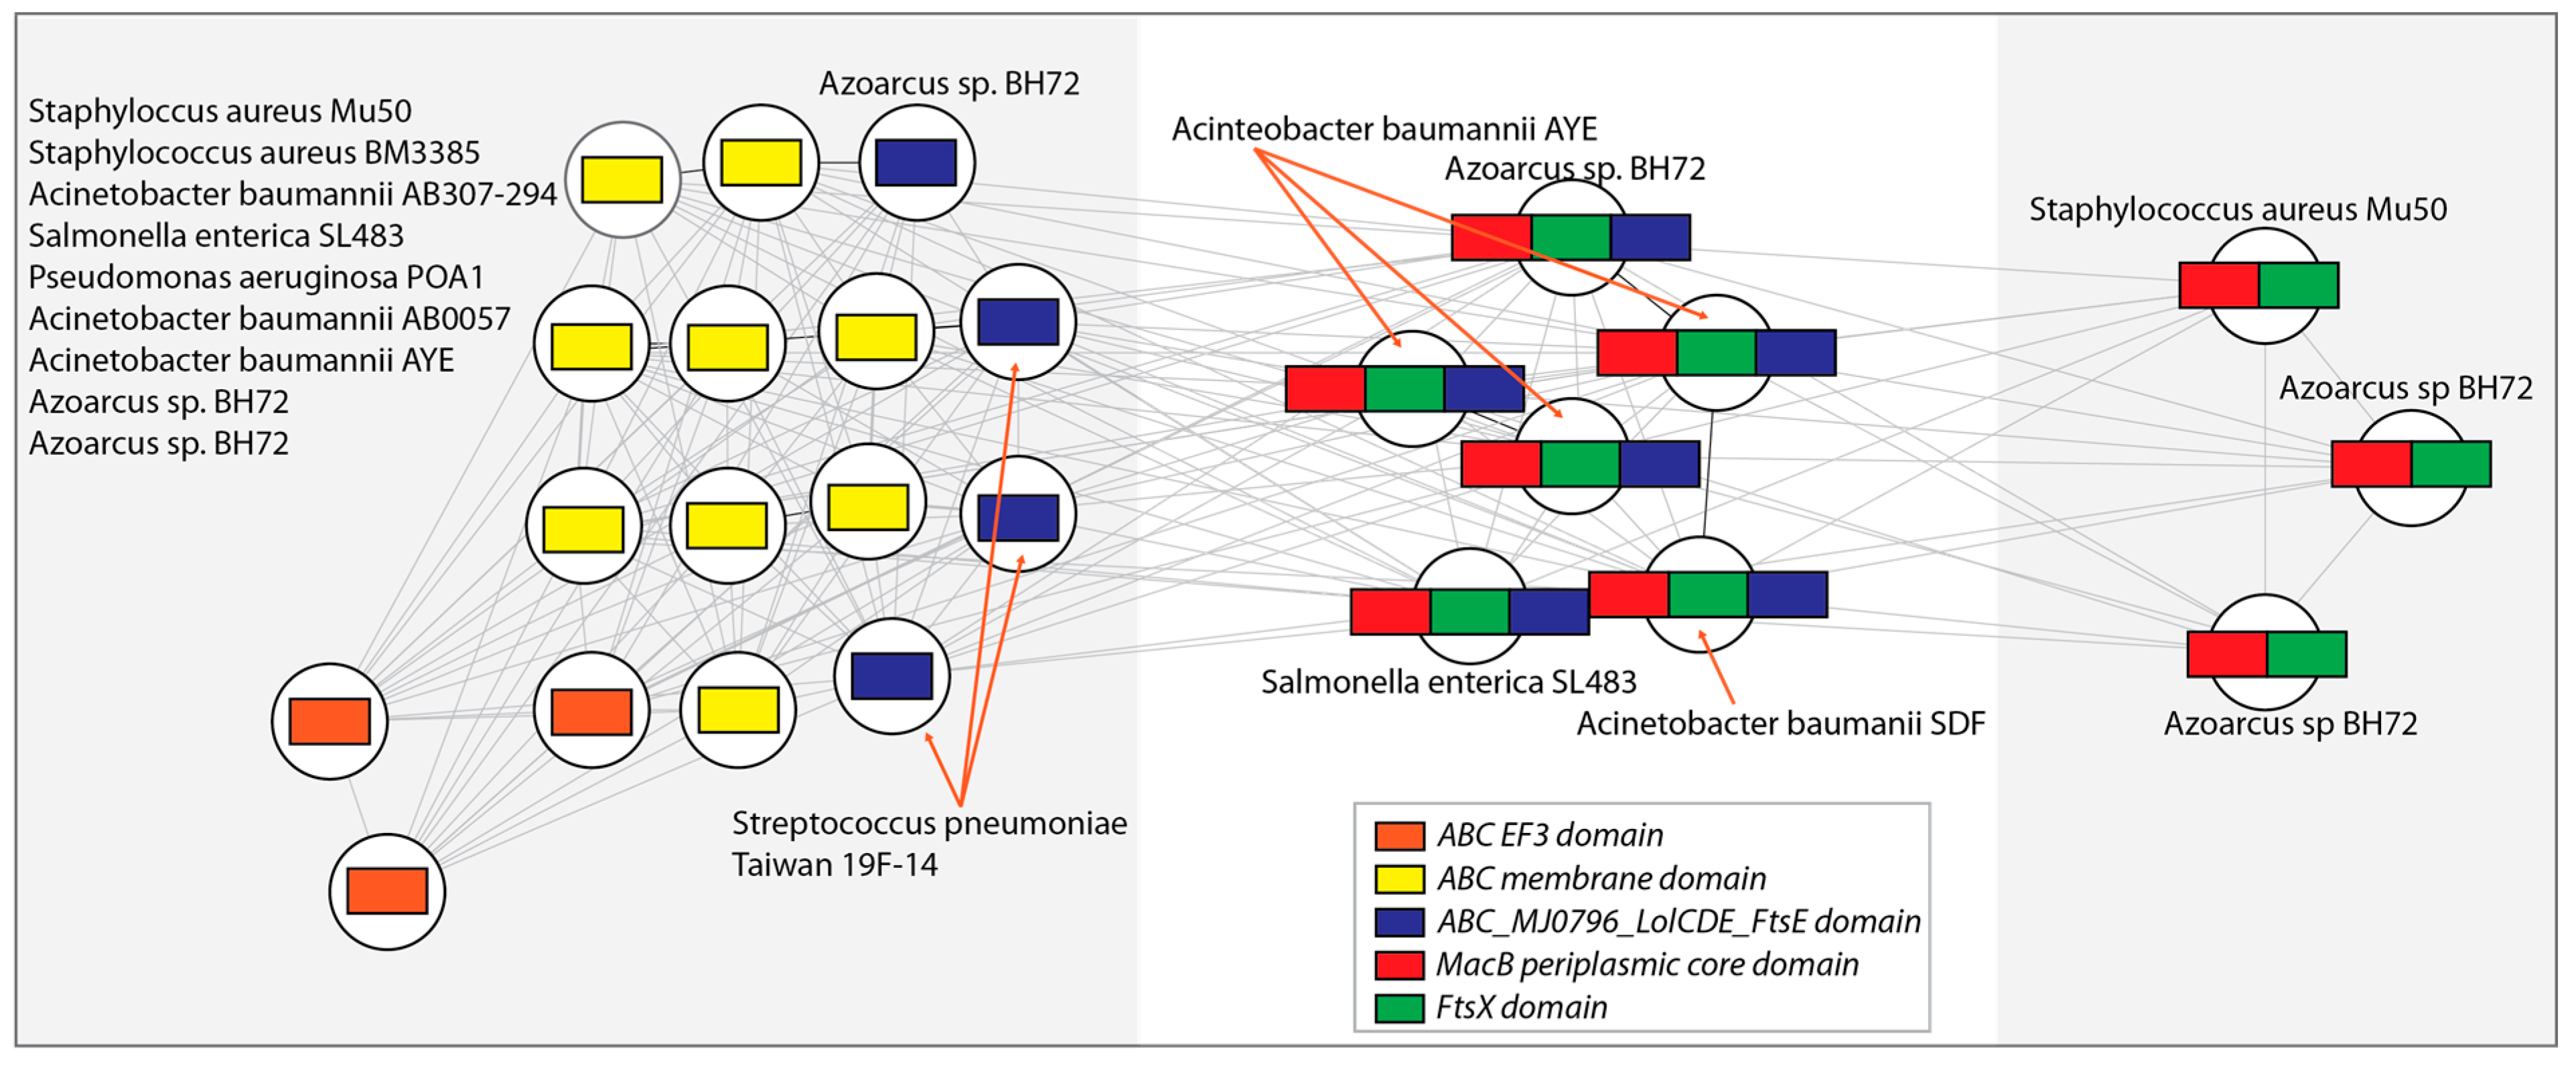
Figure 3. Sequence similarity network displaying significant similarities (network edges) detected by BLAST between the gene sequences (network nodes).
Computation 03 00114 g003
The thirteen composite proteins are acting as bridges connecting protein families with members that are not homologous. Therefore, two randomly-selected proteins in the GCC may not be directly connected to each other, however through a chain of composite proteins and neighbours any two proteins are related to each other. Within this limited, exemplar dataset we can see that there are sequences with different ancestors that recombine to create intermediate sequences that share partial homology with both of their ancestral sequences [11]. The concept of homology is defined as “descent from a common ancestor” [37]. However, Haggerty et al. [11] proposes that homologous relationships are those where descent from at least one common ancestor has occurred and family resemblance relationships are those where a path of significant similarity can be found through a graph like what we see in the GCC of this SSN. This study is not suggesting that all the genes or proteins in an SSN are homologs of one another, however, it is clear that there are relationships that can be explored that are outside what is conventionally expected of homologs. These extended families are forming as a result of extensive gene remodelling across polyketide genes. The formation of fused genes is allowing two previously distinct and separate communities of genes to become connected. These PKS communities are now exhibiting a family resemblance relationship and should be analysed together. These patterns of gene sharing and recombination among polyketides could not have been seen using phylogenetic trees. The SSN based view provides a perspective that is hidden if phylogenetic trees are used as the sole lens through which we view evolutionary history. Although the conventional model of phylogenetic trees are appropriate for visualising the evolution of treelike processes they are not suitable for all kinds of evolutionary relationship.

3.4. Case 2: Antibiotic Resistance Genes
A total of 1642 antibiotic resistance genes from 110 genomes were retrieved from the Comprehensive Antibiotic Resistance Database (CARD; http://arpcard.mcmaster.ca) [30] (see supplementary file S4.txt). An SSN was generated from the BLAST search and visualized using Cytoscape. BLASTP found 1568 hits in this data set. The SSN contains 71 connected components, six of which contain at least one composite gene (data available in S5.txt). FusedTriplets.py created three output files: (i) fused genes; (ii) neighbouring genes; and (iii) non-transitive triplets. From this analysis, a total of 73 composite genes were recovered from the total of 1647 known antibiotic resistant genes. Therefore 4.43% of the genes in the network were found to be composites.
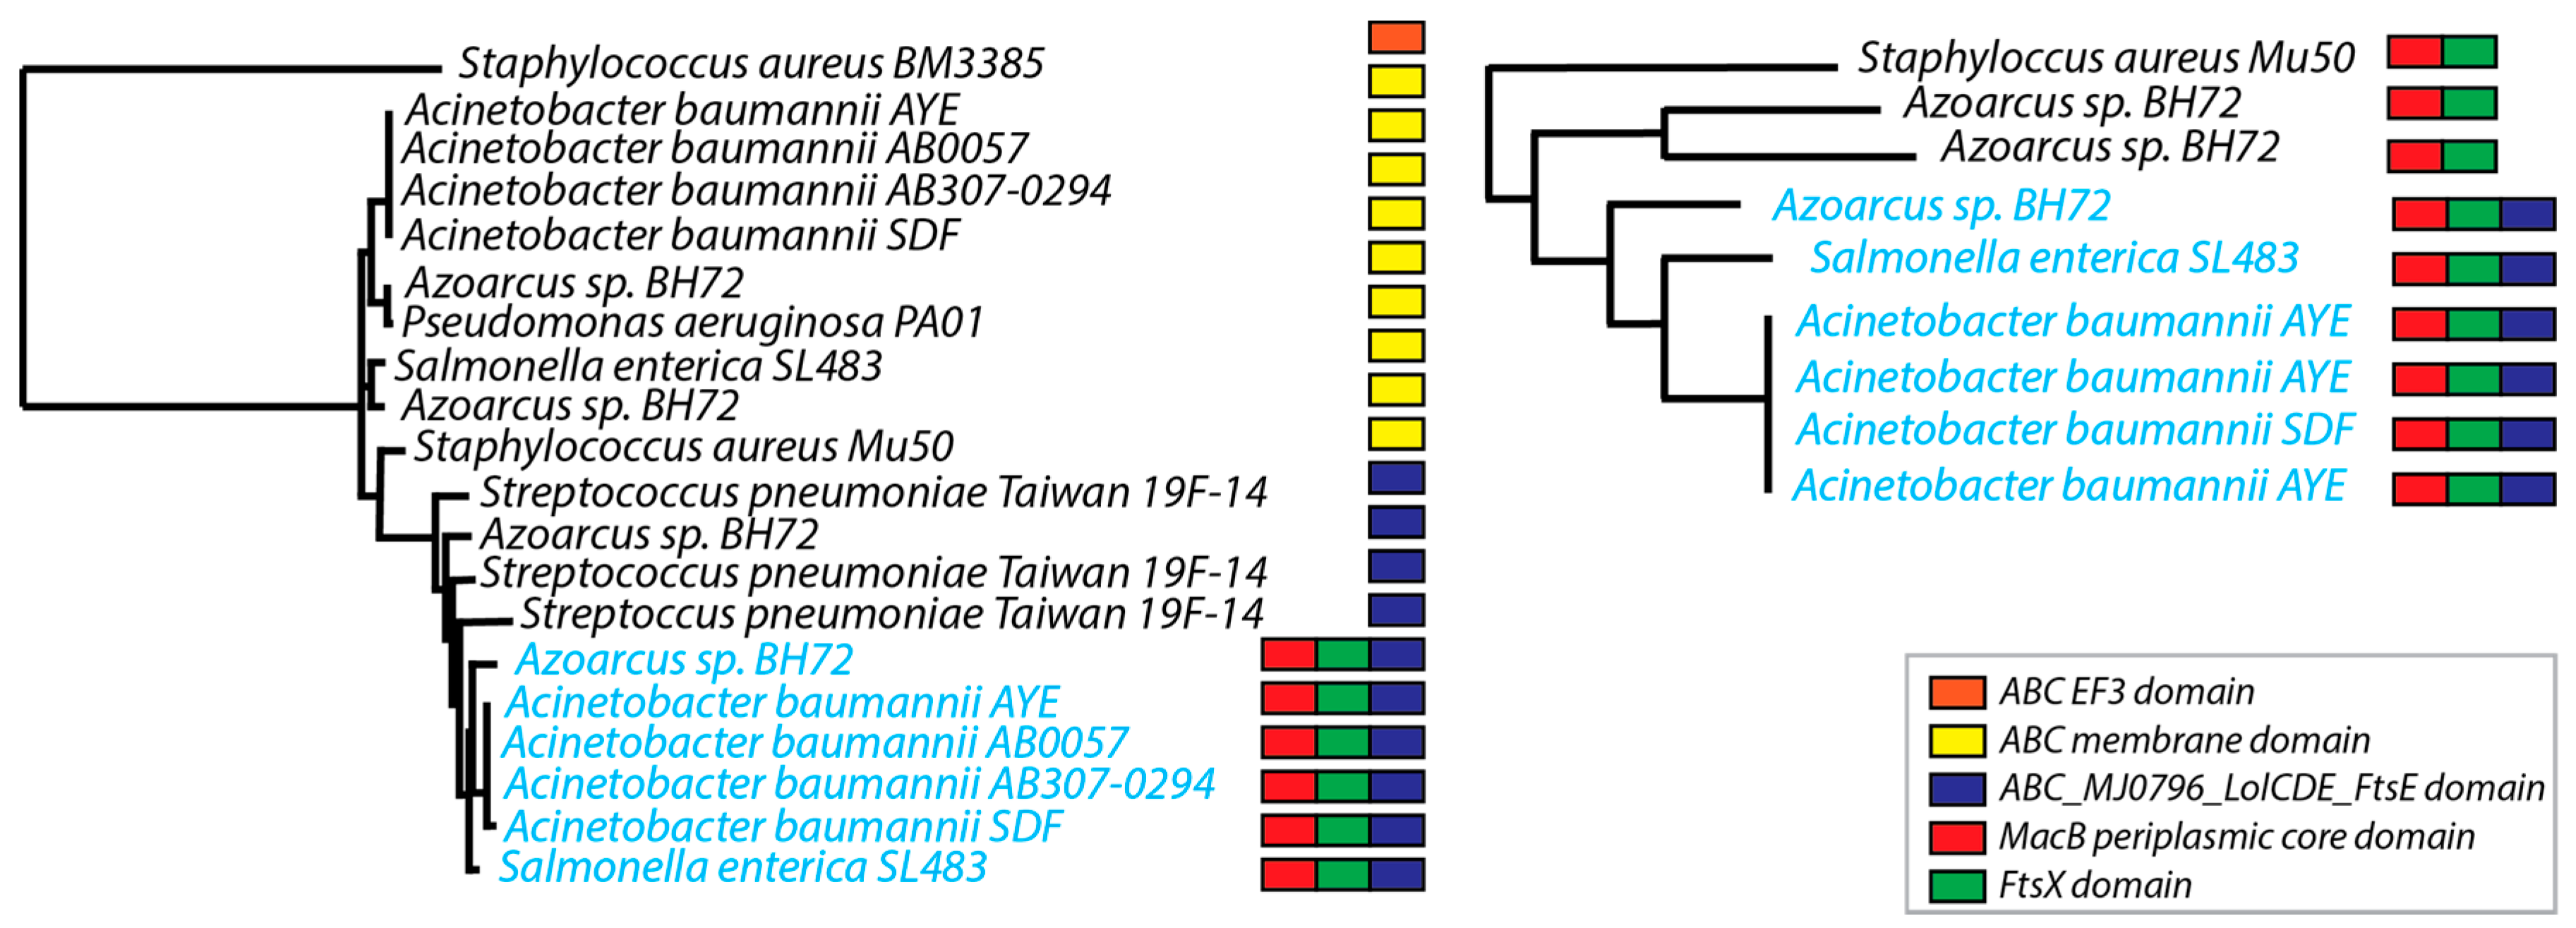
The connected component (CC) seen in Figure 4 consists of 26 genes organized into two maximal cliques (entirely connected subsets that don’t exclusively exist inside the vertex set of a larger clique). The first clique is comprised of the 16 genes on the left and the six genes in the centre of the network. Two of the 16 genes were discarded because they were not directly connected to the composites. Additionally the six genes in the middle of the network and the three genes on the right form the second clique. FusedTriplets.py identified these six genes in the centre of the network as composites genes, due to their position non-transitive triplets in the network. This non-transitive relationship strongly suggests fusion or fission event/s.
The 16 genes on the left are members of the ABC_ATPase Superfamily as defined by the Batch CD search tool [33]. However, only four (gene set A) contain the specific domain hit ABC_MJ0796_LolCDE_FtsE found in the composites. Batch CD identified FtsX and Mac_PCD specific hits in the three component genes on the right (gene set B) and also in the six composite genes. Consequently the composite genes are an amalgamation of these three domains: FtsX, Mac_PCD and ABC_MJ0796_LolCDE_FtsE.
Figure 4. Maximum likelihood trees generated by Seaview. Both phylogenetic trees contain the six composite genes, indicated in blue font. The coloured squares indicate the domain architecture of the genes.
Computation 03 00114 g004

3.5. Sequence Alignments

Using MUSCLE the composite genes were aligned separately with gene set A and separately aligned with gene set B. The six composite genes range in length from 648 to 656 nucleotides. Between nucleotide positions ~2–210, gene set A shows homology with the composite genes at the 5' end between nucleotide positions ~4–212. Nucleotide position ~3–402 of the sequences of gene set B show homology with nucleotide position ~261–661 of the composite genes. These two alignments were merged using Seaview. It is evident from this merged alignment that FusedTriplets.py has found a true fusion/fission event, with no undetected homology between the two different component families.

3.6. Phylogenetic Trees

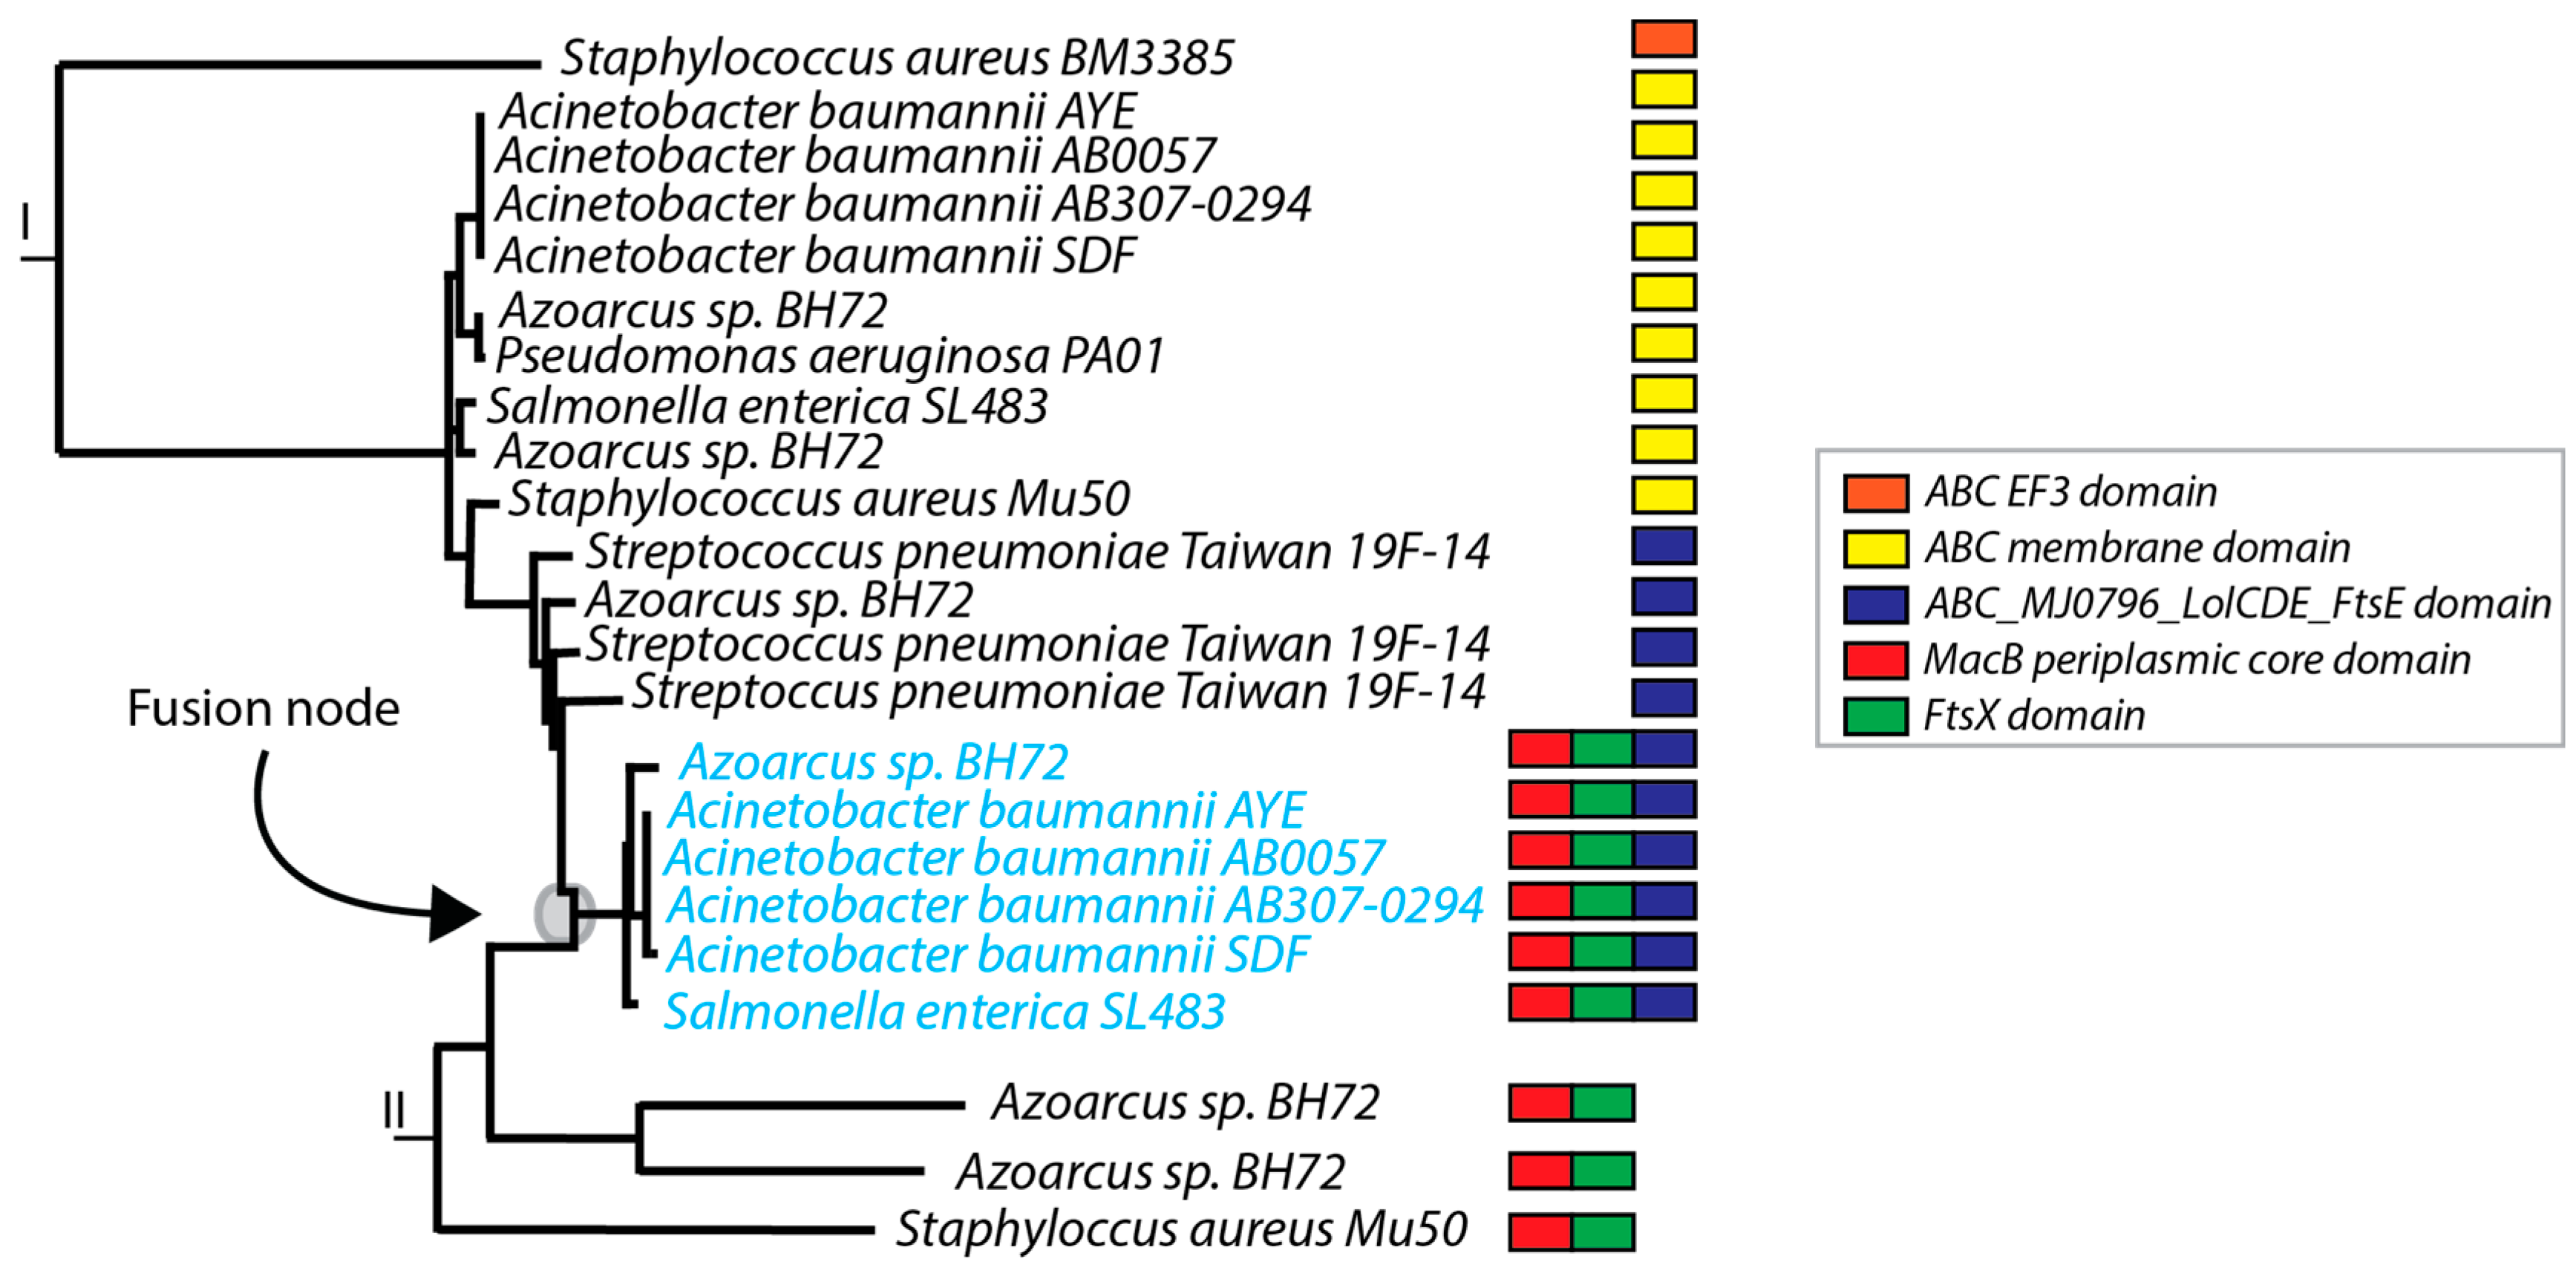
Phylogenetic trees were constructed from the protein sequences to distinguish whether these genes had arisen due to fusion or fission. Two maximum likelihood trees were generated from the two separate alignments as implemented in Seaview (Figure 4). From the BLAST results, the alignment and the phylogenetic trees, it is apparent that these composite genes have resulted from the fusion of two non-homologous ancestors. Investigation of the structure of these maximum likelihood trees indicated that the composite genes are a monophyletic group in both trees. This indicates that the six contemporary composite genes have arisen due to one single fusion event.

3.7. N-Rooted Graph

The need to appropriately depict this fusion gene’s evolutionary history led to the development of an N-rooted graph (Figure 5). The two maximum likelihood trees generated on Seaview were arbitrarily rooted and manually merged using the Adobe Illustrator software. This graph contains two roots, which can properly represent the evolutionary history of these genes. The approximate location of the fusion event is also indicated. The resulting graph provides a more complete picture of the evolutionary history of the fused genes. Guided by the topology of the two phylogenetic trees (Figure 5) it was possible to link the position of the fusion event between the two parents: I and II. Branch lengths are based on the maximum likelihood estimation. An obvious question arising from this graph, is whether the genes containing the MacB and FstX domain were the only versions capable of fusing with genes containing the ABC_MJ0796_LolCDE_FtsX domain. There are no observations of fusions with genes containing the ABC_membrane and ABCF_EF-3 domain. The sample is obviously small, but nonetheless, N-rooted fusion graphs can be used to generate testable hypotheses concerning the determinants of fusion.
Figure 5. Two-rooted fusion graph. This two-rooted graph was constructed using the two phylogenetic trees from Figure 4. The trees were mid-point rooted and merged using Adobe Illustrator. The two roots are marked I and II. The grey dot, labelled “Fusion node” indicates the approximate location of the fusion event. The coloured squares display the domain architecture of the genes.
Computation 03 00114 g005

4. Conclusions

This study set out to discuss new techniques for understanding the evolutionary history of genes and has used two exemplar studies in order to demonstrate the utility of network approaches for understanding evolutionary history. Reticulate events—defined as events where evolving genetic entities merge with one another—were better represented and analysed using a combination of newly developed network methods than if we had used existing approaches such as phylogenetic trees or phylogenetic networks. These methods include: SSNs, anchored sequence alignments and N-rooted graphs. Although conventional phylogenetic trees might be appropriate for visualising the evolution of many genes, they are not suitable for all evolutionary events [38,39,40,41] and are specifically unable to display evolutionary histories when these histories are entangled because of merging. In other words, when two evolving entities merge to form a single sequence, the histories of all the sequences cannot be represented by traditional phylogenetic trees. This is for two reasons—the two evolving entities have two separate roots, which should be displayed and the “merger” or “fusion” node has an in-degree of two and an out-degree of one, in contrast to all internal nodes on phylogenetic trees which have an in-degree of one and an out-degree of two.
The SSN based view adopted in this paper demonstrates the kind of view no other method can provide. SSNs can be used to examine the relationships within large, diverse sets of sequences for which traditional methods such as phylogenetic trees would be restrictive. A key stumbling block right now is the difficulty in generating accurate multiple alignments—because the expectations of current sequence aligners is that the sequences being studied are homologous for much, if not all, of their length. When we consider mosaic sequences, we have no such expectation. In addition, networks provide a graphical overview of interrelationships among and between sets of sequences that are not seen from visual inspection of large trees and multiple alignments. Although it well known that homology relationships strongly suggest functional similarities, analysis of networks could reveal additional functional connections through the analysis of extended family resemblances [41]. SSNs provide the user with a flexible, interactive view, where both nodes and edges can be overlaid with additional information (for example, functional annotation and domain attributes), making networks a powerful tool for hypothesis generation. Few tools exist for the simultaneous visualization of the large numbers of protein sequences that exist in nature. Up to now, we have considered these sequences independently of one another and have focussed on categorising the proteins and putting them into discrete families. There is no need for such a constraint; however, the analyses are not readily carried out using extant tools. With this realisation, there is a need for the development of software capable of readily processing proteome universes.
Fusion genes, responsible for new functions, are increasingly being reported [20,42,43,44,45]. If we consider the polyketide example in Figure 1, for instance, the patterns of connectivity displayed by the composite proteins are interesting. On occasion we are seeing triangles of connectivity. Triangles and chains in a network such as this indicate a sharing and re-sharing of sequences and this is a very non-treelike process. Therefore, there is a particular need for easy-to-use programs to aid biologists to identify and analyse such events. FusedTriplets.py was used in this study as a method for detecting composite genes however other technologies also exist. Another interesting fusion detection program currently available is MosaicFinder [32]. A comparison of both these programs was carried out and the results show that the two methods produce overlapping, but non-identical sets of inferences of fused genes (data not shown). The strong overlap between the two methods is reassuring, giving us increased confidence that the mosaic genes identified by both methods are true positives as both methods try to extract different features in the data. MosaicFinder has an advantage in that collections of gene families are identified during the analysis, thus avoiding the added post-processing of the data that is necessary when using FusedTriplets.py. However, FusedTriplets.py is more user friendly, easy to understand and the thresholds can be changed without much difficulty. It would be useful to extend a comparison across all published methods of detecting fusion genes.
Using the methods outlined in this manuscript it is possible to unveil patterns of family resemblance and extended gene sharing. Alignments show the extent of gene remodelling between sequences and allow the visualisation of family relationships. The use of alignments in case 1 has revealed extended gene families as well as the exact regions of homology that keep these extended families together in the graph. Microbial evolution has frequently occurred through introgression with genes and parts of genes acting as goods [46] that can be shared.
N-rooted graphs offer the possibility of unearthing functional connections between unrelated sequences in a comprehensive manner. Fusion events are represented on such a graph by a node with an in-degree of two and an out degree of one. The modelling of N-rooted graphs is explicitly different to that of phylogenetic trees as it allows for more than one root. Phylogenetic trees do not contain this kind of node; therefore, N-rooted graphs capture a greater variety of evolutionary events than traditional gene trees. Development of rigorous statistical methods is required for the construction of N-rooted graphs. Additionally, time estimation methods need to be developed for these graphs, in order to date the initial introgressive event [11].
This research indicates that gene similarity networks can strengthen phylogenetic studies of gene origins and gene evolution over time.

Author Contributions

All authors were involved in designing the project. O.C., R.H., N.M. and N.R. collected the data and performed the analyses. All authors interpreted the results and drafted the manuscript.

Conflicts of Interest

The authors declare no conflict of interest.

References

  1. Dagan, T. Phylogenomic networks. Trends Microbiol. 2011, 19, 483–491. [Google Scholar] [CrossRef] [PubMed]
  2. Darwin, C. On the Origin of Species 1859 Chapter IV “Character of Natural Selection” in the sub-section on “Divergence of Character.”; John Murray: London, UK, 1859. [Google Scholar]
  3. Huson, D.H.; Rupp, R.; Scornavacca, C. Phylogenetic Networks-Concepts, Algorithms and Applications; Cambridge University Press: Cambridge, UK, 2011; Volume 1. [Google Scholar]
  4. Bapteste, E.; van Iersel, L.; Janke, A.; Kelchner, S.; Kelk, S.; McInerney, J.O.; Morrison, D.A.; Nakhleh, L.; Steel, M.; Stougie, L.; et al. Networks: Expanding evolutionary thinking. Cell 2013, 29, 439–441. [Google Scholar]
  5. Myers, C.L.; Robson, D.; Wible, A.; Hibbs, M.A.; Chiriac, C.; Thessfeld, C.L.; Dolinski, K.; Troyanskaya, O.G. Discovery of biological networks from diverse functional genomic data. Genome Biol. 2005, 6. [Google Scholar] [CrossRef]
  6. Larremore, D.B.; Clauset, A.; Buckee, C.O. A Network Approach to Analyzing Highly Recombinant Malaria Parasite Genes. PloS Comput. Biol. 2013, 9. [Google Scholar] [CrossRef]
  7. Jordan, W.C.; Turnquist, M.A. A stochastic, dynamic network model for railroad car distribution. Transp. Sci. 1983, 17, 123–145. [Google Scholar] [CrossRef]
  8. Viswanath, B.; Mislove, A.; Cha, M.; Gummadi, K.P. On the evolution of user interactions in Facebook. In Proceedings of the 2nd ACM Workshop on Online Social Networks (WOSN’09), Barcelona, Spain, 17 August 2009; pp. 37–42.
  9. Dagan, T.; Martin, W. Getting a better picture of microbial evolution en route to a network of genomes. Philos. Trans. Royal Soc. Boil. Sci. 2009, 364, 2187–2196. [Google Scholar] [CrossRef]
  10. Halary, S.; Leigh, J.W.; Cheaib, B.; Lopez, P.; Bapteste, E. Network analyses structure genetic diversity in independent genetic worlds. Proc. Natl. Acad. Sci. USA 2010, 107, 127–132. [Google Scholar] [CrossRef] [PubMed]
  11. Haggerty, L.; Jachiet, P.A.; Hanage, W.P.; Fitzpatrick, D.A.; Lopez, F.; O’Connell, M.J.; Pisani, D.; Wilkinson, M.; Bapteste, E.; McInerney, J.O. A pluralistic account of homology: Adapting the models to the data. Mol. Boil. Evol. 2013, 22. [Google Scholar] [CrossRef]
  12. Alvarez-Ponce, D.; Lopez, P.; Bapteste, E.; McInerney, J.O. Gene similarity networks provide tools for understanding eukaryotic origins and evolution. Proc. Natl. Acad. Sci. USA 2013, 110, 1594–1603. [Google Scholar] [CrossRef]
  13. Halary, S.; Mc Inerney, J.O.; Lopez, P.; Bapteste, E. EGN: A wizard for construction of gene and genome similarity networks. BMC Evol. Biol. 2013, 13. [Google Scholar] [CrossRef]
  14. Fondi, M.; Fani, R. The horizontal flow of plasmid resistome: Clues from inter-generic similarity networks. Wiley 2010, 12, 3228–3242. [Google Scholar]
  15. Altschul, S.F.; Madden, T.L.; Schaffer, A.A.; Zhang, J.H.; Zhang, Z.; Miller, W.; Lipman, D.J. Gapped BLAST and PSI-BLAST: A new generation of protein database search programs. Nucleic Acids Res. 1997, 25, 3389–3402. [Google Scholar] [CrossRef] [PubMed]
  16. Pradhan, M.P.; Nagulapalli, K.; Palakal, M.J. Cliques for the identification of gene signatures for colorectal cancer across population. BMC Syst. Biol. 2012, 6. [Google Scholar] [CrossRef] [PubMed]
  17. Long, M.; Betrán, E.; Thornton, K.; Wang, W. The origin of new genes: Glimpses from the young and old. Nat. Rev. Genet. 2003, 4, 865–875. [Google Scholar] [CrossRef] [PubMed]
  18. Durrens, P.; Nikolski, M.; Sherman, D. Fusion and Fission of Genes Define a Metric between Fungal Genomes. PloS Comput. Biol. 2008, 4. [Google Scholar] [CrossRef]
  19. Kummerfeld, S.K.; Teichmann, S.A. Relative rates of gene fusion and fission in multi-domain proteins. Trends Genet. 2005, 21, 25–30. [Google Scholar] [CrossRef] [PubMed]
  20. Long, M.Y. A new function evolved from gene fusion. Genome Res. 2000, 10, 1655–1657. [Google Scholar] [CrossRef] [PubMed]
  21. Snel, B.; Bork, P.; Huynen, M. Genome evolution—Gene fusion versus gene fission. Trends Genet. 2000, 16, 9–11. [Google Scholar] [CrossRef] [PubMed]
  22. Marcotte, E.M.; Pellegrini, M.; Ng, H.L.; Rice, D.W.; Yeates, T.O.; Eisenberg, D. Detecting protein function and protein-protein interactions from genome sequences. Science 1999, 285, 751–753. [Google Scholar] [CrossRef] [PubMed]
  23. Civjan, N. Natural Products in Chemical Biology; Wiley: Hoboken, NJ, USA, 2012; pp. 143–189. [Google Scholar]
  24. Ridley, C.P.; Lee, H.Y.; Khosla, C. Evolution of polyketide synthases in bacteria. Proc. Natl. Acad. Sci. USA 2007, 105, 4595–4600. [Google Scholar] [CrossRef]
  25. Wright, G.D.; Poinar, H. Antibiotic resistance is ancient: Implications for drug discovery. Trends Microbiol. 2012, 20, 157–159. [Google Scholar] [CrossRef] [PubMed]
  26. Galerunti, R.A. The Antibiotic Paradox: How Miracle Drugs Are Destroying the Miracle. Health Values 1994, 18, 60–61. [Google Scholar]
  27. Davies, J.; Davies, D. Origins and Evolution of Antibiotic Resistance. Microbiol. Mol. Biol. Rev. 2010, 74, 417–433. [Google Scholar] [CrossRef] [PubMed]
  28. Levy, S.B.; Marshall, B. Antibacterial resistance worldwide: Causes, challenges and responses. Nat. Med. 2004, 10, S122–S129. [Google Scholar] [CrossRef] [PubMed]
  29. Kim, J.; Yi, G.S. PKMiner: A database for exploring type II polyketide synthases. BMC Microbiol. 2012, 12. [Google Scholar] [CrossRef] [PubMed]
  30. McArthur, A.G.; Waglechner, N.; Nizam, F.; Yan, A.; Azad, M.A.; Baylay, A.J.; Bhullar, K.; Canova, M.J.; de Pascale, G.; Ejim, L.; et al. The Comprehensive Antibiotic Resistance Database. Antimicrob. Agents Chemother. 2013, 57, 3348–3357. [Google Scholar] [CrossRef] [PubMed]
  31. Shannon, P.; Markiel, A.; Ozier, O.; Baliga, N.S.; Wang, J.T.; Ramage, D.; Amin, N.; Schwikowski, B.; Ideker, T. Cytoscape: A software environment for integrated models of biomolecular interaction networks. Genome Res. 2003, 13, 2498–2504. [Google Scholar] [CrossRef] [PubMed]
  32. Jachiet, P.A.; Pogorelcnik, R.; Berry, A.; Lopez, P.; Bapteste, E. MosaicFinder: Identification of fused gene families in sequence similarity networks. Bioinformatics 2013, 29, 837–844. [Google Scholar] [CrossRef] [PubMed]
  33. Marchler-Bauer, A. CDD: A Conserved Domain Database for the functional annotation of proteins. Nucleic Acids Res. 2011, 39D, 225–229. [Google Scholar] [CrossRef] [PubMed]
  34. Edgar, R.C. MUSCLE: Multiple sequence alignment with high accuracy and high throughput. Nucleic Acids Res. 2004, 32, 1792–1797. [Google Scholar] [CrossRef] [PubMed]
  35. Galtier, N.; Gouy, M.; Gautier, C. SEAVIEW and PHYLO_WIN: Two graphic tools for sequence alignment and molecular phylogeny. Computer Appl. Biosci. 1996, 12, 543–548. [Google Scholar]
  36. Ames, B.D.; Korman, T.P.; Zhang, W.; Smith, P.; Vu, T.; Tang, Y.; Tsai, S.C. Crystal structure and functional analysis of tetracenomycin ARO/CYC: Implications for cyclisation specificity of aromatic polyketides. Proc. Natl. Acad. Sci. USA 2008, 105, 5349–5354. [Google Scholar] [CrossRef] [PubMed]
  37. Britannica Encyclopedia (2014) “Homology”. Encyclopaedia Britannica Online, Encyclopædia Britannica Inc. 2014. Available online: http://www.britannica.com/EBchecked/topic/270557/homology (accessed on 10 April 2014).
  38. Brown, J.R. Ancient horizontal gene transfer. Nat. Rev. Genet. 2003, 4, 121–132. [Google Scholar] [CrossRef] [PubMed]
  39. McInerney, J.O.; Cotton, J.A.; Pisani, D. The prokaryotic tree of life: past, present ... and future? Trends Ecol. Evol. 2008, 23, 276–281. [Google Scholar] [CrossRef] [PubMed]
  40. Bapteste, E.; O’Malley, M.A.; Beiko, R.G.; Ereshefsky, M.; Gogarten, J.P.; Franklin-Hall, L.; Lapointe, F.J.; Dupre, J.; Dagan, T.; Boucher, Y.; et al. Prokaryotic evolution and the tree of life are two different things. Biol. Direct. 2009, 4. [Google Scholar] [CrossRef] [Green Version]
  41. Bapteste, E.; Lopez, P.; Bouchard, F.; Baquero, F.; McInerney, J.O.; Burian, R.M. Evolutionary analyses of non-genealogical bonds produced by introgressive descent. Proc. Natl. Acad. Sci. USA 2012, 109, 18266–18272. [Google Scholar] [CrossRef] [PubMed]
  42. Mitelman, F.; Johansson, B.; Mertens, F. Fusion genes and rearranged genes as a linear function of chromosome aberrations in cancer. Nat. Genet. 2004, 36, 331–334. [Google Scholar] [CrossRef] [PubMed]
  43. Long, M. A New Function Evolved from Gene Fusion. Genome Res. 2000, 10, 1655–1657. [Google Scholar] [CrossRef] [PubMed]
  44. Zhao, X.; Oh, S.H.; Coleman, D.A.; Hoyer, L.L. ALS51, a newly discovered gene in the Candida albicans ALS family, created by intergenic recombination: Analysis of the gene and protein, and implications for evolution of microbial gene families. FEMS Immunol. Med. Microbiol. 2011, 61, 245–257. [Google Scholar] [CrossRef] [PubMed]
  45. Micci, F.; Thorsen, J.; Panagopoulos, I.; Nyquist, K.B.; Zeller, B.; Tierens, A.; Heim, S. High-throughput sequencing identifies an NFIA/CBFA2T3 fusion gene in acute erythroid leukemia with t(1;16)(p31;q24). Leukemia 2013, 27, 980–982. [Google Scholar] [CrossRef] [PubMed]
  46. McInerney, J.O.; Pisani, D.; Bapteste, E.; O’Connell, M.J. The public goods hypothesis for the evolution of life on Earth. Biol. Direct. 2011, 6. [Google Scholar] [CrossRef]