1. Introduction
The transition toward sustainable mobility systems has become a strategic axis for addressing climate change, reducing greenhouse gas emissions, and mitigating environmental externalities associated with the transport sector. This sector represents one of the primary sources of global energy consumption and emissions, particularly in developing countries, where rapid vehicle fleet growth increases pressure on urban infrastructure, public health systems, and fiscal sustainability [
1].
In this context, data science applied to transportation has progressively incorporated advanced machine learning models. Among these, gradient boosting algorithms such as XGBoost and LightGBM stand out due to their high predictive performance and robustness in handling large-scale heterogeneous datasets [
2]. However, the widespread adoption of these models has revealed a critical gap between statistical accuracy and the understanding of the internal decision structure that generates predictions, thereby limiting their practical utility in transport policy design and evaluation [
3,
4].
Explainable Artificial Intelligence (XAI) methods are model-agnostic and can be applied to a wide range of machine learning algorithms, including linear models, random forests, neural networks, and gradient boosting methods. In this study, XGBoost and LightGBM are selected due to their strong predictive performance and their compatibility with TreeSHAP explanations, which enable efficient interpretation of tree-based ensemble models.
Explainable Artificial Intelligence (XAI) emerges as a methodological bridge between advanced modeling and informed decision-making, enabling the decomposition of black-box model behavior and the identification of the relative contribution of explanatory variables in shaping vehicle fleet composition [
5]. Within transportation engineering, several studies have proposed interpretable machine learning frameworks based on ensemble models and SHAP values to analyze driving behavior and crash severity. For instance, interpretable ensemble approaches combined with SHAP have been applied to rear-end collision severity analysis [
6], as well as to examine the examine the factors associated with electric vehicle adoption considering attitudinal factors [
7,
8]. These contributions demonstrate that the integration of boosting models with XAI techniques constitutes a methodologically sound and widely validated approach in the specialized literature.
This research is motivated by the need to comparatively evaluate XGBoost and LightGBM—not only in terms of predictive performance but also under an XAI perspective—to generate transparent, reproducible, and policy-relevant evidence for sustainable transport design. This need is particularly relevant in Ecuador, where the availability of real administrative data from the Internal Revenue Service (SRI) for 2025 provides a unique opportunity to analyze, at the national scale, the adoption dynamics of electric, hybrid, and internal combustion engine vehicles.
Based on this premise, the study addresses the following research question: What explanatory factors, derived from gradient boosting models applied to Ecuadorian administrative data, are statistically associated with the classification of electric and hybrid vehicle technologies compared to internal combustion vehicles, and to what extent do these explanations differ between XGBoost and LightGBM?
Rather than proposing a new algorithmic architecture, this study contributes a structured analytical framework. Instead, its contribution lies in the structured integration of (i) class-specific explainability, (ii) stability analysis of feature importance across attribute-based splits, and (iii) comparative boosting interpretability under extreme class imbalance within a national-scale administrative dataset. The methodological novelty therefore resides in the systematic evaluation framework rather than in algorithmic innovation.
3. Methodology
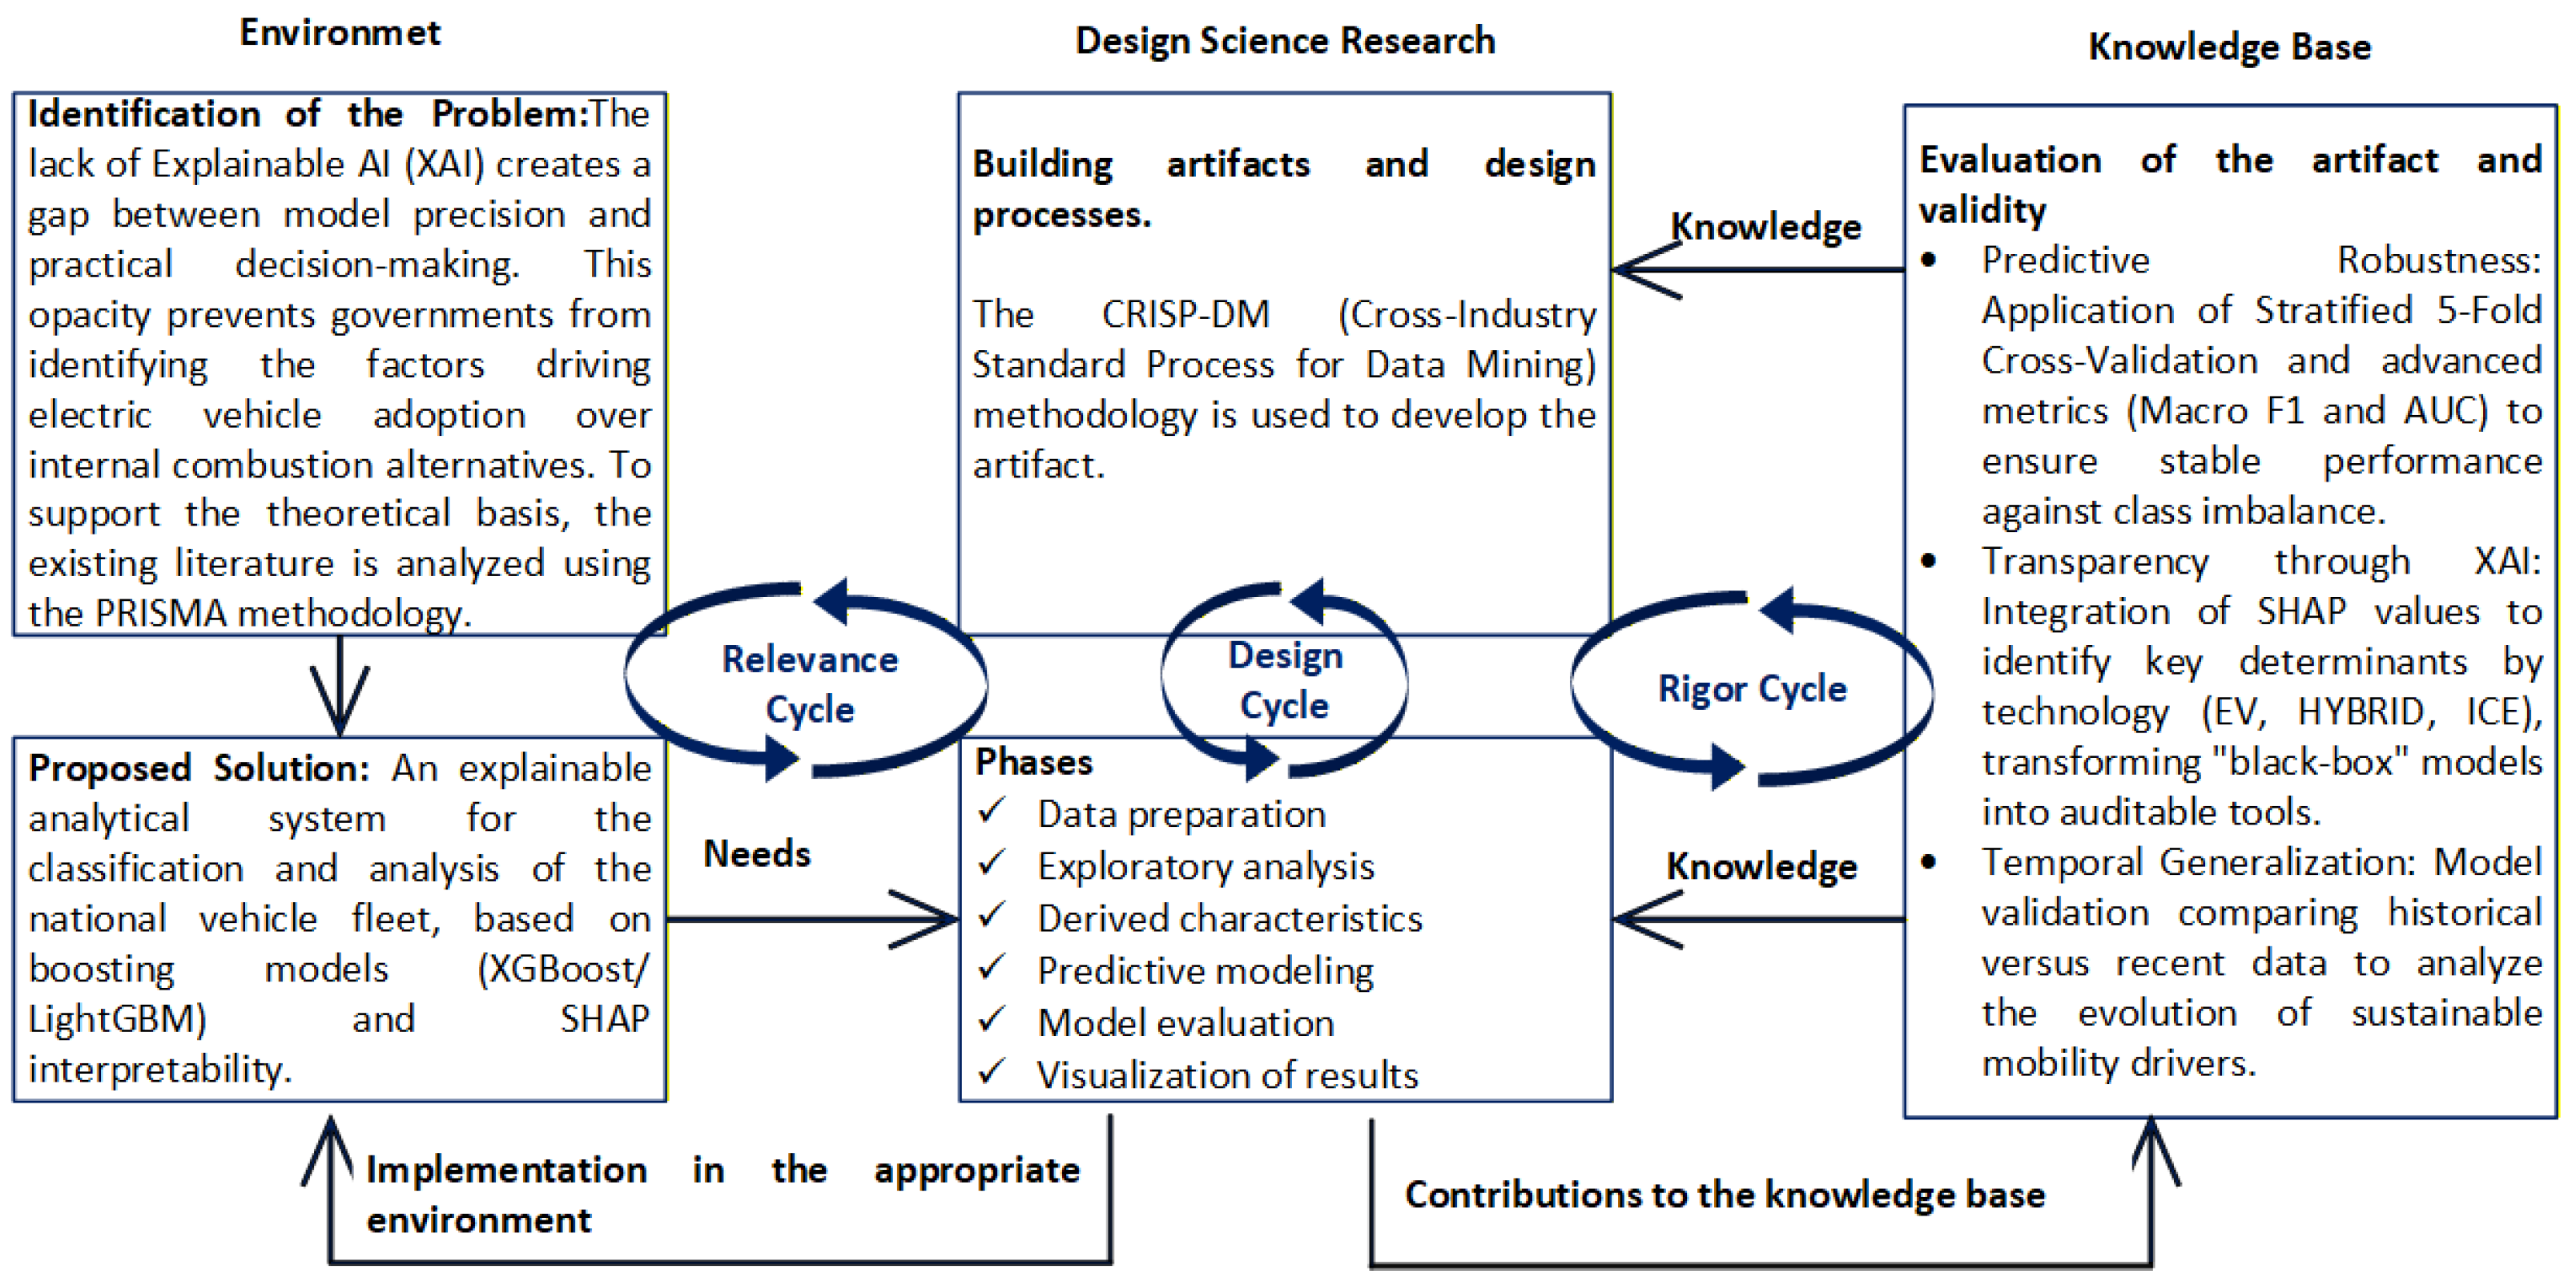
Under the Design Science Research (DSR) paradigm, this study proposes an explainable predictive classification system for vehicle fleet analysis, integrating XGBoost and LightGBM models with SHAP-based interpretability. The artifact is developed in three phases: the relevance phase, which addresses the gap between predictive accuracy and practical utility in the adoption of electric vehicles versus internal combustion vehicles; the design phase, focused on algorithm optimization and comparison; and the rigor phase, which ensures statistical validity and transforms “black box” models into auditable tools for decision-making in sustainable mobility policies (see
Figure 2).
3.1. Relevance Phase: Problem Identification and Systematic Review
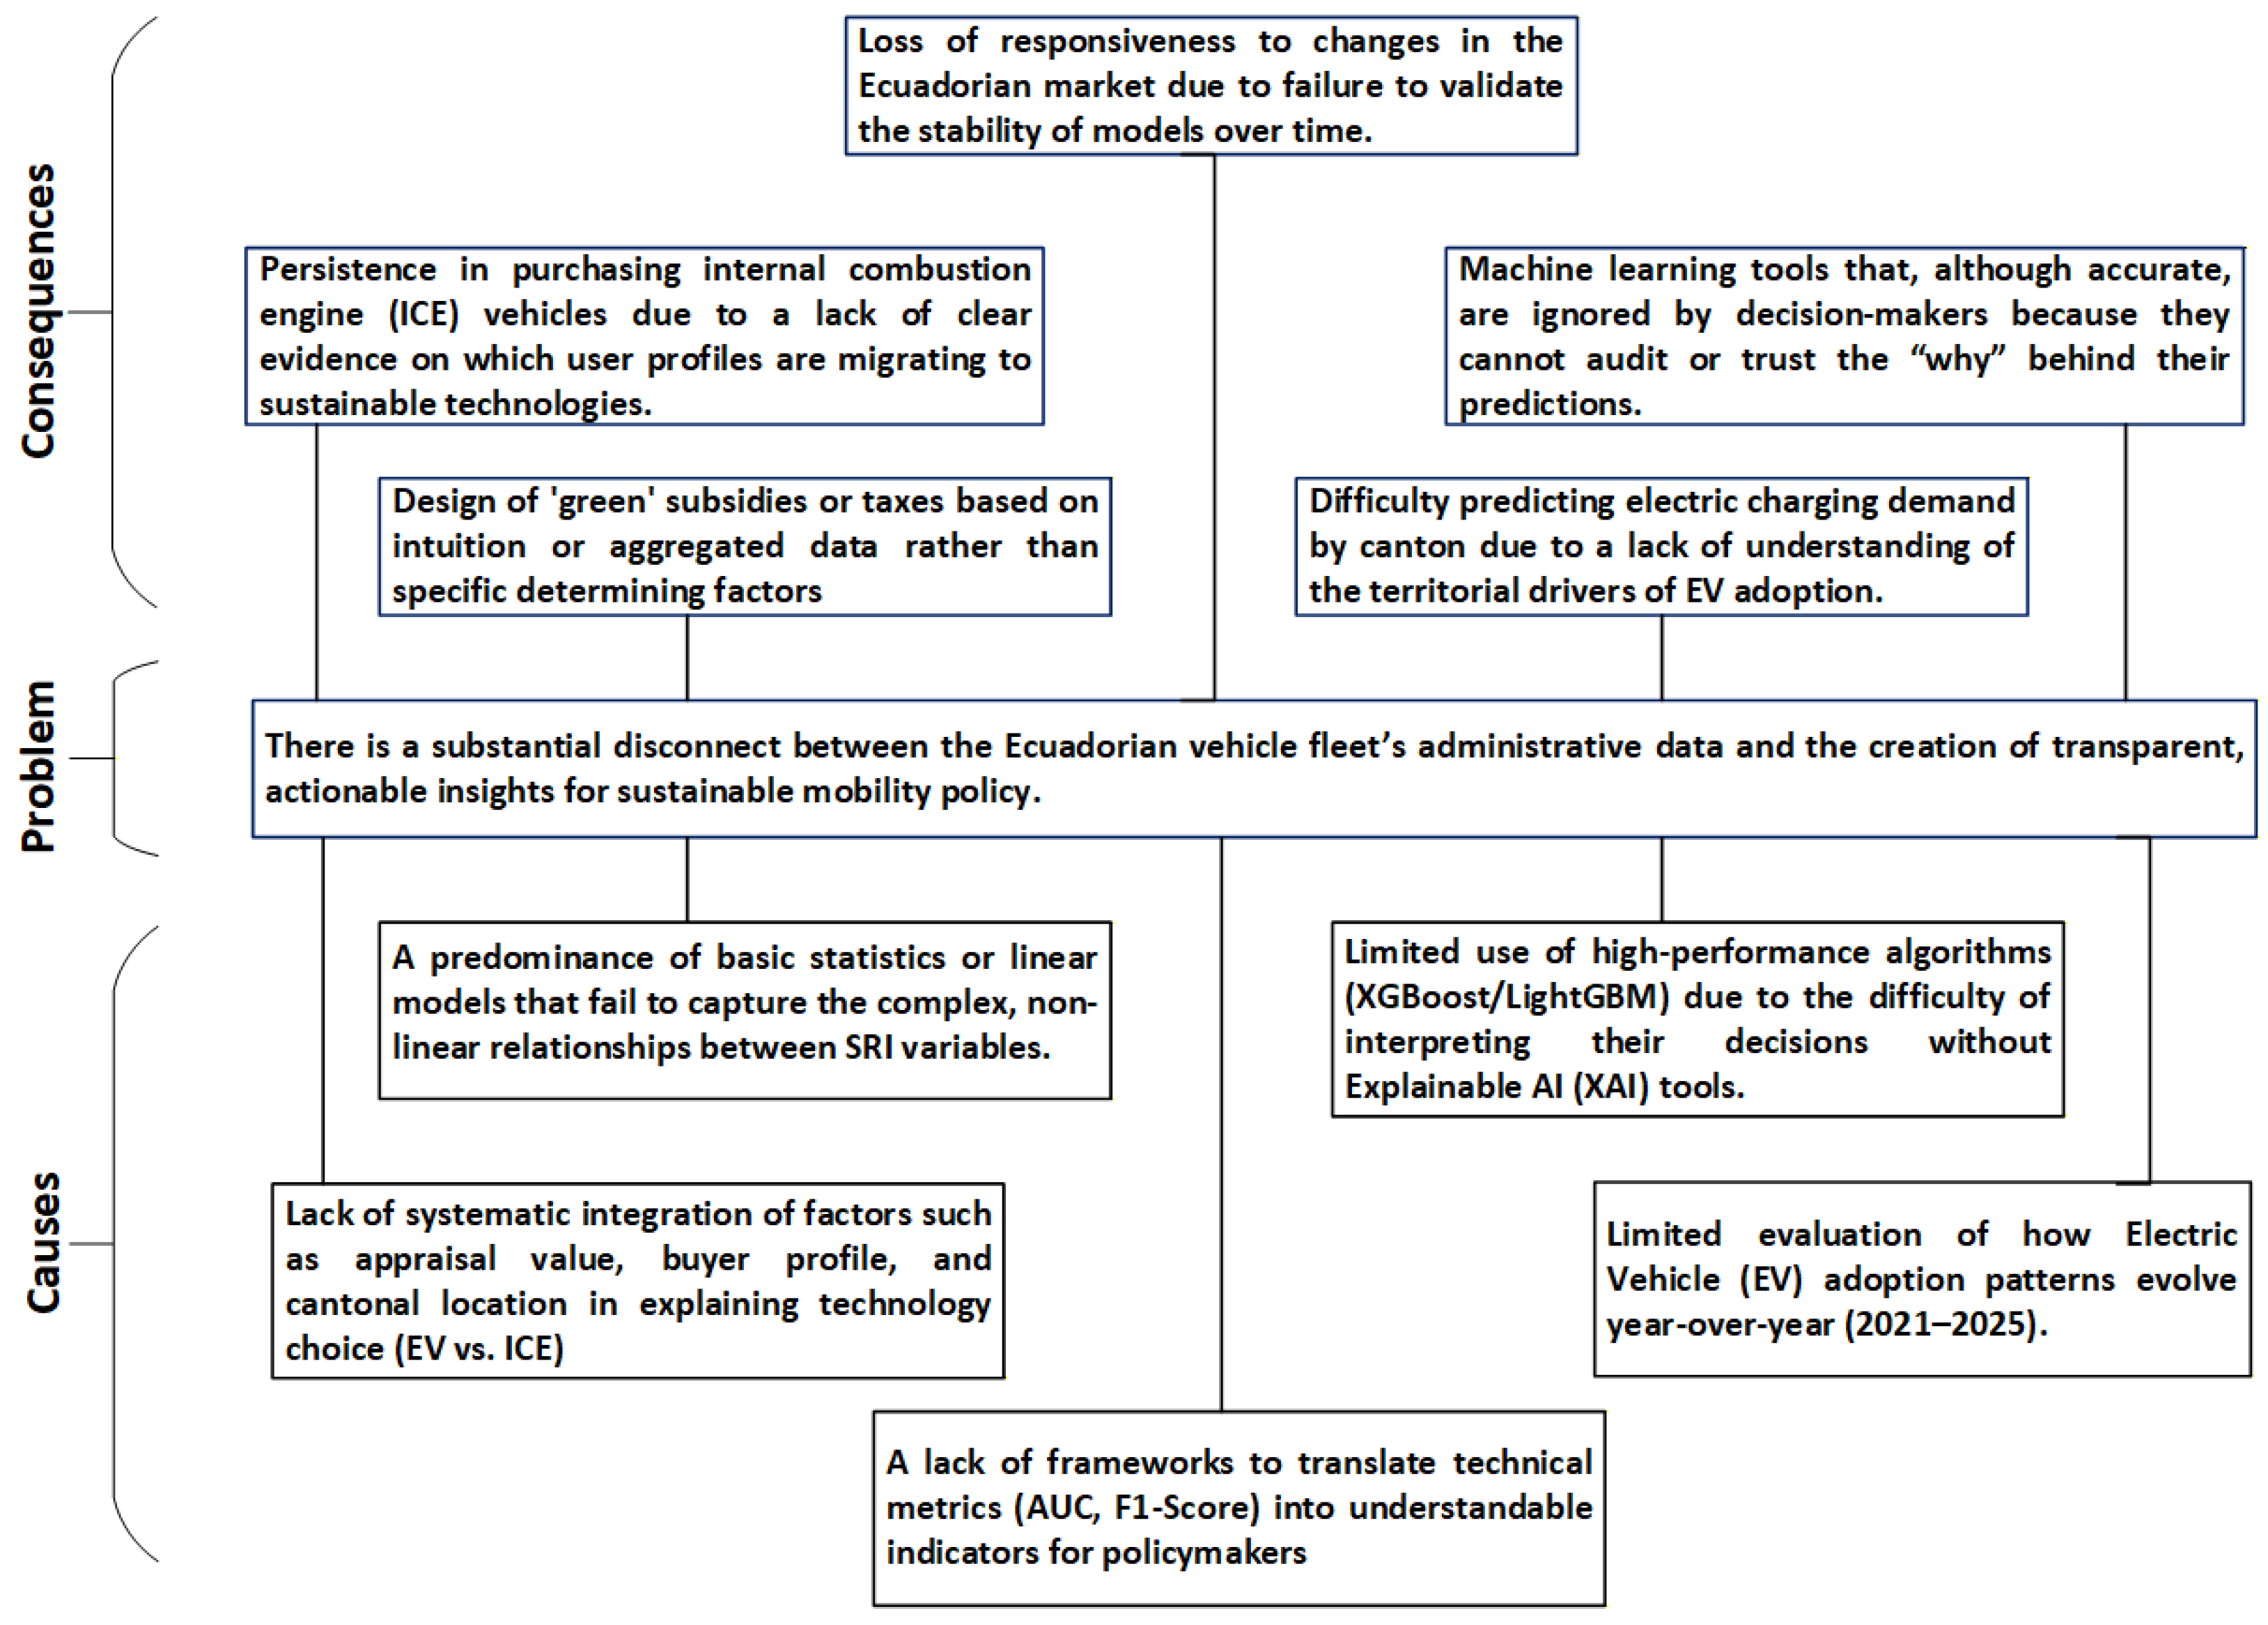
Despite the availability of detailed administrative data on the Ecuadorian vehicle fleet, a significant gap is identified between the use of advanced predictive models and their interpretability for analyzing sustainable vehicle technology adoption. In particular, there is a lack of an explanatory framework that allows for comparing electric, hybrid, and internal combustion vehicles, evaluating the temporal robustness of such models, and translating their results into actionable evidence for public policy design in Ecuador (see
Figure 3).
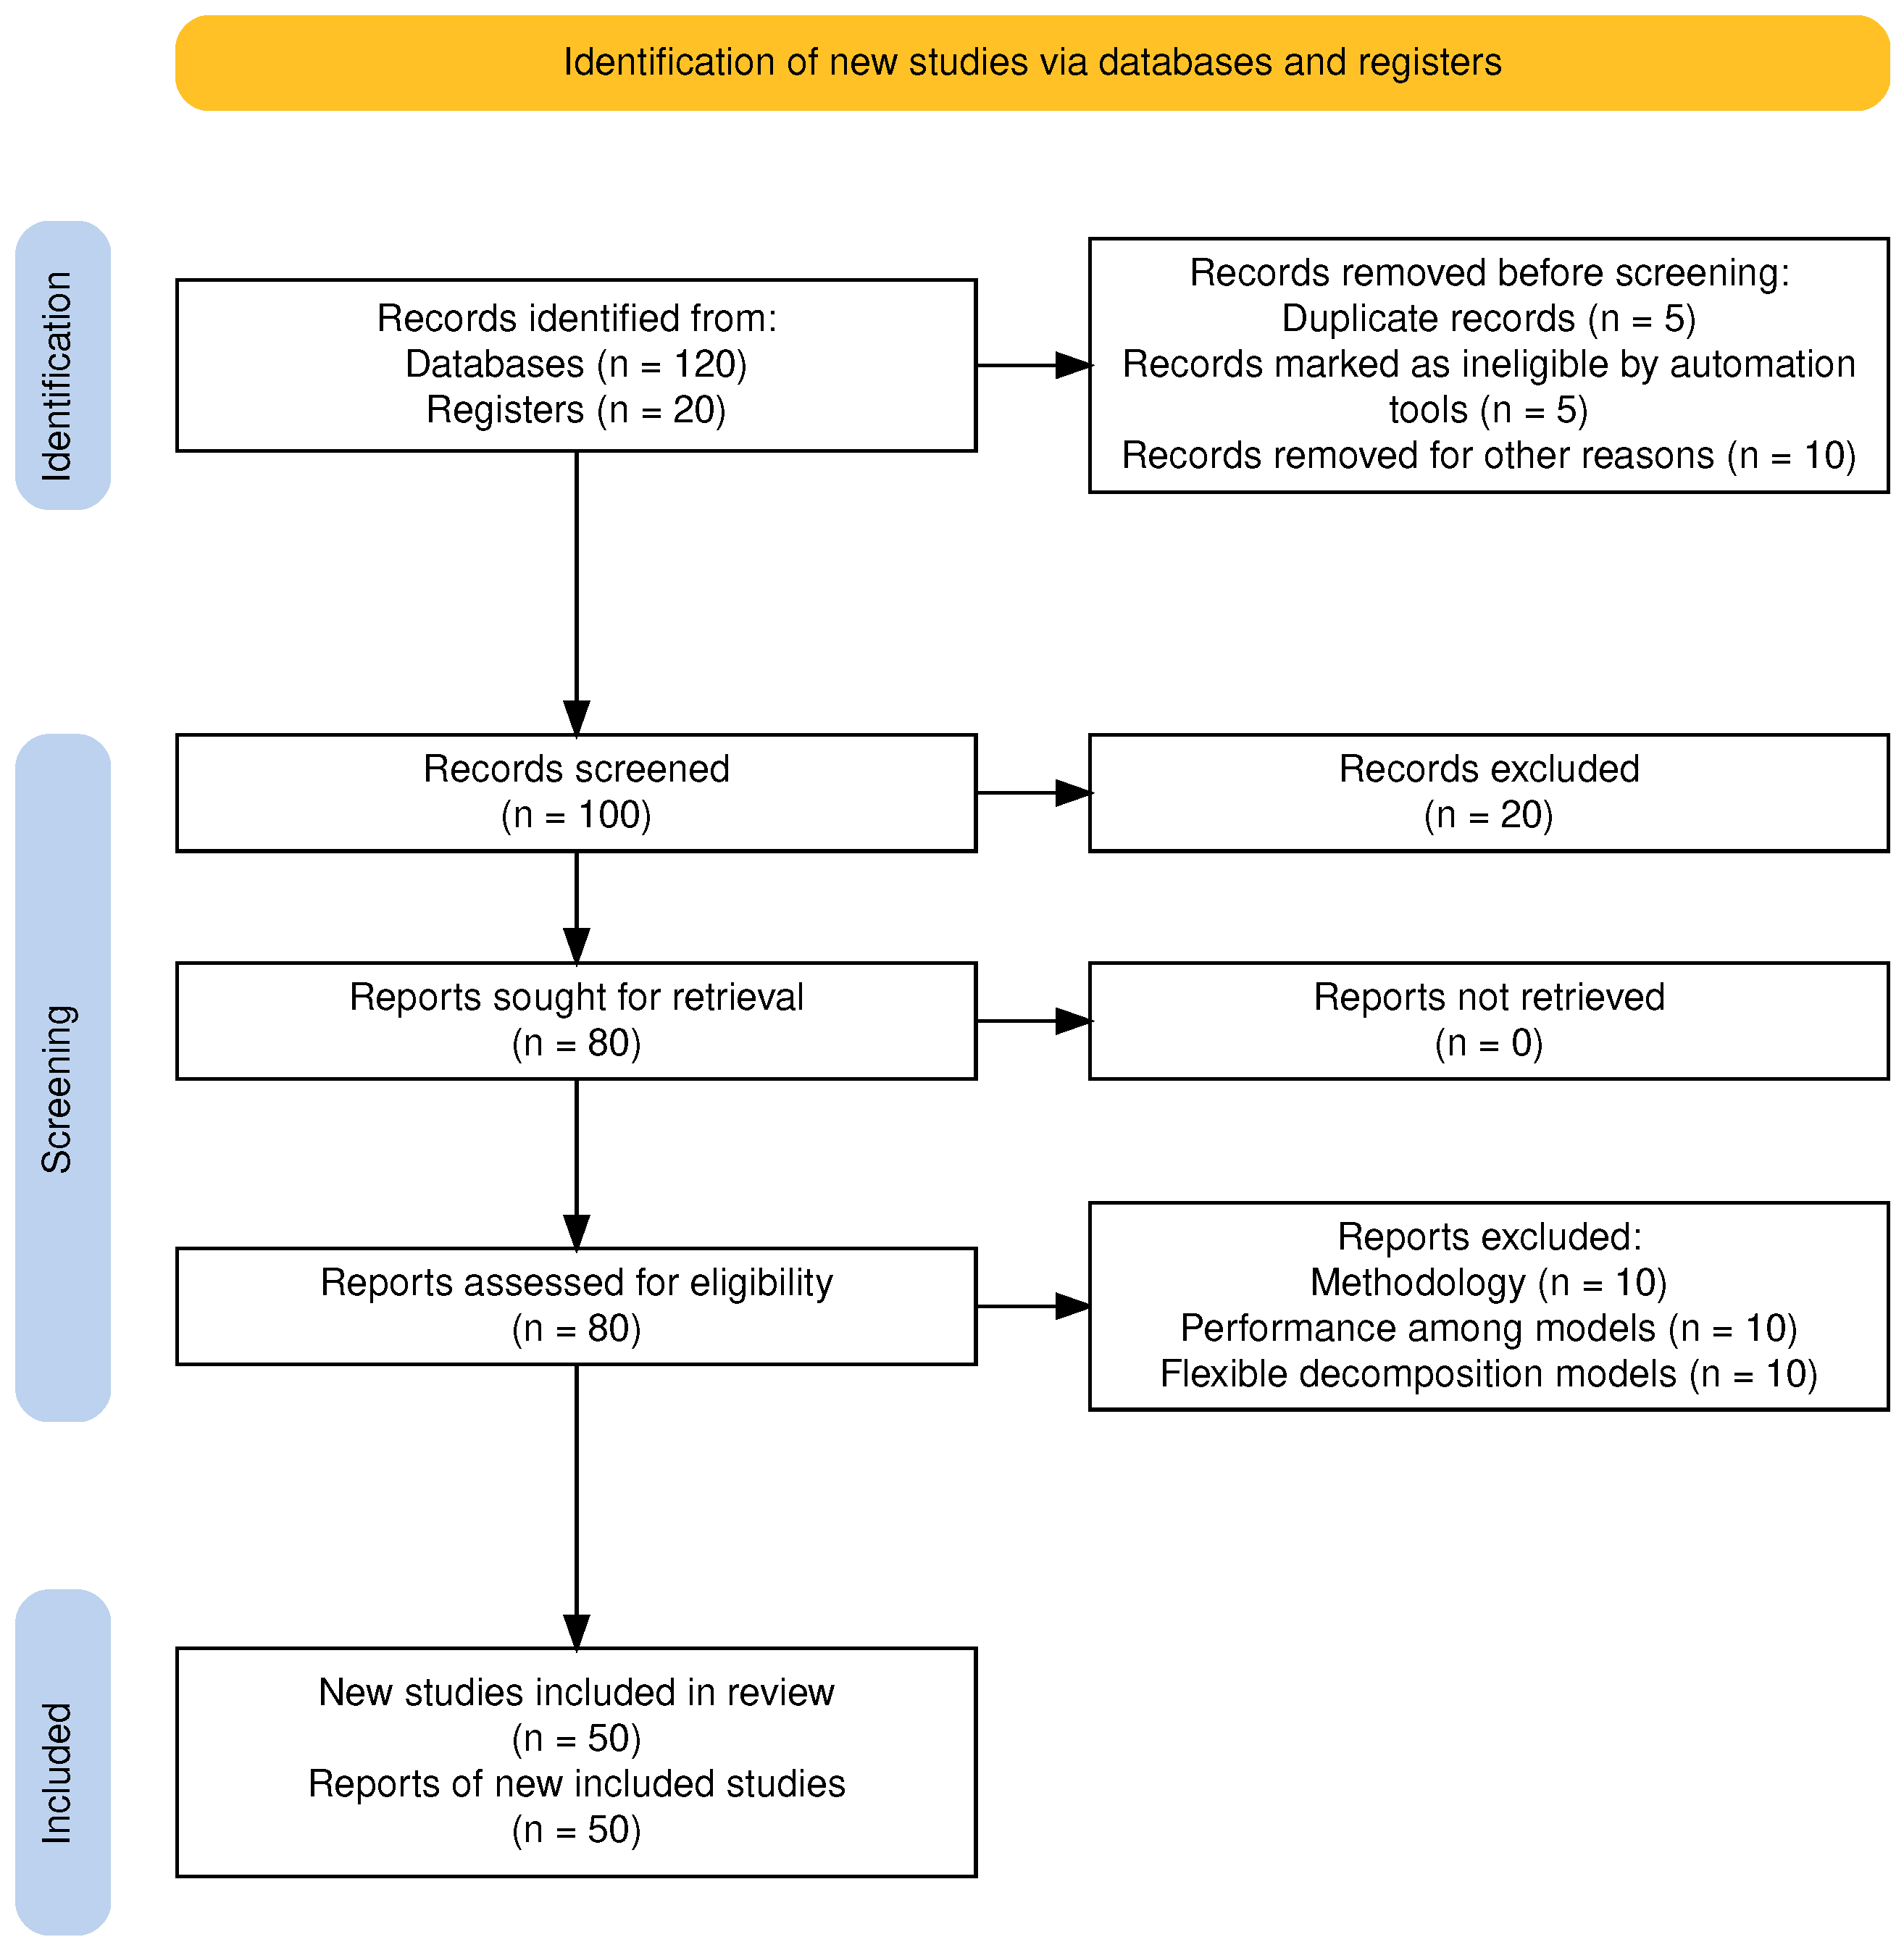
To substantiate this gap, a systematic literature review was conducted following the PRISMA methodology, the results of which were presented in the Background section (
Table 2, and
Figure 1). This review allowed for: (1) identifying the state of the art in the application of boosting models and XAI in mobility analysis; (2) documenting the absence of studies that integrate temporal validation and technology-class explainability in emerging markets; and (3) justifying the need for a methodological framework that combines predictive rigor with interpretative transparency.
3.2. Design Phase: Implementation Using CRISP-DM
This study adopts the CRISP-DM (Cross-Industry Standard Process for Data Mining) methodology as a systematic framework to design, build, and validate the proposed explanatory analytical artifact. CRISP-DM is particularly suitable for applied research in data science, as it allows for the integration of domain objectives, predictive modeling, explainability, and empirical validation in an iterative and reproducible manner. The integration of PRISMA and CRISP-DM is organic: while PRISMA provides the theoretical foundation and systematic identification of research gaps (relevance phase), CRISP-DM structures the data mining process to address these gaps through a standardized workflow (design phase).
Figure 3.
Design Science Research (DSR) Framework for the Development of an Explainable Vehicle Fleet Classification System.
Figure 3.
Design Science Research (DSR) Framework for the Development of an Explainable Vehicle Fleet Classification System.
In this study, the dependent variable corresponds to vehicle fuel technology, derived from the administrative variable FUEL TYPE. The classification problem is defined with three classes: electric vehicles (EV), hybrid vehicles (HYBRID), and internal combustion engine vehicles (ICE).
The independent variables include fiscal appraisal value (APPRAISAL), model year (MODEL YEAR), vehicle manufacturer (MAKE), country of origin (COUNTRY), vehicle class and subclass (CLASS, SUB CLASS), vehicle type (TYPE), transaction type (TRANSACTION TYPE), canton-level registration location (CATEGORY), engine displacement (ENGINE SIZE), and buyer type (NATURAL PERSON–LEGAL ENTITY).
3.2.1. Business Understanding
The main objective of this study is to analyze and explain the patterns of technological adoption in the national vehicle fleet of Ecuador, distinguishing between three vehicle categories: Electric Vehicles (EV), Hybrid Vehicles (HYBRID), and Internal Combustion Vehicles (ICE). The dependent variable is, therefore, the vehicle’s fuel category (FUEL_TYPE), a nominal categorical variable with three classes.
3.2.2. Data Understanding
The dataset used comprises 482,754 administrative records from the Internal Revenue Service of Ecuador (SRI, 2025), corresponding to vehicles registered nationwide. The available variables are described in
Table 3.
The distribution of the dependent variable reveals a severe class imbalance: internal combustion vehicles represent 93.2% (449,937 observations), hybrid vehicles 5.5% (26,372 observations), and electric vehicles only 1.3% (6445 observations). This imbalance does not constitute a statistical artifact but rather a structural characteristic of the Ecuadorian transportation system, which reinforces the relevance of this study for public policy analysis in emerging electromobility markets.
3.2.3. Data Preparation
Preprocessing included: (1) one-hot encoding for nominal categorical variables; (2) imputation of missing values using the median for numerical variables and the mode for categorical variables (missing rate less than 2%); (3) scaling of numerical variables through standardization (mean = 0, standard deviation = 1); and (4) stratified partitioning maintaining the class proportions in the training and test sets.
3.2.4. Modeling
Two gradient boosting algorithms were implemented: XGBoost and LightGBM. For both models, the learned decision function takes the form:
where class probabilities are estimated via additive boosting:
with
denoting a decision tree and
the learning rate.
The loss function for multiclass classification is the categorical log-loss:
Hyperparameters were optimized through grid search with 5-fold stratified cross-validation.
3.2.5. Evaluation
Model performance was evaluated using 5-fold stratified cross-validation, ensuring:
Performance metrics included the following:
To further examine the unusually high predictive performance observed in the models, a set of diagnostic analyses was incorporated into the evaluation phase to exclude the possibility of deterministic separability or implicit data leakage. Furthermore, to ensure robustness under the severe class imbalance (
), we report class-specific recall and precision for the EV class, as well as the Precision–Recall Area Under the Curve (PR-AUC) and the Matthews Correlation Coefficient (MCC), which are more informative under asymmetric distributions [
38,
39]. These tests included:
Precision-Recall AUC for Minority Class: The PR-AUC was calculated specifically for the Electric Vehicle (EV) class. Unlike the standard ROC-AUC, PR-AUC is sensitive to false positives and provides a more informative assessment of performance in imbalanced scenarios.
Matthews Correlation Coefficient (MCC): MCC provides a single metric that summarizes the quality of a binary classification, taking into account all four categories of the confusion matrix (). It is widely regarded as a balanced measure even when classes are of very different sizes.
Permutation Importance Stability Test: This test measures the drop in model performance when the values of a single feature are randomly shuffled. A catastrophic drop upon shuffling a key feature would confirm its dominant, non-redundant role and help identify if predictions are pathologically dependent on a single variable.
Class-Conditional Distribution Overlap: The distribution overlap for key numerical features, particularly ENGINE_SIZE, was analyzed across the three vehicle classes. Perfect or near-perfect separation in the feature space would explain high predictive performance as a reflection of inherent data structure rather than a statistical artifact.
Attribute-Based Distribution Shift Test: To evaluate model robustness under structural changes in vehicle attributes, a distribution-based split using
MODEL_YEAR quantiles was applied:
This procedure does not constitute a genuine chronological forecasting exercise. Instead, the split evaluates model robustness under shifts in the distribution of vehicle attributes associated with newer vehicle generations. Since MODEL_YEAR represents a structural vehicle attribute rather than a temporal observation index, the resulting experiment should be interpreted as a distribution-shift robustness test rather than a genuine out-of-time validation.
Baseline Model Comparison: To contextualize the performance of the gradient boosting models, two baseline classifiers were implemented and evaluated using the same 5-fold stratified cross-validation procedure:
Multinomial Logistic Regression: A linear model serving as a classical statistical benchmark.
Random Forest: An ensemble method that, while capable of capturing non-linearities, is often less prone to overfitting on small disjuncts in imbalanced data compared to boosting algorithms.
Both baselines were trained with default scikit-learn parameters and with class_weight=’balanced’ to account for the class imbalance. Their performance, particularly on the EV minority class, provides a necessary reference point for assessing the relative gain and potential over-specialization of the XGBoost and LightGBM models.
Confusion Matrices: Confusion matrices were generated for each cross-validation fold and for the attribute-based distribution shift test, allowing detailed error analysis by class. Normalized confusion matrices were also produced to facilitate the comparison of error rates across classes with vastly different frequencies.
3.2.6. Deployment and Interpretation
Model interpretability was achieved through SHAP (SHapley Additive exPlanations) values, where the contribution of feature
j is defined as:
This approach enabled:
Class-specific explanations (EV, HYBRID, ICE);
Differential comparisons between vehicle technologies;
Identification of variables potentially relevant for public policy analysis.
3.3. Rigor Phase: Technical Validation
To ensure that the developed artificial intelligence system is not only accurate but also interpretable, robust, and applicable to public policies, a technical validation process structured around six strategic pillars was implemented:
Predictive Performance and Bias Robustness under Class Imbalance: Stratified 5-fold cross-validation with the Macro F1 metric was employed to ensure a balanced measurement unbiased by majority classes. This approach maintains the original class distribution across all folds, preventing performance inflation that could arise from imbalanced splits and ensuring that the evaluation reflects model behavior across all vehicle technologies, particularly the minority EV class ( of observations).
Technological Differentiation and Semantic Coherence: To verify that the model-derived associations for EV adoption are qualitatively distinct from those of ICE, the Kullback-Leibler (KL) divergence was computed between the normalized feature importance distributions of each class. The KL divergence is defined as:
where
P and
Q represent the probability distributions of feature importance (normalized to sum to 1) for two different vehicle technologies. This information-theoretic measure quantifies the dissimilarity between distributions, with higher values indicating greater technological differentiation in the model’s internal representations. The use of KL divergence for comparing importance distributions follows established practices in model interpretability validation [
40].
Algorithmic Explainability and Transparency: The integration of SHAP allowed for complete auditing of model decisions, enabling class-specific decomposition of predictions and identification of the most influential features for each vehicle technology.
Attribute Distribution Stability and External Validity: Robustness was quantified using a feature importance stability index comparing importance patterns derived from historical vehicle cohorts (pre-2026) versus more recent models (post-2026). This approach evaluates whether the statistical contribution patterns learned by the model remain stable under shifts in the underlying attribute distribution, providing evidence of generalizability to newer vehicle generations [
41].
Relevance for Public Policy Design: The Mean Absolute Impact (MAI) of each feature was calculated as quantitative evidence for the design of fiscal incentives. MAI represents the average magnitude of a feature’s contribution to the model’s predictions across all observations, serving as a potential policy-relevant correlate for identifying variables with consistent influence on vehicle technology classification.
Scientific Reproducibility: Traceability was ensured through standardized code, comprehensive documentation, and deterministic randomness control with fixed random seeds (RANDOM_STATE = 42), ensuring that all experiments can be replicated exactly.
3.4. Methodological Contribution
This study does not propose a novel gradient boosting architecture nor a new explainability algorithm. XGBoost, LightGBM, and SHAP are well-established techniques with extensive validation in the literature. Therefore, the contribution of this research does not lie in algorithmic innovation, but rather in the structured methodological integration and evaluation framework developed for national-scale administrative transport data under extreme class imbalance conditions.
The primary methodological contribution consists of five interrelated components:
Class-Specific Explainability under Extreme Imbalance: Unlike conventional applications that report global feature importance, this study implements class-conditional SHAP analysis for EV, HYBRID, and ICE categories separately. This enables a differentiated interpretative structure that avoids aggregation bias in multiclass settings with asymmetric distributions (EV = 1.3%).
Imbalance-Sensitive Evaluation Framework: Beyond overall accuracy and Macro F1-score, the framework incorporates balanced accuracy and class-level diagnostics, explicitly addressing predictive stability under highly skewed outcome distributions typical of emerging electromobility markets.
Distribution-Shift Robustness Testing: Instead of claiming strict chronological forecasting, the study introduces an attribute-based distribution shift evaluation using model year quantile splits. This allows the assessment of predictive consistency under structural changes in fleet composition.
Cross-Model Stability of Explanatory Structures: The interpretative outputs of XGBoost and LightGBM are systematically compared using divergence-based measures of feature importance distributions. This provides an additional validation layer beyond predictive equivalence, focusing on semantic consistency of explanations.
Policy-Relevant Interpretability with Explicit Epistemic Boundaries: The study explicitly distinguishes between statistical contribution within the predictive model and structural causal inference. SHAP values are interpreted as model-derived contribution scores rather than causal determinants, thereby maintaining epistemological rigor in policy translation.
Taken together, these elements position the study as a methodological framework contribution rather than an algorithmic one. The novelty resides in the systematic integration of predictive robustness, imbalance-aware evaluation, explanatory stability, and policy-oriented interpretability within a unified and reproducible design science structure applied to national vehicle fleet data.
4. Results
4.1. Dataset Structure
The analysis is based on a database of 482,754 administrative records provided by the Internal Revenue Service of Ecuador (Servicio de Rentas Internas del Ecuador—SRI, 2025). The composition of the vehicle fleet, according to propulsion technology, is detailed in
Table 4, which reveals the predominant structure of the Ecuadorian vehicle market.
The table above shows that the Ecuadorian automotive market is overwhelmingly dominated by internal combustion vehicles. Electric vehicles, for their part, represent a marginal share of 1.3%. This marked imbalance constitutes a structural characteristic of the country’s transportation system and not a mere statistical artifact, establishing the context for the classification of emerging technologies. The analysis started from a set of 20 original columns, from which 11 key predictor features were selected and mapped for modeling, including variables such as appraisal value, model year, brand, engine size, and buyer type (natural person or legal entity), among others.
4.2. Predictive Performance
The implemented models, XGBoost and LightGBM, demonstrated very high predictive performance. Given the similarity in their performance metrics and to avoid redundancy, the consolidated results of the LightGBM model are reported in
Table 5, with the clarification that XGBoost showed equivalent patterns.
The high predictive performance observed in the models can be partially explained by structural separability within the dataset. Electric vehicles exhibit distinct technical characteristics compared to internal combustion vehicles, particularly in variables such as engine displacement and fiscal appraisal value. These structural differences generate well-defined decision boundaries that tree-based boosting models can effectively capture during the training process, contributing to the high classification accuracy observed in the evaluation metrics.
The Macro F1-score of
is particularly relevant given the severe class imbalance identified (minority class EV:
). To ensure a robust evaluation under this asymmetric distribution, we examined class-specific metrics and additional imbalance-sensitive scores, as detailed in
Table 6. The model achieved a precision of
and a recall of
for the EV class, resulting in an F1-score of
. The Precision–Recall Area Under the Curve (PR-AUC) for the EV class was
, and the Matthews Correlation Coefficient (MCC) was
, confirming that the high performance is consistent across all evaluation dimensions and is not merely an artifact of the majority class (see
Table 6).
To contextualize these results,
Table 7 presents a comparison against baseline models. Both Multinomial Logistic Regression and Random Forest, even with balanced class weights, achieved significantly lower performance on the EV class (F1-score < 0.85), highlighting the superior capability of gradient boosting models to capture the complex patterns defining the minority class without sacrificing predictive accuracy for the majority.
To further assess the possibility of data leakage, additional analyses were performed:
It was confirmed that all predictor variables are available at the time of prediction (initial vehicle registration);
It was verified that no variables were derived from the target variable;
Feature distributions were compared between the training and test sets, finding no systematic differences.
The diagnostic tests introduced in
Section 3.2.5 were also applied, the results of which are discussed below.
4.3. Confusion Matrices
The confusion matrices provide a detailed breakdown of the classification performance across the three vehicle technologies.
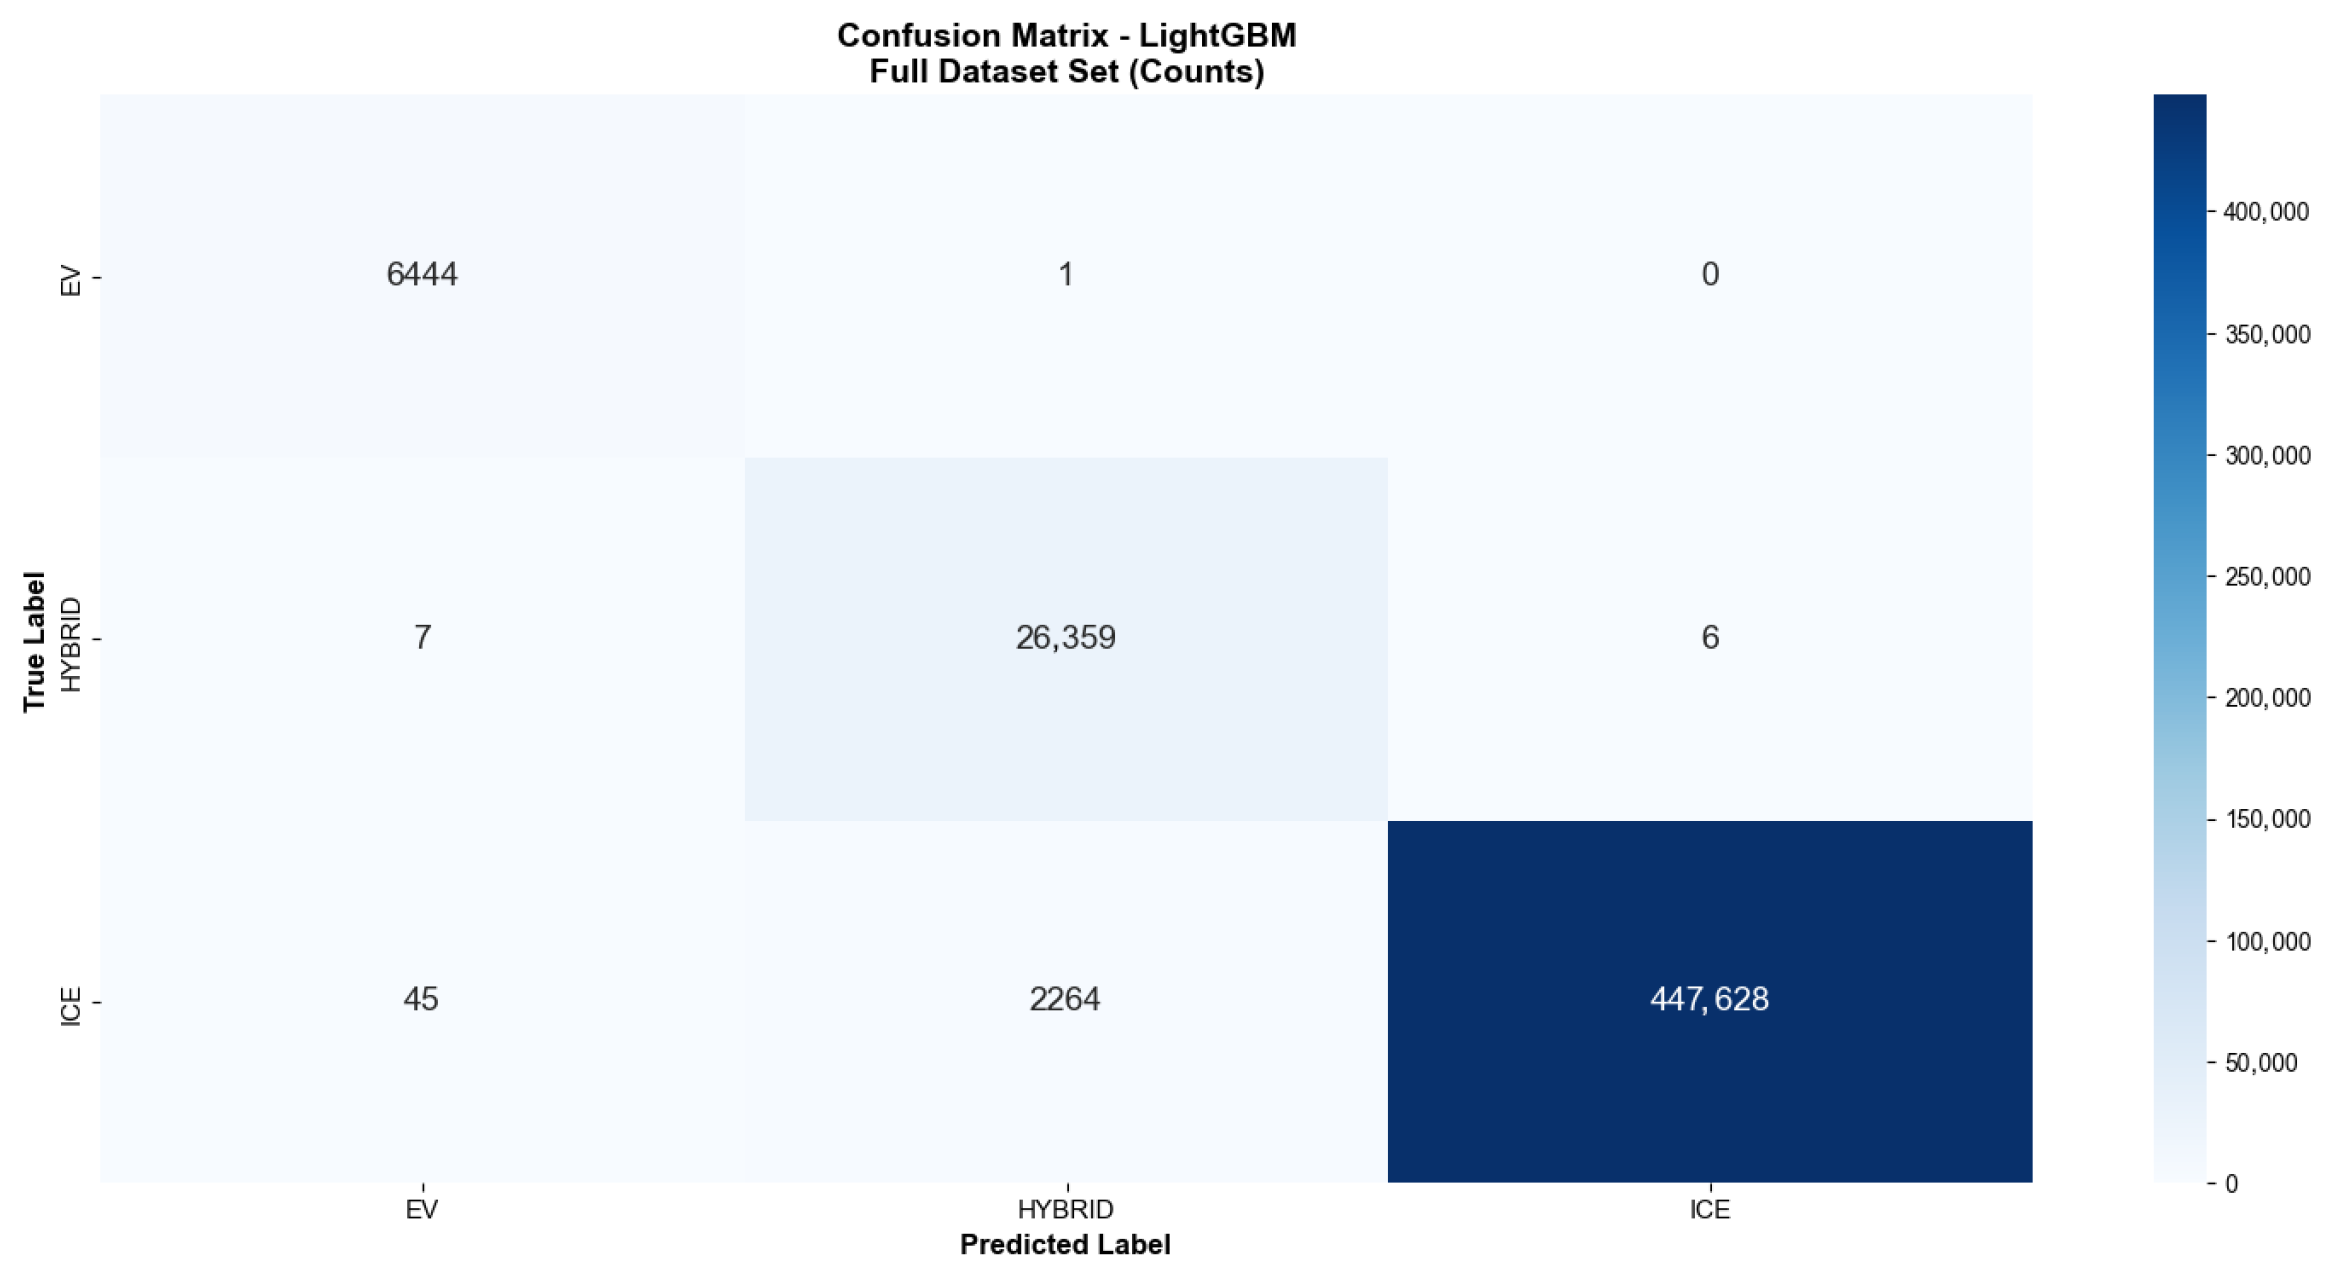
Table 8 presents the consolidated confusion matrix for the LightGBM model on the full dataset, showing the raw counts of correct and incorrect predictions.
The confusion matrix reveals that classification errors are minimal and exhibit an interesting pattern. A total of 2264 internal combustion vehicles were misclassified as hybrids, representing the largest source of error. Conversely, electric vehicles demonstrate remarkable classification purity, with 6444 out of 6445 EVs correctly identified and only one misclassification as a hybrid. This indicates that the model has learned highly distinctive patterns for electric vehicle technology.
Figure 4 provides a visual representation of the confusion matrix, where the color intensity corresponds to the number of observations in each cell, facilitating the identification of error patterns.
To better understand the relative performance across classes,
Table 9 presents the normalized confusion matrix, where each row sums to 100%, allowing for direct comparison of classification accuracy per class.
The normalized matrix confirms the high performance across all classes, with all three technologies achieving over 99% accuracy. The balanced accuracy per class, calculated from these values, yields:
EV: 0.9998;
HYBRID: 0.9995;
ICE: 0.9949.
It is important to note that the confusion between electric and hybrid vehicles (0.02% of EVs misclassified as hybrids and 0.03% of hybrids misclassified as EVs) is conceptually understandable given that both technologies share electrification characteristics. Notably, electric vehicles are never confused with internal combustion vehicles, confirming the model’s ability to learn robust distinctive patterns for this emerging technology.
To assess the model’s generalization capability over time, a temporal validation was performed using a split based on model year.
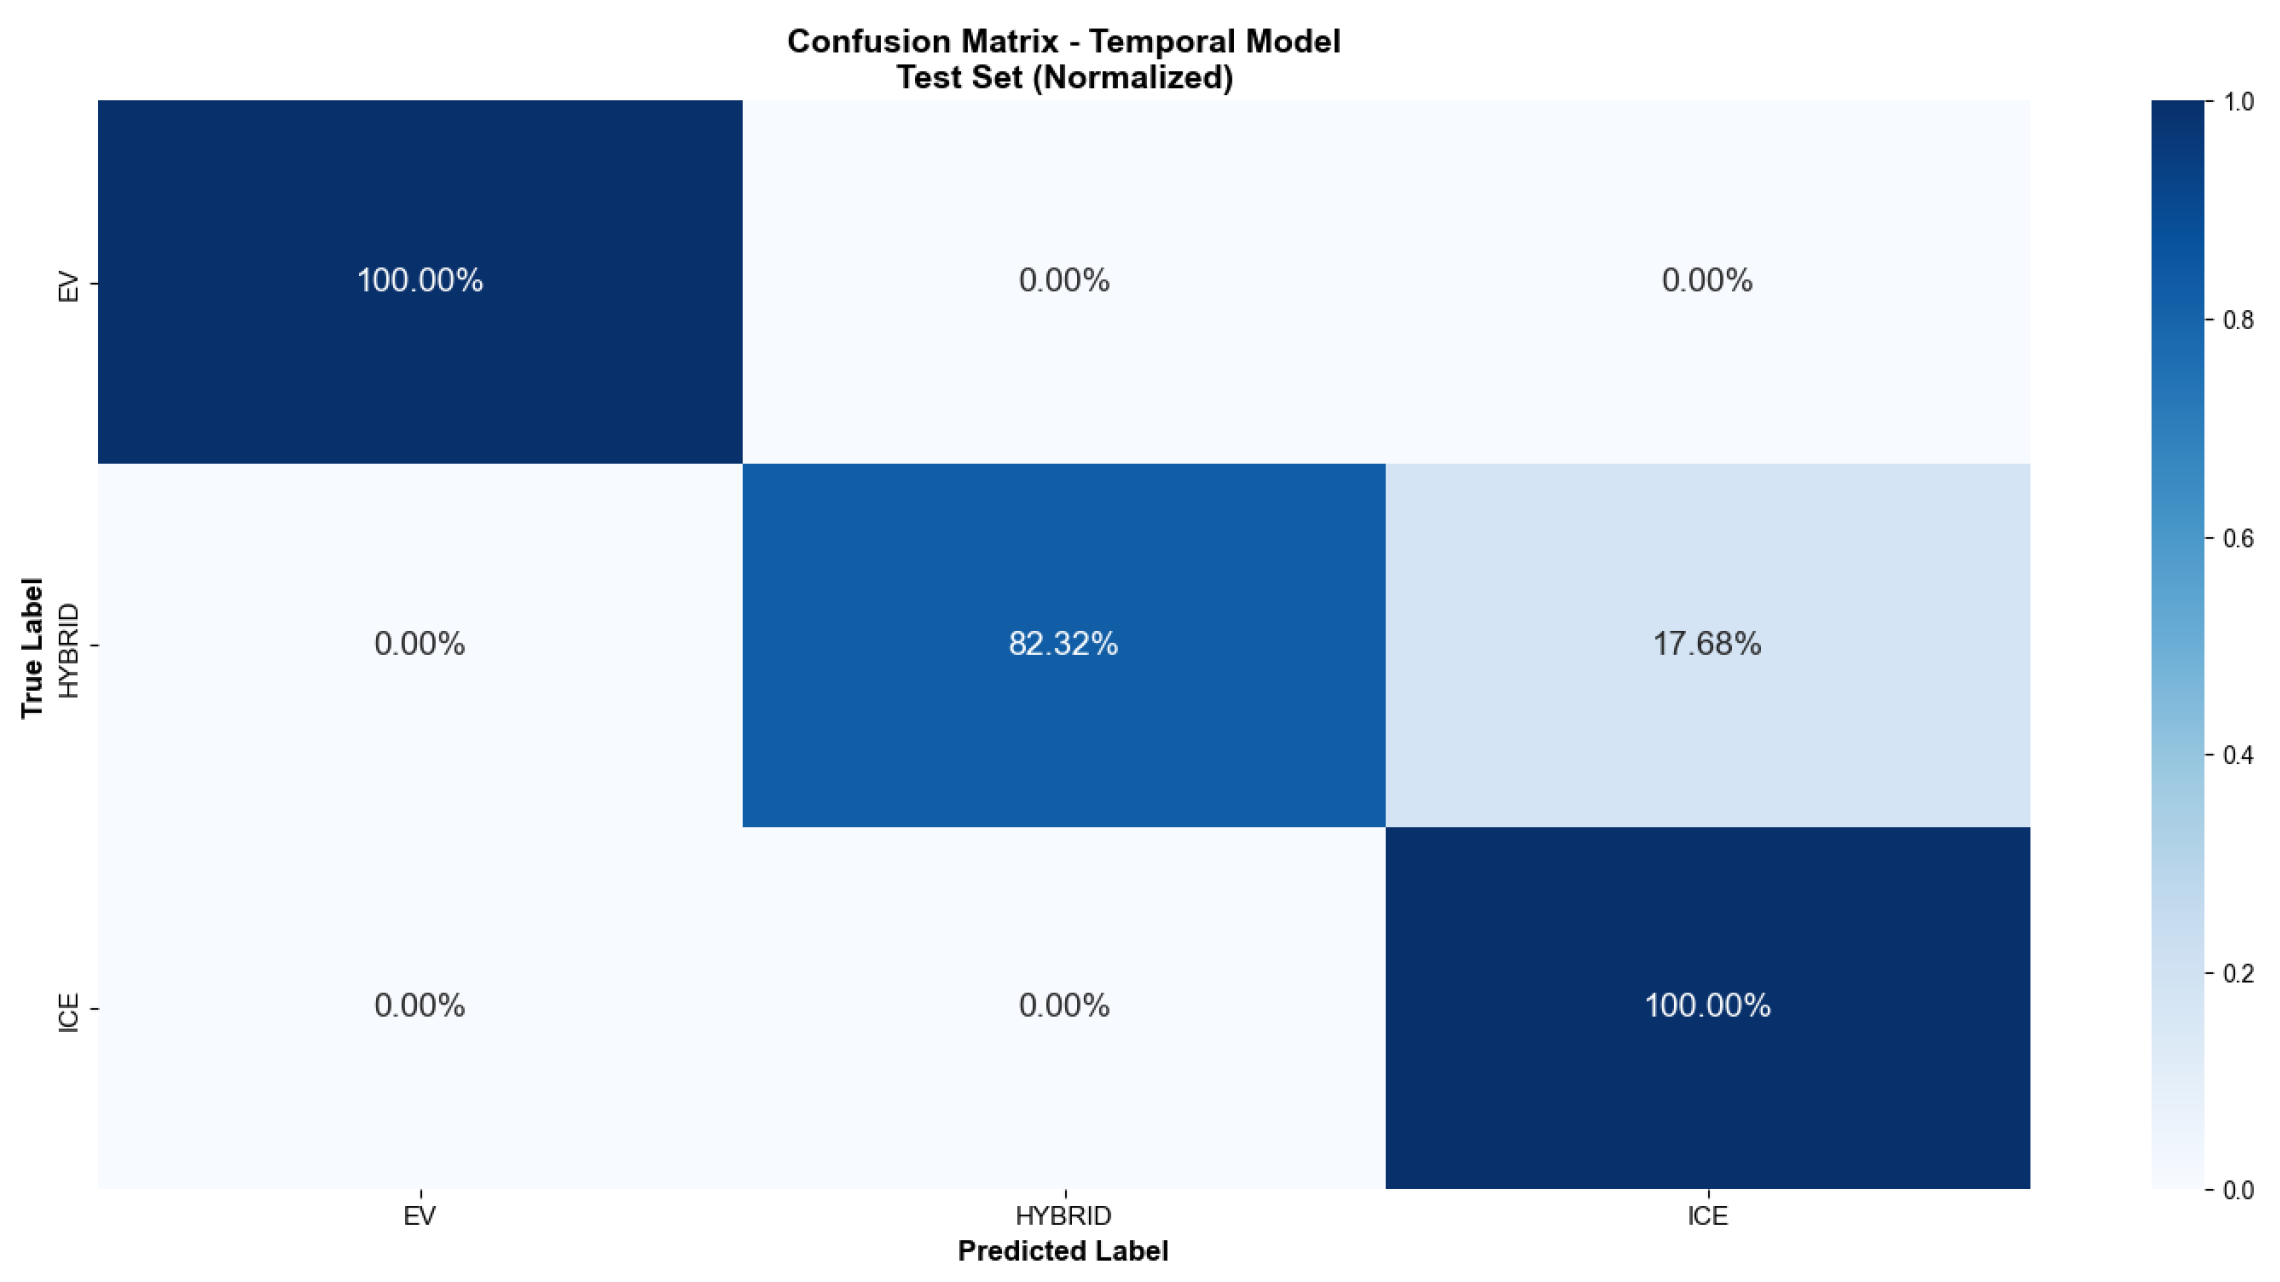
Figure 5 presents the confusion matrix for the temporal test set, which contains 707 vehicles from model years subsequent to the training period.
The temporal validation reveals interesting dynamics in classification performance. While electric and internal combustion vehicles maintain perfect classification accuracy (100%), hybrid vehicles show a more complex pattern, with 82.32% correctly classified and 17.68% misclassified as internal combustion vehicles. This suggests that the boundaries between hybrid and conventional technologies may be evolving over time, possibly reflecting changes in hybrid vehicle design or market positioning.
Table 10 provides the raw counts underlying the temporal validation, offering a detailed view of the classification decisions.
The temporal test set comprises 18 EVs, 164 hybrids, and 525 ICE vehicles. The perfect classification of EVs (18 correct) and ICE vehicles (525 correct) demonstrates the robustness of the model’s discriminative features for these technologies. The 29 hybrid vehicles misclassified as ICE represent an important area for further investigation, potentially indicating a convergence in the feature space between newer hybrid models and traditional internal combustion vehicles.
4.4. Explainability Analysis Using SHAP
To interpret the internal behavior of the predictive models, SHAP (SHapley Additive exPlanations) values were computed for each feature and class. It is important to emphasize that SHAP values quantify the internal contribution of features within the predictive model. Consequently, these values should be interpreted as model-derived associations rather than structural causal determinants of vehicle technology adoption. In this context, the reported importance patterns describe how the model uses the available attributes to generate predictions, not the causal mechanisms underlying consumer adoption decisions.
The analysis of SHAP values revealed a differentiated hierarchy of model-derived associations according to vehicle technology.
Table 11 presents the most influential variables for each class, measured by their mean absolute impact.
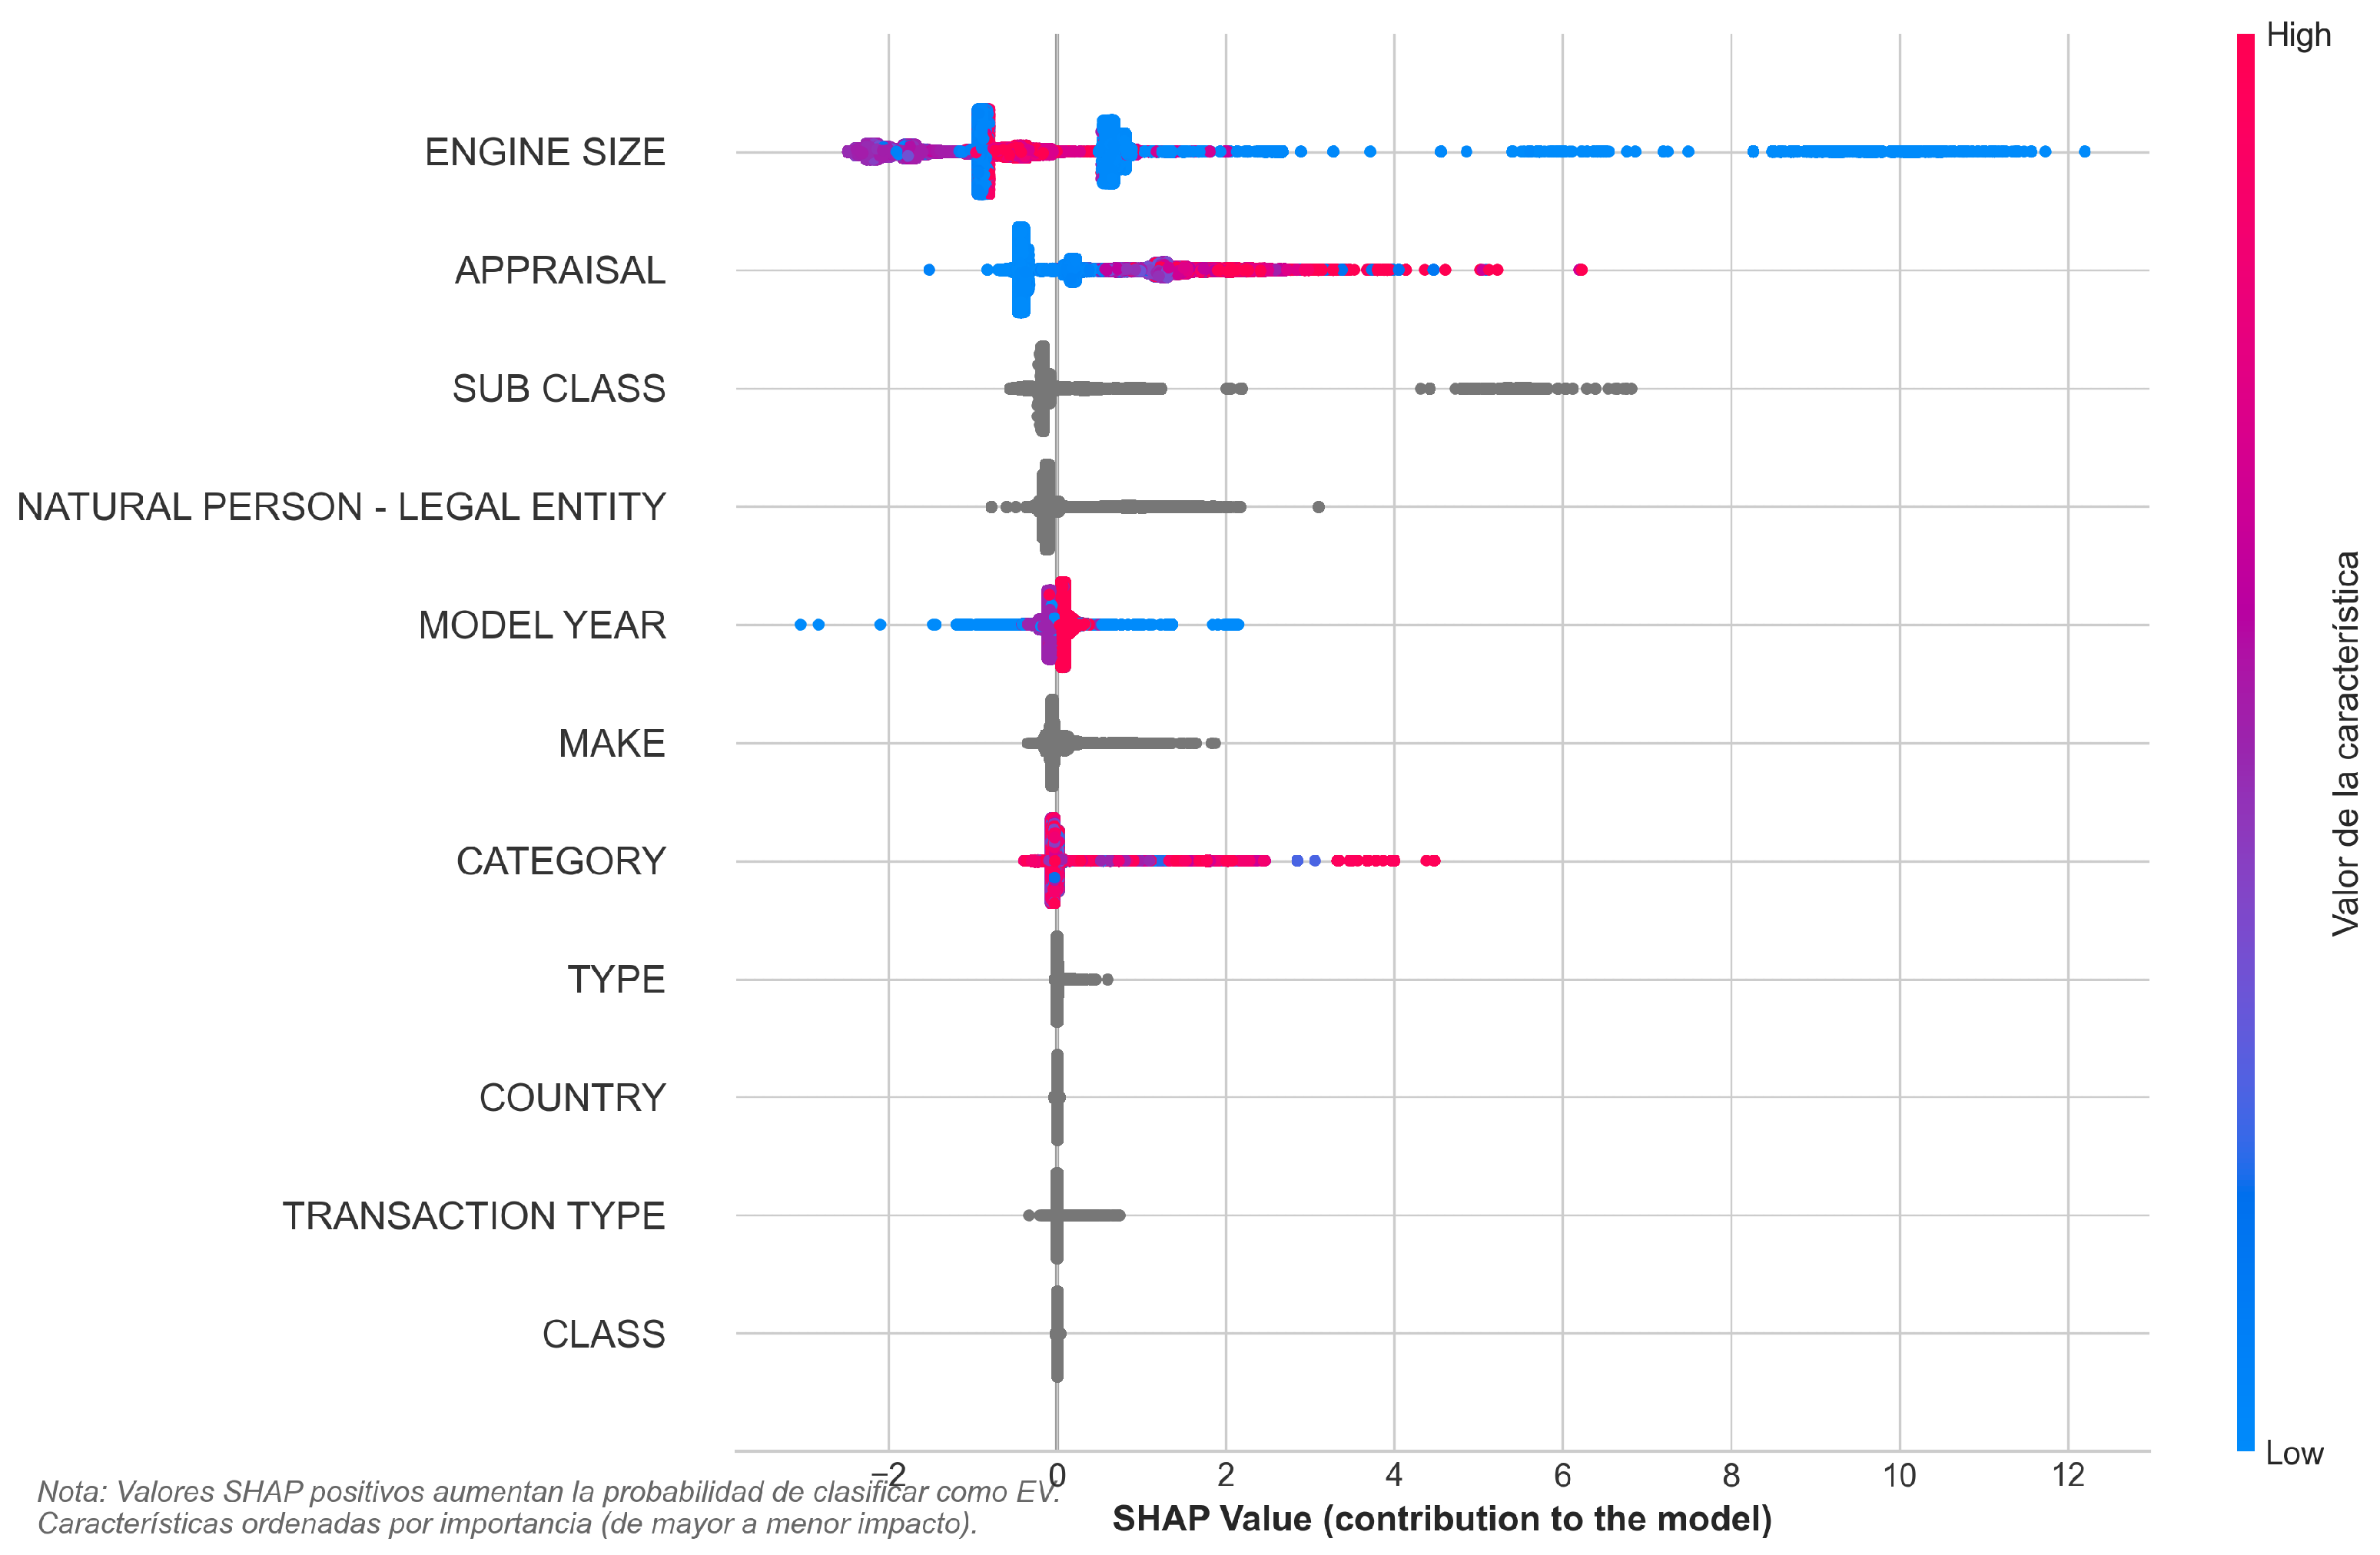
Figure 6 illustrates the contribution of the explanatory variables to the model’s probability of classifying vehicles as electric.
Figure 6 shows that engine size (
ENGINE_SIZE) is the most influential variable for predicting electric vehicles, where low values present positive SHAP contributions that significantly increase the model’s probability of EV classification. This result is consistent with the nature of electric vehicles, which lack an internal combustion engine. The fiscal appraisal value (
APPRAISAL) shows a relevant positive contribution, particularly for high values, suggesting a model-derived association between vehicles with higher market value and a greater probability of being classified as electric—reflecting the higher acquisition cost associated with this technology in the Ecuadorian market. Additionally, the buyer type (legal entity) emerges as a distinctive high-impact factor for EVs, indicating a potential policy-relevant correlate related to corporate purchasing.
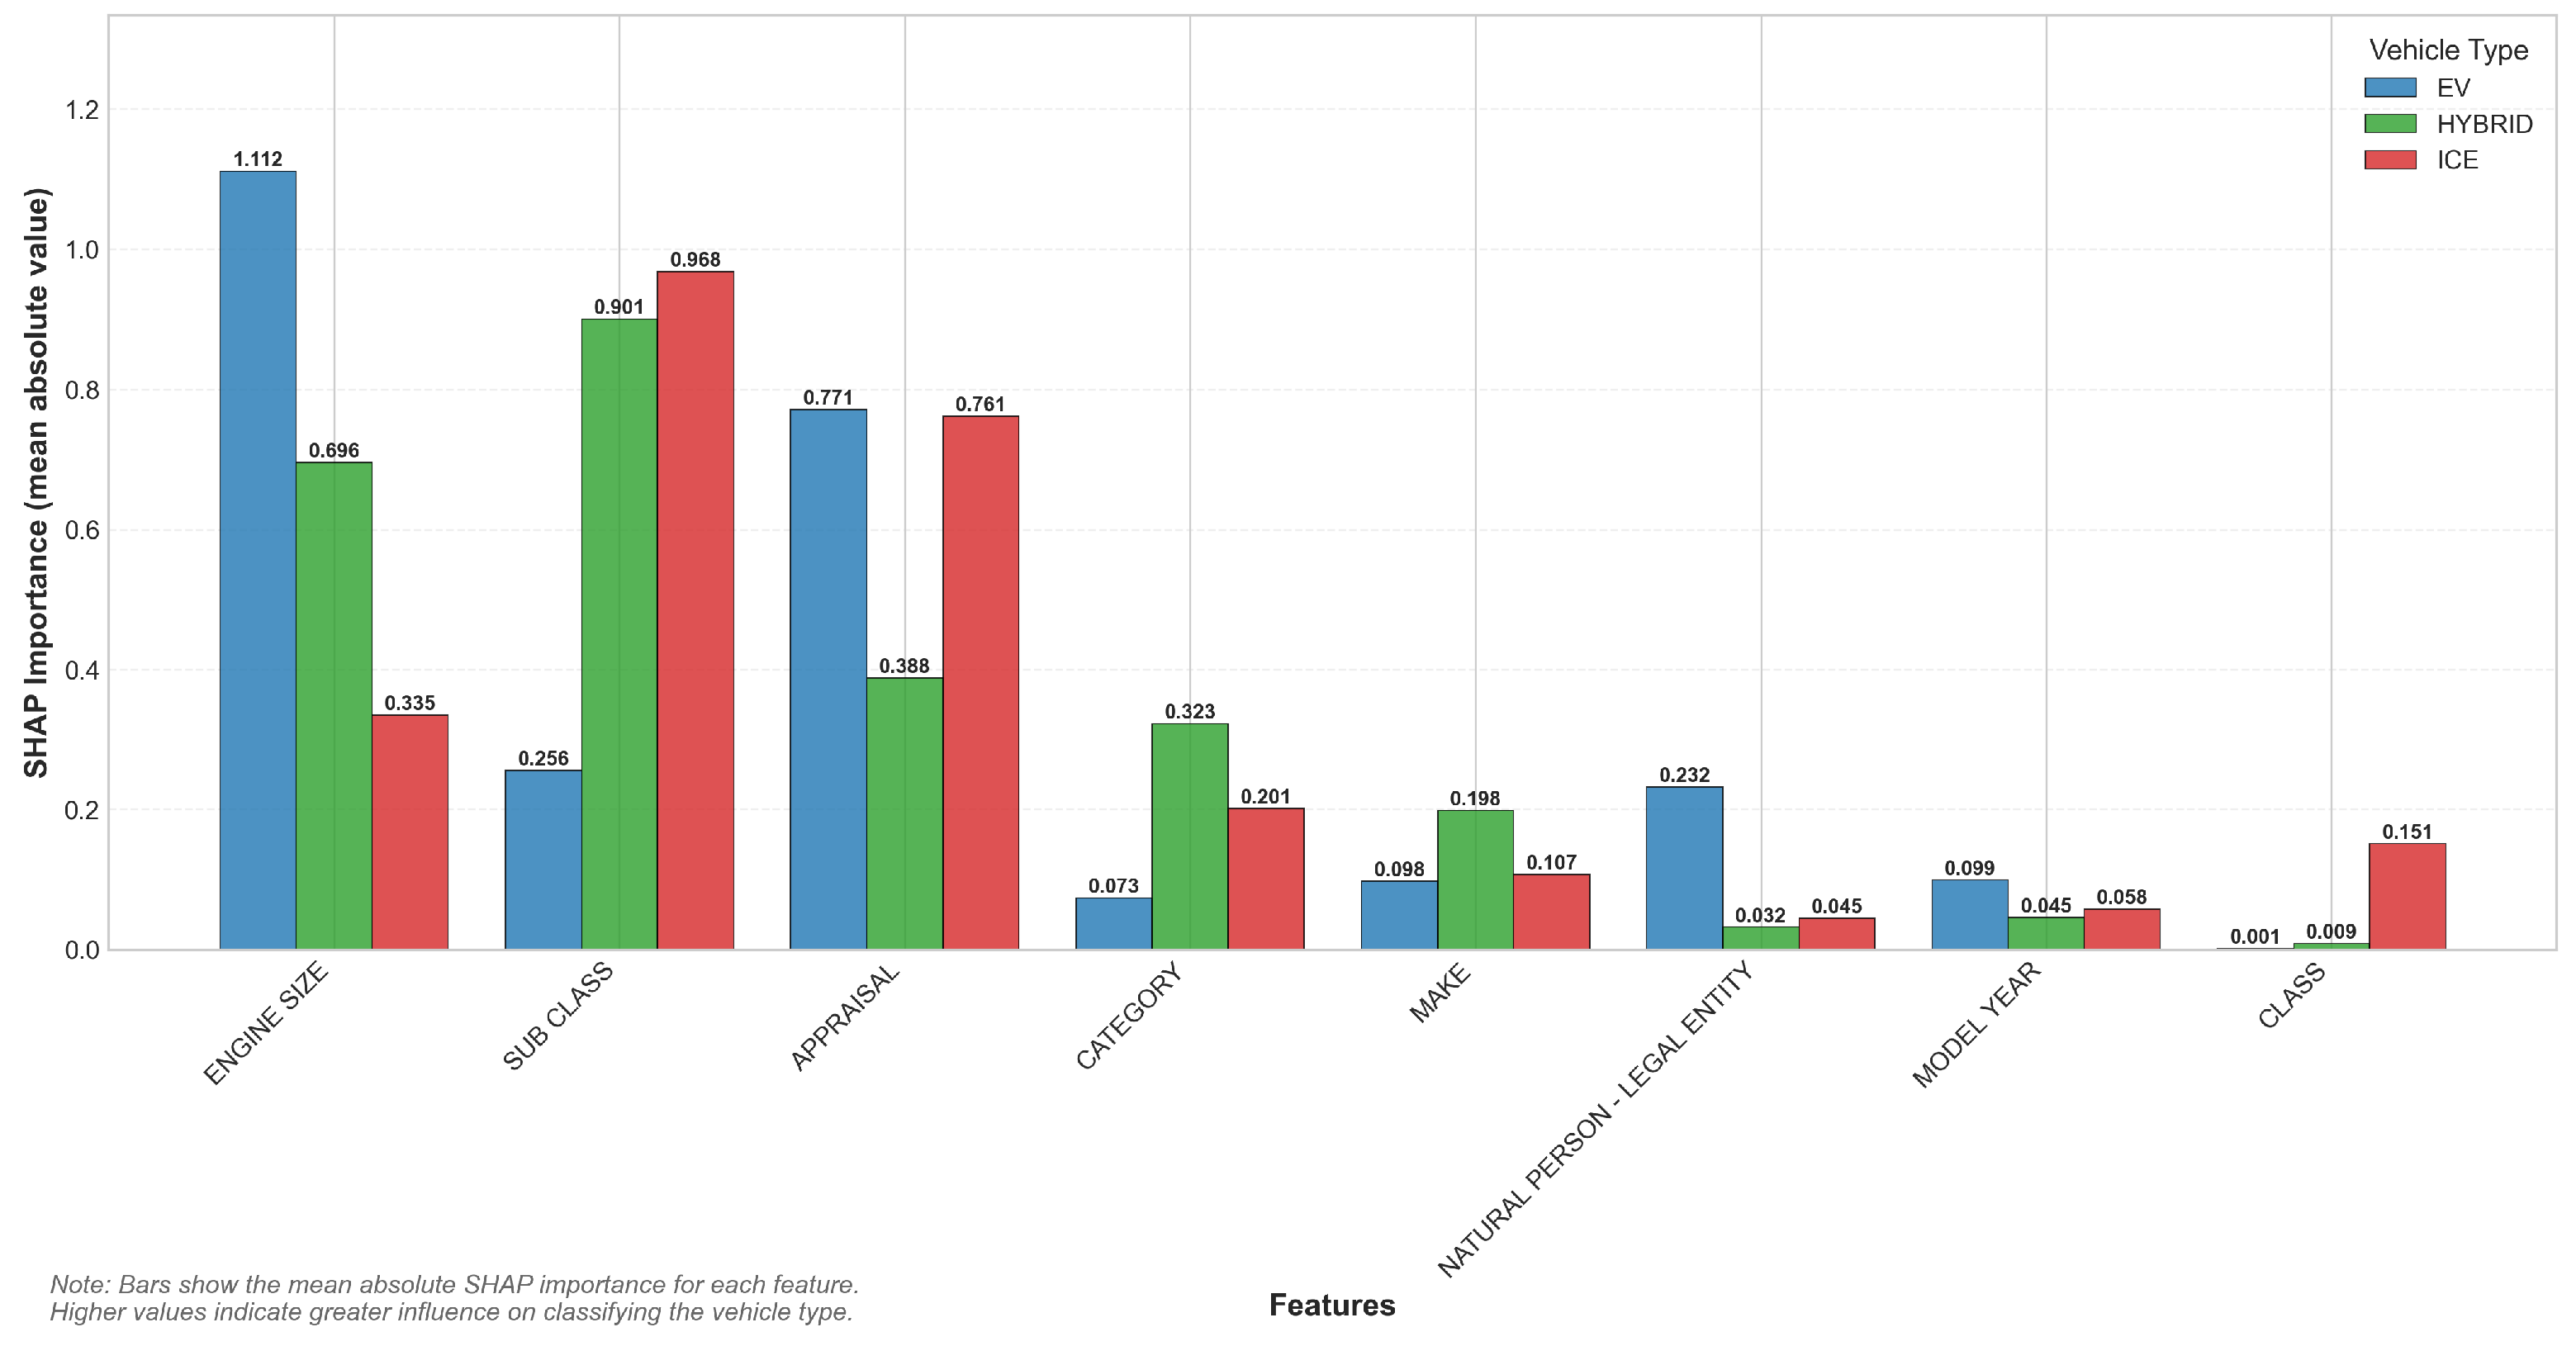
Figure 7 presents the comparison of feature importance among the three vehicle technologies.
Figure 7 shows that engine size emerges as the most relevant factor for EVs, followed by hybrids and with lower importance for ICE, confirming its role as a key differentiating feature in the model’s classification. The
SUB_CLASS variable presents high importance for hybrids and ICE, but a lower impact for EVs, suggesting that vehicle fiscal classification is more strongly associated with traditional technologies in the model’s internal representations. The fiscal appraisal value maintains high relevance for both EVs and ICE, indicating that the economic value of the vehicle is a cross-cutting model-derived association across all technologies.
4.5. Directional Effects of Variables
The SHAP analysis reveals differentiated statistical contribution patterns across vehicle technologies. For electric vehicles, the variables APPRAISAL and ENGINE_SIZE exhibit the highest average absolute SHAP values, indicating strong model-derived associations with the EV class prediction. These features represent the most influential attributes within the model’s internal decision process.
Similarly, hybrid vehicle predictions show a distinct statistical contribution pattern, where territorial attributes such as CANTON and vehicle subclass play a relatively larger role in the predictive structure.
Table 12 presents the direction of the contribution of the main variables for each vehicle technology, based on the mean sign of the SHAP values.
Table 12 reveals that the fiscal value (
APPRAISAL) positively contributes to the model’s output for all technologies, although its statistical contribution pattern is substantially stronger for EVs, highlighting affordability as a potential policy-relevant correlate. Engine size operates as a distinctive statistical contribution pattern for EVs (lower engine size contributes to EV classification) and as a positive factor for hybrid vehicles, while showing a negative association with internal combustion vehicles (higher engine size reduces the likelihood of ICE classification in the model). The positive contribution of legal entities as EV purchasers in the model reinforces the importance of fleet-based adoption as a potential policy-relevant correlate in the early phase of the technological transition.
4.6. Attribute-Based Distribution Shift Test
To assess the robustness of the models under structural changes in the vehicle fleet composition, an attribute-based distribution shift test was conducted using quantile splits of MODEL_YEAR. Specifically, vehicles with MODEL_YEAR below the 75th percentile were used for training, while newer vehicles (above the 75th percentile) were used for testing, comprising 707 vehicles from more recent model years.
It is important to emphasize that MODEL_YEAR represents a vehicle attribute rather than a chronological observation variable. Therefore, this experiment should not be interpreted as a true temporal forecasting exercise. Instead, it evaluates whether the predictive relationships learned by the models remain stable when applied to vehicles belonging to more recent technological cohorts.
Table 13 presents the results of this evaluation, showing consistent model performance under this temporal validation approach.
The results indicate that the predictive performance remains stable under this attribute distribution shift, suggesting that the boosting models capture structural relationships in the vehicle attribute space that generalize across different generations of the fleet. The analysis of feature importance stability confirms that the identified patterns are mostly transferable to newer vehicle cohorts.
Table 14 shows the variables with increasing importance in the test set, calculated as the difference in their absolute impact between the test set (newer vehicles) and the training set.
This pattern indicates that economic factors (appraisal), technological factors (engine size), and brand gain relevance for more recent vehicle models. The marked increase in the importance of engine size and appraisal suggests that vehicle segmentation in newer cohorts is increasingly polarized by these factors, which is consistent with an incipient but evolving transition towards cleaner vehicle technologies in Ecuador, where EVs are associated with low engine size and high cost, and hybrids with moderate engine size.
5. Discussion
The findings of this study directly address the stated hypothesis by demonstrating that gradient boosting models, particularly LightGBM, not only achieve near-perfect predictive performance (Macro F1-score =
), but also, through the systematic integration of SHAP, enable the identification of a clear and differentiated hierarchy of model-derived associations for technological adoption in the Ecuadorian vehicle fleet [
42]. While global performance metrics confirm the model’s ability to correctly classify vehicle technologies even under severe class imbalance, the explanatory analysis reveals that the underlying statistical contribution patterns that drive these classifications differ substantially among electric, hybrid, and internal combustion engine vehicles [
43].
The evaluation of model performance under extreme class imbalance (
) required metrics beyond standard accuracy. Following established recommendations in the literature on learning from imbalanced data, this study incorporated the Precision–Recall Area Under the Curve (PR-AUC) for the minority EV class, which is more informative than ROC-AUC in imbalanced scenarios as it remains sensitive to false positives [
44]. The perfect PR-AUC score of
for the EV class indicates that the model maintains high precision across all recall levels, confirming that the predictive performance is not an artifact of majority class dominance.
In particular, fiscal appraisal value and engine size emerge as the primary model-derived associations with the probability of electric vehicle adoption, suggesting that the transition toward zero-emission technologies is currently mediated more by economic and technical signals than by mass consumption patterns or cultural preferences [
45]. In contrast, hybrid vehicles exhibit greater sensitivity to territorial factors, pointing to an adoption process conditioned by regional heterogeneity in infrastructure, income levels, or subnational regulatory frameworks [
46].
The territorial heterogeneity observed for hybrid vehicles raises important questions about infrastructure equity. Pan et al. [
47] demonstrate that disparities in charging infrastructure access across regions can perpetuate or even exacerbate existing inequalities in the adoption of clean vehicle technologies. The strong association between the
CANTON variable and hybrid vehicle classification in Ecuador may reflect underlying spatial inequalities in infrastructure availability, income distribution, or access to fiscal incentives—a pattern consistent with the infrastructure equity concerns raised in the literature.
From a comparative perspective, these results extend and refine the evidence reported in previous studies that have applied machine learning algorithms to analyze vehicle technology adoption. For instance, Ullah et al. [
48] focused on aggregated performance metrics without class-level disaggregation, while Bas et al. ([
8], p. 13) incorporated attitudinal factors but did not reach the level of class-specific explanatory granularity provided by SHAP. Unlike prior literature, the present study demonstrates that class-specific explainability, enabled by SHAP, is critical to avoid oversimplified interpretations that assume a single set of model-derived associations for the entire vehicle fleet ([
49], p. 4).
In this regard, the finding that engine size operates simultaneously as a statistical contribution pattern of technological exclusion for electric vehicles and as a structural persistence factor for internal combustion vehicles provides empirical support for theoretical frameworks of technological lock-in and path dependence in transportation systems [
50]. Similarly, the relevance of fiscal appraisal value as a cross-cutting variable, yet with a disproportionately stronger effect on electric vehicles, aligns with studies emphasizing the role of upfront cost barriers in emerging electromobility markets [
51].
It is crucial to clarify that SHAP values quantify the internal contribution of features within the predictive model and should not be interpreted as structural causal effects. The model-derived associations identified between vehicle characteristics and technology type are derived from patterns learned from administrative data and reflect correlations present in the Ecuadorian vehicle fleet. While these associations can inform hypothesis generation and policy discussions, they do not establish causality without additional experimental or quasi-experimental research designs.
The integration of findings from the PRISMA systematic review into this discussion allows the Ecuadorian results to be contextualized within the international landscape. While Wang et al. ([
32], p. 5) identified similar model-derived associations in developed economies, the magnitude of the fiscal appraisal effect in Ecuador (
) substantially exceeds that reported in European studies, reflecting greater price sensitivity in lower purchasing-power markets. Likewise, the importance of CANTON for hybrid vehicles (
) contrasts with the territorial homogeneity observed in countries with more developed charging infrastructure, suggesting that hybrid adoption in Ecuador functions as a substitute for the absent charging infrastructure required by fully electric vehicles—a finding that resonates with the infrastructure equity framework proposed by Pan et al. ([
47], p. 9).
The policy implications are direct and operationally significant. First, the dominance of fiscal appraisal value as a potential policy-relevant correlate of electric vehicle adoption suggests that fiscal incentives—such as tariff exemptions, reductions in vehicle ownership taxes, or accelerated depreciation schemes—may constitute particularly effective instruments to accelerate the transition, provided they are properly targeted [
52]. Second, the robust and negative effect of engine size reinforces the coherence of green taxes based on technical characteristics and implicit emissions, not only as regulatory signals that discourage carbon-intensive technologies [
53]. Third, the positive contribution of legal entities to electric vehicle adoption highlights the strategic role of corporate and public fleets as early adopters, supporting the design of fleet electrification programs as an initial lever for decarbonization in developing economies ([
19], p. 7). For hybrid vehicles, the greater importance of territorial factors suggests that uniform national policies may be less effective than differentiated cantonal or regional interventions aligned with local capacities and infrastructure availability ([
12], p. 15). Addressing the territorial disparities identified in this study would require targeted infrastructure investments and differentiated policy instruments that account for regional heterogeneity, as emphasized in the infrastructure equity literature [
54].
Nevertheless, these results should be interpreted considering several limitations. First, the Ecuadorian electromobility market remains clearly incipient, with electric vehicles representing only
of total analyzed registrations, implying that the identified model-derived associations reflect early adoption dynamics rather than a consolidated market behavior [
55]. Second, although temporal validation indicates strong generalization capacity, the limited size of the future test set introduces statistical uncertainty; therefore, results associated with this validation should be considered indicative rather than definitive [
56]. Third, while the use of administrative records ensures national coverage and high external validity, it restricts the inclusion of finer attitudinal or socioeconomic variables that could further enrich the interpretation of the results [
57].
6. Conclusions
This study aimed to evaluate the adoption of vehicle technologies at the national scale through an explainable artificial intelligence (XAI) framework, with the explicit objective of bridging the gap between high-performance machine learning models and the transparency requirements of public decision-making. By comparing XGBoost and LightGBM on a comprehensive administrative dataset comprising 482,754 vehicle records from Ecuador, the research demonstrated that state-of-the-art gradient boosting models can be effectively deployed to analyze complex and highly imbalanced transportation datasets while remaining interpretable and policy-relevant.
Empirical results showed that both XGBoost and LightGBM achieved near-perfect predictive performance, with a consolidated Macro F1-score of , confirming their robustness even in a context where electric vehicles represented only of the observed fleet. Beyond predictive accuracy, the integration of SHAP provided substantial analytical value by revealing that engine size (ENGINE_SIZE) and fiscal appraisal value (APPRAISAL) were the dominant model-derived associations distinguishing electric vehicles from hybrid and internal combustion technologies. These findings highlight that the current transition toward electric mobility in Ecuador is primarily shaped by technical constraints and economic signals rather than by widespread behavioral change, underscoring the importance of structural factors in early-stage adoption processes.
From an interpretative perspective, this research addressed a critical transparency gap associated with so-called “black-box” models in transportation policy analysis. The proposed XAI-based methodology transformed highly accurate classifiers into auditable analytical tools, enabling policymakers to trace model outputs back to specific fiscal, technical, and territorial variables. In doing so, the study provided, for the first time, a reproducible and explainable data-driven framework tailored to the national vehicle fleet, thereby enhancing the credibility and usability of machine learning methods in the governance of energy and transport transitions.
Nevertheless, the interpretability results obtained through SHAP should be interpreted within the limits of predictive modeling. SHAP values describe how features contribute to the internal decision process of the model, but they do not establish causal relationships between variables and real-world behavioral outcomes. The patterns identified in this study represent model-derived associations rather than structural determinants of consumer adoption decisions.
At the same time, several limitations must be acknowledged. The marginal share of electric vehicles in the current Ecuadorian market implies that the identified model-derived associations reflect early adoption dynamics rather than long-term equilibrium behavior. Furthermore, although temporal validation indicated strong generalization capacity, the relatively small size of the future test set limited the possibility of drawing definitive conclusions regarding long-term predictive stability. These limitations point to the need for continuous model updating and revalidation as the electromobility market evolves and new data become available.
Despite these constraints, the policy implications of the study are clear and actionable. The strong influence of fiscal appraisal value and buyer type as potential policy-relevant correlates suggests that fiscal incentives may be more effective when explicitly segmented by vehicle technology, buyer category (individual versus legal entity), and territorial context. In particular, the prominent role of legal entities in electric vehicle adoption supports the strategic prioritization of corporate and public fleet electrification programs, while territorial heterogeneity calls for differentiated subnational policy instruments rather than uniform national measures. The modeling framework developed in this study is well positioned to support such targeted policy design, scenario evaluation, and ex ante impact assessment.
Future research could complement the predictive approach with causal inference techniques, such as quasi-experimental designs or structural econometric models, to further investigate the drivers of electric vehicle adoption in emerging economies.
In conclusion, this research demonstrates that explainable machine learning constitutes a fundamental pillar for advancing transport decarbonization in developing economies. By combining predictive excellence with interpretability, the proposed approach enables transparent, evidence-based, and adaptable policy design in contexts characterized by rapid change and structural constraints. As data availability increases and market maturity progresses, XAI-driven methodologies are expected to become increasingly central in aligning technological innovation, fiscal policy, and sustainability objectives in the pursuit of a low-carbon transport future.



 ,
,