Article

First-Principles Insights into Mo and Chalcogen Dopant Positions in Anatase, TiO2

by
W. A. Chapa Pamodani Wanniarachchi
1,2,*,
Ponniah Vajeeston
3,
Talal Rahman
1 and
Dhayalan Velauthapillai
1,*
1
Faculty of Engineering, Western Norway University of Applied Sciences, 5020 Bergen, Norway
2
Clean Energy Research Laboratory (CERL), Department of Physics, University of Jaffna, Jaffna 40000, Sri Lanka
3
Department of Chemistry, Center for Materials Science and Nanotechnology, University of Oslo, P.O. Box 1033, Blindern, NO-0315 Oslo, Norway
*
Authors to whom correspondence should be addressed.
Computation 2025, 13(7), 170; https://doi.org/10.3390/computation13070170
Submission received: 24 May 2025 / Revised: 21 June 2025 / Accepted: 25 June 2025 / Published: 14 July 2025
(This article belongs to the Special Issue Feature Papers in Computational Chemistry)

Abstract

This study employs density functional theory (DFT) to investigate the electronic and optical properties of molybdenum (Mo) and chalcogen (S, Se, Te) co-doped anatase TiO2. Two co-doping configurations were examined: Model 1, where the dopants are adjacent, and Model 2, where the dopants are farther apart. The incorporation of Mo into anatase TiO2 resulted in a significant bandgap reduction, lowering it from 3.22 eV (pure TiO2) to range of 2.52–0.68 eV, depending on the specific doping model. The introduction of Mo-4d states below the conduction band led to a shift in the Fermi level from the top of the valence band to the bottom of the conduction band, confirming the n-type doping characteristics of Mo in TiO2. Chalcogen doping introduced isolated electronic states from Te-5p, S-3p, and Se-4p located above the valence band maximum, further reducing the bandgap. Among the examined configurations, Mo–S co-doping in Model 1 exhibited most optimal structural stability structure with the fewer impurity states, enhancing photocatalytic efficiency by reducing charge recombination. With the exception of Mo–Te co-doping, all co-doped systems demonstrated strong oxidation power under visible light, making Mo-S and Mo-Se co-doped TiO2 promising candidates for oxidation-driven photocatalysis. However, their limited reduction ability suggests they may be less suitable for water-splitting applications. The study also revealed that dopant positioning significantly influences charge transfer and optoelectronic properties. Model 1 favored localized electron density and weaker magnetization, while Model 2 exhibited delocalized charge density and stronger magnetization. These findings underscore the critical role of dopant arrangement in optimizing TiO2-based photocatalysts for solar energy applications.

1. Introduction

Titanium dioxide (TiO2) is widely recognized for its photocatalytic capabilities, which are harnessed in applications such as water splitting, pollutant degradation, and solar energy conversion [1]. TiO2 has a wide bandgap of about 3.2 eV for anatase, which limits its ability to absorb visible light [2]. Most solar energy is in the visible range (approximately 400–700 nm), so TiO2’s efficiency at utilizing sunlight is inherently limited by its bandgap. Through the doping of foreign atoms, the bandgap of TiO2 can be optimized, leading to enhanced absorption of solar energy in the visible spectrum. Numerous experimental and theoretical studies have investigated this approach in depth [3,4,5,6]. Molybdenum (Mo) doping in TiO2 can effectively shift the absorption edge toward the visible light region because the size of the Mo cation is comparable to that of the Ti cation. This can result in a stable doped system [7]. Ohno et al. developed S-doped TiO2 photocatalysts by substituting sulfur (S4+) in place of certain titanium atoms within the lattice structure. These modified photocatalysts exhibit enhanced visible light absorption at wavelengths beyond 500 nm and demonstrate high photocatalytic activity. S-doped TiO2 powder shows potential for various applications, including the oxidation of 2-propanol in aqueous solution, degradation of methylene blue, and partial oxidation of adamantane when exposed to wavelengths above 440 nm [8]. A few studies have shown that S-doped anatase enhances visible light absorption [9,10,11].
The experimental study investigated the effects of S, Se, and Te doping on the anatase-to-rutile phase transition and microbial disinfection properties of chalcogen-doped TiO2 at high calcination temperatures. TiO2 samples doped with 2 mol% S, Se, or Te were synthesized using a sol–gel method. The substitutional incorporation of chalcogens into the TiO2 lattice improved visible light absorption. It was concluded that Te-doped TiO2 displayed similar bactericidal efficiency to control anatase under visible light, indicating that Te maintains TiO2’s photocatalytic activity even at temperatures up to 750 °C [12]. Titanium dioxide samples doped with varying amounts of Se4+ and Te4+ ions were synthesized via homogeneous hydrolysis using amorphous Se and Te. The Se4+- and Te4+-doped titania samples with the highest photocatalytic activity under UV and visible light were identified as TiSe3 (11.5 wt% Se) and TiTe3 (8.0 wt% Te), respectively. This demonstrates that incorporating Se and Te into the anatase lattice positively influences photocatalytic activity in the visible light range [13]. Another study investigated the Se (IV)-doped TiO2 system using both experimental methods and density functional theory (DFT) to assess its optoelectronic and photocatalytic properties. Se-doped TiO2 demonstrated photocatalytic activity when exposed to direct sunlight, with its bandgap extending from 420 to 650 nm. The 3p orbitals of Se contribute to the formation of additional electronic states within the bandgap, which reduces the wide bandgap of pristine anatase and enhances its photocatalytic activity [14]. It was found that substituting anions such as S, Se, and Te is more effective than cation doping, with the redshift becoming more pronounced as the atomic number of the chalcogen element increases [15]. Doping TiO2 by replacing O sites with chalcogen atoms has become a prominent research focus due to the unique electronic and optical properties of chalcogens. It is also of interest to explore Mo co-doping within the chalcogen element series, as this is a novel approach that has never been reported before.
As demonstrated in previous experimental studies, doping TiO2 with metal atoms such as molybdenum (Mo) and chalcogen elements like sulfur (S), selenium (Se), and tellurium (Te) can enhance its photocatalytic properties. In this work, we investigated the material characteristics of anatase TiO2 when co-doped with Mo and chalcogen atoms. Specifically, we studied the optoelectronic properties of anatase TiO2 doped with Mo at titanium sites and S, Se, or Te at oxygen sites, and we further explored how the spatial arrangement of dopants when the doped atoms are in the adjacent position or at a distant position in the anatase TiO2 structure affects these ground state properties. The electronic structure was calculated using the GGA+U method, while the HSE hybrid functional was employed for accurate optical property predictions. We examined the structural, electronic, and optical characteristics and compared them with the existing mono-doped chalcogen models. Additionally, formation energies were analyzed under oxygen-rich and titanium-rich conditions to assess the thermodynamic stability of the dopants within the anatase lattice. The photocatalytic potential of the doped systems was evaluated by analyzing their band edge positions relative to the normal hydrogen electrode (NHE) for water splitting.

2. Computational Methodology

The projector-augmented wave (PAW) pseudopotentials [16] were used for all the DFT calculations in the VASP code [17]. Initially, geometry optimization was performed for both the pure and doped models in the GGA method, which was parametrized at the Perdew−Burke−Ernzerhof (PBE) level [18] with the Monkhorst−Pack k-point mesh [19] of 4 × 4 × 4. Here, we used the plane wave basis set with a cutoff energy of 560 eV for our calculations. For the electronic property calculations, the spin-polarized density of states (DOS) of the doped structures were computed on the Monkhorst−Pack k-point grid on 7 × 7 × 5 along the x, y, and z directions of high symmetry in the first Brillouin zone. The DFT+U approach, as seen in Equation (1), incorporates an on-site correction to account for intra-atomic electron–electron interactions [20,21], which helps improve the description of systems with localized d and f electrons, often resulting in more accurate bandgap predictions than standard GGA.
E D F T + U = E D F T + σ   U J 2 T r n σ 1 n σ
Here, n σ 
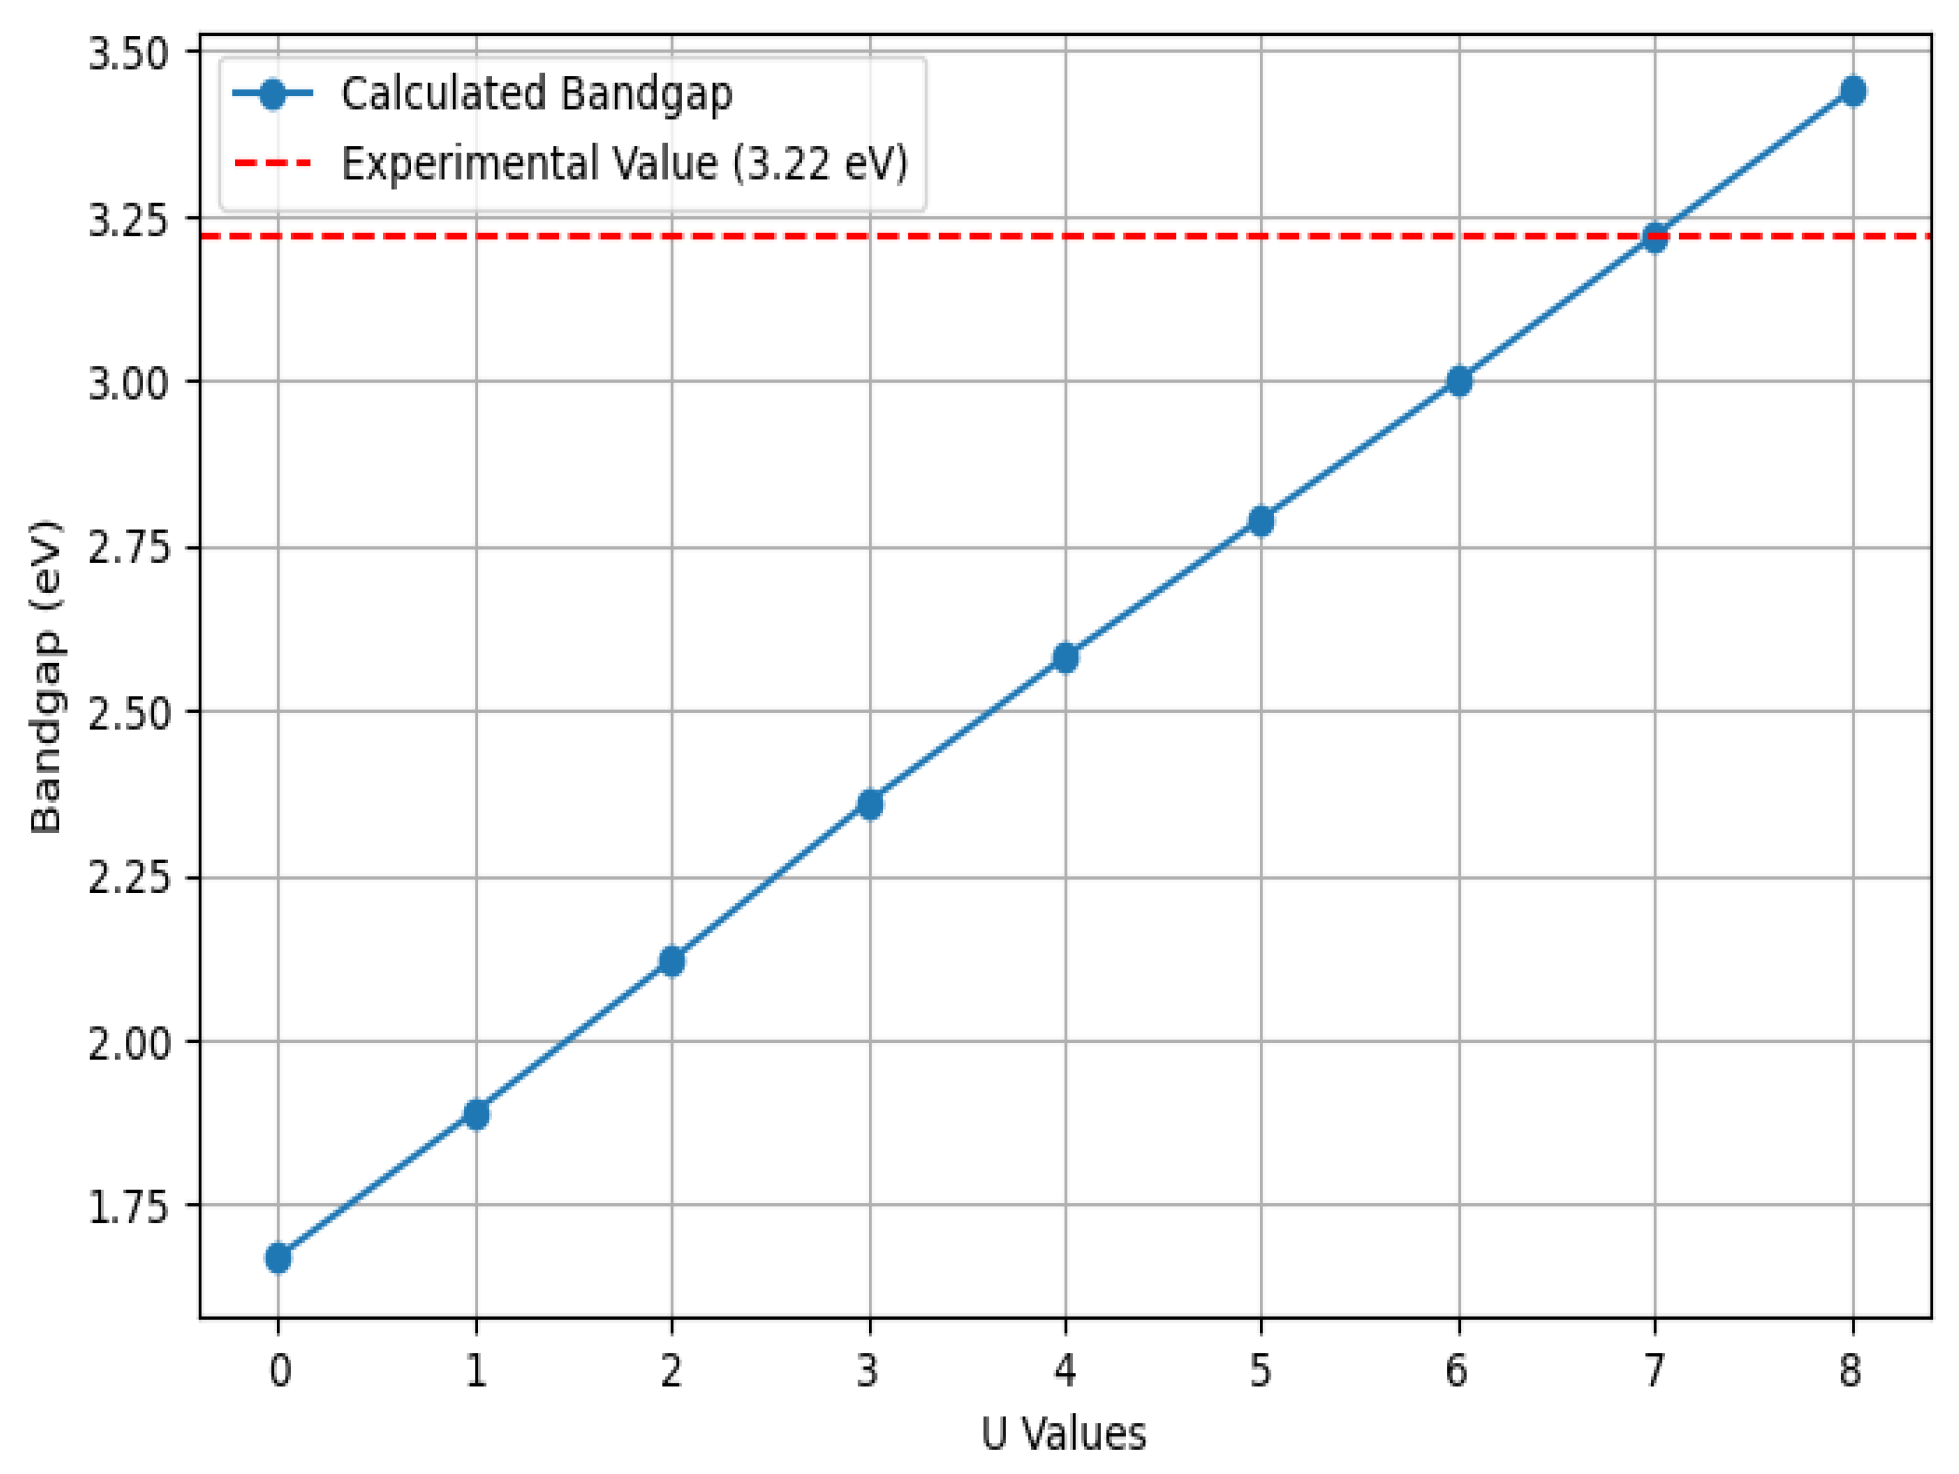
is the occupation matrix for spin σ, and Tr is the trace operator. The spherically averaged Hubbard parameter U quantifies the energy increase associated with adding an extra electron to the system. The parameter J represents (1 eV) as the screened exchange energy. In this case, the effective on-site Coulomb interactions were set to U = 7.0 eV for Ti 3d and U = 5.38 eV for transition metal (TM) d electrons in the GGA+U approach. To determine the U value for pure anatase TiO2, we computed the bandgap values by varying U from 0 to 8 eV and found that U = 7 eV gives a value closest to the experimental bandgap of 3.22 eV, as shown in Figure 1. The U value for Mo was taken from the Materials Project [22].
Simulating a system that has strong electron correlation and a need to correct the electronic structure, especially in transition metal oxides or correlated materials, GGA+U could be more effective, but it may not offer the same accuracy for optical properties as HSE06. Thus, optical property calculations were performed in the screened hybrid functional called (Heyd−Scuseria−Ernzerhof) HSE06 [23]. VESTA is a three-dimensional visualization program that was used to visualize the equilibrium crystal lattices [24].
The doped system consists of a 2 × 2 × 1 supercell containing a total of 48 atoms, which provides a realistic environment for introducing dopants at low concentrations while minimizing artificial interactions between periodic images of atoms. The supercell was generated using the Phonopy code to ensure proper structural setup for the simulations [25]. S, Se, and Te doping in the anatase TiO2 supercell was performed by replacing a single O atom with S, Se, or Te at its regular lattice site, while Mo-doped TiO2 was obtained by replacing the Ti site with the Mo atom simultaneously. Here, Mo4+ substitutes Ti4+, and the valence band remains fully occupied, with no free carriers (electrons or holes). The concentration of each dopant element in this supercell is approximately 2.08%.
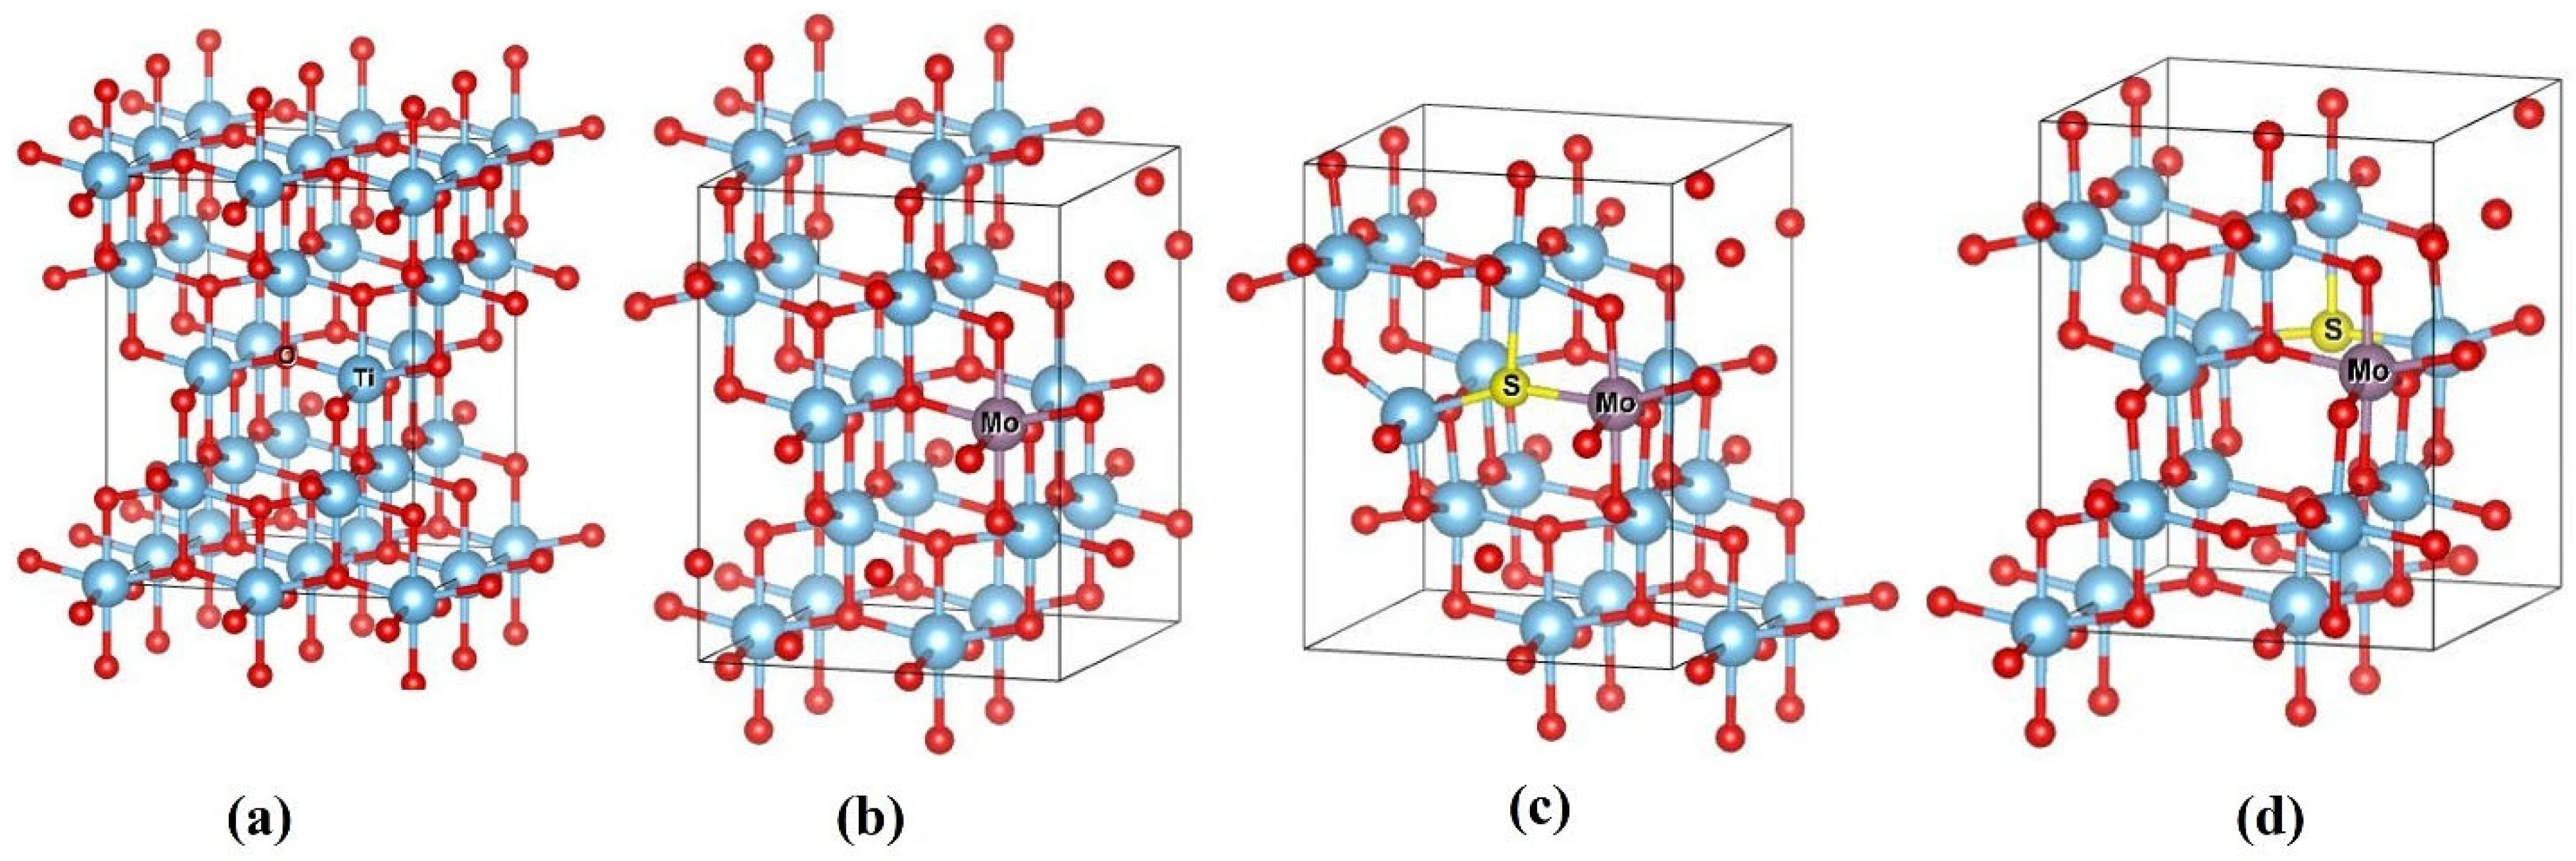
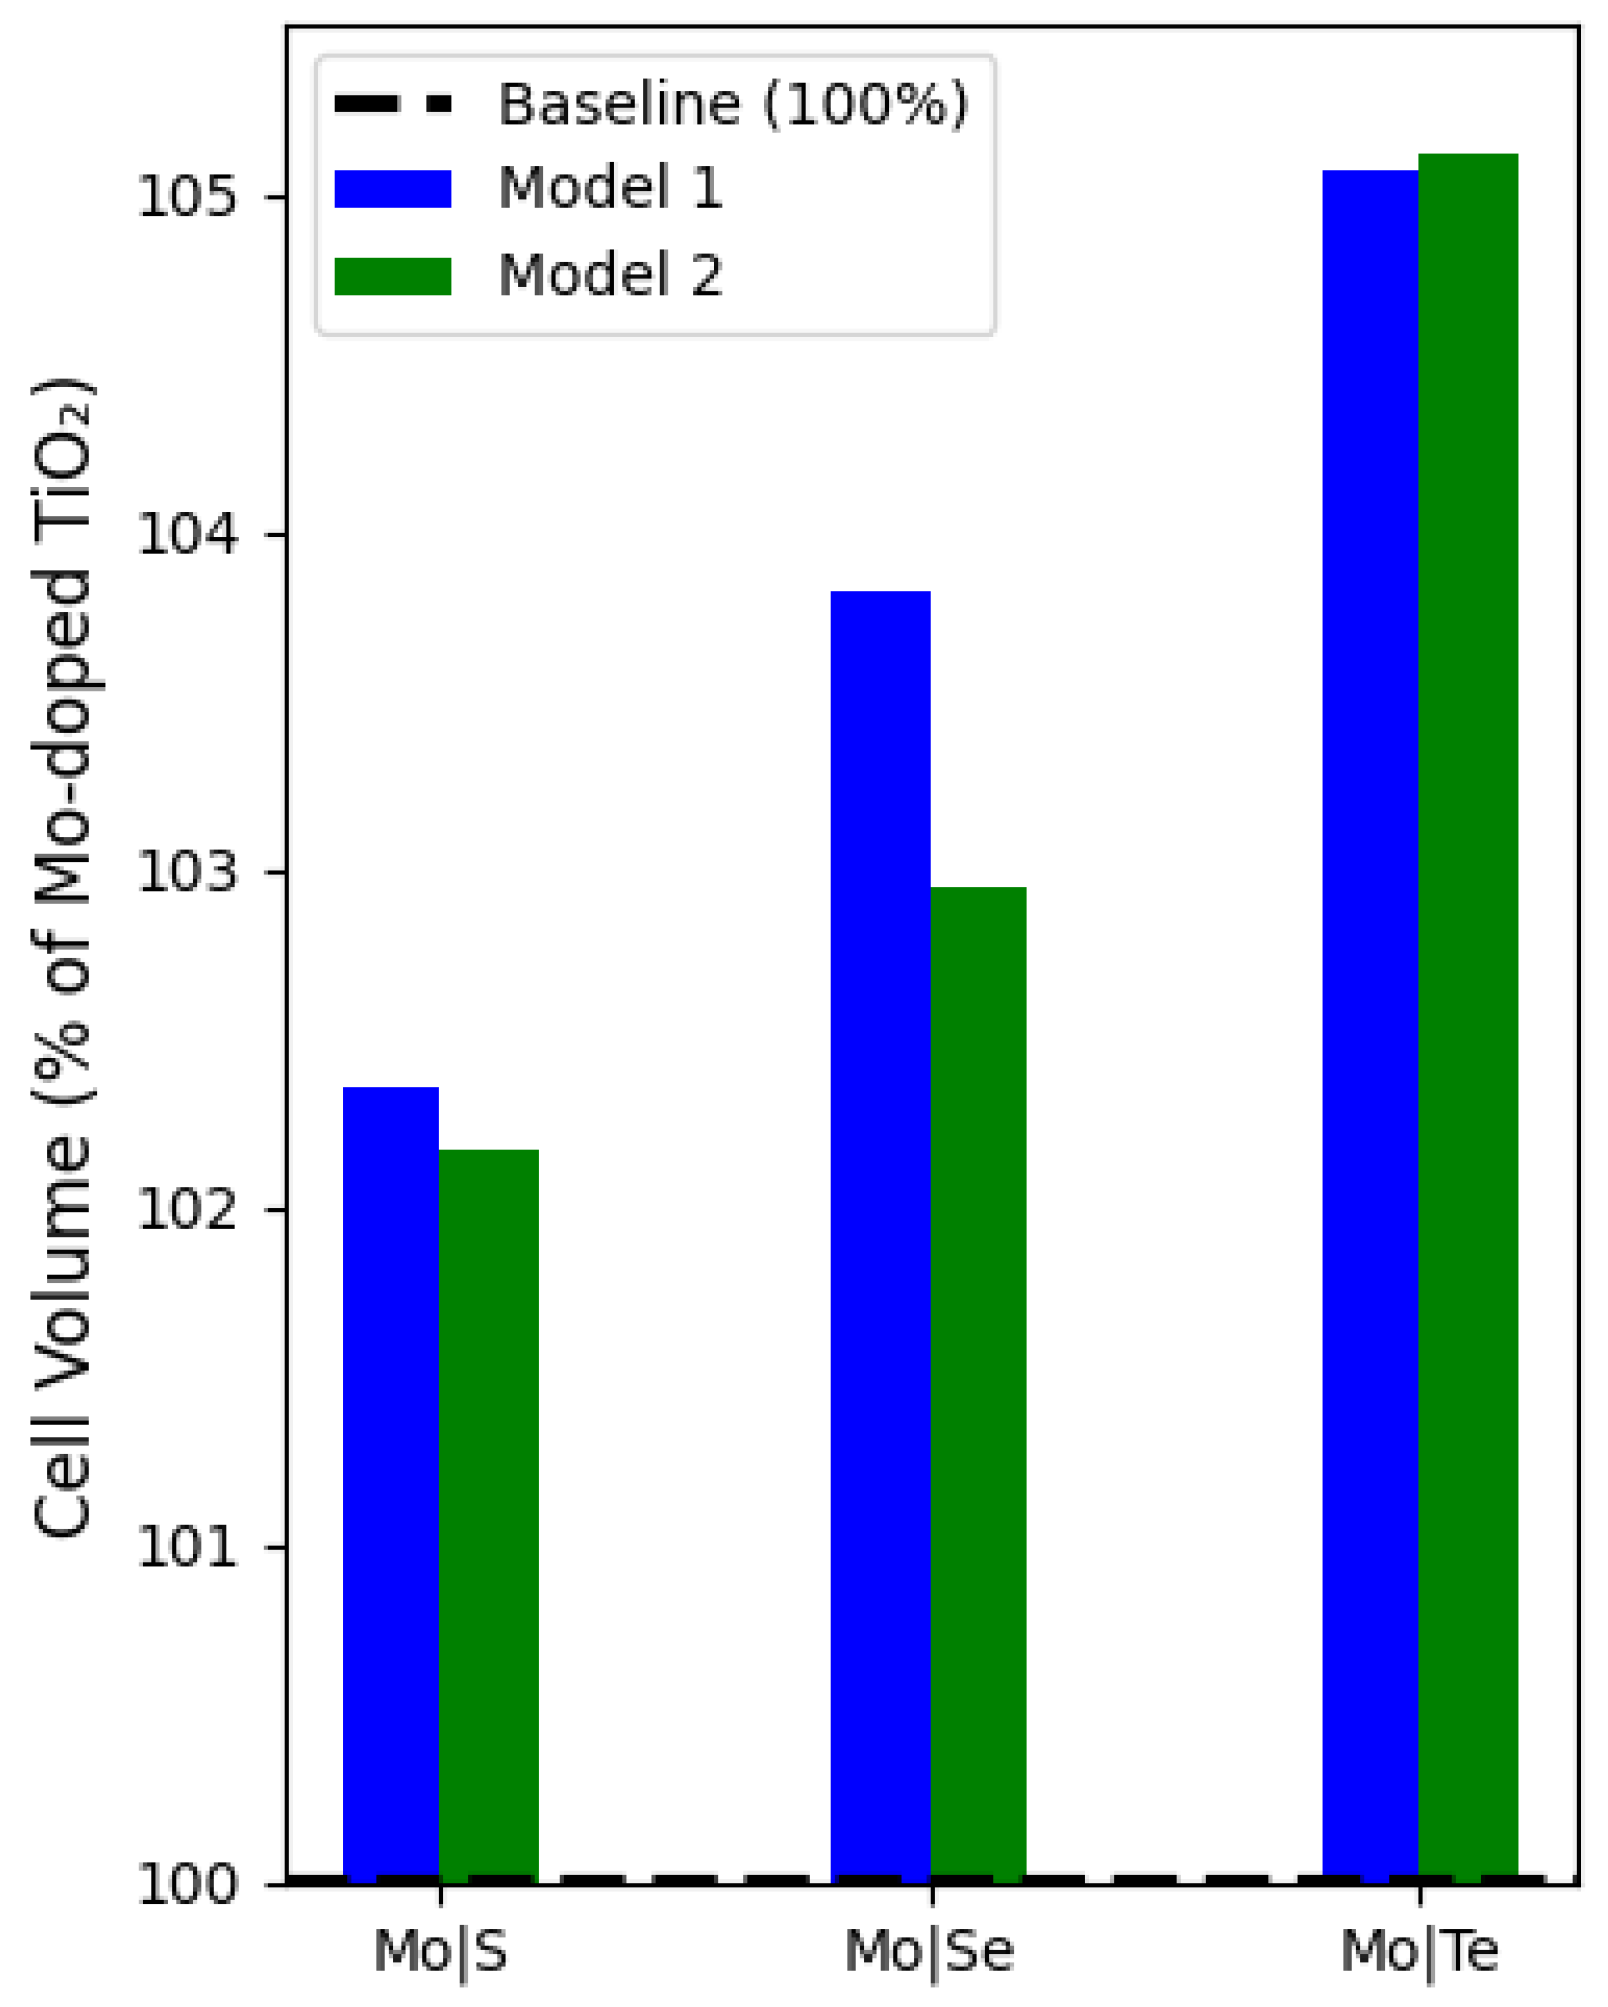
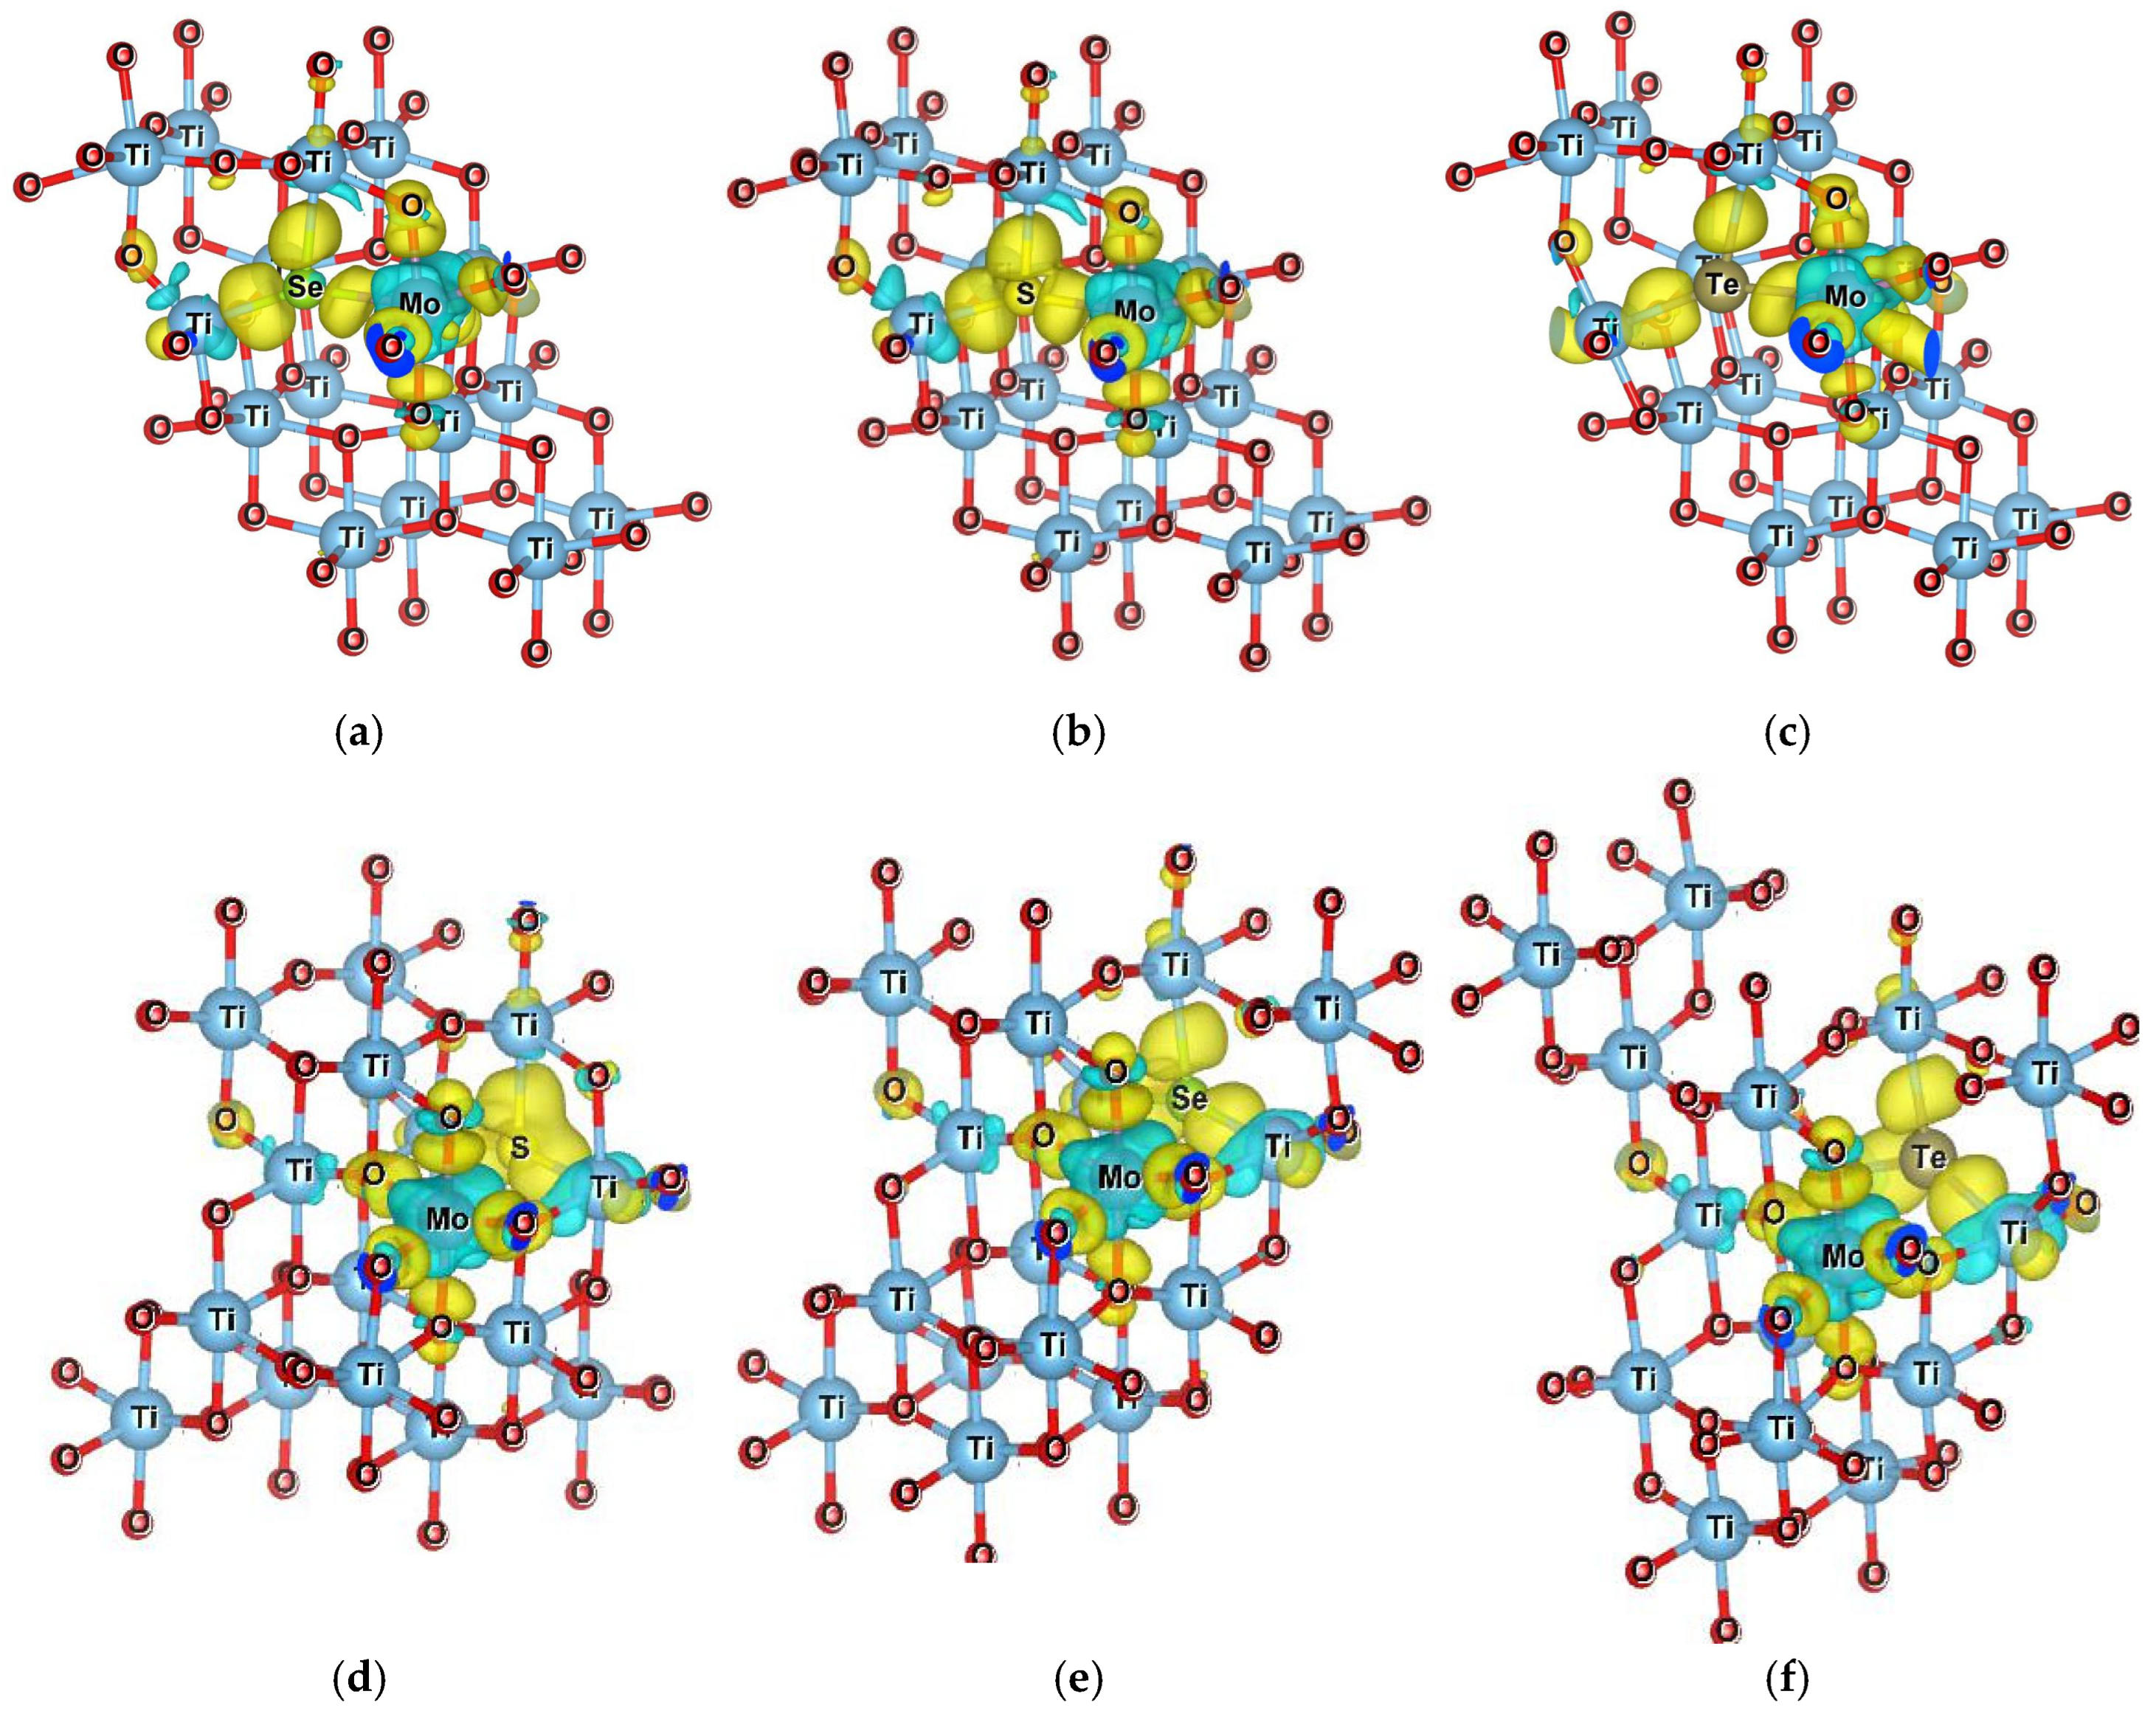
Two different models were constructed for the co-doping system to investigate the impact of dopant locations on the electronic and optical properties of these six configurations. In the first model (hereafter referred to as Model 1), S, Se, Te, and Mo were doped adjacently by replacing O and Ti atoms at a distance of 1.9576 Å. In the second model (hereafter referred to as Model 2), S, Se, Te, and Mo were placed at a distance of 4.3099 Å. Both doped models were geometrically optimized, and their electronic and optical properties were subsequently evaluated. The configurations of these models are illustrated in Figure 2. Energy versus volume data for these doped structures concluded that Model 1 exhibits a lower ground state energy than Model 2, indicating that Model 1 is more stable across all doped structures. The S-doped configuration of Model 1 has the most stable structure among the Se- and Te-doped compounds. Consequently, the adjacent positioning of the Mo and S dopants results in the most optimal structural stability relative to the other models, as seen in Figures S1–S4. In adjacent co-doping, the introduced cation and anion can form a strong bond via direct charge transfer, which generally results in the system achieving the lowest total energy [26].

3. Results and Discussion

Structural Optimization

The geometrical optimization of pure anatase TiO2, as well as mono-doped and co-doped models, was performed using the PBE functional. The equilibrium lattice parameters for anatase TiO2 are a = 3.8179 Å and c = 9.7473 Å, which align well with the experimental values of a = 3.78512 Å and c = 9.51185 Å [27]. Upon doping of the heavy metal Mo, the cell volume increased four times, to 570.71 Å3 compared with the pristine anatase structure, 142.08 Å3. Furthermore, the cell volume increased slightly upon the co-doping with the chalcogen elements. The largest cell volume was found for the Mo/Te co-doped TiO2 models, which is 5% larger compared with the Mo-doped TiO2 structure model, as seen in Figure 3.
Here, Model 1 has a lower ground state energy but still results in a higher cell volume compared with Model 2, except for the Te-doped structure. A system that is energetically favorable (lower ground state energy) might undergo structural distortions such as increased lattice expansion as a result of stronger dopant interactions. In Table 1, we have listed calculated bond lengths for both pure and doped structures. The variations among them can be attributed to differences in atomic size and electronegativity. For instance, the Mo–S bond length is generally longer than the Ti–O bond due to the larger atomic radius of sulfur compared with oxygen. Additionally, the ionic radius increases in the order S < Se < Te, and the associated bond lengths increase accordingly.

4. Formation Energy

The formation energies for co-doped anatase models were calculated and analyzed under both oxygen-rich and titanium-rich conditions. The formation energy is given by Equation (2),
E f X q = E t o t X q E t o t T i 16 O 32 μ T M + μ T i μ N M + μ O
where E t o t T i 16 O 32 represents the total energy of the pure titanium dioxide supercell, μ T M and μ T i represent the chemical potentials of the transition metal and titanium atom, respectively, and μ N M and μ O are used to represent the chemical potentials of the nonmetal and oxygen atoms, respectively.
The formation energy as in Equation (3) of TiO2-based photocatalysts depends on the growth conditions and varies between Ti-rich (TRC) and O-rich (ORC) chemical environments. Here, μ T i O 2 was computed by normalizing the energy value of the pure supercell.
μ T i O 2 = μ T i + 2 μ O
Under the oxygen-rich growth conditions, the chemical potential of oxygen is the one calculated from the ground state energy of O2, μ O = μ O 2 / 2 . Then, μ T i is obtained using Equation (3). Conversely, under the titanium-rich conditions, μ T i is the energy of one titanium atom in bulk titanium, and μ O is then computed.
The chemical potentials for the chalcogen elements S, Se, and Te are determined with Equation (4):
μ X = μ X O 2 2 μ O
Here, μ X was calculated by Equations (3) and (4) through μ O . The chemical potentials (μ
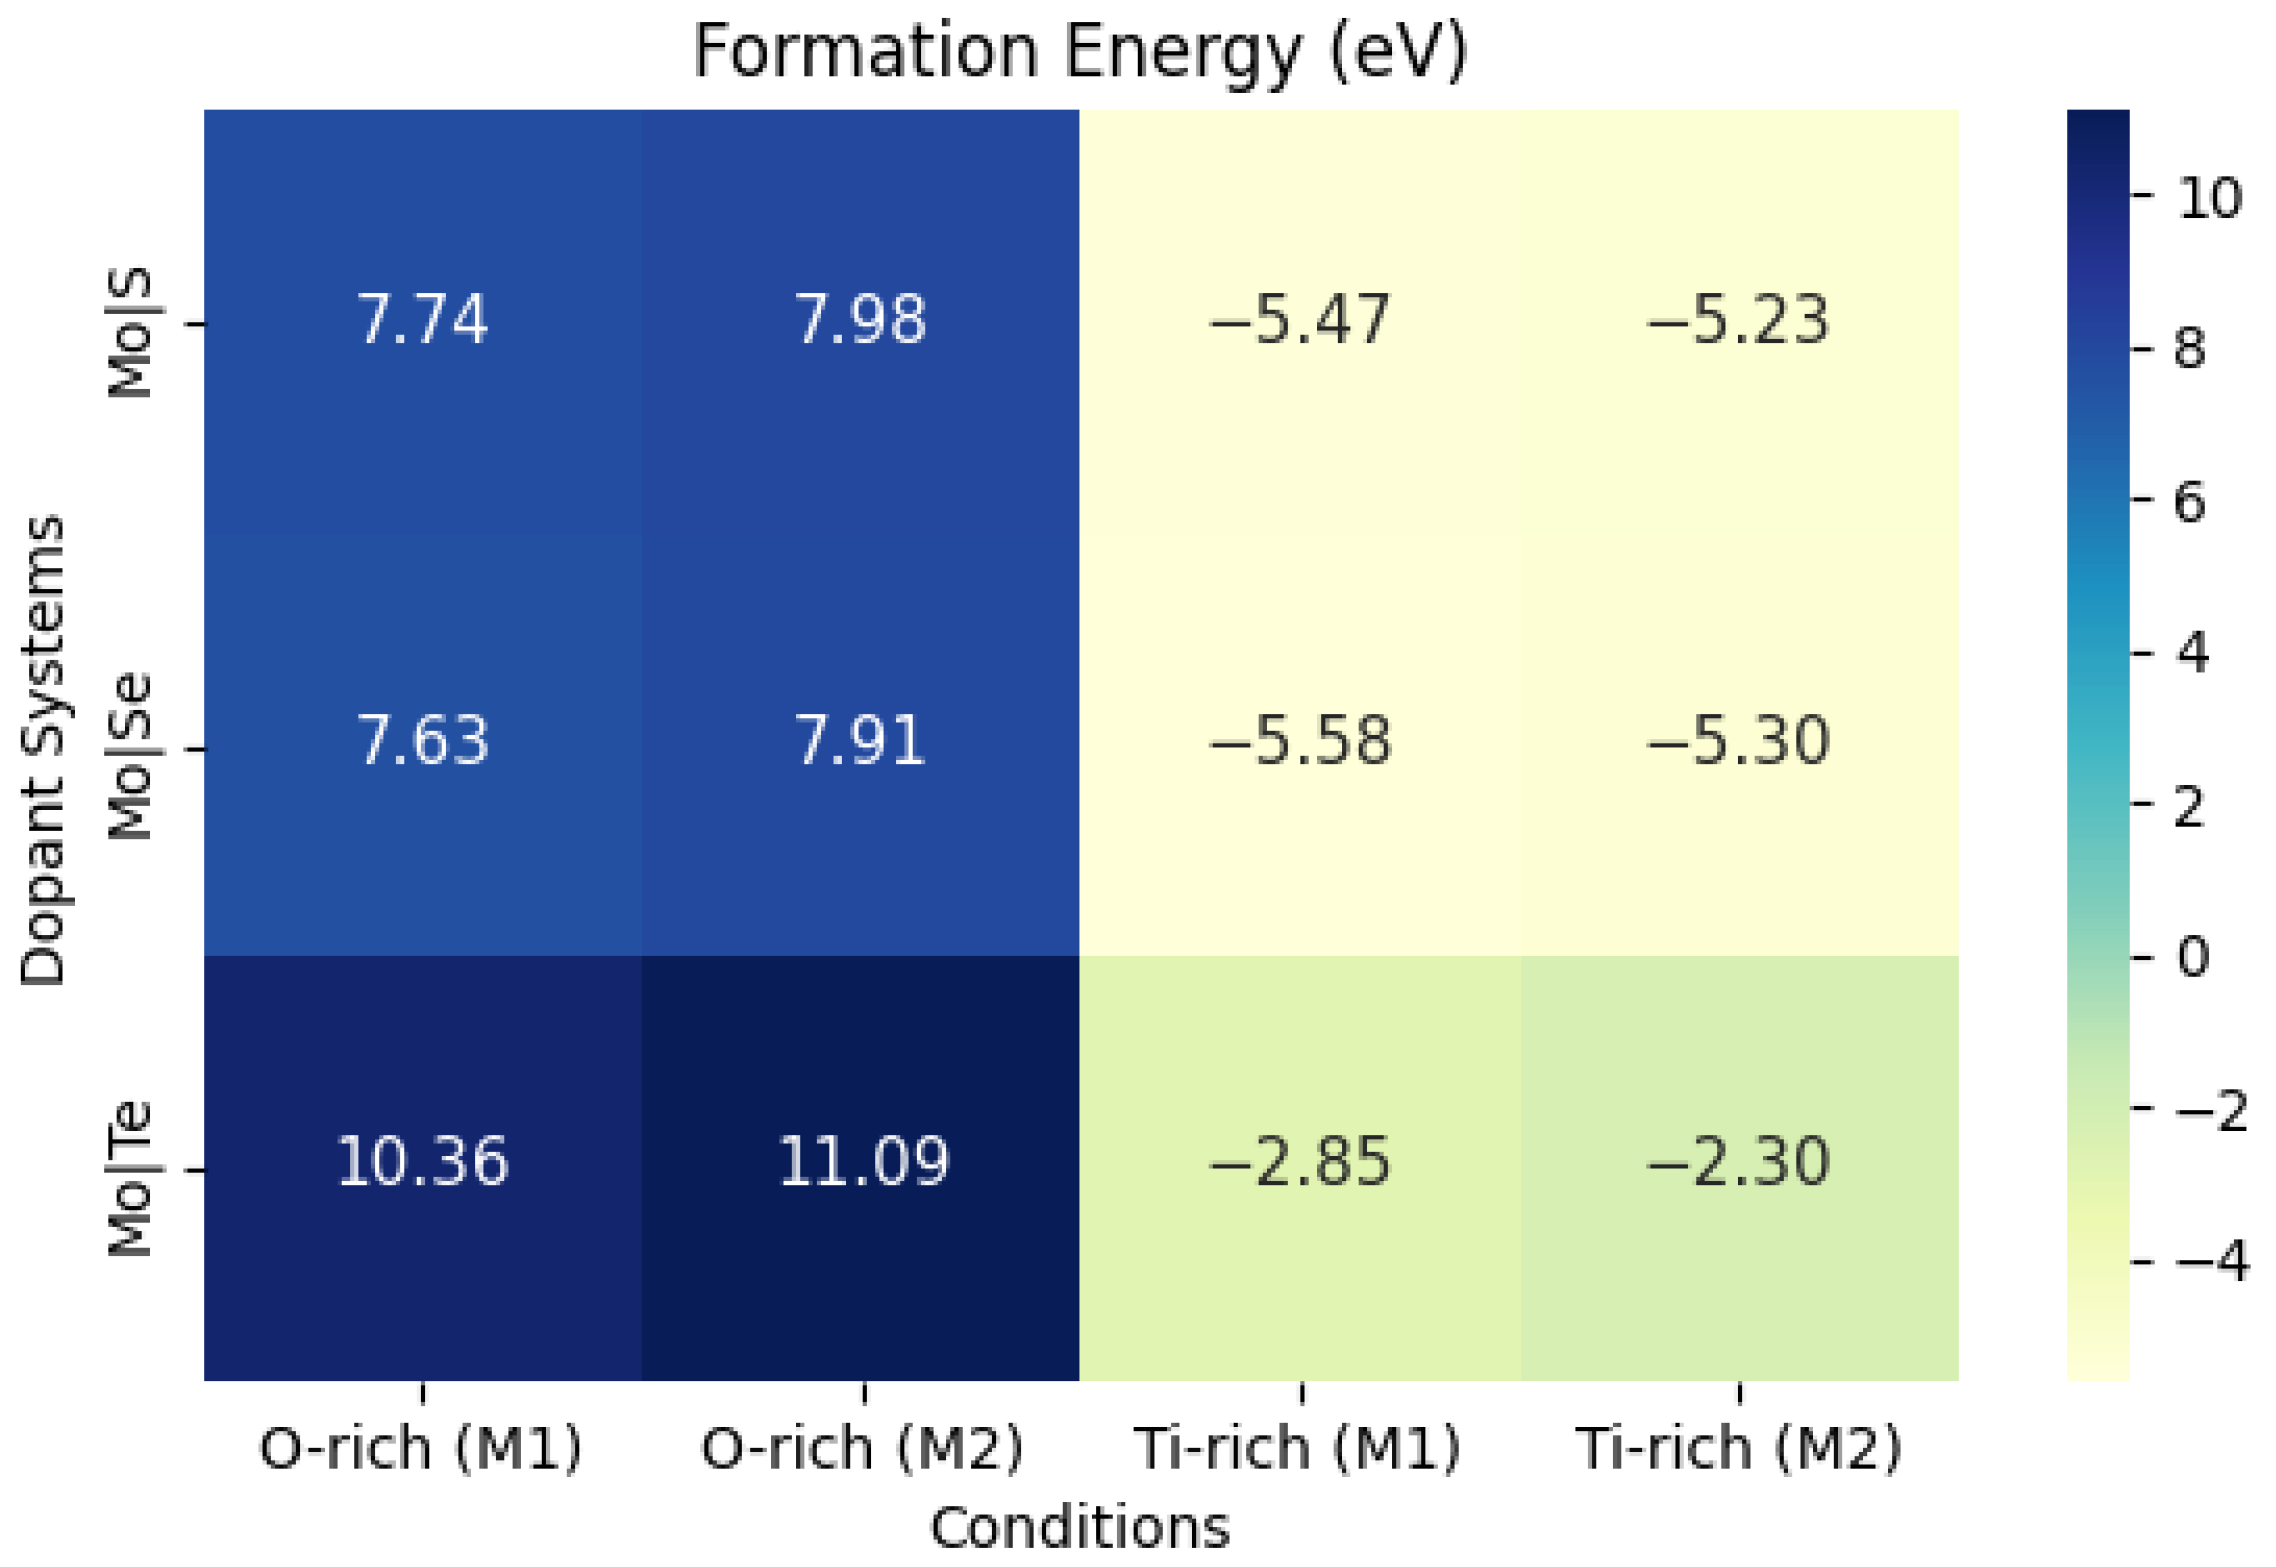
X), where X represents S, Se, and Te, were calculated under ORC, TRC, and in their respective bulk phases. Among these, the chemical potentials under O-rich conditions were found to be stable, and therefore, they were used for further calculations. The formation energies of the dopant elements are calculated using Equation (1) within the GGA approximation and are presented in a heatmap in Figure 4 to convey the precise values. The computed values for Etot [Ti16O32], μO, μTi, and μMo are −423.89, −4.94, −16.64 eV, and −10.95 eV, respectively.
Overall, the results in Figure 4 show that ORC obtained higher positive formation energy values, as under TRC it has negative formation energy values. Under ORC, the formation energy (Ef) values follow almost this order: Mo/Se doping < Mo/S doping < Mo/Te doping. These positive formation energies can be attributed to the significant electronic and structural disruptions caused by the dopants within the TiO2 lattice, which adversely affect the overall stability of the system. Specifically, the incorporation of Mo/Te induces substantial distortion in the TiO2 lattice, and additional energy is required to overcome unfavorable lattice interactions. As a result, higher formation energies are observed. These materials may still be synthesized under specific conditions (e.g., high temperatures or particular partial pressures of gases) that provide the necessary energy for their formation. However, the high formation energy values indicate that while these configurations are theoretically possible, they may not be easily achievable or stable in typical synthesis environments. On the other hand, under TRC conditions, all the formation energies are negative, indicating that the material has a thermodynamically spontaneous tendency to form.
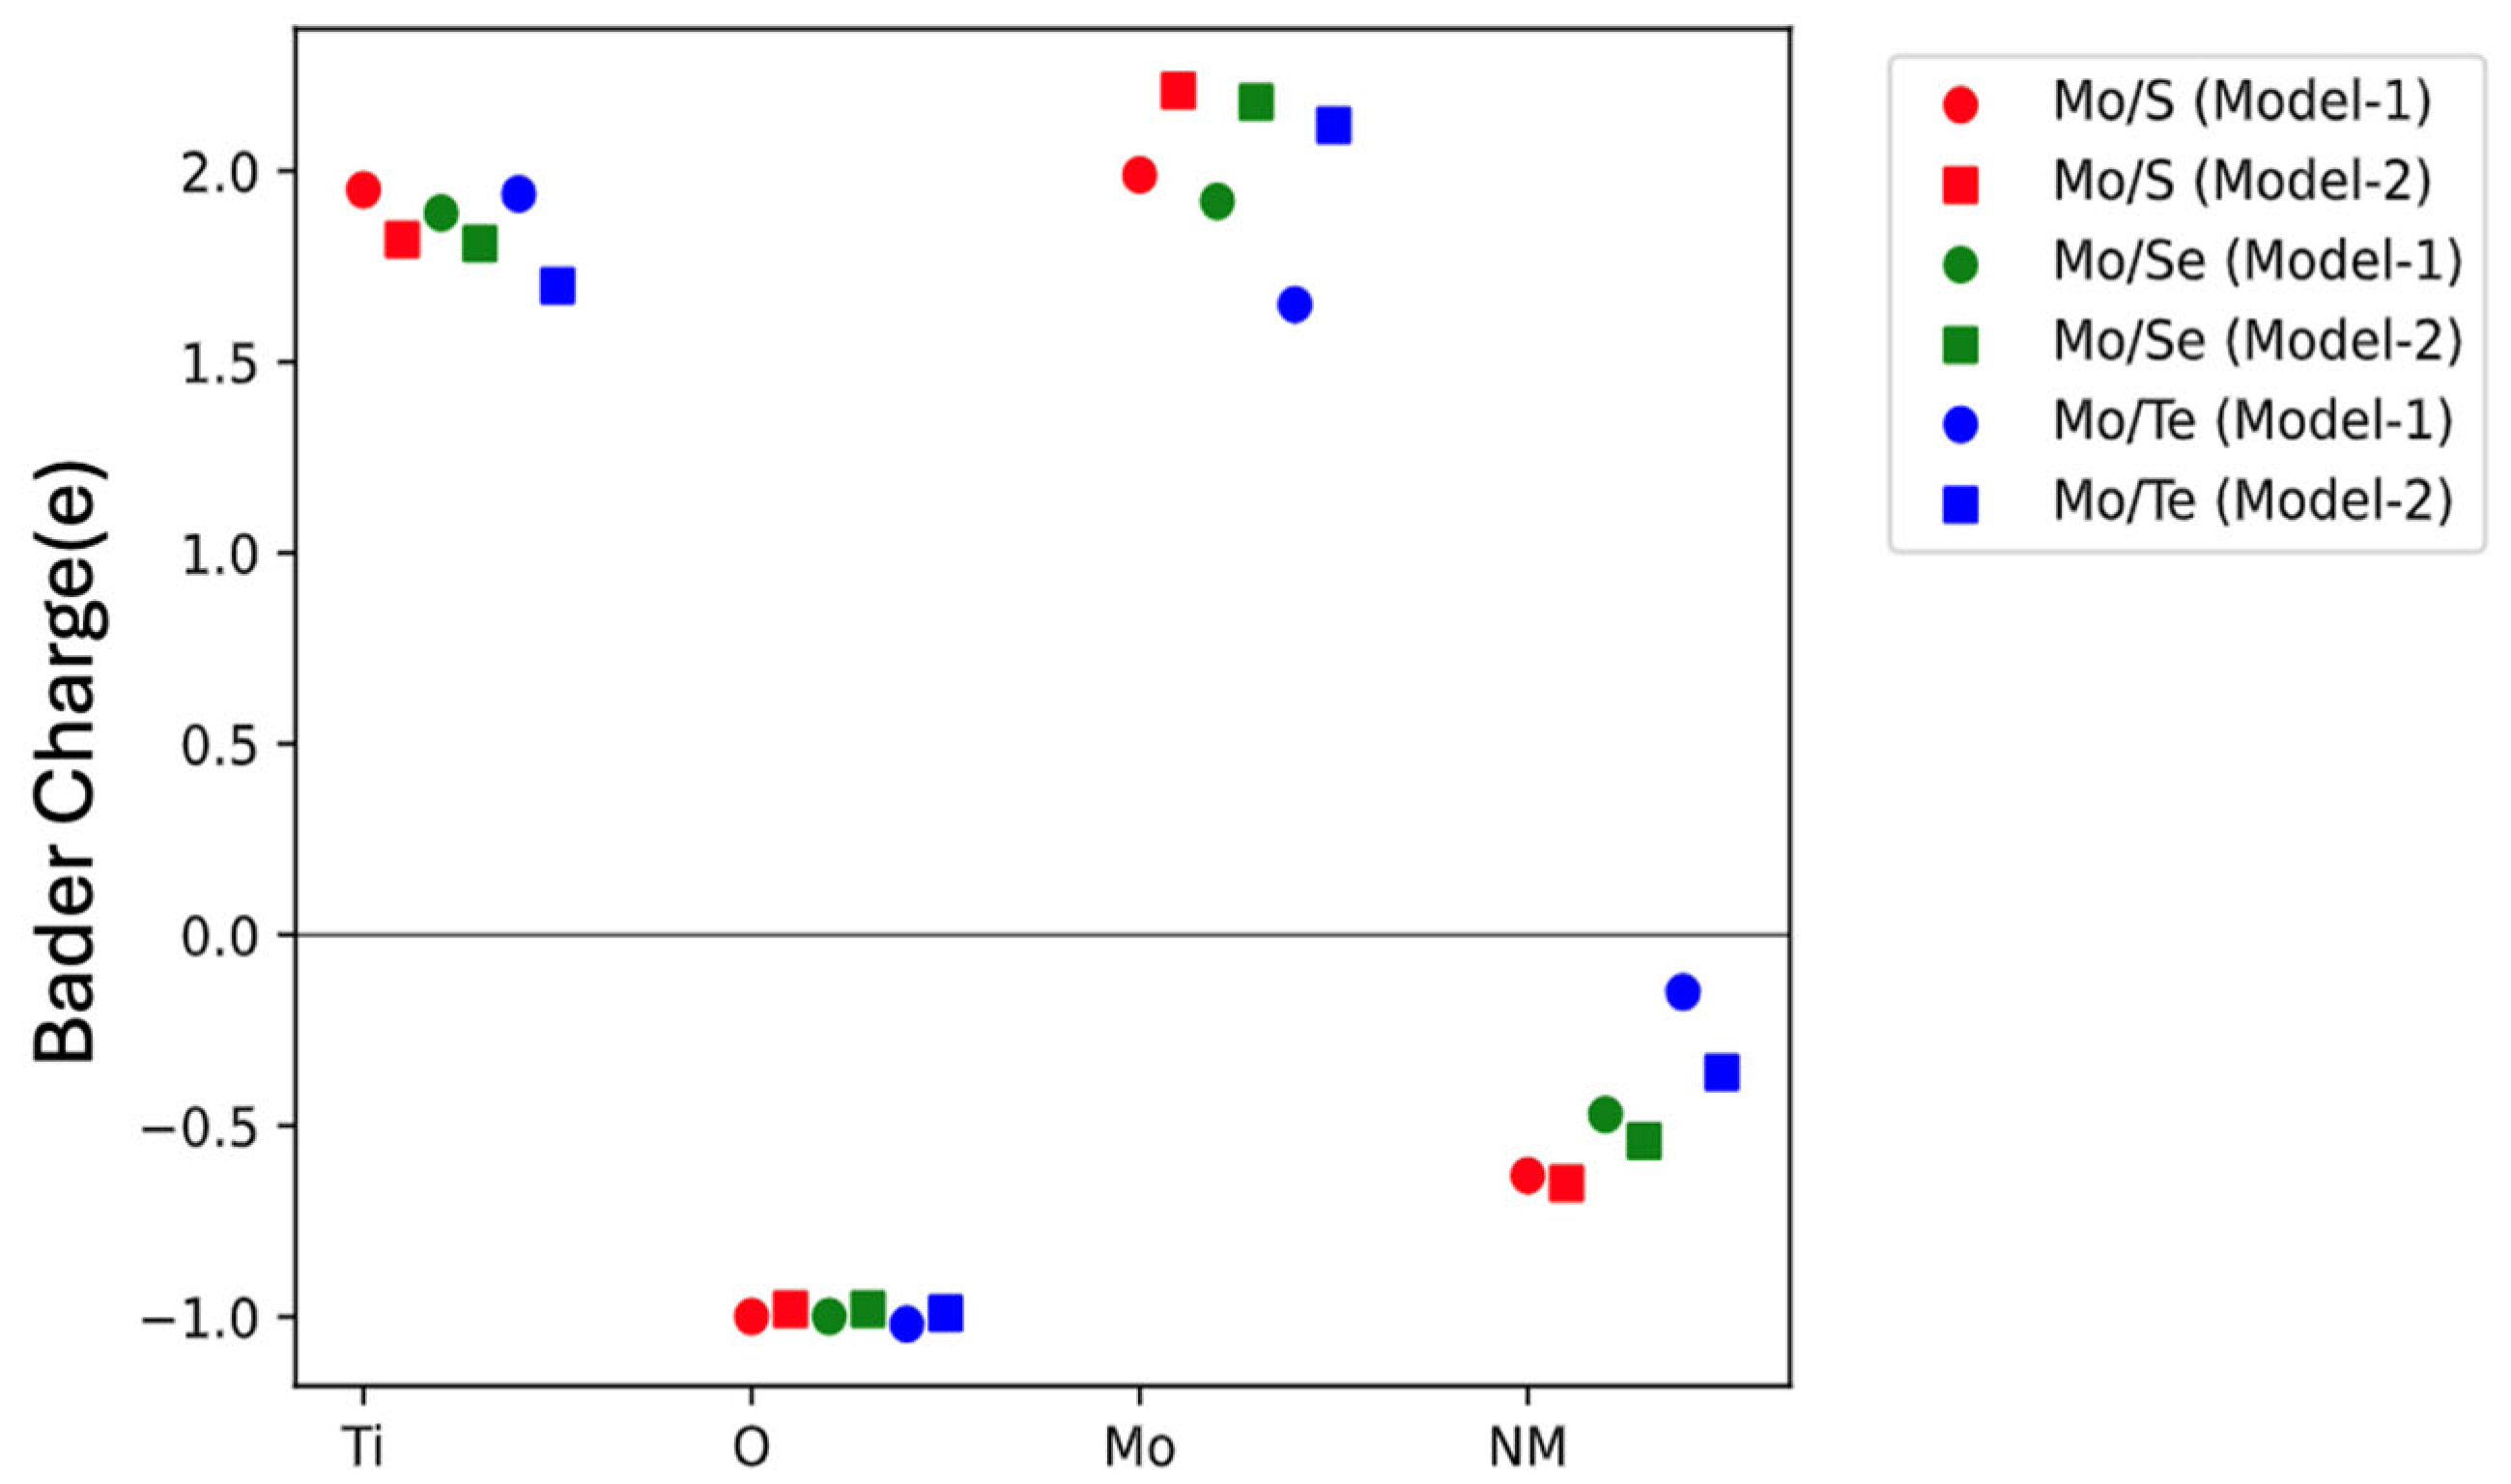
The impact of dopants on the stability of the host material can be understood through Bader charge analysis. As shown in Figure 5, in Section 7 dopants that exhibit more negative Bader charges tend to withdraw more electron density from their surroundings. This strong electron-withdrawing behavior may disrupt the local electronic environment and bonding structure within the host lattice. As a result, such dopants can destabilize the system, which is reflected in their higher formation energies. There are limited previous results available for comparing the formation energies of doped models. However, the co-doped models with other dopants (such as Cr/B and Co/B) exhibit higher positive formation energies rather than lower or negative values [4]. This indicates that the co-doped models have higher formation energies, which are positive rather than negative, suggesting that additional effort is required to form these systems. Furthermore, the high formation energies suggest that these materials may be prone to decomposing back into their constituent phases or transforming into more stable forms under standard conditions. This indicates that the materials may not be practical for certain applications due to the significant energy required to maintain their structures.

5. Electronic Properties

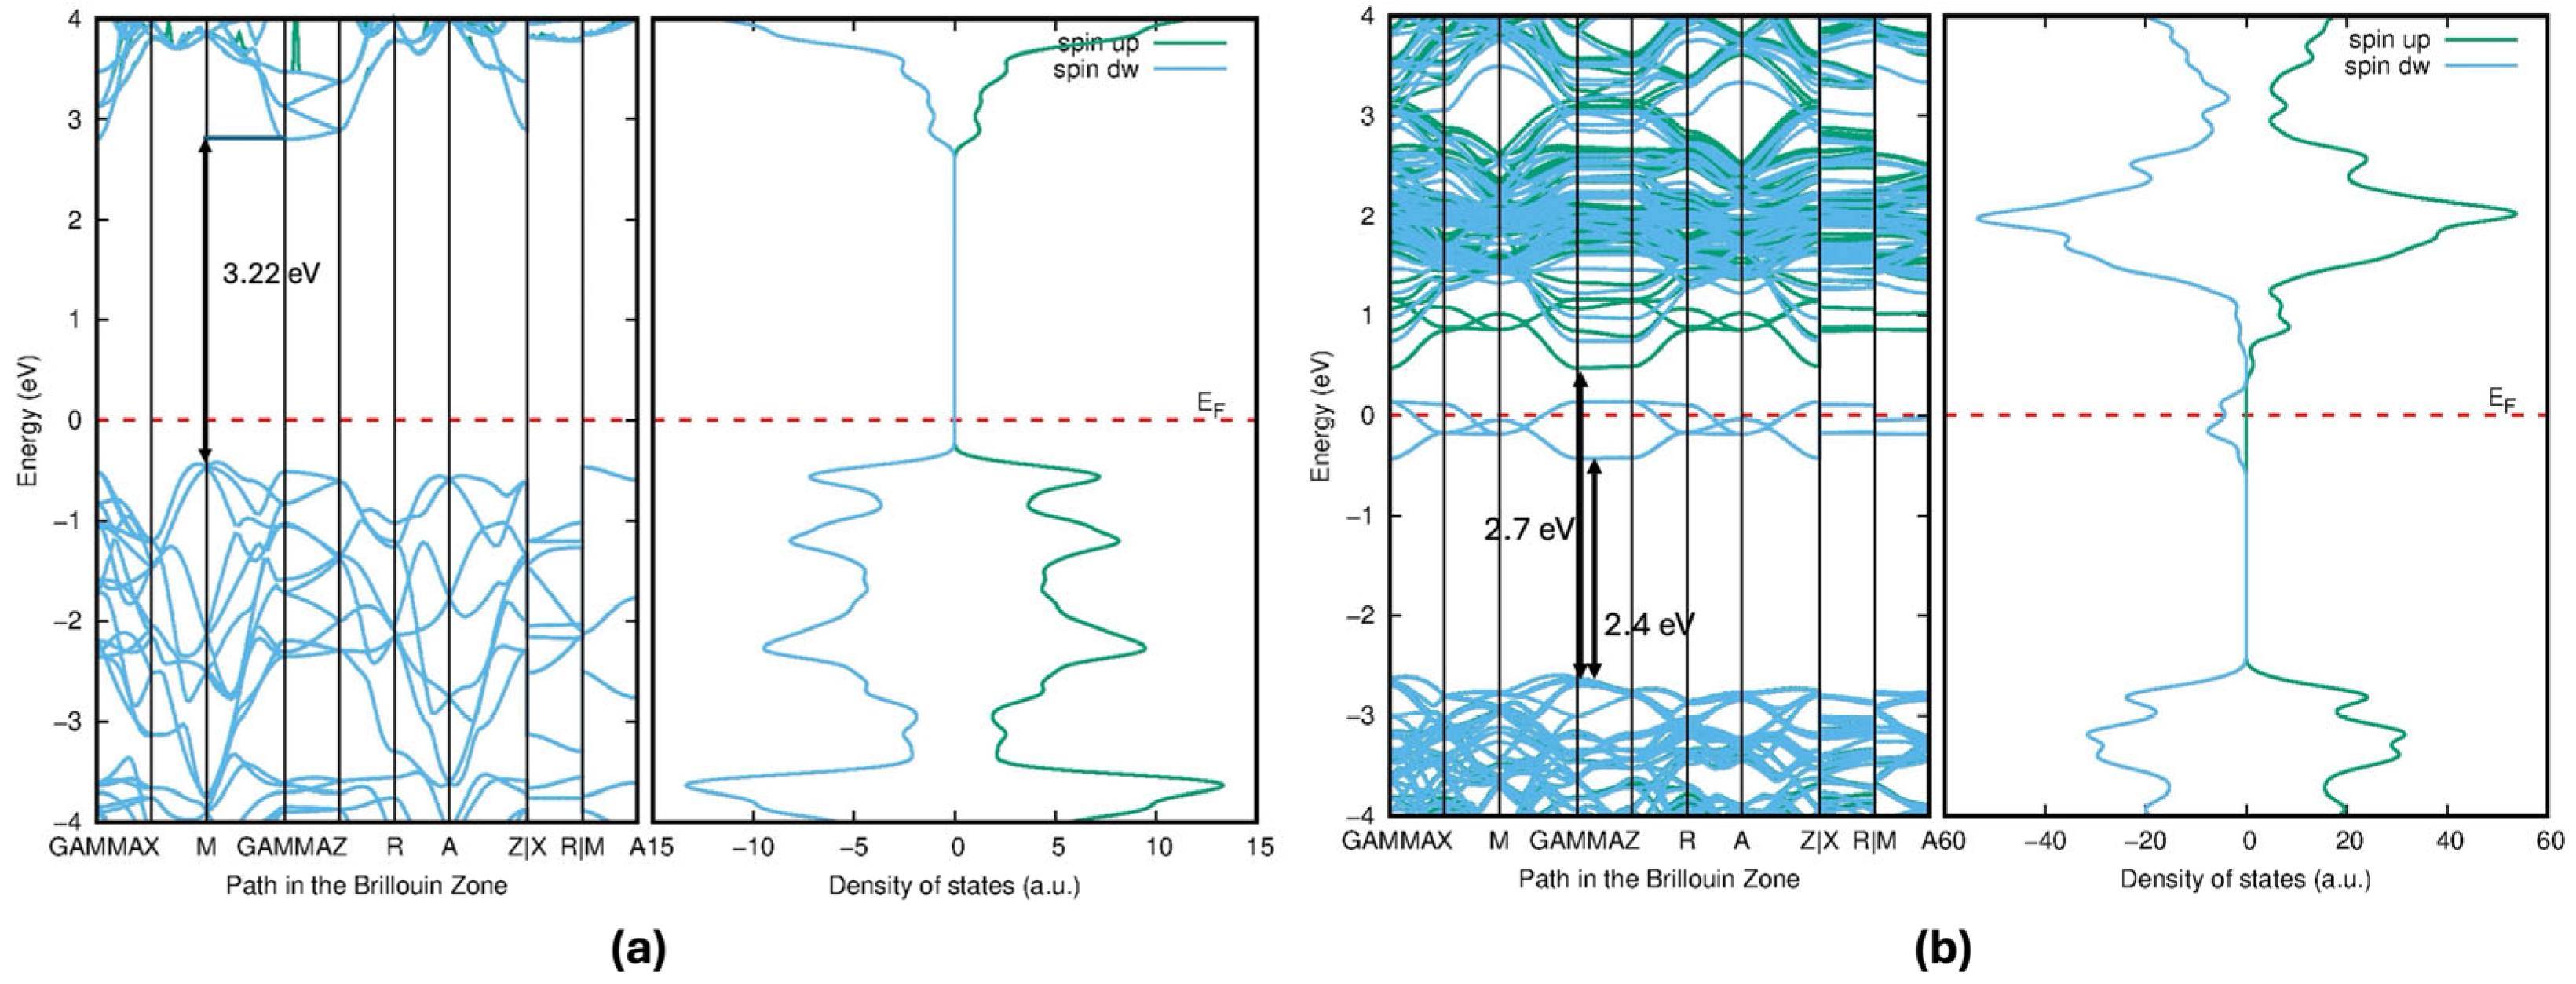
The GGA + U calculation was introduced to obtain values closer to the experimental bandgaps. The pure anatase bandgap value was computed as 3.22 eV, which is almost equal to the experimentally found bandgap value of 3.23 eV [28]. The energy values of the bands are shifted by subtracting the Fermi level from all energy values, effectively setting the Fermi level to 0 in the plot. The band structure in 
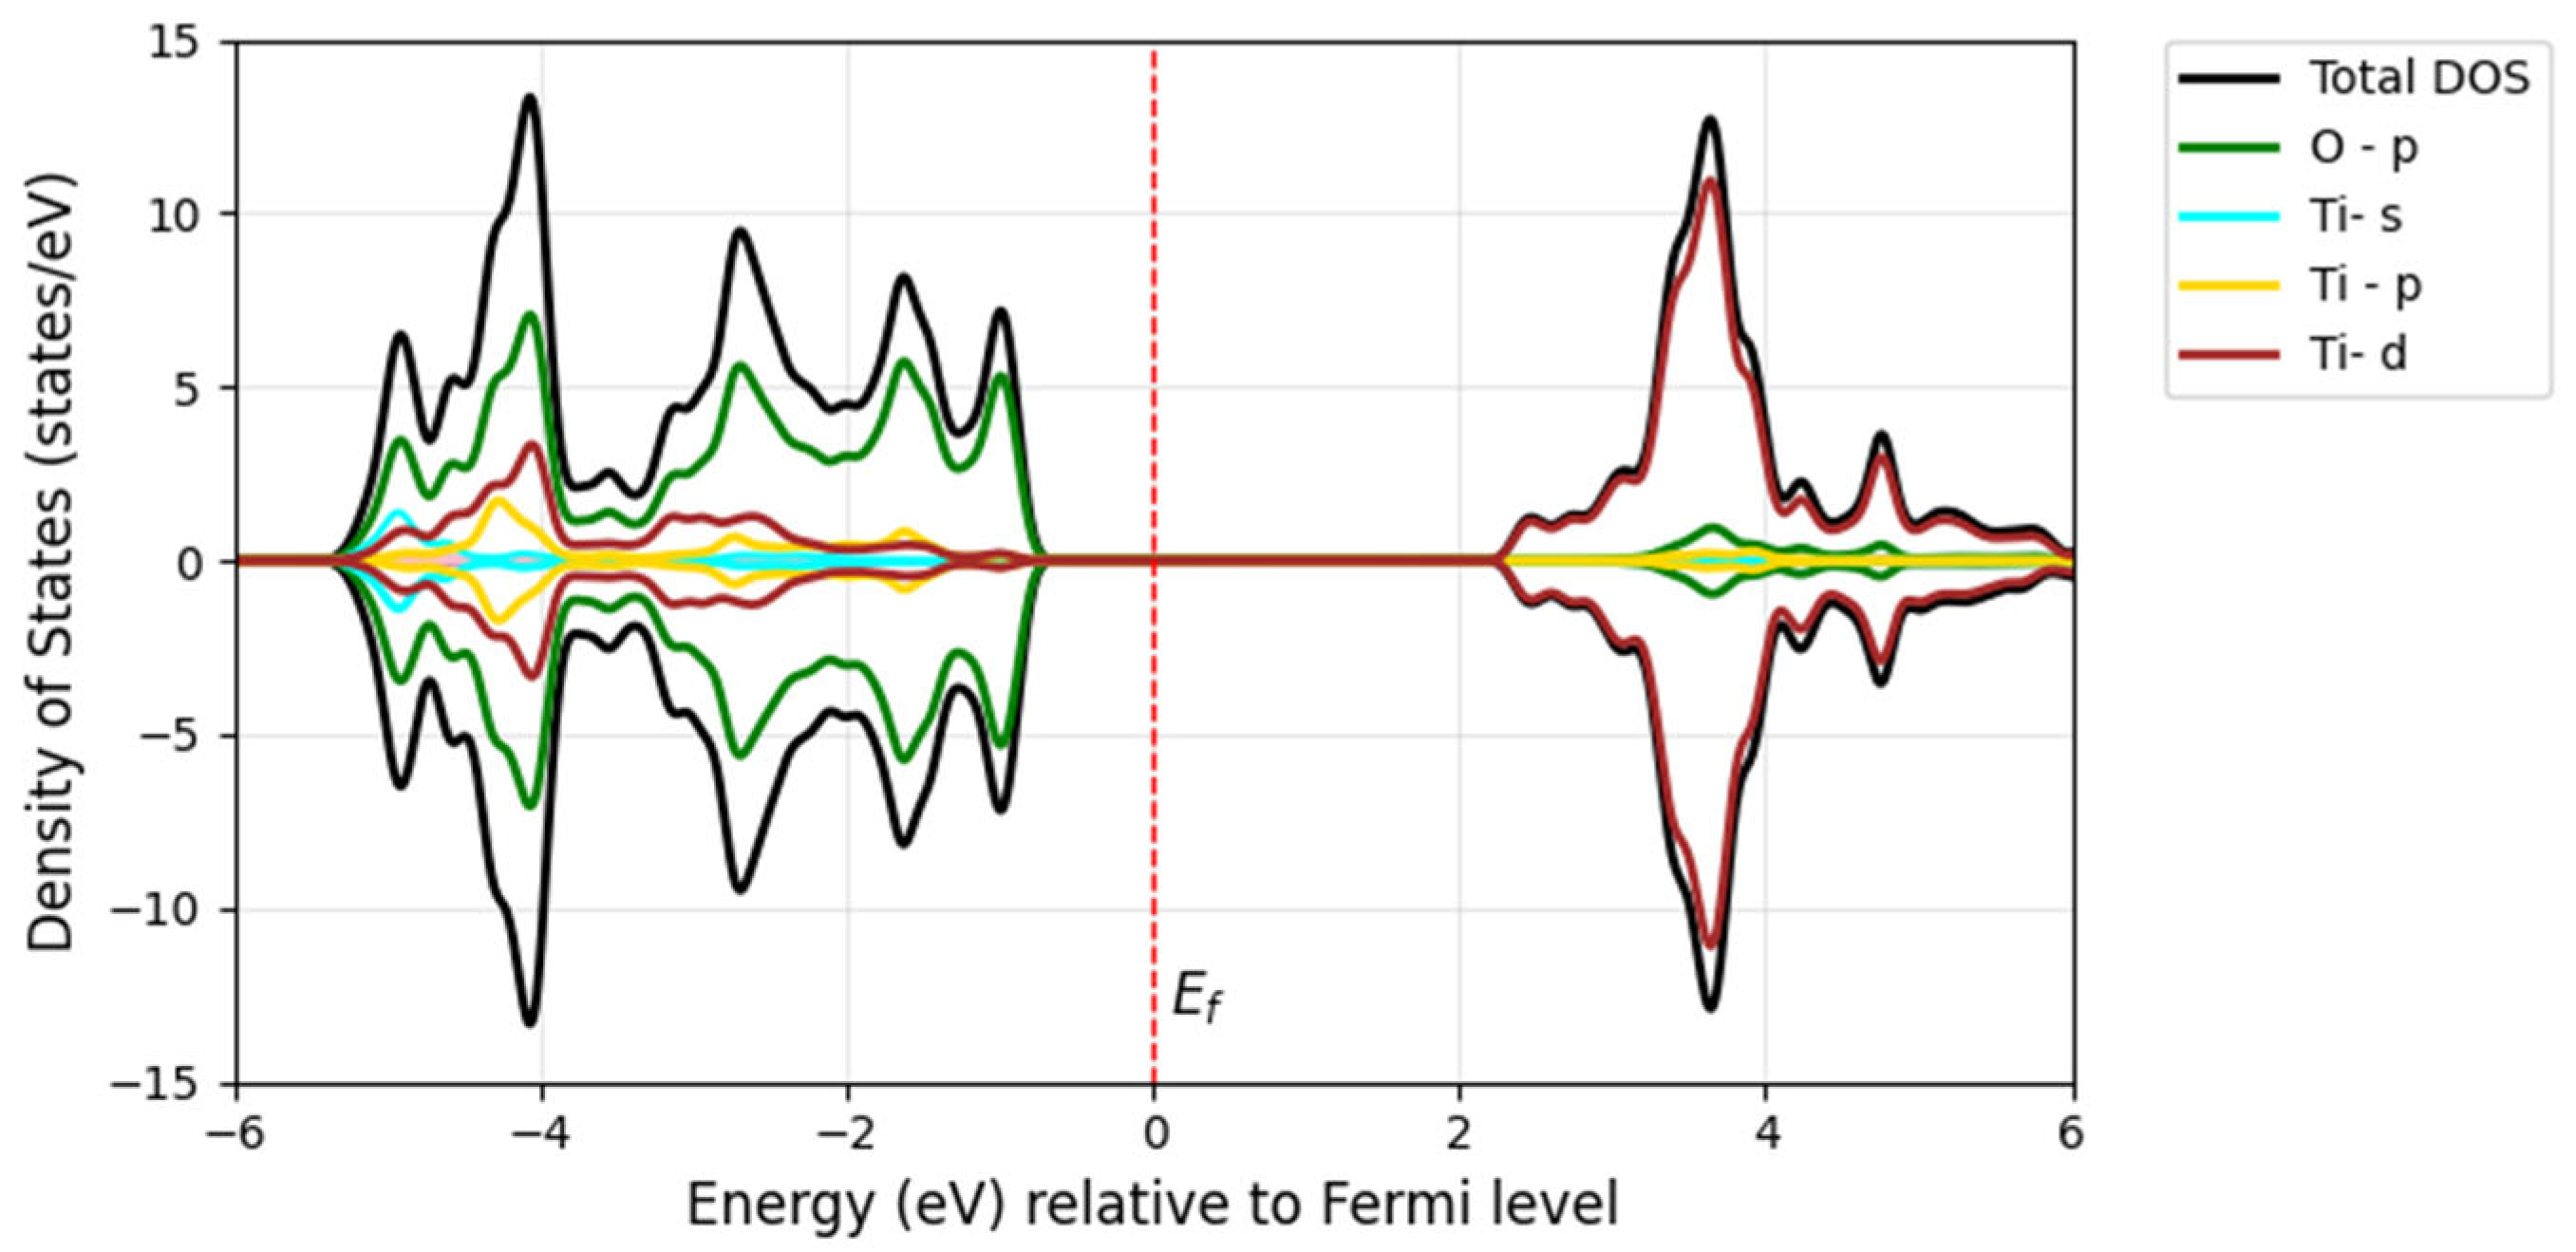
Figure 6a along the high-symmetry directions of the Brillouin zone (BZ) and the density of states (DOS) for the valence band (VB) and conduction band (CB) of a perfect TiO2 crystal are shown in Figure 7. According to Figure 7, the VB and CB are composed of contributions from both the Ti-3d and O-2p orbitals. 
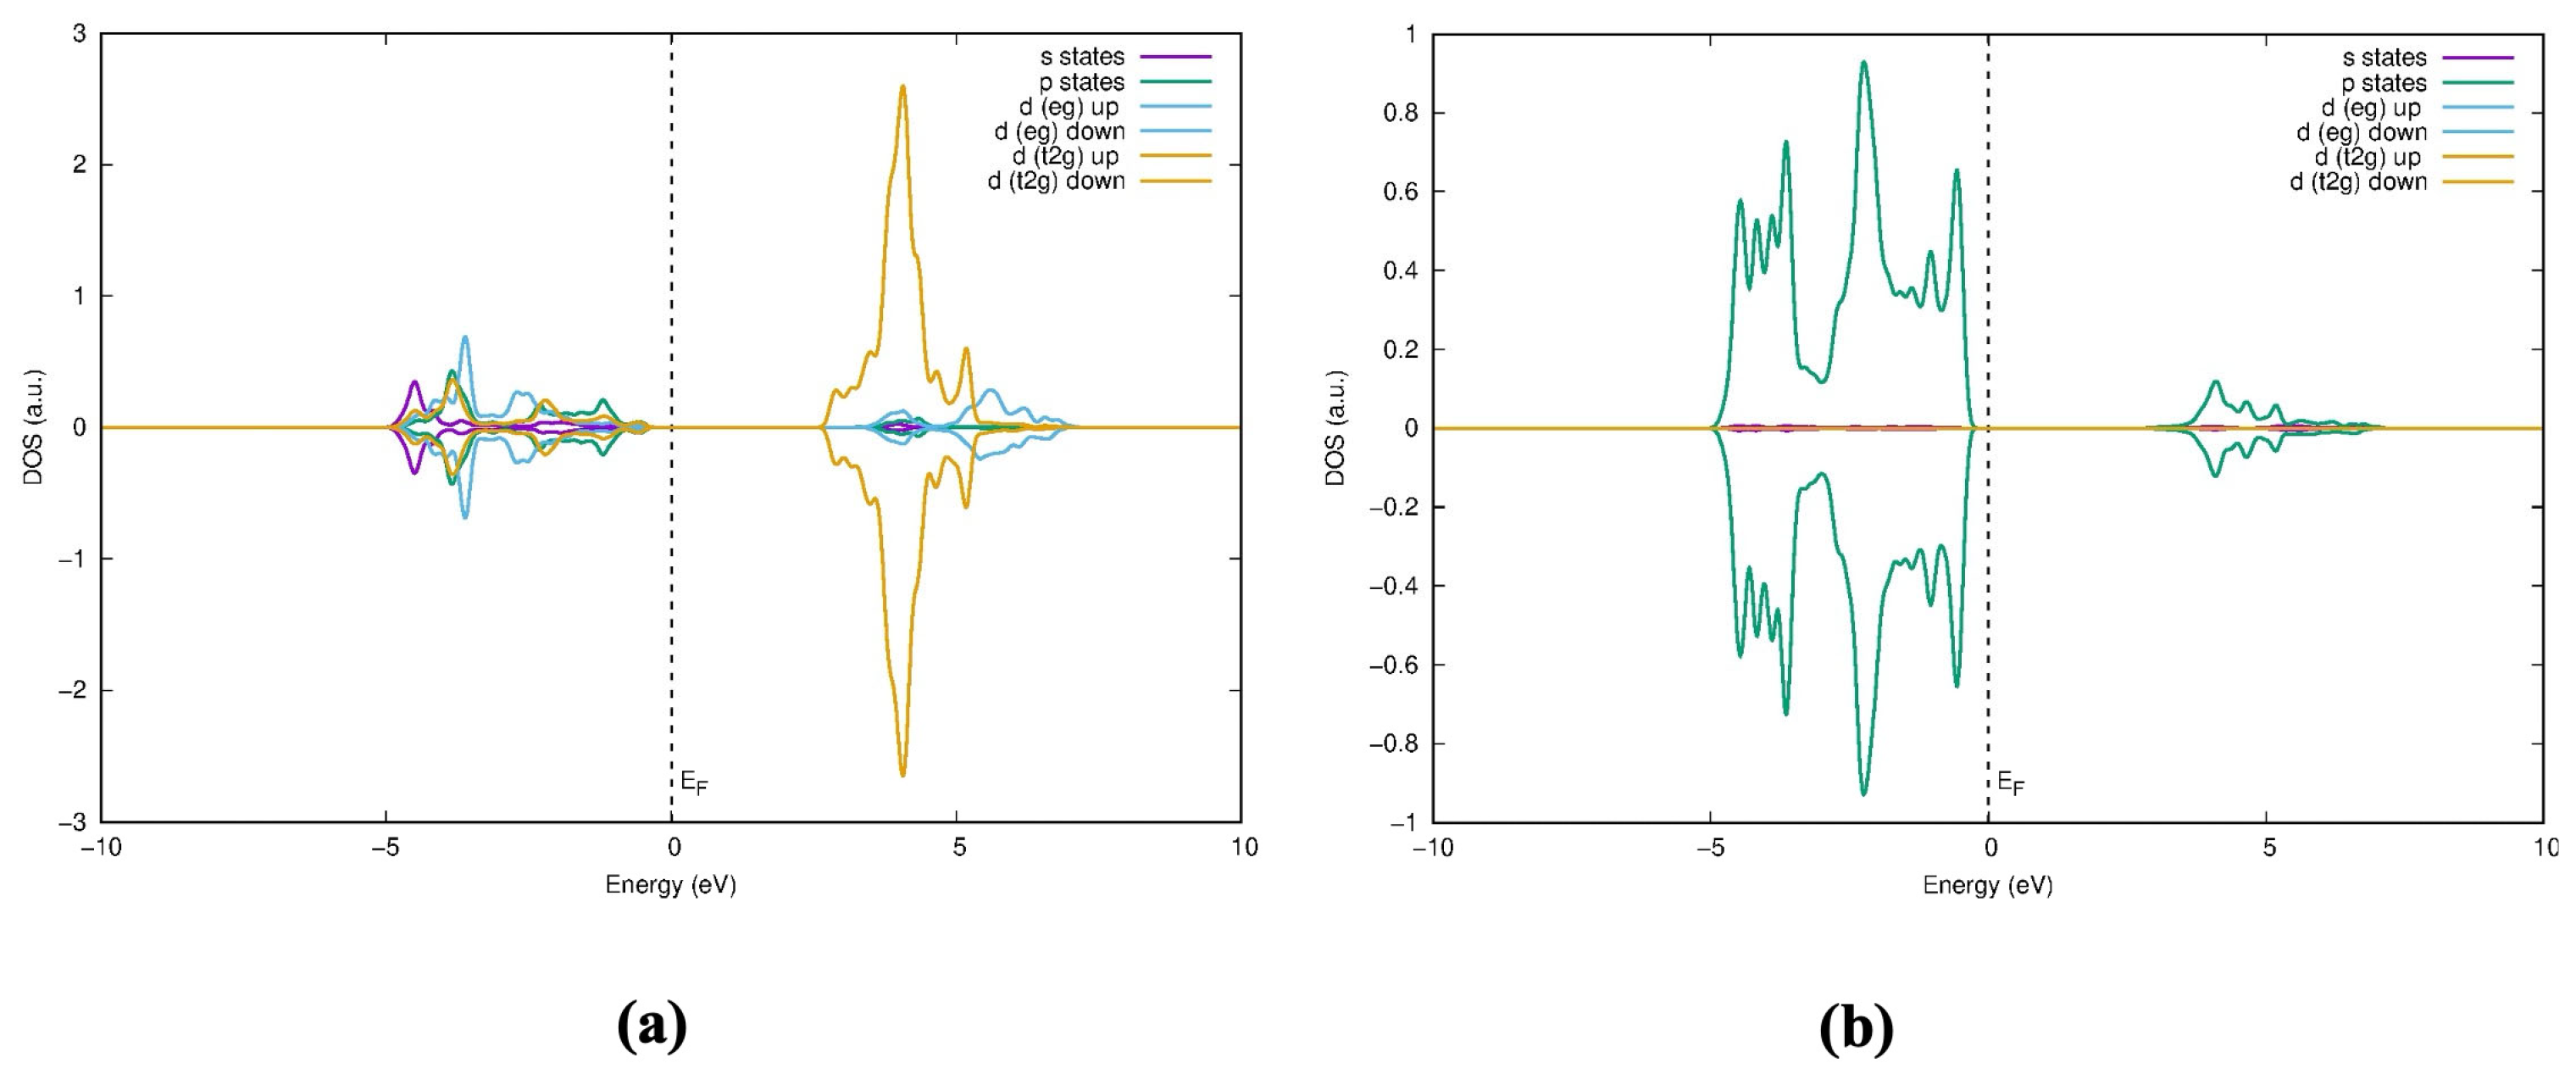
Figure 8 illustrates the decomposition of the TiO2 DOS, where the Ti-3d orbital is split into two components: the t2g and eg states.
In the anatase TiO2 lattice, each titanium (Ti) atom is coordinated with six oxygen (O) atoms in an octahedral arrangement as depicted in Figure 2a. The bonding between the Ti d-orbitals and O p-orbitals can be explained using molecular orbital theory (Figure 9). The Ti eg orbitals, with lobes pointing directly toward the oxygen atoms, form strong σ bonds with the O p orbitals. These highly directional σ bonds play a crucial role in stabilizing the metal–ligand interactions within the lattice. According to Figure 8, VBs are primarily composed of O p and Ti eg states, whereas the CB consists of Ti t2g states. The Ti eg orbitals, which include the dz2 and dx2−y2 orbitals, play a significant role in the CB. In contrast, the Ti t2g orbitals, comprising the dxy, dxz, and dyz orbitals, contribute largely to the CB. The energy bands of pure TiO2 within the groups of bands where the bands are between 0 and −5 eV originate mainly from oxygen 2p orbitals, and the bands above the Fermi energy are dominated by contributions from titanium 3d orbitals. The bonding nature of the conduction and valence bands arises from the hybridization and interaction of these orbitals between the Ti and O atoms, which directly influence the material’s electronic and optical properties.
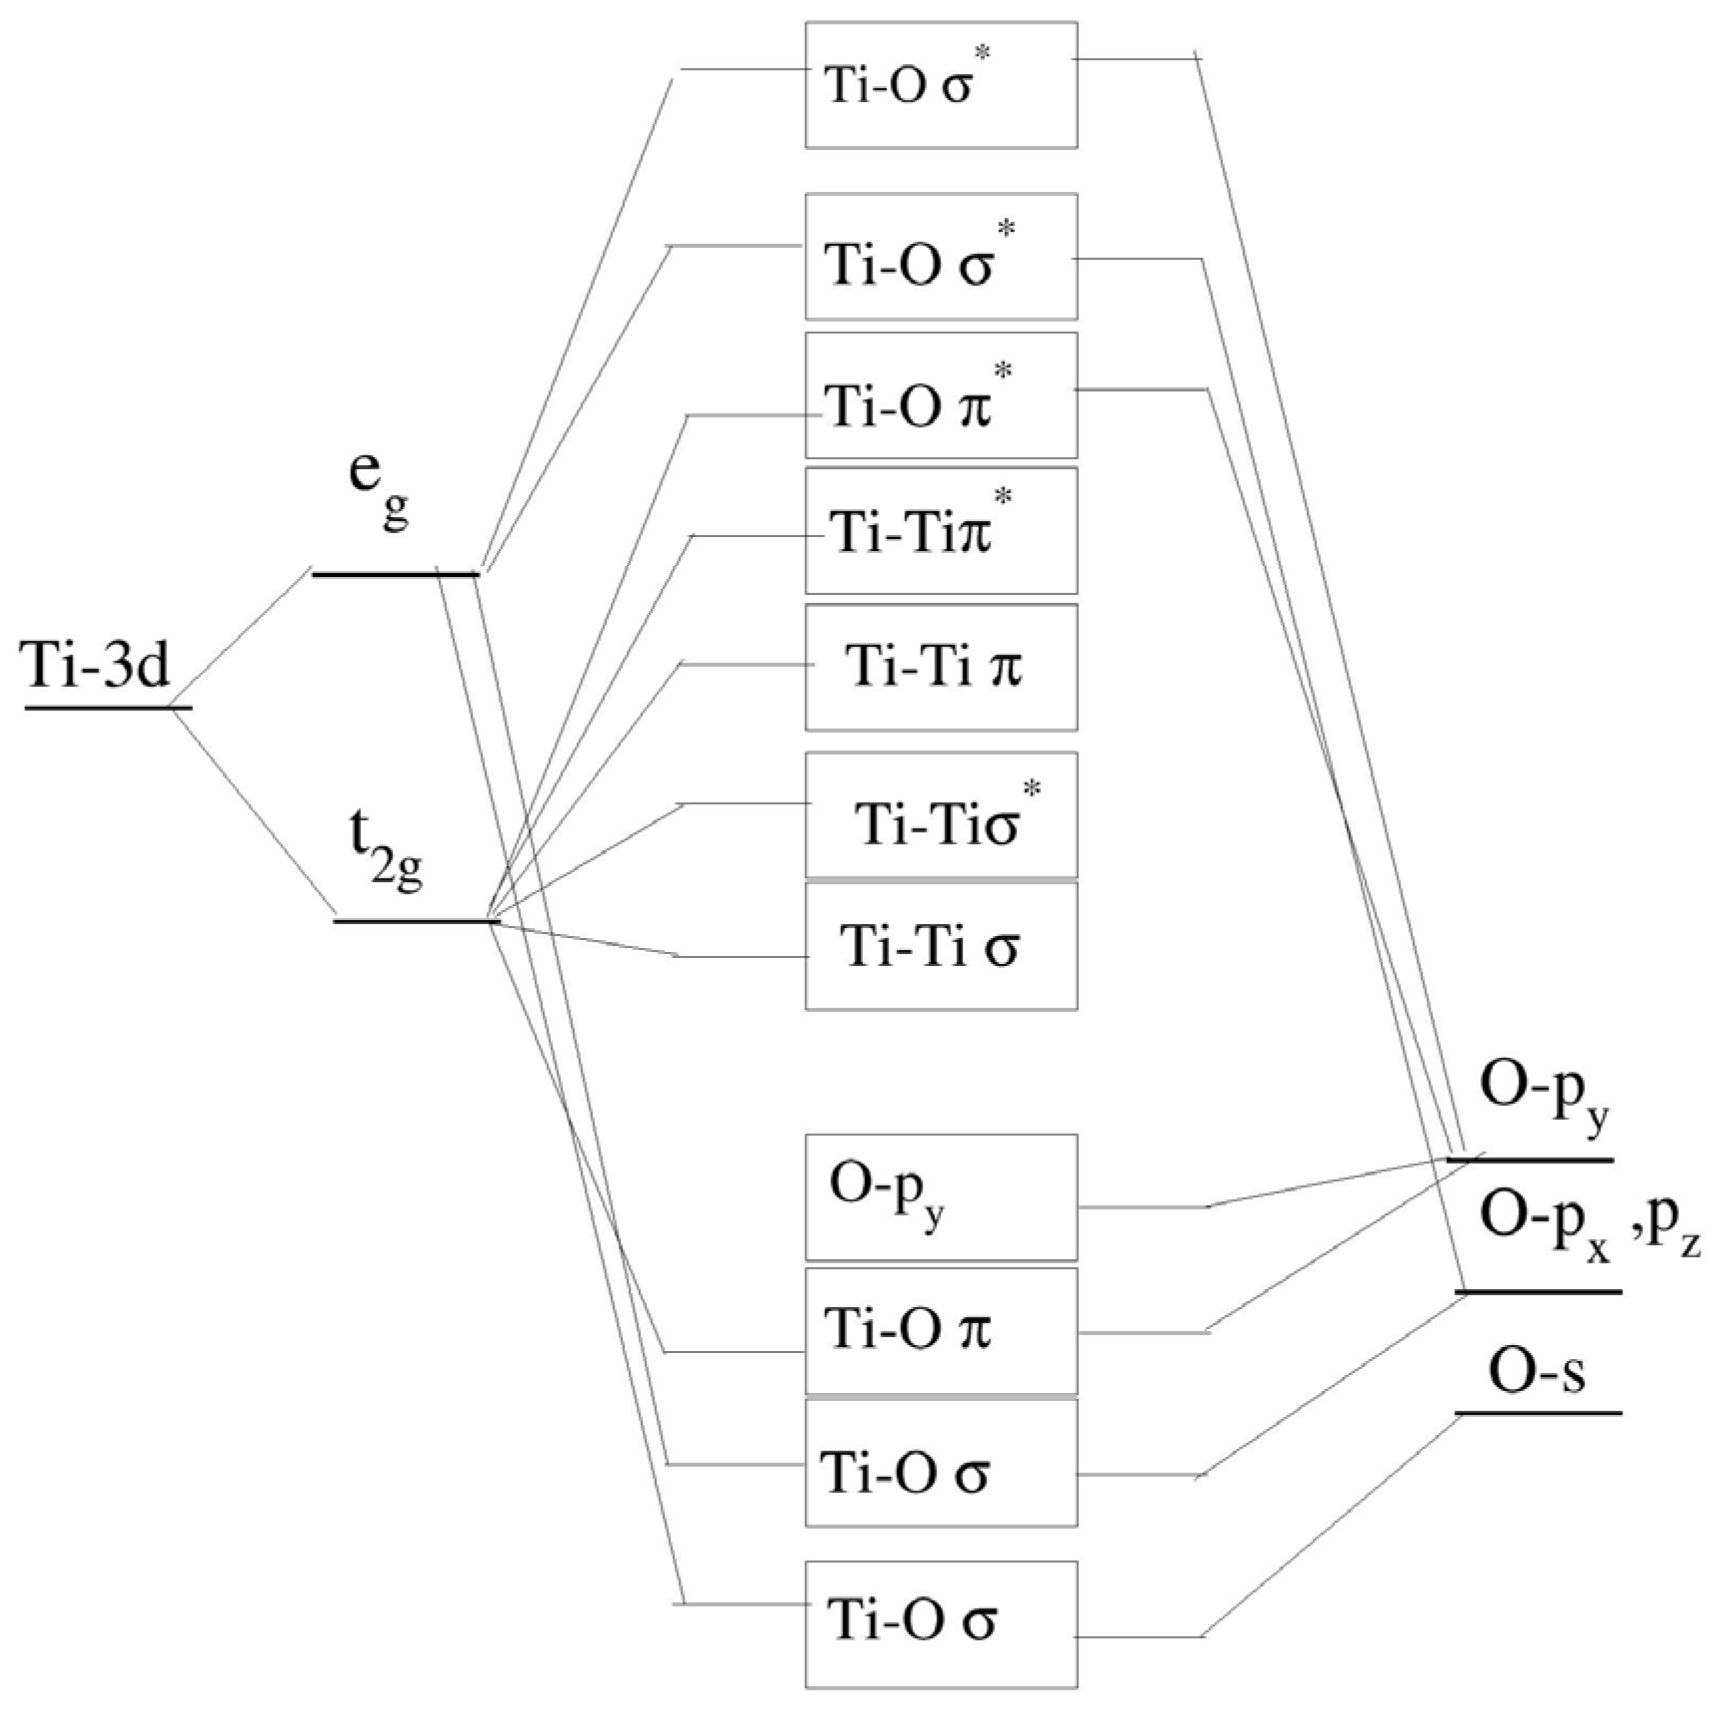
When examining the bonding nature of the conduction band and valence band between the atoms, Soratin and Schwarz provide a detailed description of the molecular orbital diagram [29], where the lower conduction band (CB) consists of the sigma bonding and antibonding interactions of the Ti t2g-Ti t2g states. In the middle of the CB, the remaining Ti t2g states participate in pi bonding and antibonding with Ti t2g-Ti t2g interactions, as well as antibonding interactions between Ti t2g and O py orbitals. The upper CB consists of sigma antibonding interactions between O py and Ti eg states. The valence band (VB) is divided into two regions: the lower-energy region is composed of sigma bonding interactions involving Ti eg and O s, px, and pz orbitals, while the upper region of the VB is primarily made up of O py orbitals and pi-bonding interactions between Ti t2g and O py.
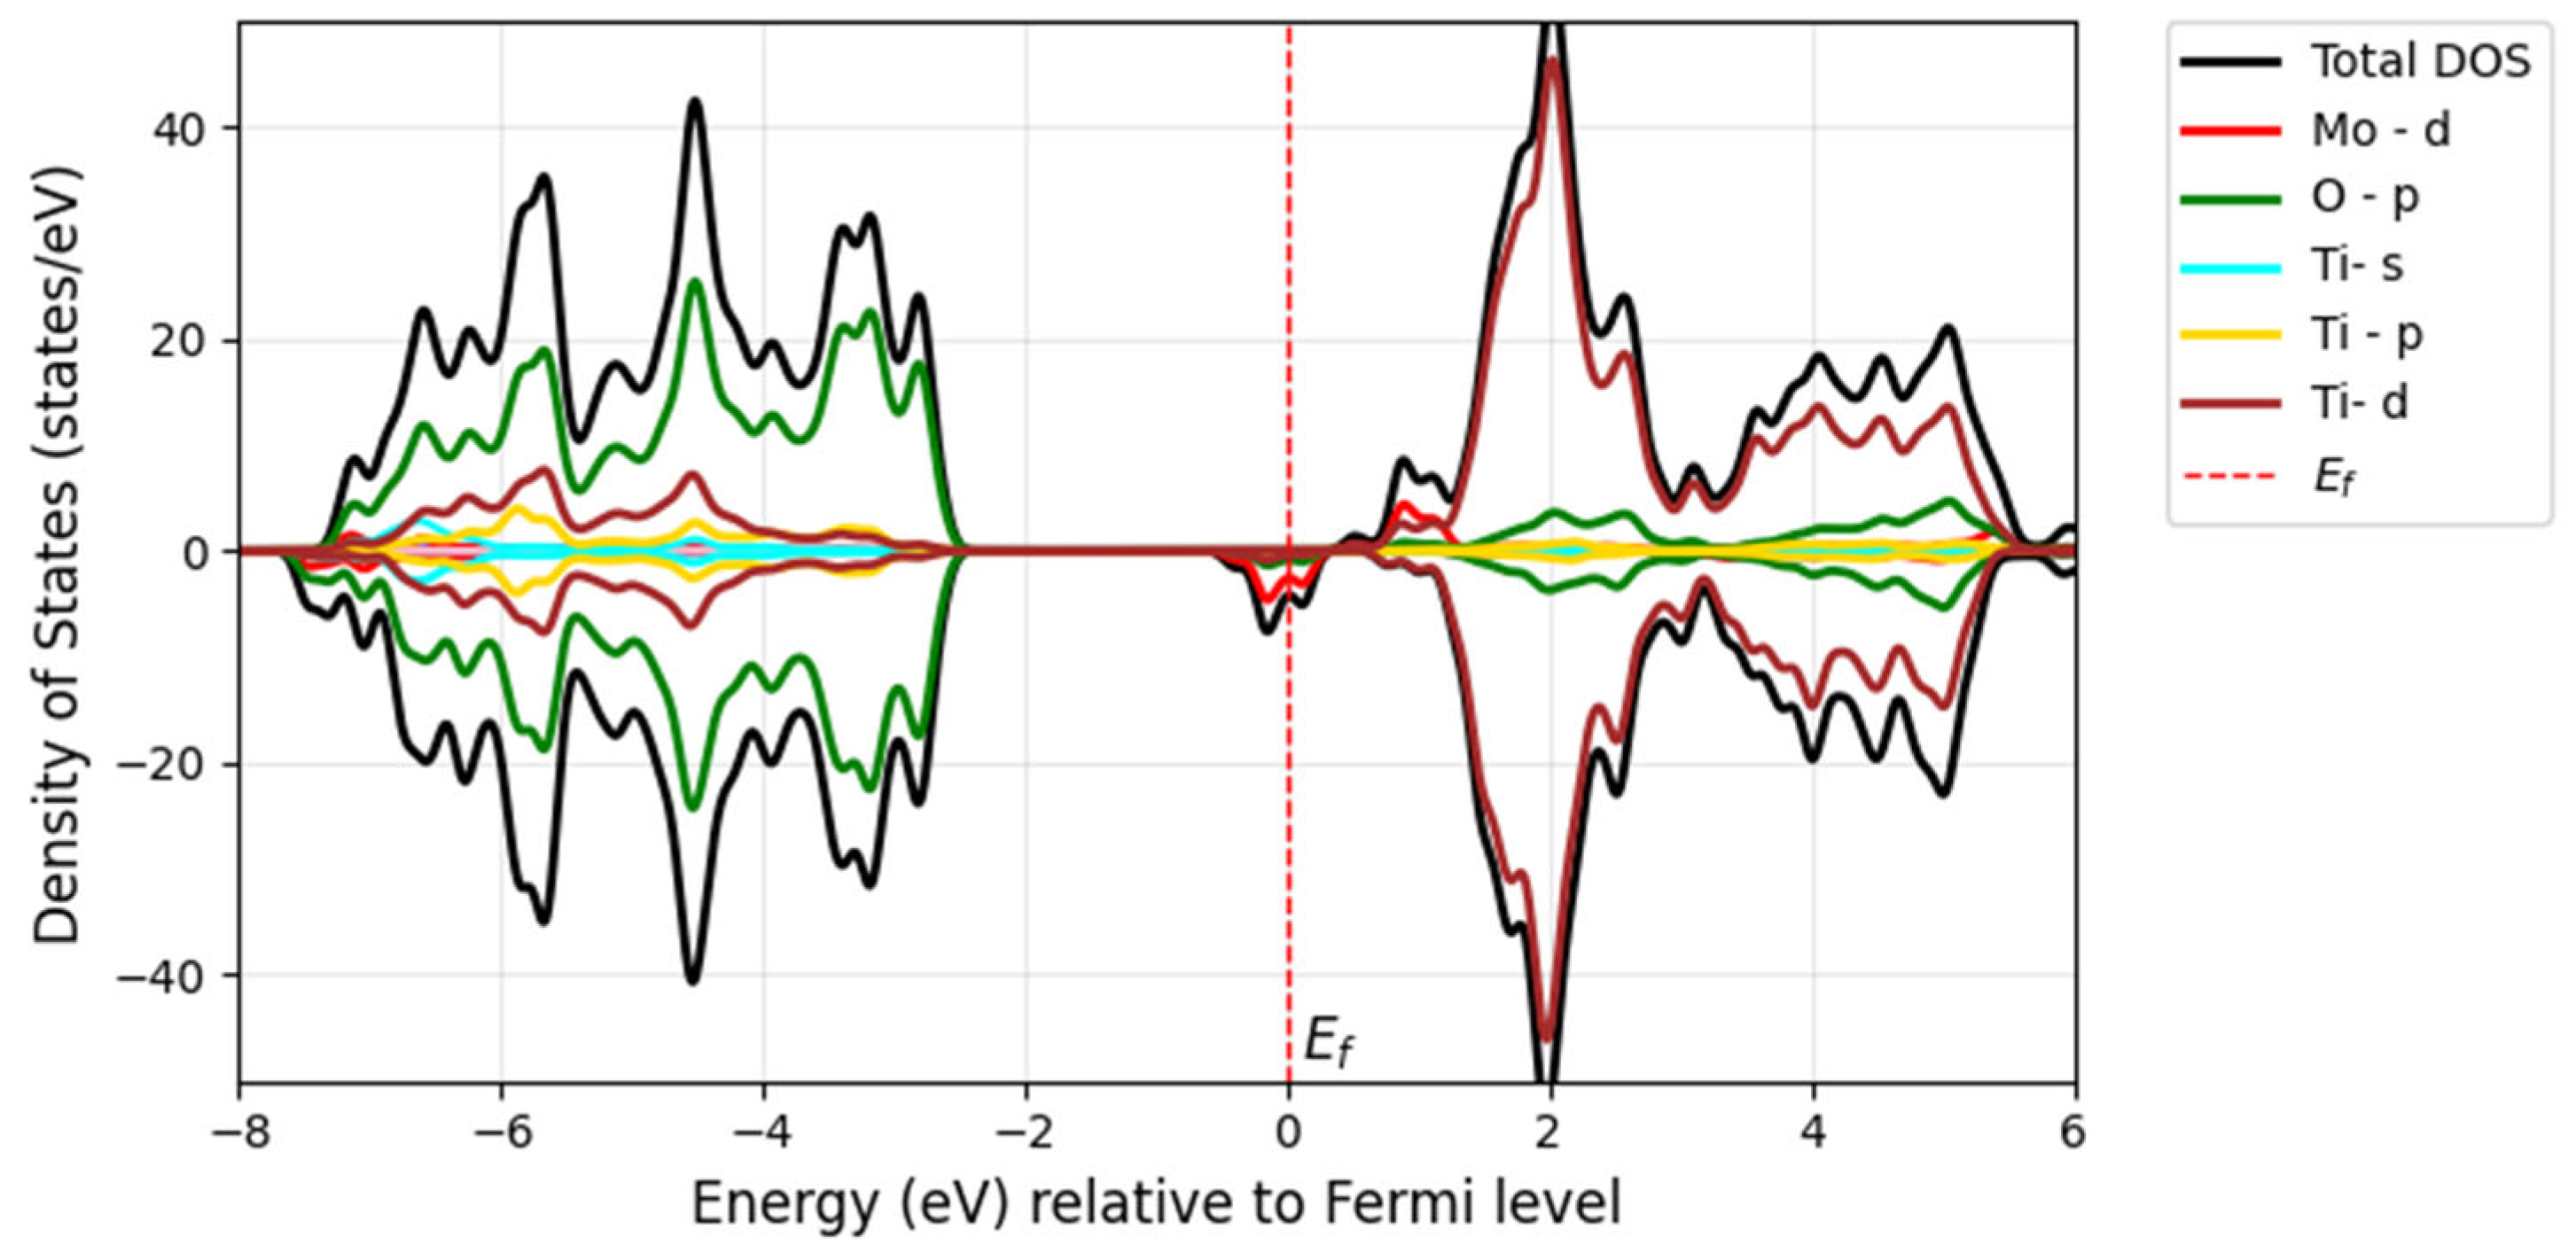
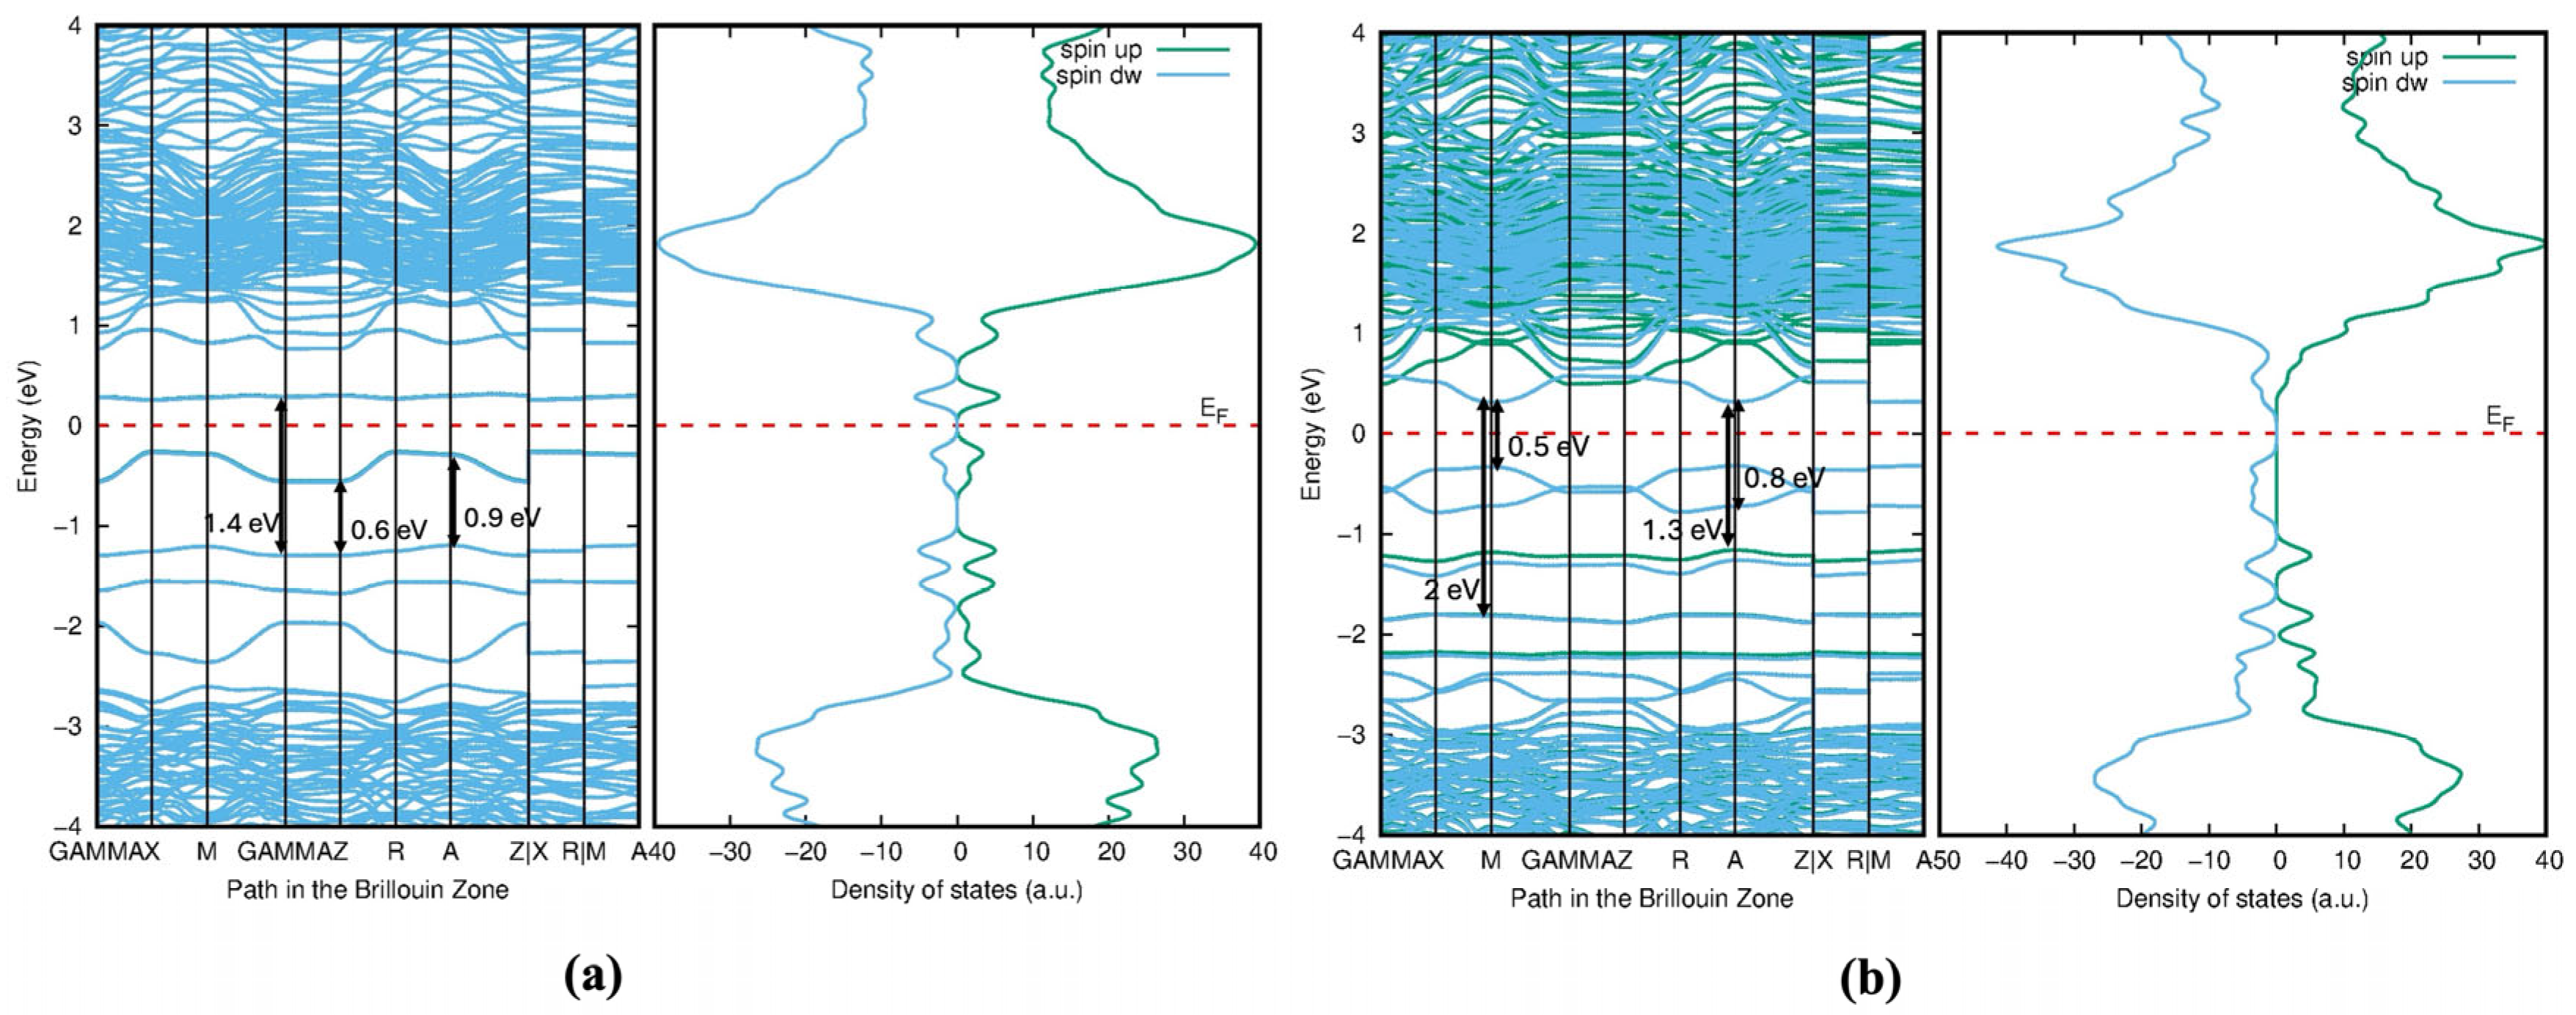
In molybdenum-doped TiO2, molybdenum, which has more valence electrons than titanium, creates defect states within the bandgap, leading to the formation of intermediate bands (IBs). These intermediate states arise from Mo-4d states and are localized at the conduction band, as shown in Figure 10. According to Figure 6b, the impurity states act as shallow donor states at the Fermi level (indicated by the red dashed line), exhibiting half-metallic ferromagnetic behavior, metallic in the spin-down channel but semiconducting in the spin-up channel in the band diagram. In the Mo-doped model, the bandgap was reduced by 2.7 eV compared with the pure compound of 3.22 eV, and the reduction was about 0.52 eV. These states extend into the conduction band, contributing to the reduction in the bandgap in pristine TiO2. This bandgap reduction occurs due to the hybridization of Mo-4d and Ti-3d states. Soussi et al. analyzed the electronic structure of TiO2 with varying concentrations of Mo doping. Their findings revealed that, in all cases, the Fermi level shifted into the conduction band, indicating n-type metallic doping behavior [30]. This reduction in the bandgap is able to shift the absorption edge to the visible light region, which is good for the optical absorption efficiency. Thus, it could enhance photocatalytic efficiency. Experimentally proved, Mo-doped TiO2 nano powders were synthesized, significantly enhancing light absorption, even in the visible light range, and the photocatalytic activity of the synthesized TiO2 nano powders was improved by Mo doping [31].
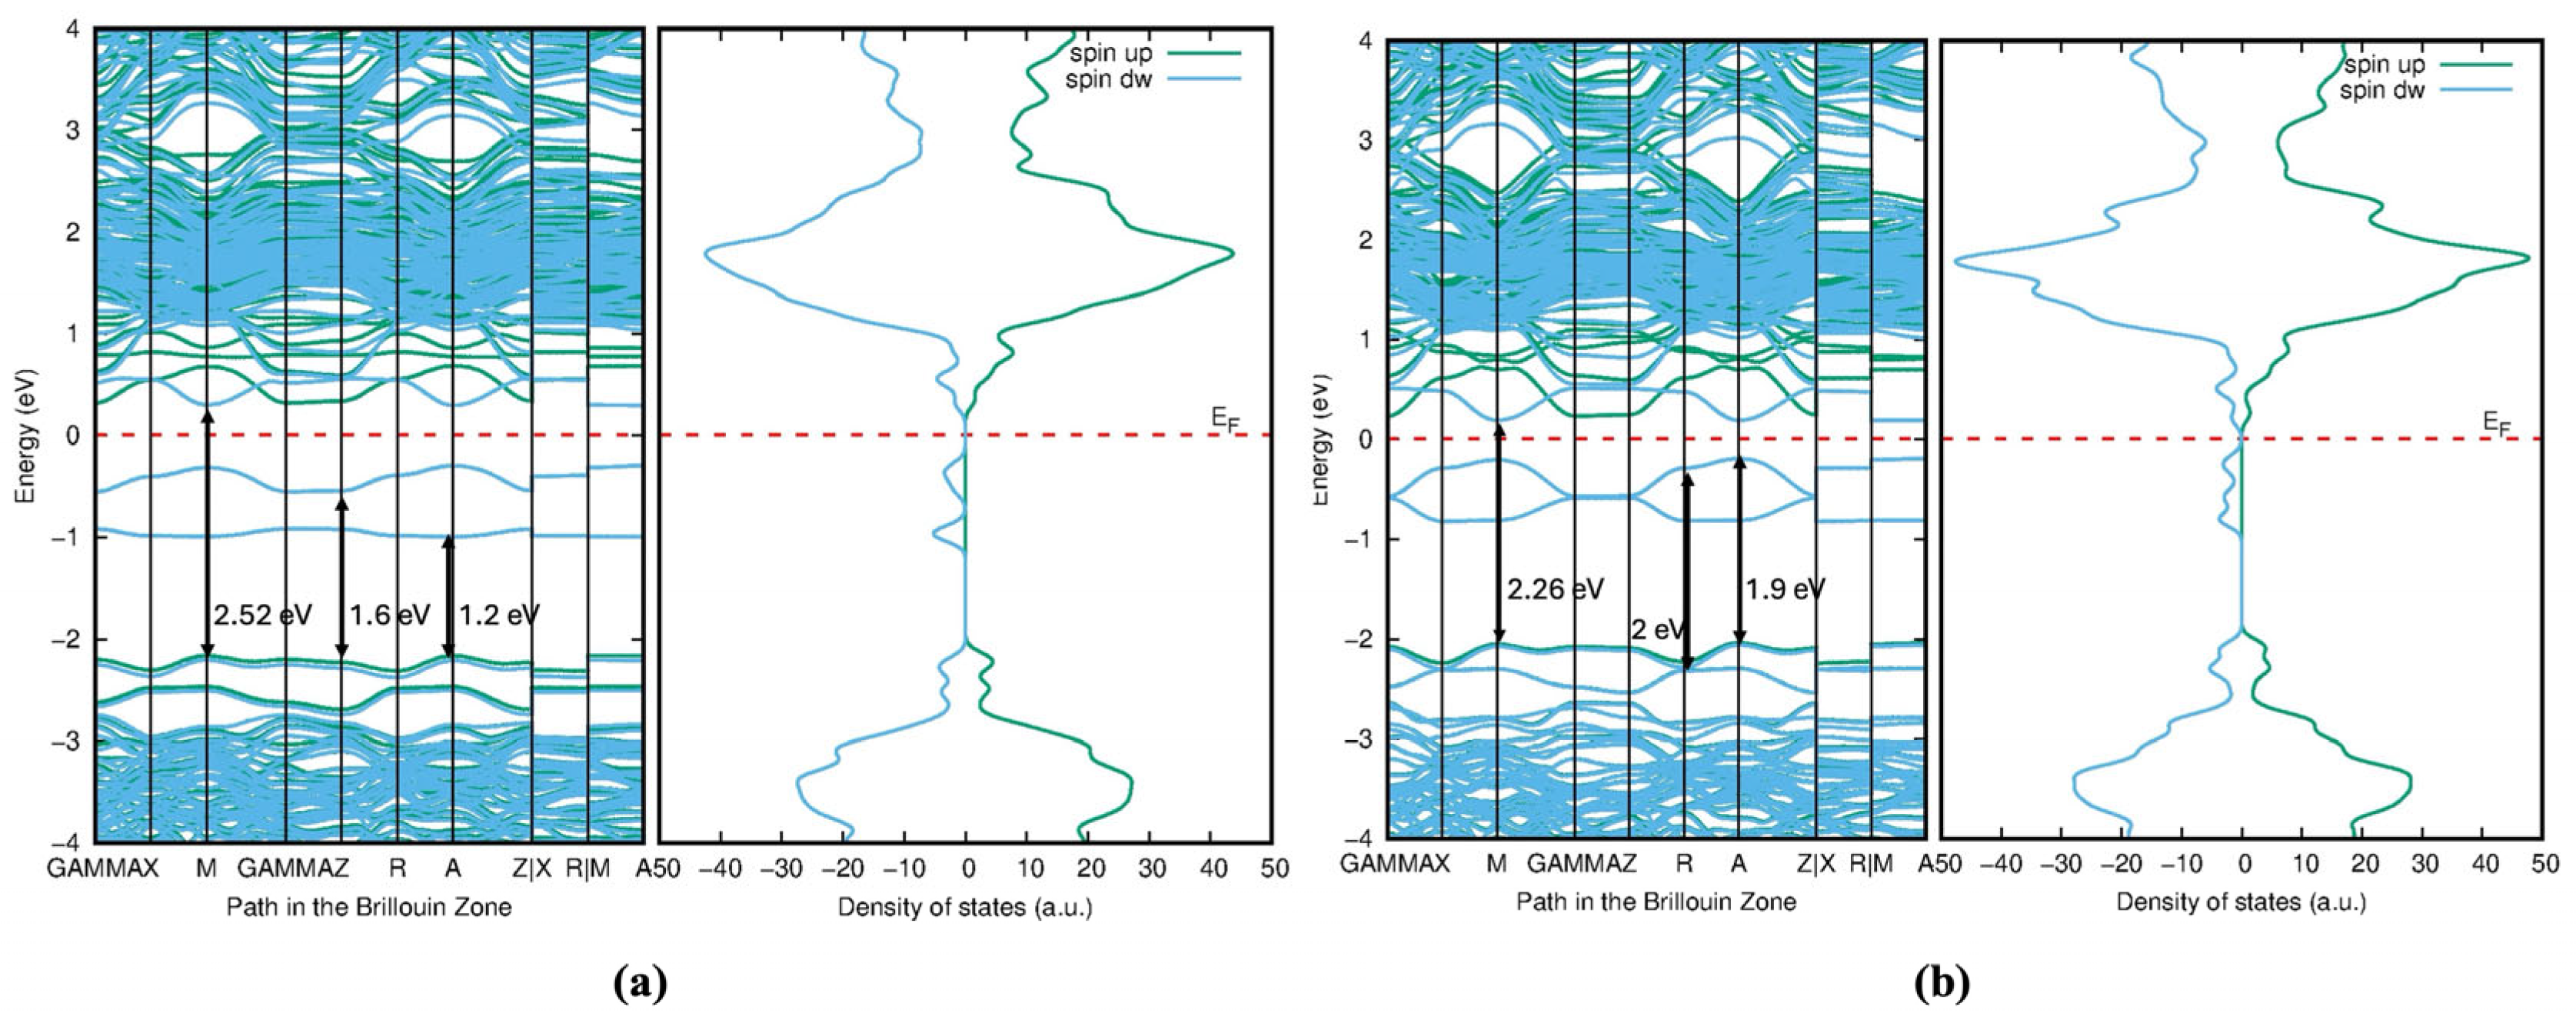
The incorporation of the chalcogen atom as a secondary dopant into Mo-doped TiO2 further shifts the absorption edge of TiO2 into the visible spectrum and even toward longer wavelengths. The redshift of the bandgap transition occurs further in the visible light region after doping with S, Se, and Te along with Mo. Additionally, the Fermi level shifts to the bottom of the conduction band minimum, indicating the absence of metallic nature. The bandgap of the Mo/S-doped system for Model 1 is 2.52 eV in Figure 11a, and Model 2 shows the narrower bandgap of 2.26 eV in Figure 11b. However, its interaction with Mo-d may be stronger in Model 2, influencing the electronic properties.
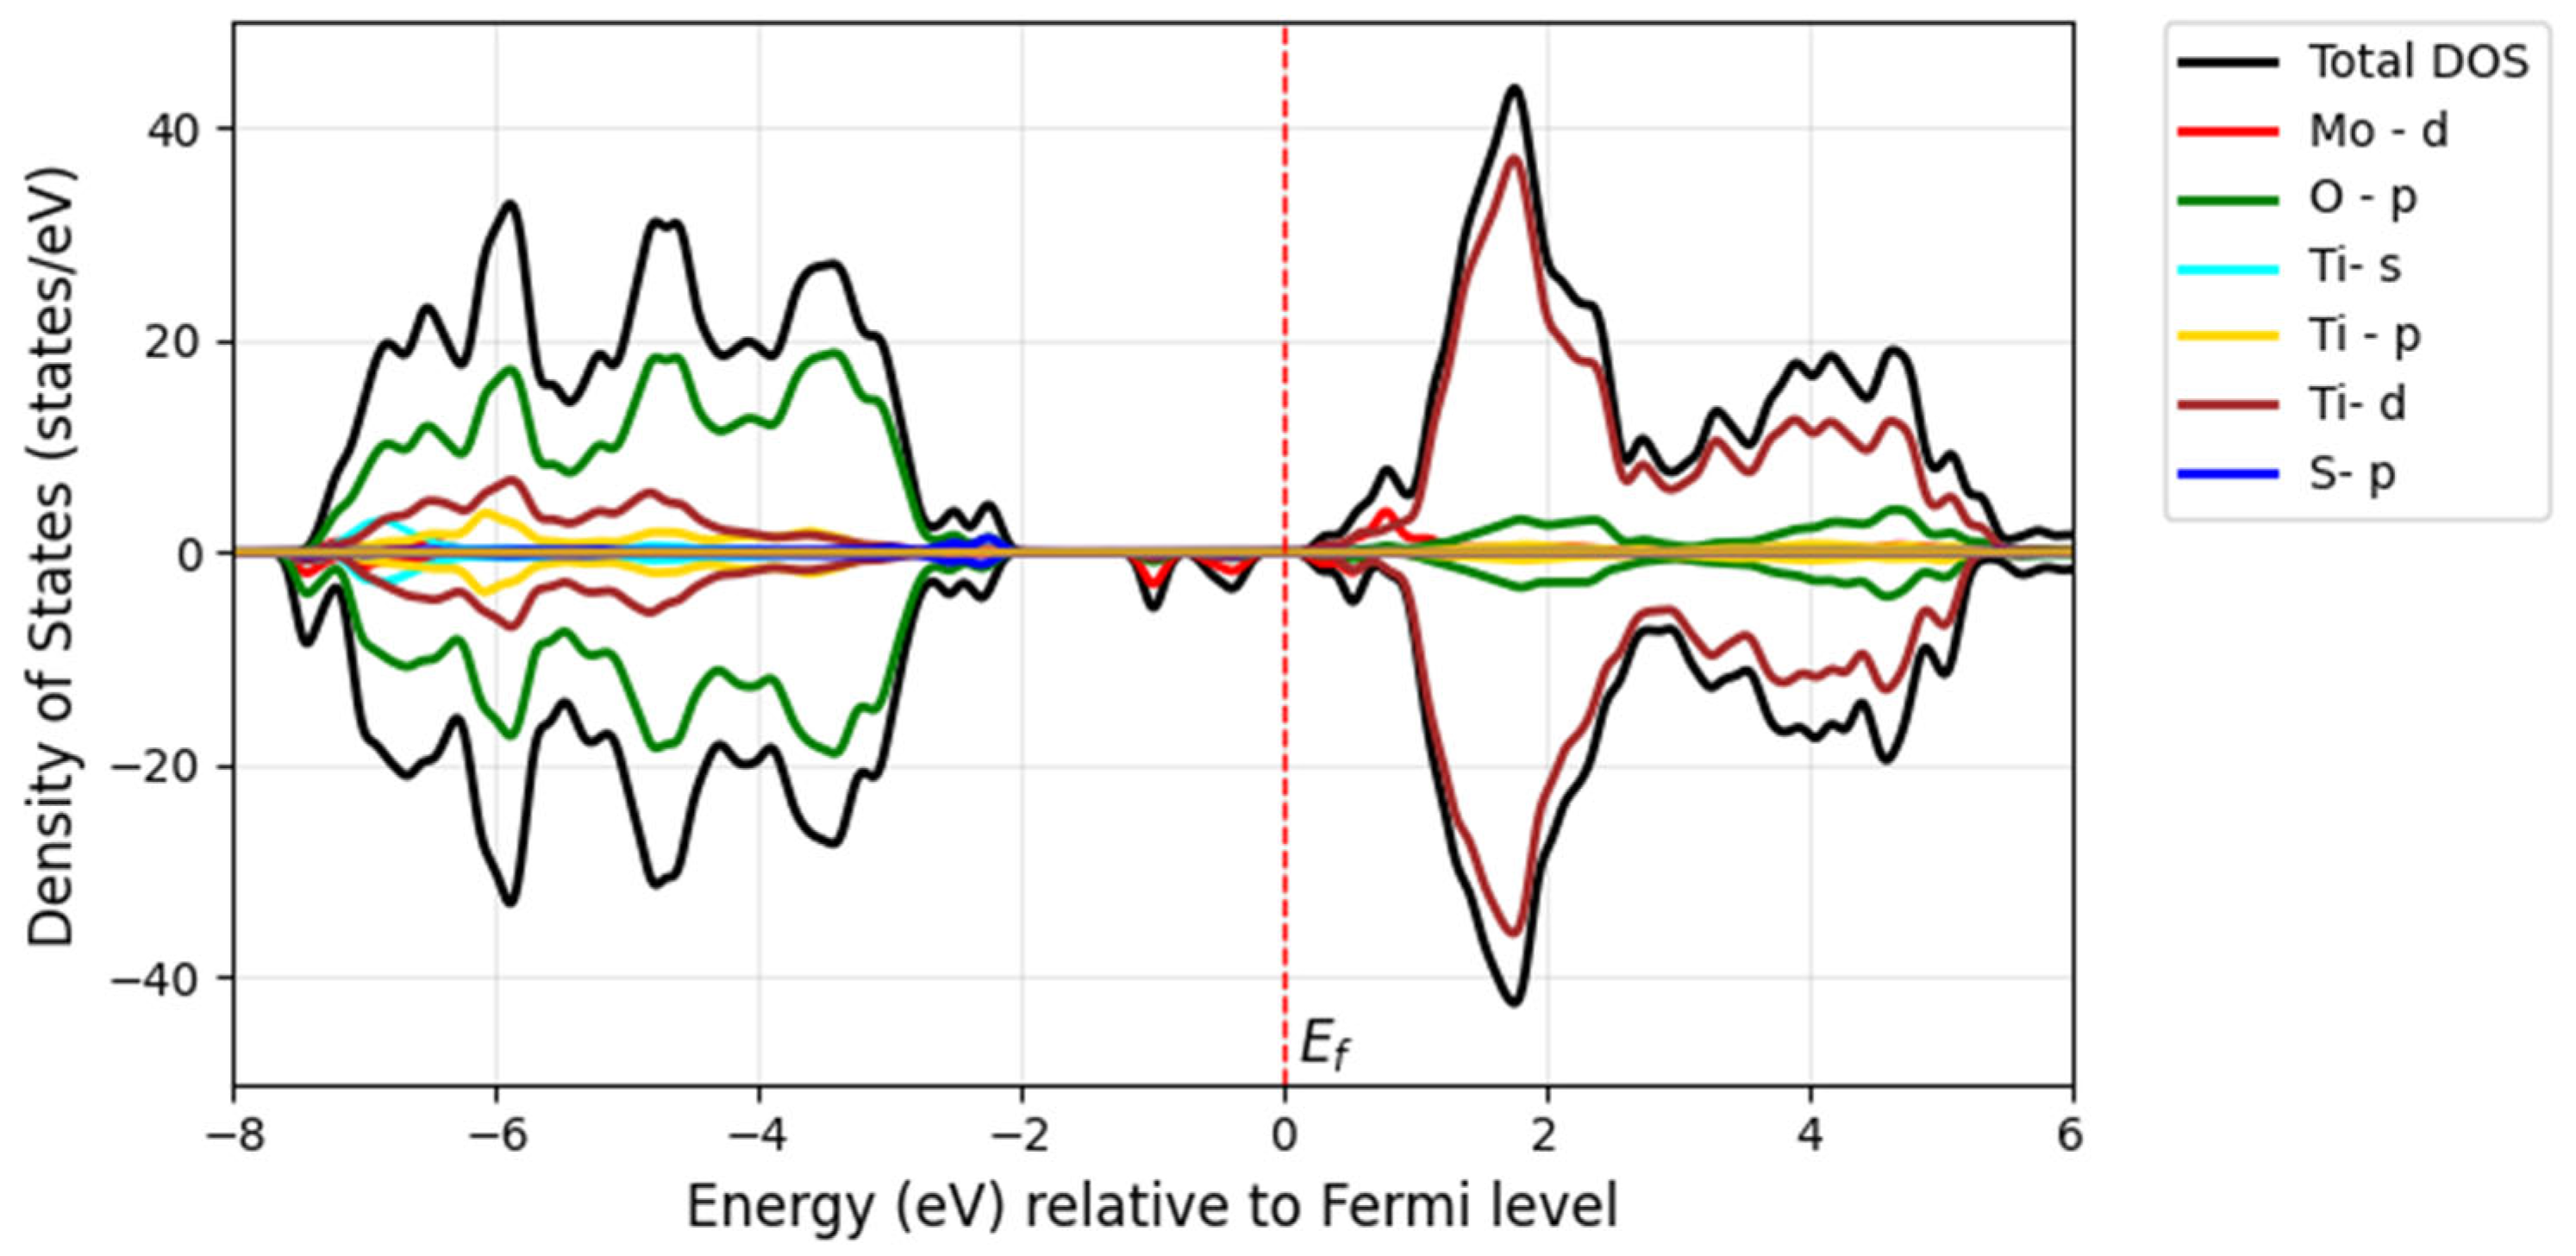
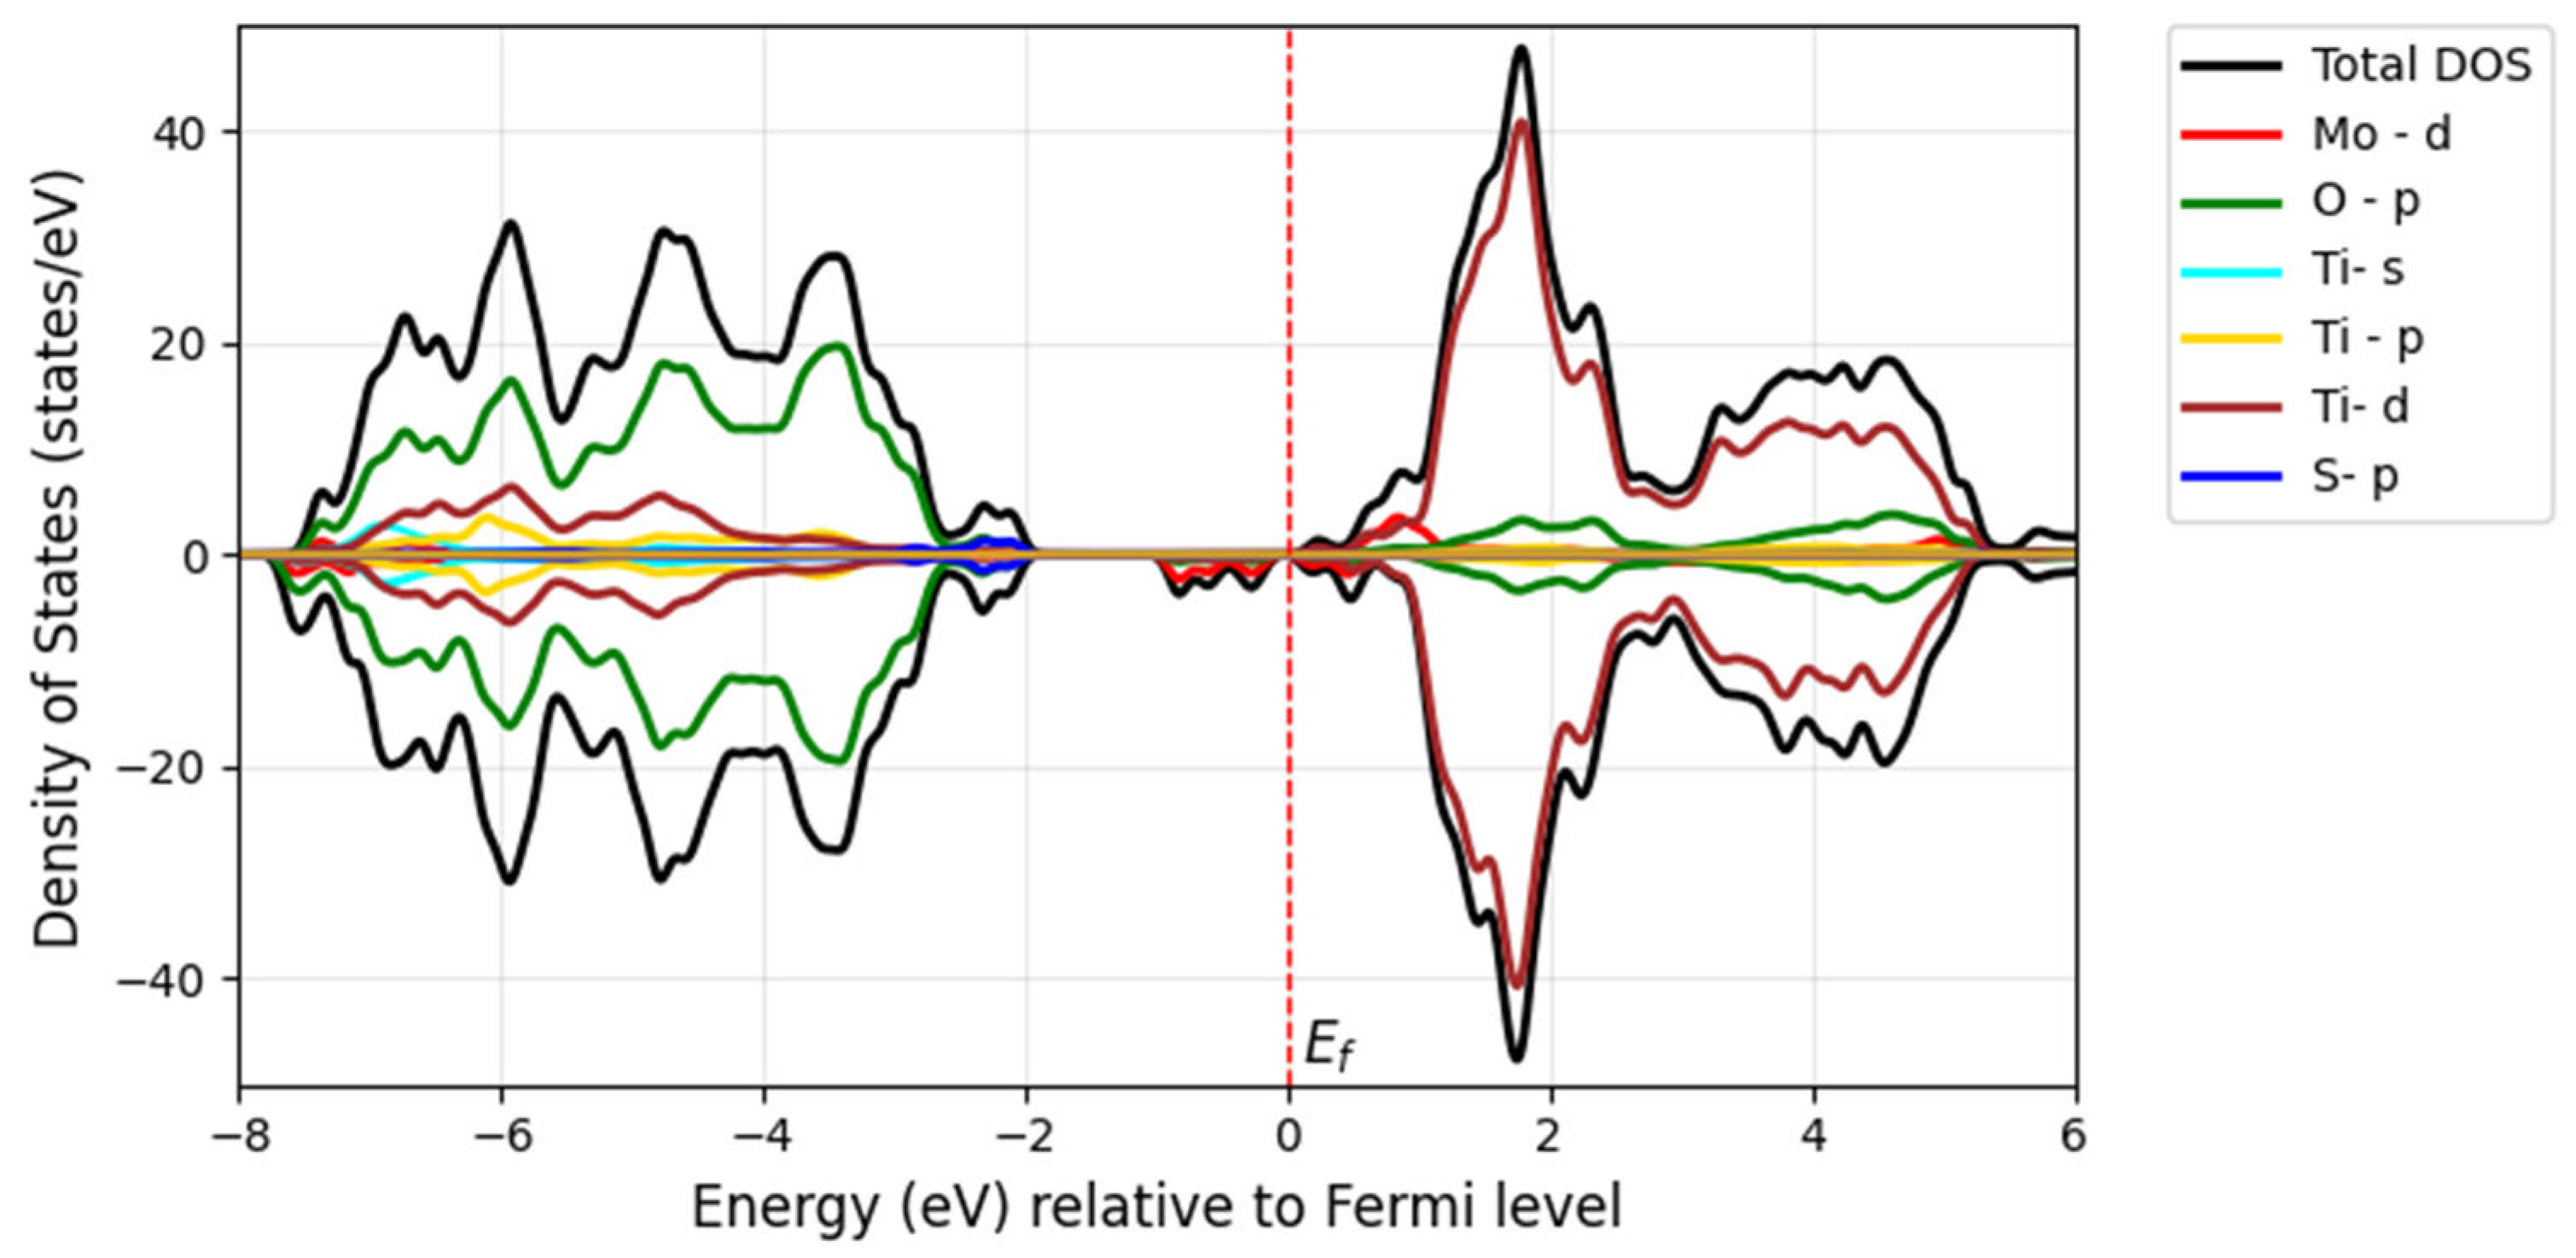
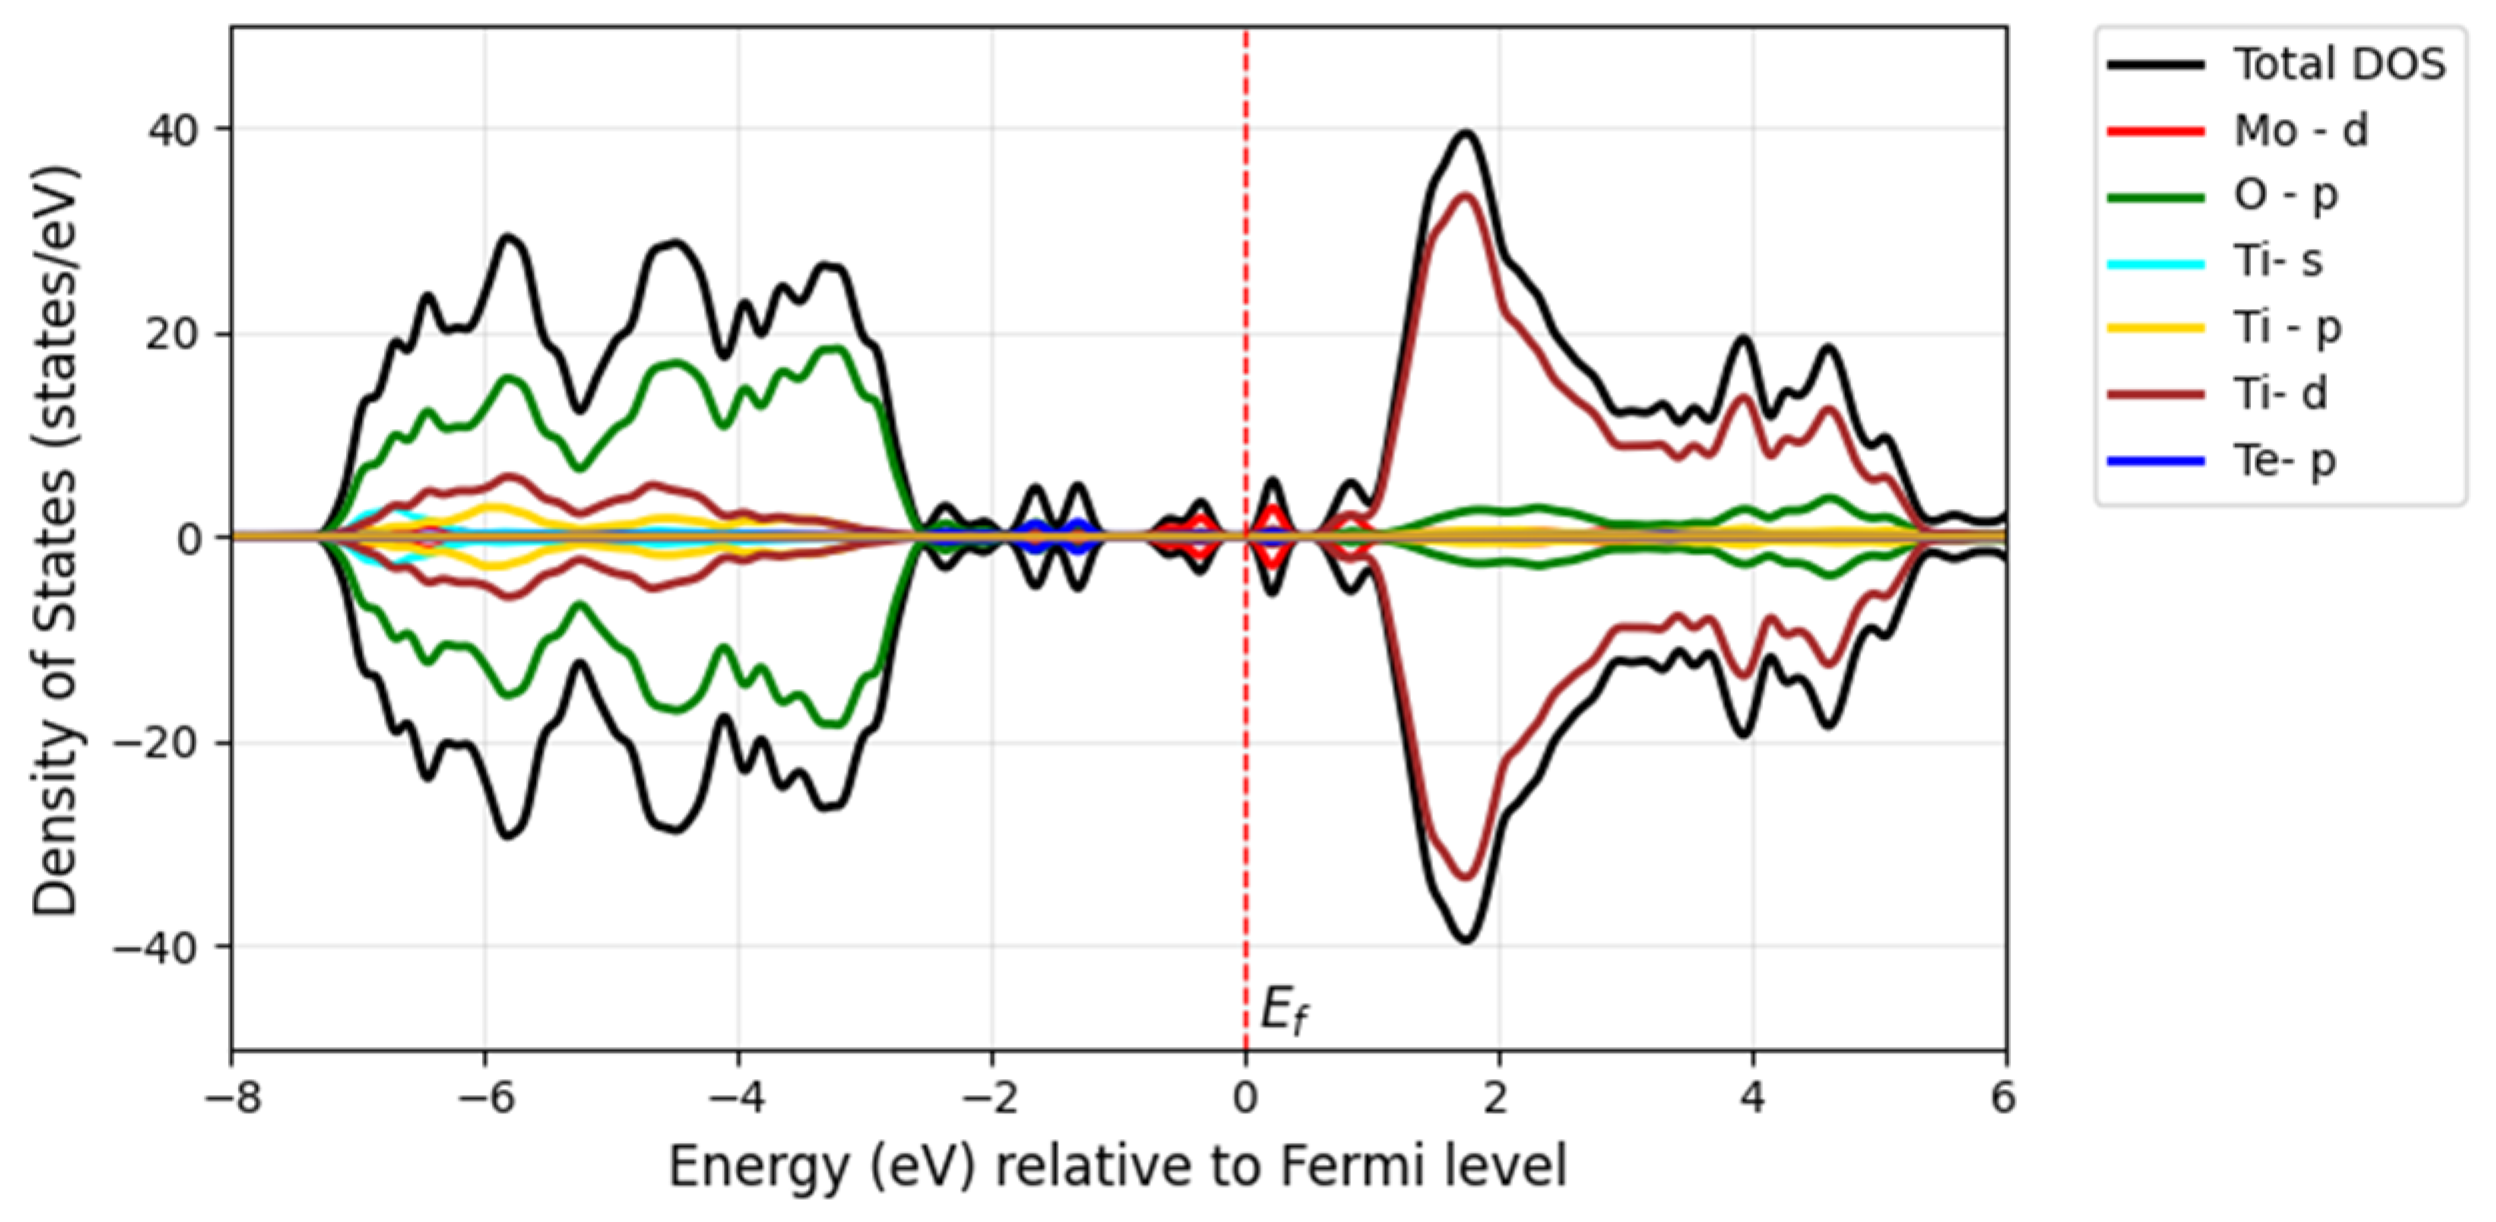
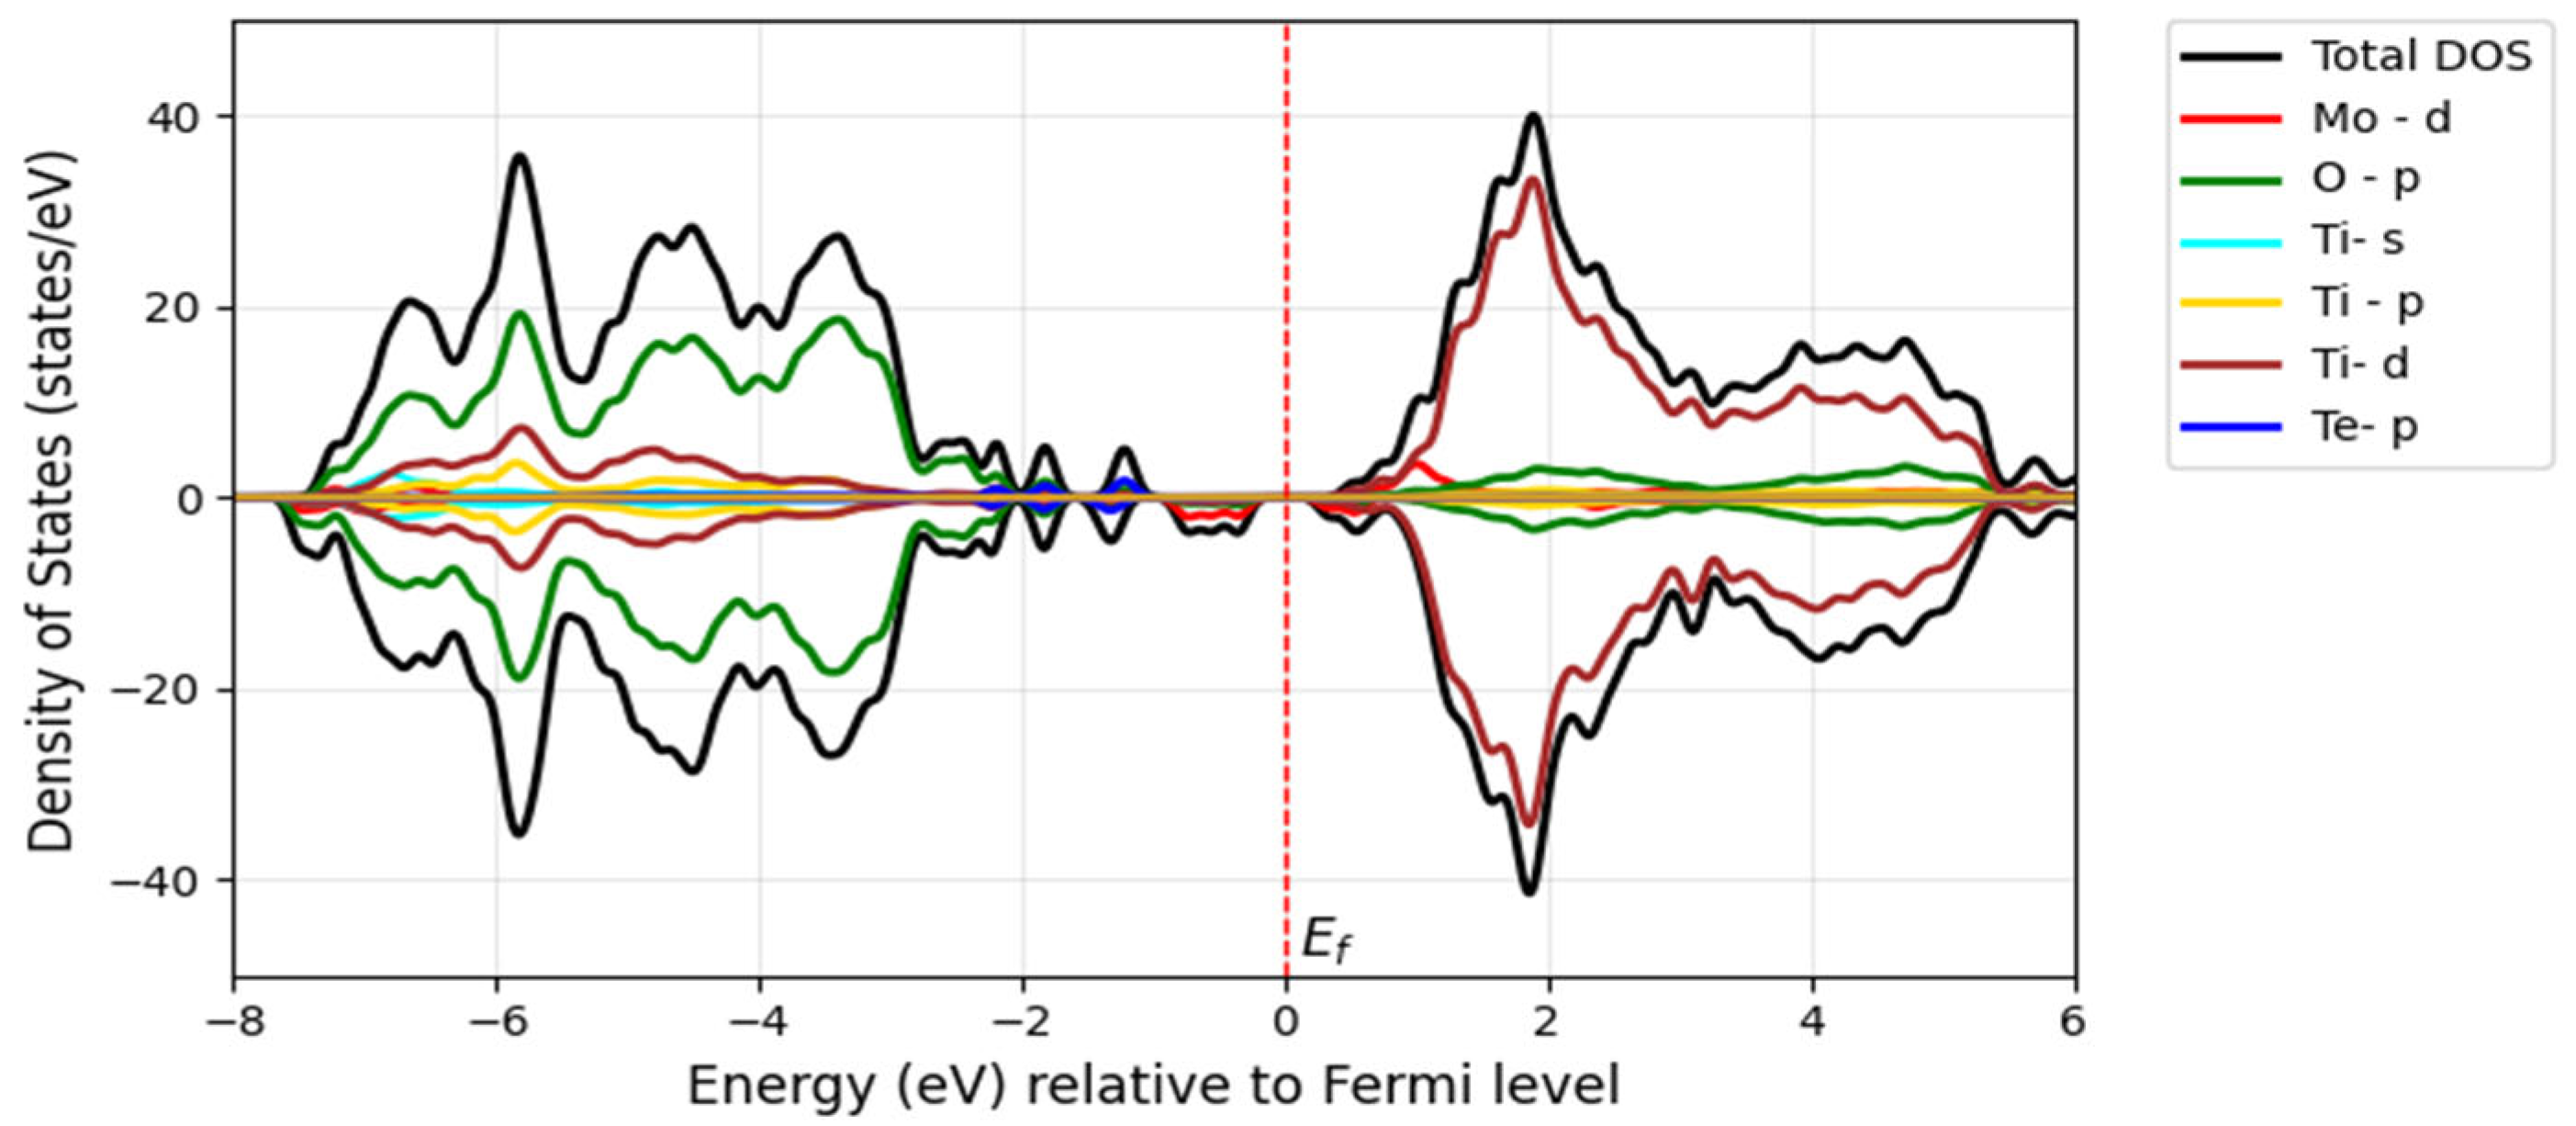
The S substitution at the oxygen site introduces S-p states located at the edge of the valence band maximum, forming a tail of the valence band (blue) with a minor contribution, as seen in Figure 12 and Figure 13. This contributes to a further bandgap reduction compared with the mono-doped Mo model by hybridizing S-3p states with O-2p states, making it capable of absorbing visible light. The literature shows that doping with S can lower the bandgap and cause a redshift in the absorption spectra of TiO2 as sulfur concentration increases. This effect is attributed to the presence of impurity states of S-3p at the valence band maximum, which aligns with our findings [32]. Experimentally, it has been proven that sulfur doping shifts the absorption edge of TiO2 to a lower energy region within the wavelength range of 650 nm [33].
Overall, our findings for the doped Mo, S/TiO2 system show that the decrease in the bandgap of pure TiO2 is related to the hybridization between the 3p S states and the 3d Ti and 4d Mo orbitals, which leads to the formation of new states within the bandgap.
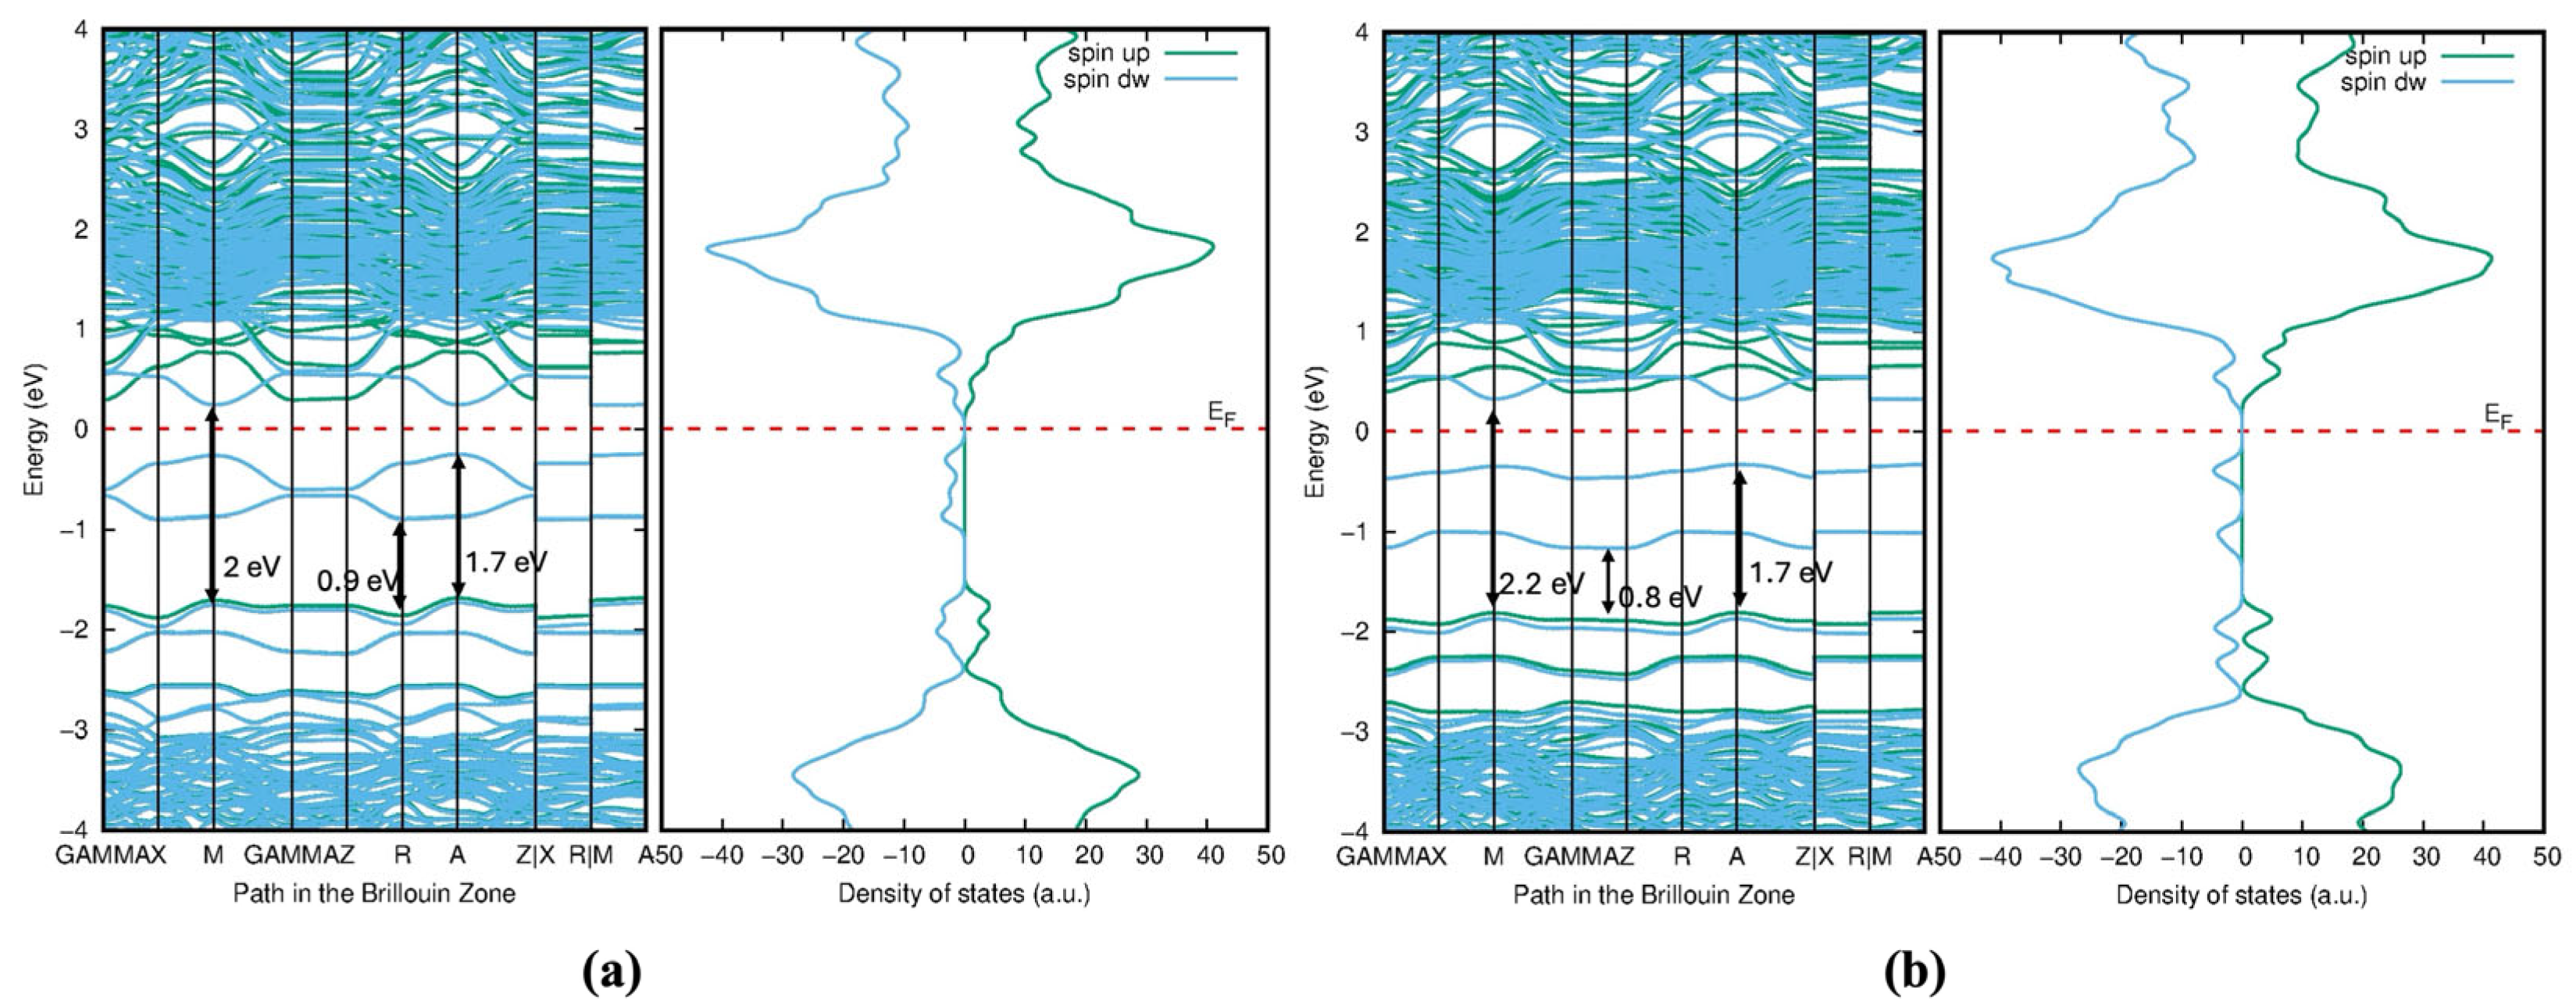
When Mo and Se are doped adjacently in TiO2, their close proximity leads to strong interactions between the dopants and the TiO2 lattice. The d-orbitals of Mo and the p-orbitals of Se strongly hybridize with the Ti-3d and O-2p orbitals of TiO2. This hybridization creates new states in the band structures (Figure 14), particularly near the Fermi level. The strong interaction introduces mid-gap states (defect states) within the bandgap of TiO2, which can act as trapping centers for electrons or holes, thereby altering the material’s optical and electronic properties. The new states near the Fermi level increase the density of the free charge carriers, enhancing the material’s electrical conductivity. Model 1 (adjacent doping), shown in Figure 14a, exhibits a bandgap of 2 eV with deeper mid-gap states due to strong dopant interactions. In contrast, Model 2 (far apart doping), which represents the electron distribution in the density of states (
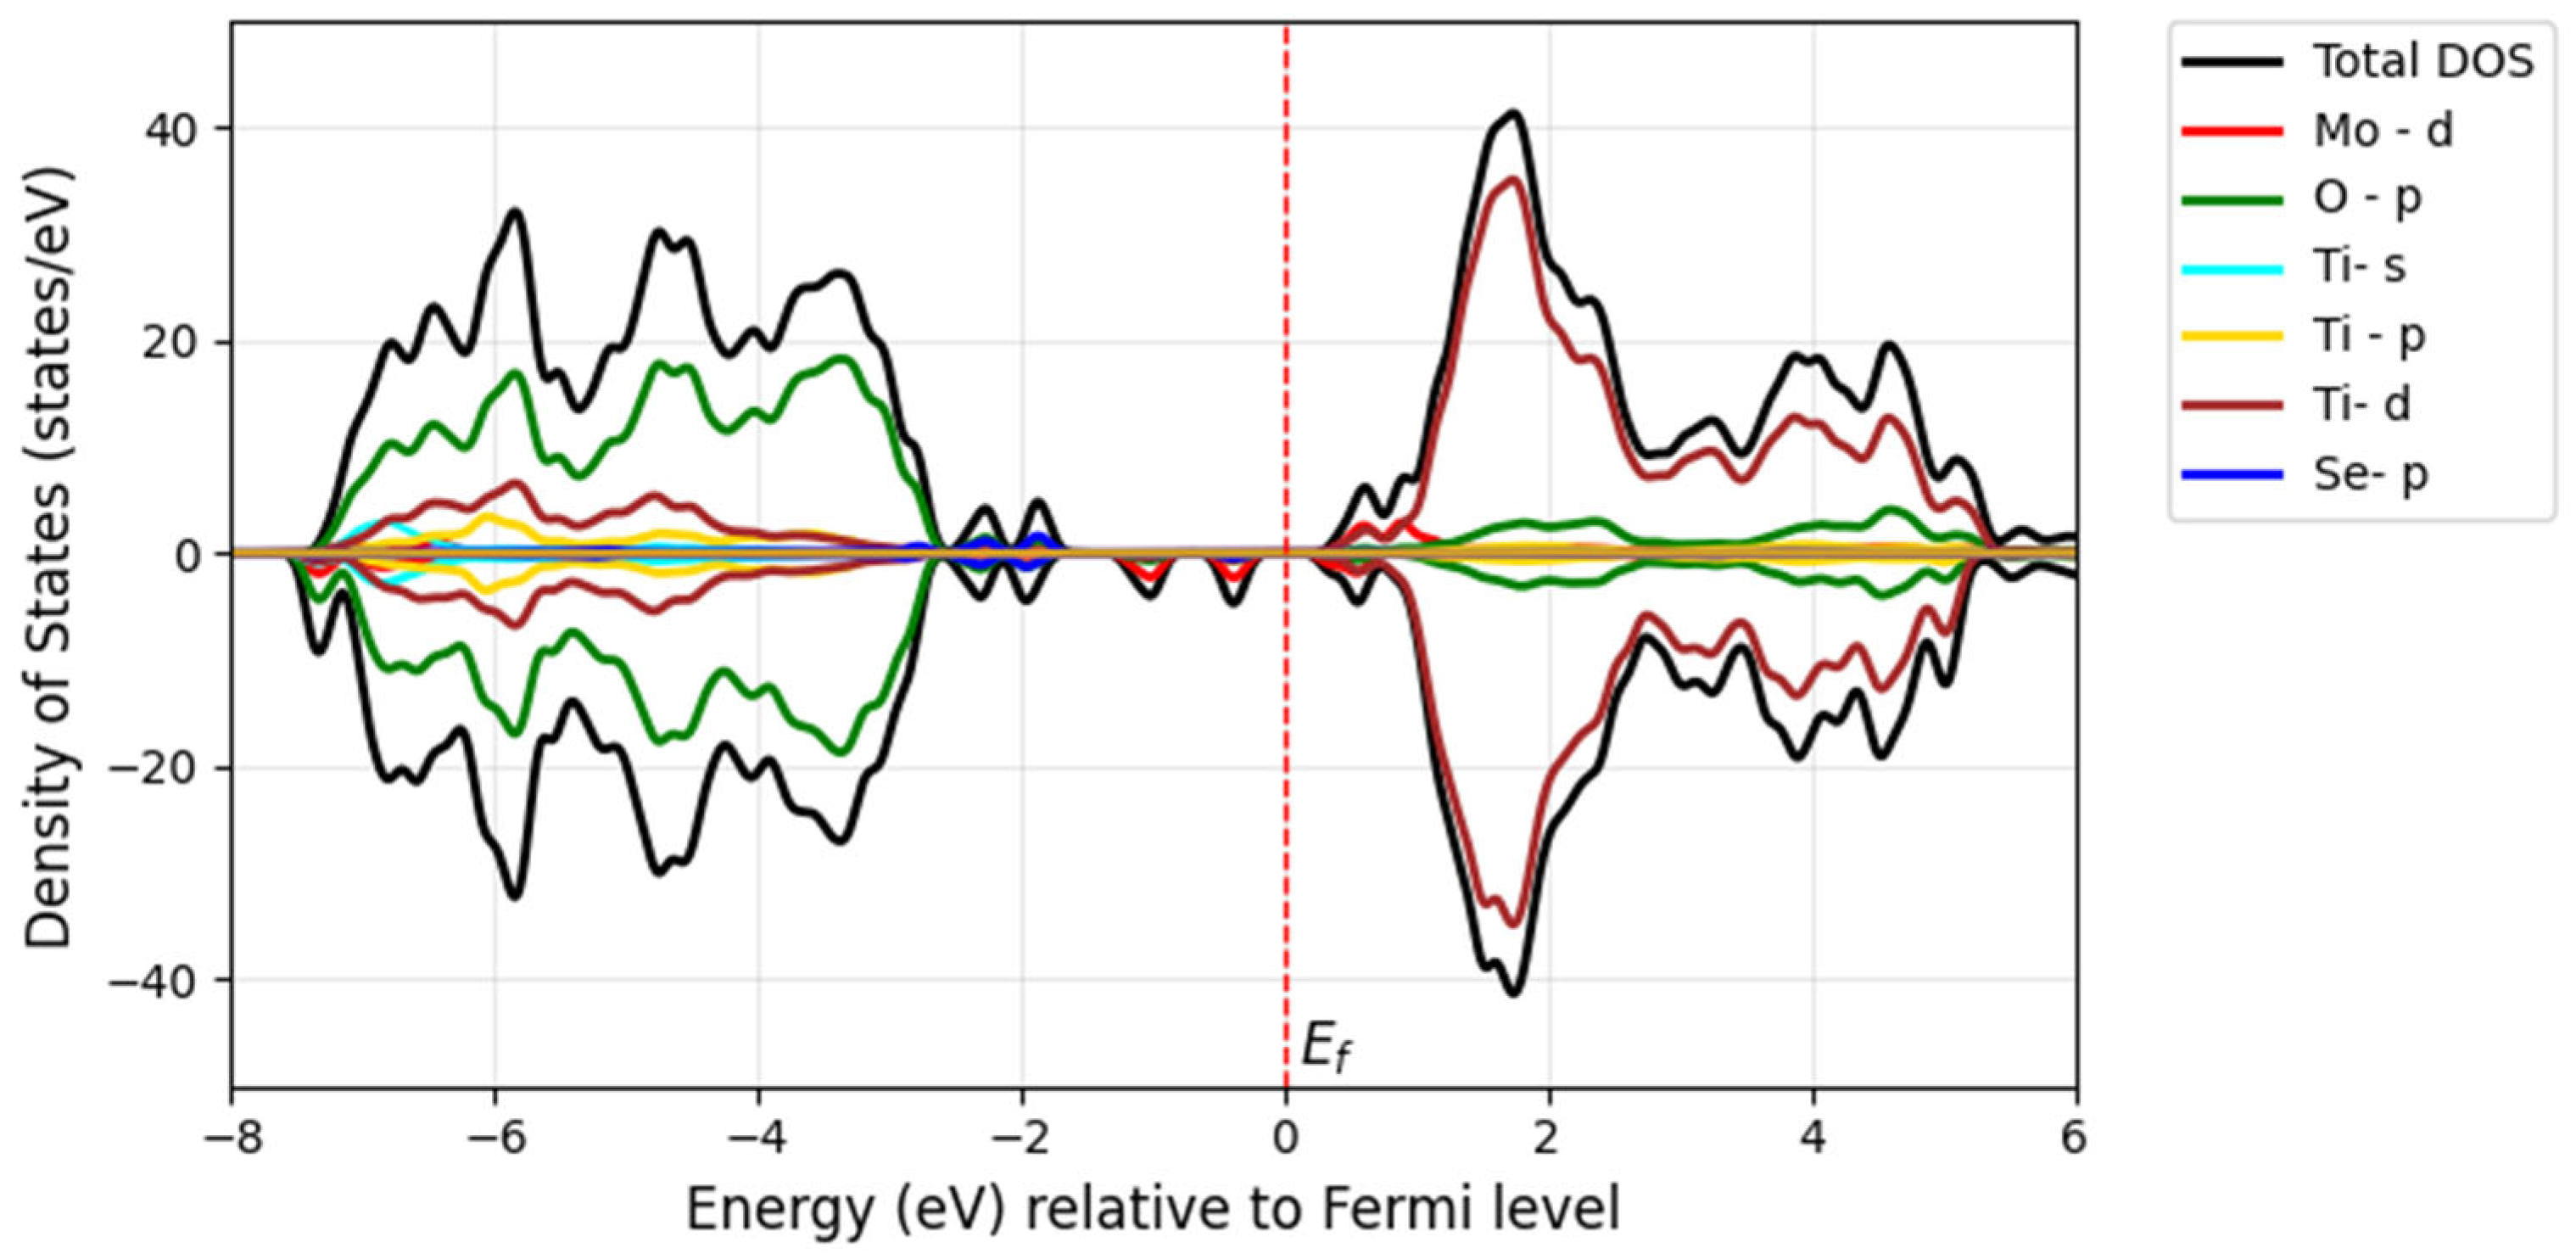
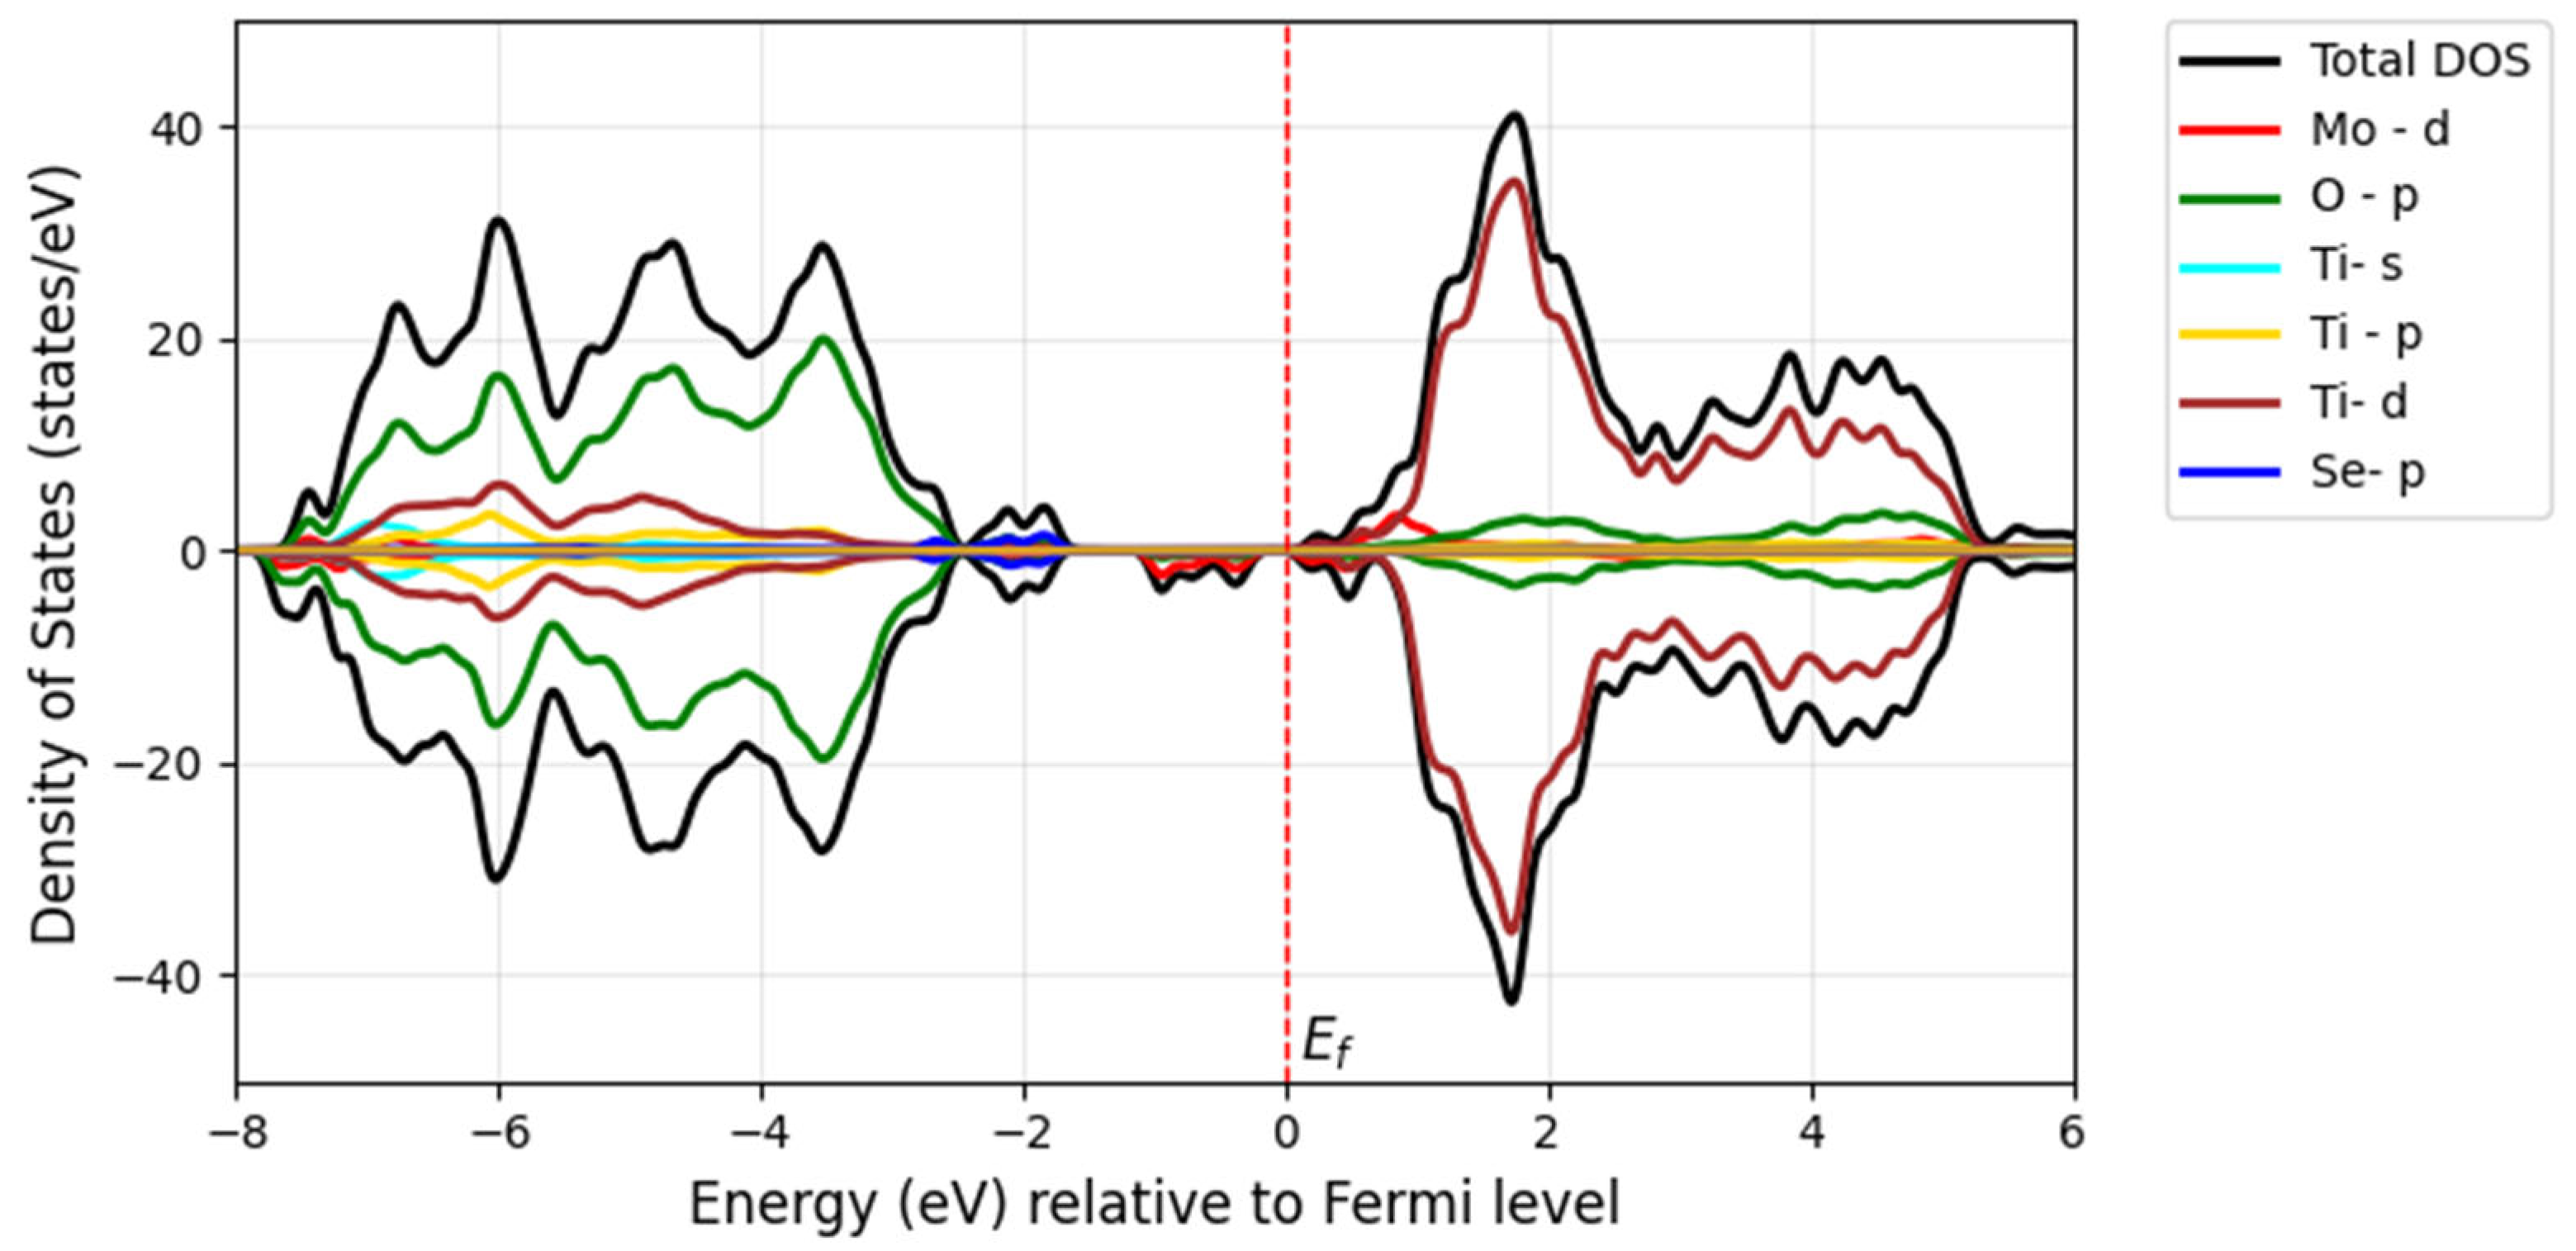
Figure 14b), shows a bandgap of 2.2 eV with shallower mid-gap states due to weaker dopant interactions. These mid-gap states arise from the Mo-4d and Se-4p states in both models, as observed in the corresponding DOS figures of Figure 15 and Figure 16.
In Model 1, the band structure in Figure 14a displays flatter bands near the Fermi level, suggesting localized states due to strong dopant interactions. Additional bands or split bands may appear due to hybridization between Mo, Se, and TiO2 orbitals. According to Model 2, the DOS plot in Figure 16 may exhibit broader peaks closer to the band edges, corresponding to shallow defect states resulting from weaker dopant interactions. The valence band and conduction band edges are closer together, indicating a smaller bandgap. The band structure in Figure 14b shows more dispersed bands, indicating delocalized states caused by weaker dopant interactions. The bands may appear smoother, with fewer split bands or additional states.
The significant reduction or near-closure of the bandgap in Mo- and Te-doped structures fundamentally alters the electronic properties of TiO2. Instead of behaving as a wide-bandgap semiconductor, the material becomes semi-metallic or highly conductive. This transformation may enhance its performance in applications requiring high electrical conductivity, such as electrocatalysis or sensing devices, but could compromise its effectiveness in photocatalytic processes, where a sizable bandgap is critical for efficient charge carrier separation.
The strong hybridization between Mo-4d, Te-5p, and Ti-3d orbitals in Model 1, Figure 17 leads to significant bandgap reduction and enhanced visible light absorption. However, the adjacent positioning of dopants may also introduce localized defect states (Figure 18a) that could act as recombination centers for electron–hole pairs. The DOS plot is more symmetric and shows broader peaks, indicating a more uniform distribution of electronic states. The sharp peaks shown in Figure 17 and Figure 19 in the valence band are dominated by O-2p and Te-5p states. The introduction of Mo-4d and Te-5p states creates defect states within the bandgap of TiO2, effectively reducing the bandgap. This is crucial for enhancing the material’s photocatalytic activity under visible light. The mid-gap states from Te-5p orbitals are located just above the valence band, while the Mo-4d states are near the conduction band. In Model 2, Figure 18b and Figure 19, the Mo-4d orbitals contribute to the DOS, particularly near the conduction band. However, the peaks are broader and less sharp compared with Model 1, indicating weaker interactions due to the spatial separation of dopants. The Te-5p and Mo-4d orbitals introduce broader mid-gap states above the valence band maximum, as seen in Figure 19. These states are more delocalized and lie closer to both the conduction and valence bands.
Overall, these findings highlight how Mo doping in combination with S, Se, and Te can create beneficial electronic states that improve the material’s ability to harness light energy for photocatalytic applications. The strong hybridization among the 5p orbitals of Te, 3p orbitals of S, and 4p orbitals of Se, along with the 3d orbitals of Ti and 4d orbitals of Mo, produces intermediate peaks within the bandgap of the doped models. Zheng et al. reported that anionic doping with heavy chalcogen elements such as Te and Se significantly reduces the bandgap of TiO2, extending its absorption into the visible light spectrum [15]. Previous studies on mono-doping with S, Se, and Te align with our findings on bandgap reduction and localized electronic states in co-doped systems, as demonstrated by both DFT calculations and experimental results [34,35]. Due to the reduction in bandgap energy, the material can absorb visible light. However, partially occupied impurity states appear above the VBM and below the CBM, which can act as traps for excited electrons. This leads to faster electron–hole recombination, thereby limiting the efficiency of the compound in the visible light region. These intermediate states, except for those in the sulfur-doped models, are located near the VBM and function as shallow acceptor levels, primarily consisting of Se-4p and Te-5p orbitals. These states have the ability to capture photoexcited holes, which help to reduce the recombination rate of electron–hole pairs. Additionally, the presence of electron vacancies near the valence band can generate an anodic photocurrent, indicating a higher likelihood for electrons to be excited into the intermediate states. In these states, lower photon energy is sufficient to promote electrons into the conduction band. These results suggest that the degree of bandgap narrowing depends on the distance between the doped Mo atom and the chalcogen atom. Model 2, where the dopants are farther apart, exhibits a more significant bandgap reduction compared with Model 1, where the dopants are adjacent.
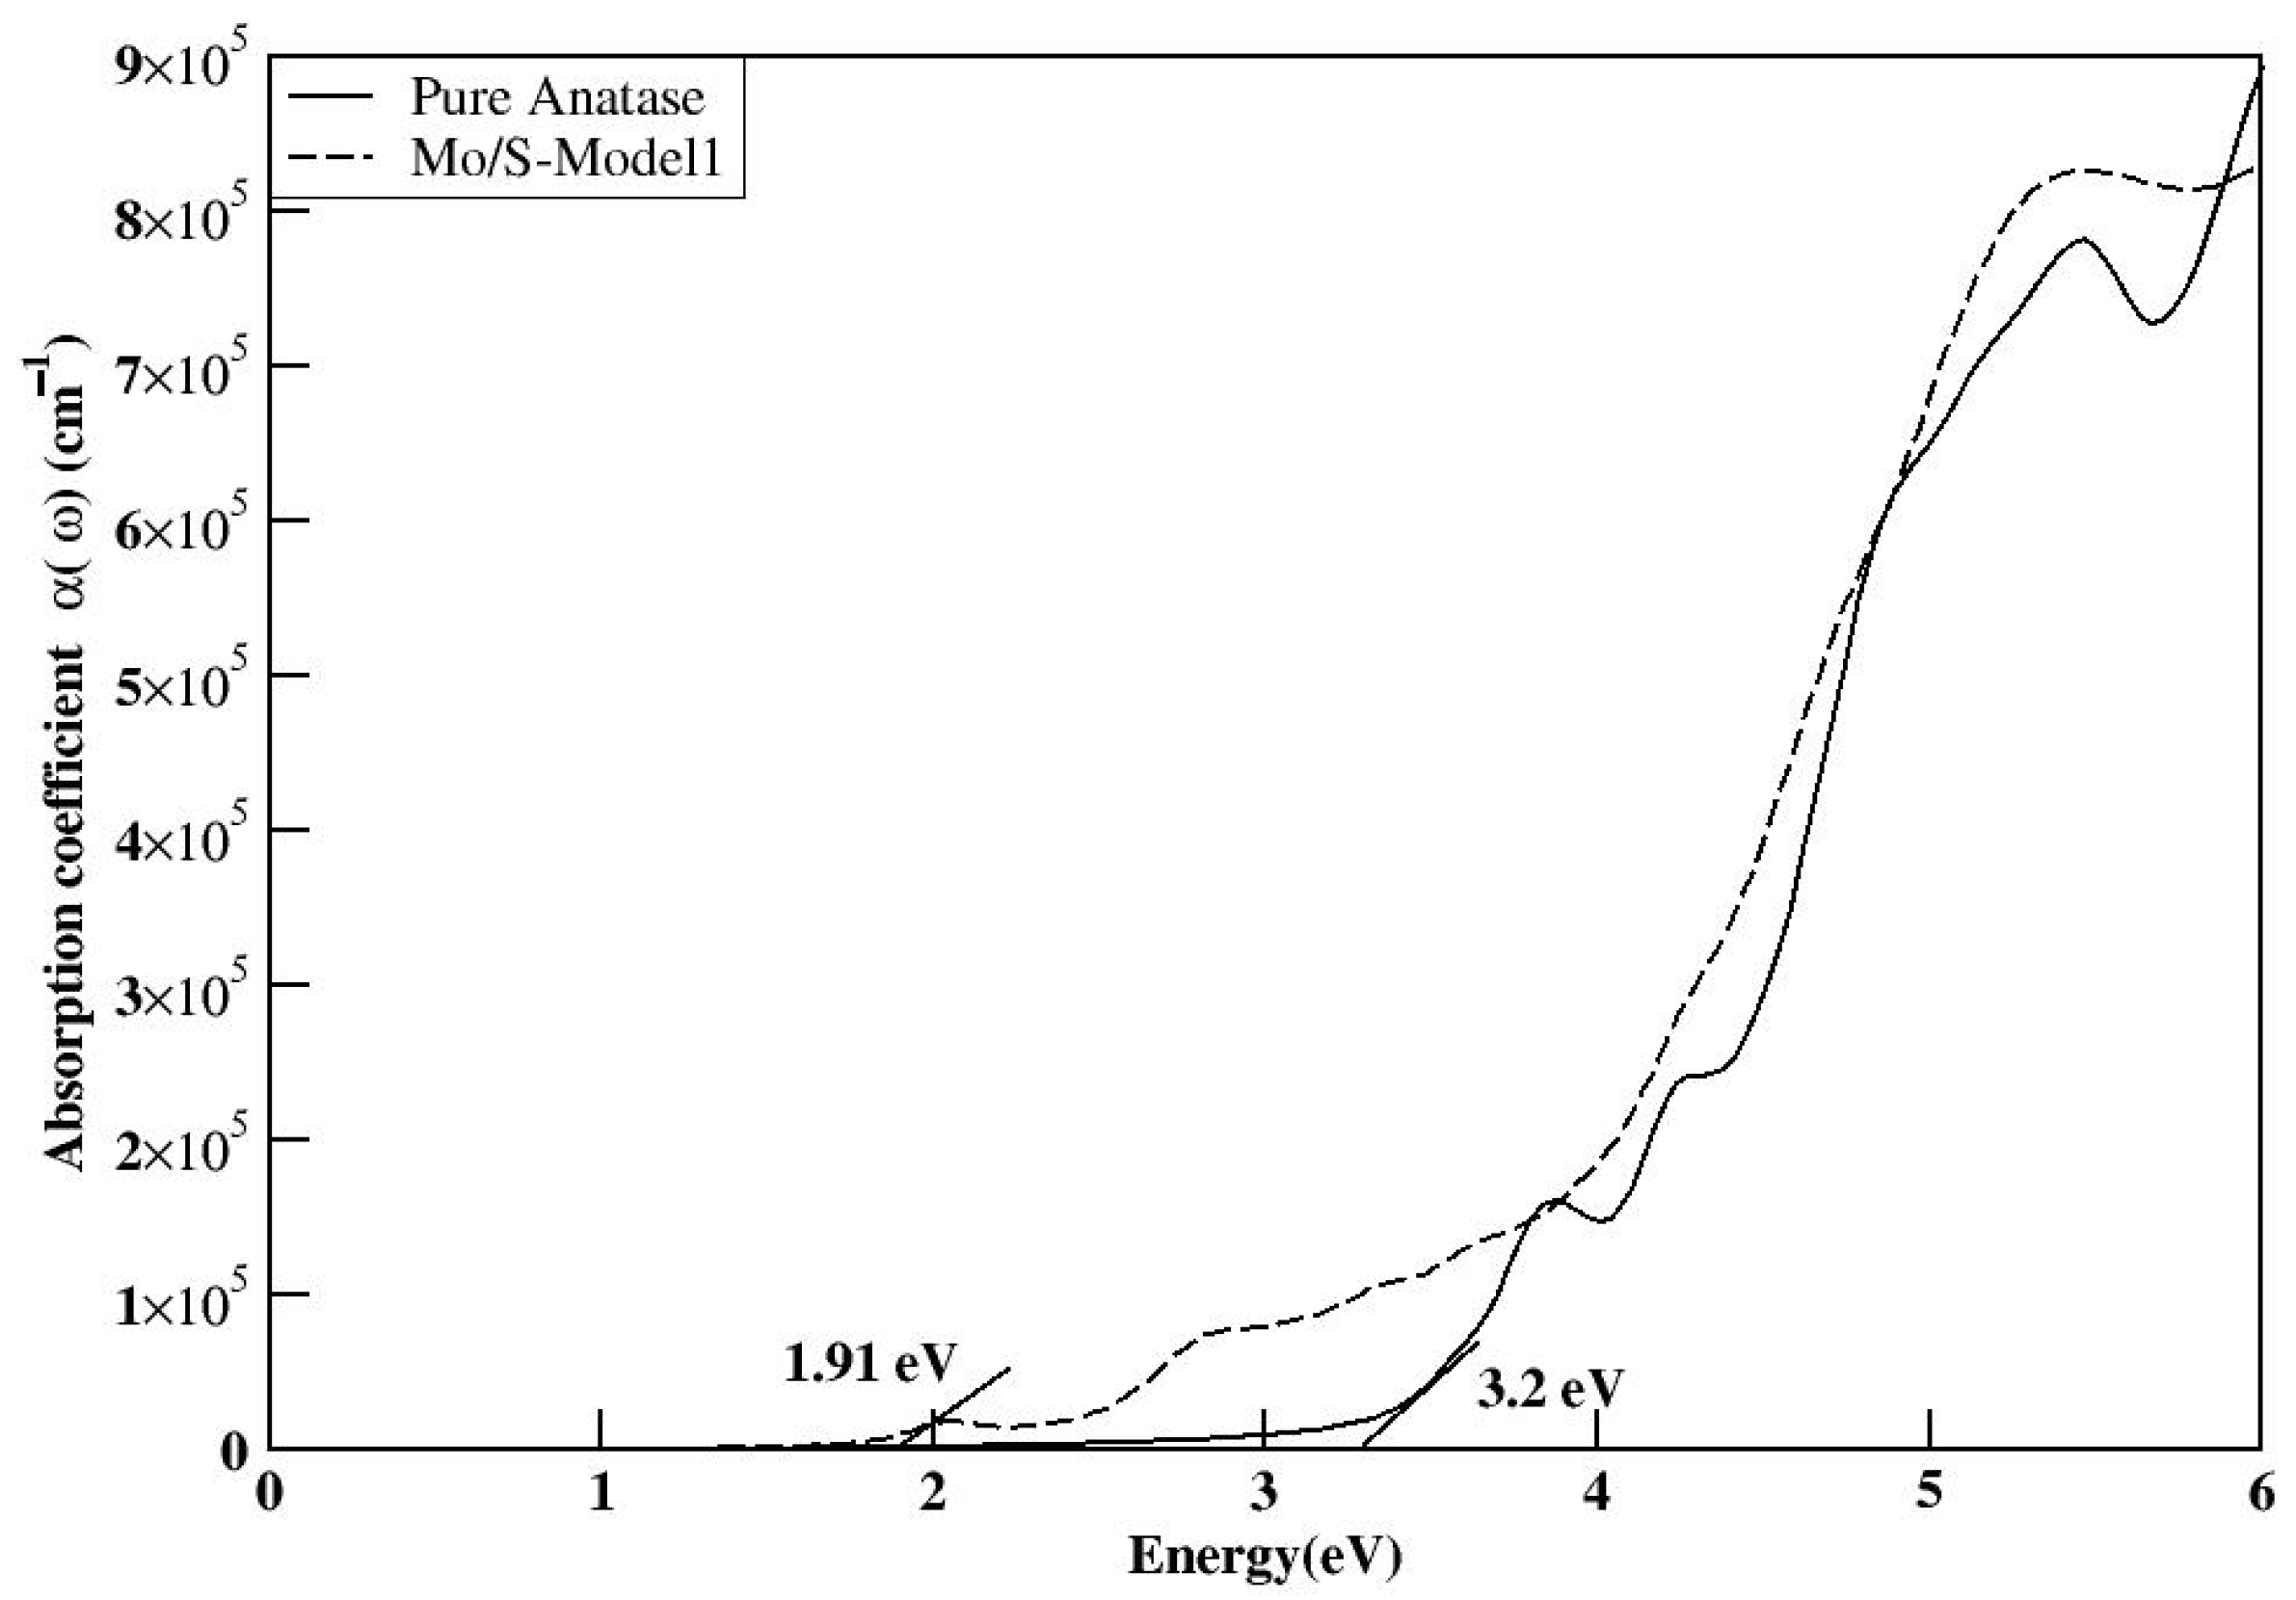
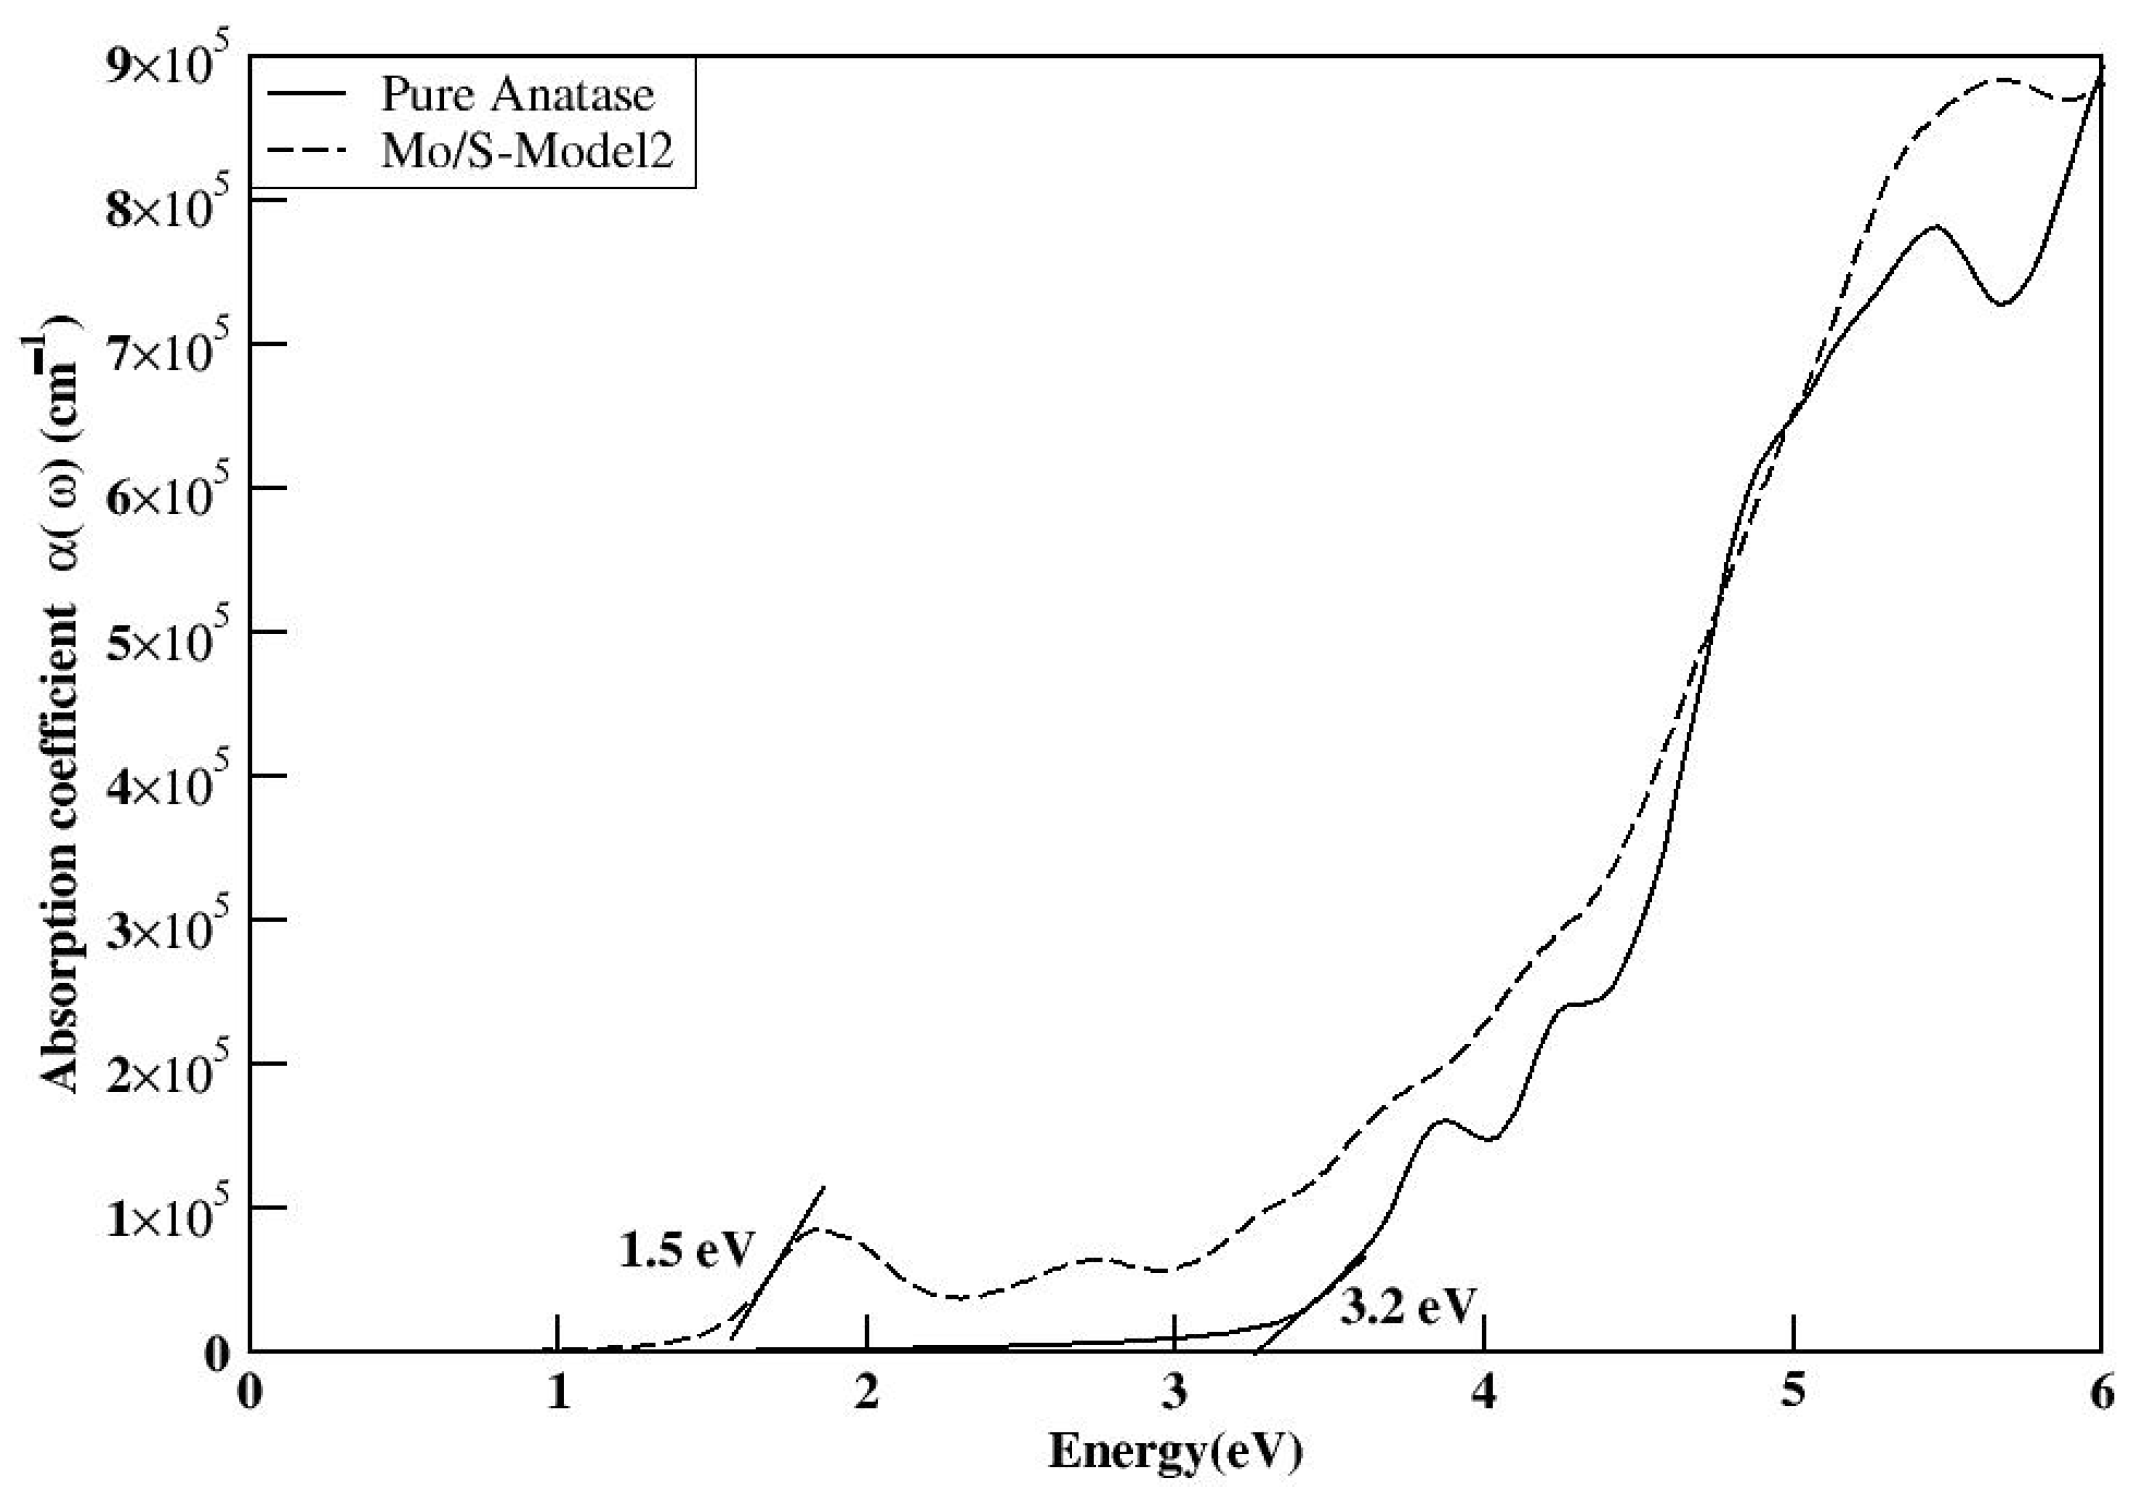
The electronic structures of the three co-doped models are nearly identical; however, the Mo and S co-doped structures exhibit fewer impurity states compared with the Se and Te co-doped structures. This reduction in impurity states may enhance the efficiency of the S-doped models by decreasing the recombination rate compared with the other doped models. The MoS-1 model exhibited a reduced bandgap of 2.52 eV and demonstrated optical absorption in Figure 20 comparable to the other models. It was concluded that the adjacent positioning of the dopants in the MoS-1 model is the most optimal structure, compared with the other co-doped configurations.

Photocatalytic Properties

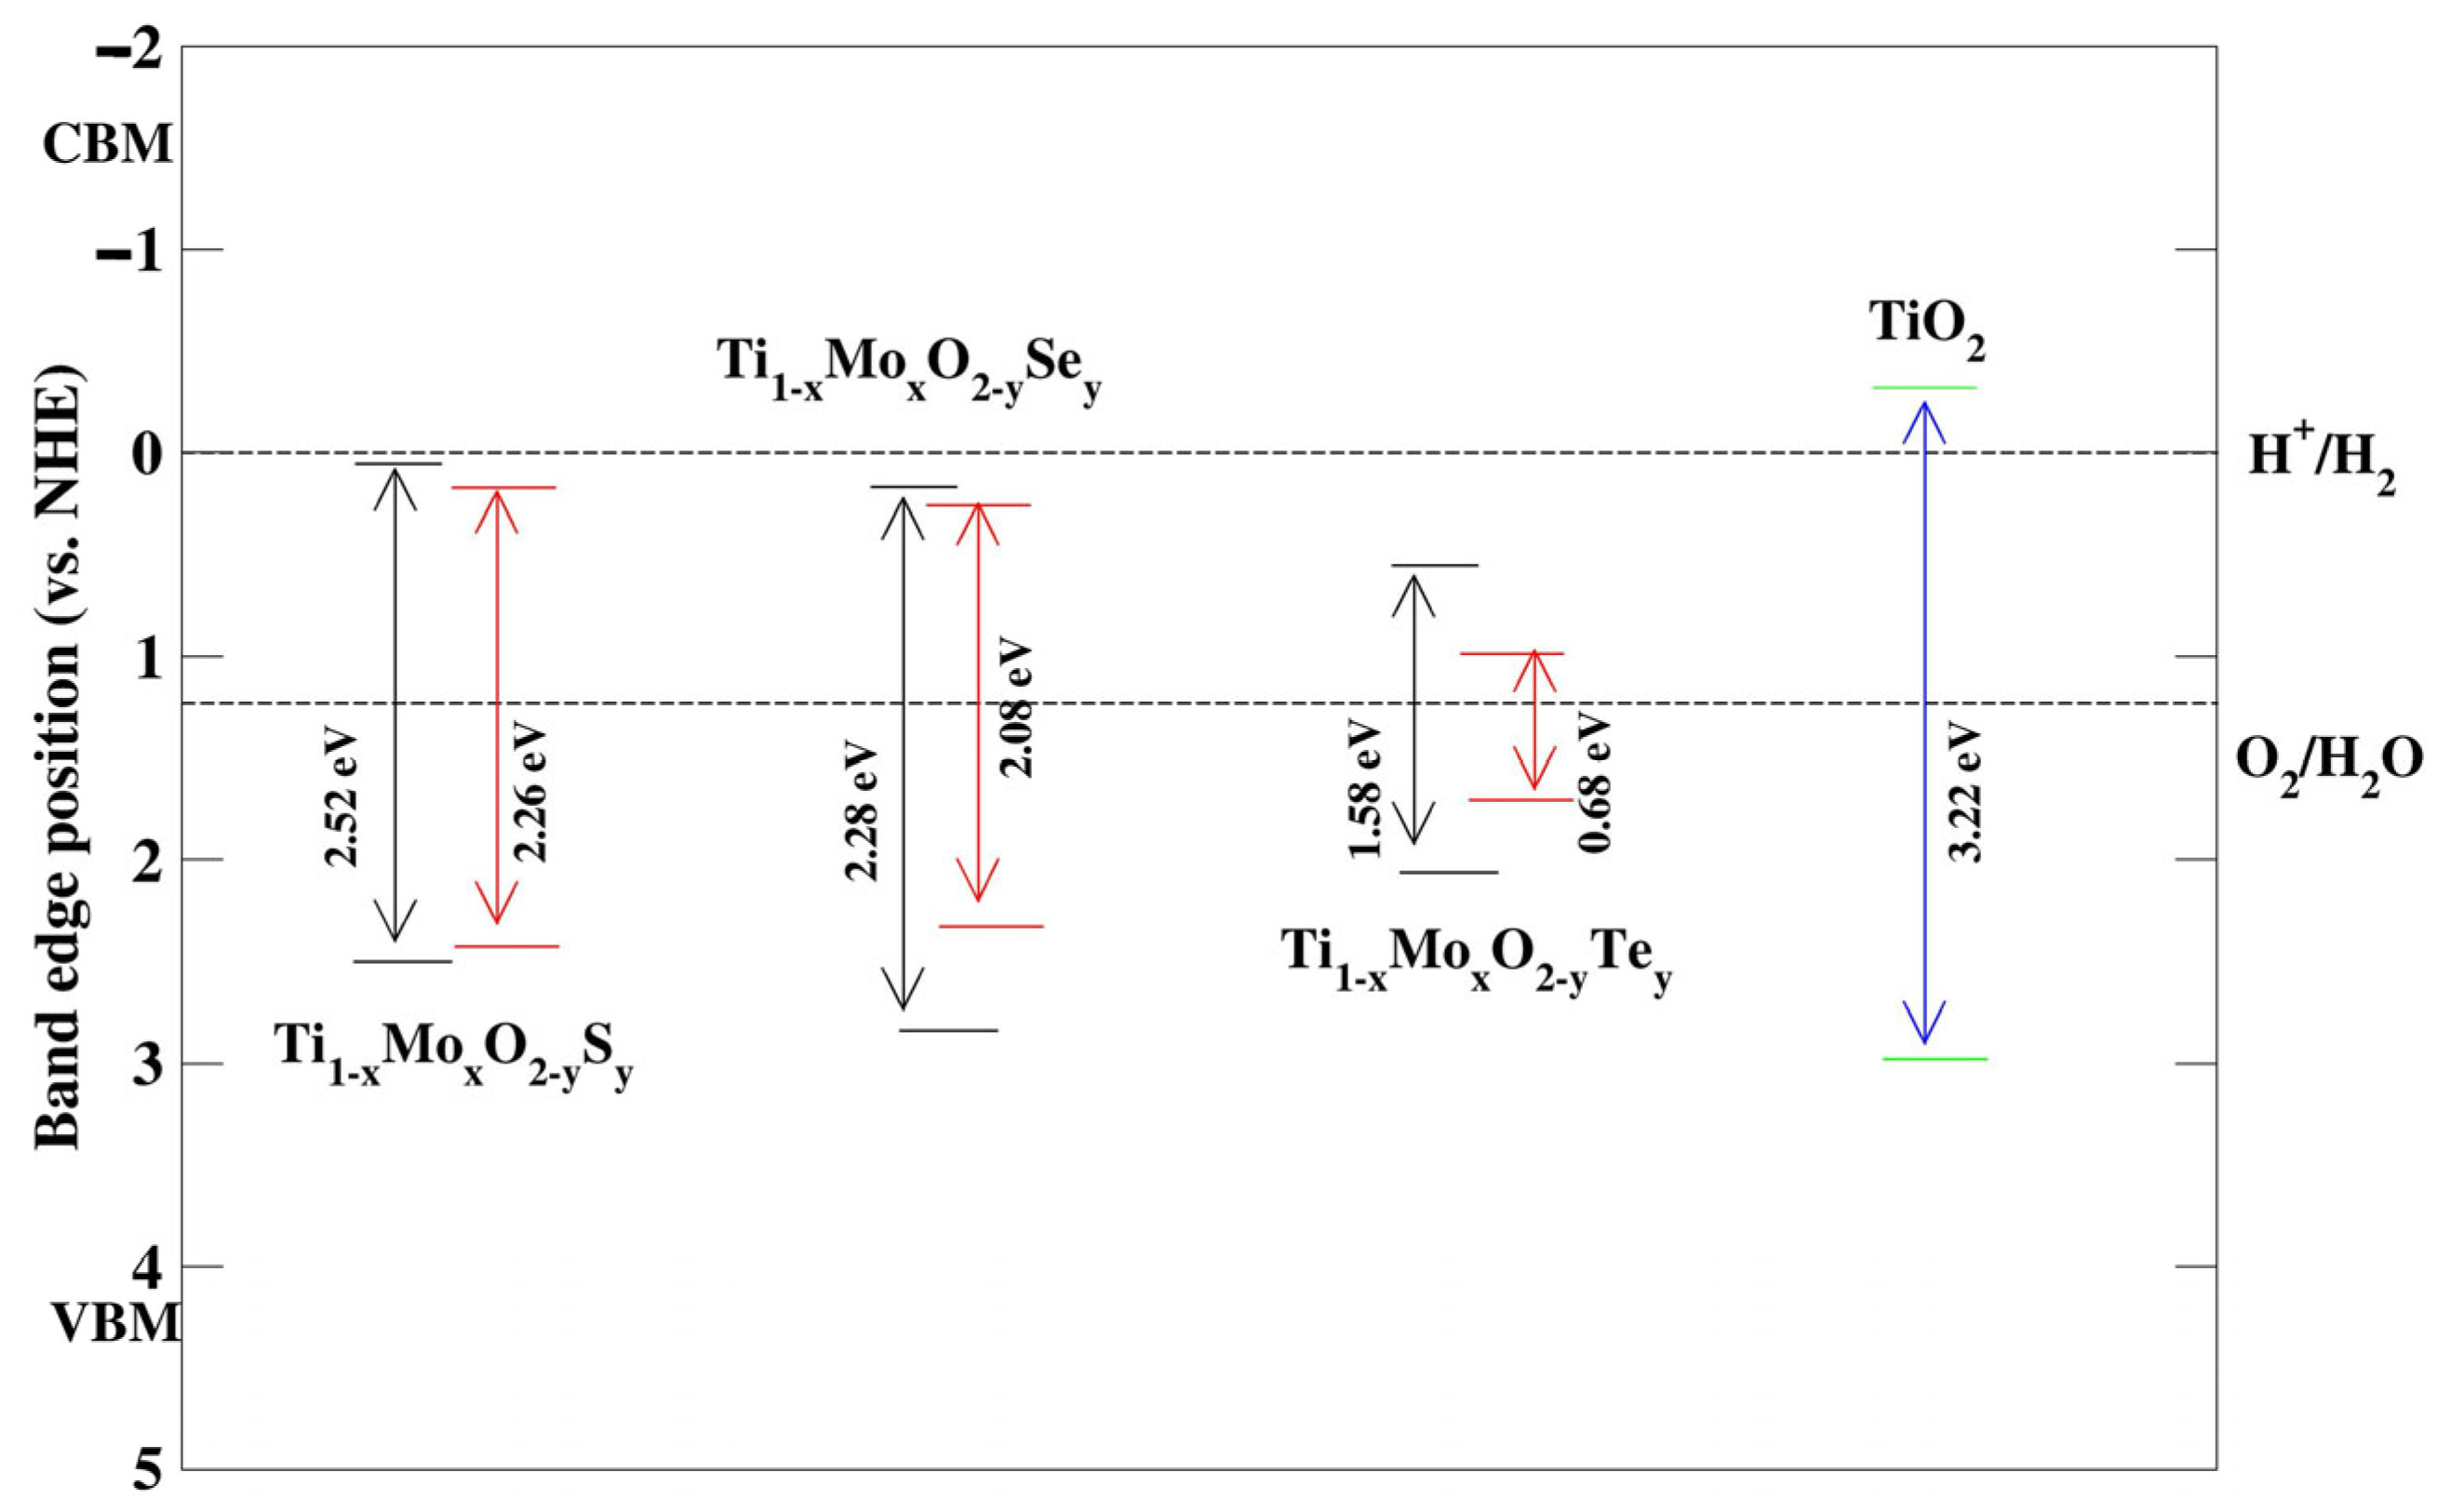
The CBM and VBM potentials of the co-doped systems in both Model 1 and Model 2 can be determined as shown in Figure 21 (Table 2) relative to the water reduction potential of H+/H2 (0 eV against the normal hydrogen electrode, NHE) and the water oxidation potential of O2/H2O (1.23 eV). These calculations follow the formula established by Butler and Ginley [36]. We determined the CBM and VBM potentials for both the pure and co-doped systems by applying the relevant Equations (5)–(9).
E C B = X + E o 1 2 E g E V B = E g + E C B ,
Here, E0 =−4.5 eV is the scale factor that bridges the absolute vacuum scale with the reference redox level of the normal hydrogen electrode (NHE), Eg signifies the bandgap energy, while X denotes the absolute electronegativity of the system, calculated using the following formulas:
For pure TiO2:
X T i O 2 = X T i χ O 2 1 3
For Mo-doped S:
X T i 1 x M o x O 2 y S y = X T i 1 x X M o x X O 2 y X S y 1 3
For Mo-doped Se:
X T i 1 x M o x O 2 y S e y = X T i 1 x X M o x X O 2 y X S e y 1 3
For Mo-doped Te:
X T i 1 x M o x O 2 y T e y = X T i 1 x X M o x X O 2 y X T e y 1 3
where (x = 0.0208, y = 0.0208) and XTi, XO, XMo, XS, XSe, and XTe are the absolute electronegativities of Ti, O, Mo, S, Se, and Te atoms, respectively, and their corresponding values are 3.45, 7.54, 3.9, 6.22, 5.89, and 5.49 eV [37].
All the co-doped systems except the Mo and Te co-doped models show stronger oxidation power as much as pure TiO2 does compound under visible light irradiation. Mo and Te co-doped models have better oxidation abilities in the infrared region. However, they show a lower ability of oxidation power than the pure anatase. Our findings suggest that the Mo/S and Mo/Se co-doped anatase systems possess significant oxidation power, making them suitable candidates for applications in oxidative photocatalysis under visible light. However, their limited reduction ability indicates that they may be less effective for photocatalytic applications that require both oxidation and reduction capabilities such as overall water splitting. In this case, these co-doped systems are effective for oxidation-driven photocatalytic applications, such as the degradation of organic pollutants or water oxidation reactions, where oxidative power is critical.

6. Optical Calculations

HSE06 optical calculations were performed to obtain more accurate values, though only for the S-doped models due to time constraints, as shown in Figure 20 and Figure 22. Because of its wide bandgap, pure anatase cannot absorb photon energy in the visible region and is responsive only to UV light. In contrast, the optical absorption spectrum of Mo-doped TiO2 indicates visible light absorption, as shown in Figure 22. The electron excitations involve transitions from O-2p states to Mo-4d states, aligning with recent theoretical calculations [38,39].
Absorption spectrums show that the co-doping affects the shifting of the absorption edge to the visible region and enhances the absorption peak in both the visible and UV regions other than the mono-doped Mo anatase structure. This could happen because of the impurity states present between the bandgaps of the undoped TiO2. Regarding the different locations of doped Mo and S relative to one another, the Model 2 structure in Figure 23 shows the enhancement of the absorption of both UV and visible light region compared with the Model 1 structure in Figure 20. The electrons are initially excited from the O-2p state and transferred through the S-3p and Mo-4d states to the conduction band of Ti-3d. Electronic property calculations reveal that impurity states are located within the bandgaps of co-doped anatase TiO2 structures, resulting in a shift of the absorbance spectrum toward the visible light region and an increased absorbance of 105 cm−1. The introduction of Mo and S into anatase TiO2 shifts the absorption edge of pure TiO2 from 3.2 eV to 1.91 eV and 1.5 eV for Model 1 and Model 2, respectively. The Tauc method is used to determine the absorption edge and estimate the optical band gap for direct electronic transitions [40]. The absorption edge shift is more significant in the co-doped TiO2 in both the models than in TiO2 doped solely with Mo. A similar observation was made for the Mo and N co-doped model, which shows a greater shift in the absorption edge compared with TiO2 mono-doped with Mo or N [38].

7. Bader Charge Analysis

The Bader charge (BC) analysis was performed for all Mo- and chalcogen-doped structures, and the corresponding charge distribution plots are shown in Figure 24. Introducing foreign atoms into the TiO2 lattice can result in charge imbalance. The charge density difference, Δ ρ   Chargedifference   , was calculated using a self-consistent approach by subtracting the electron densities of the doped system, ρ Dopedmodel   , which includes the Mo- and chalcogen-doped models, from the pure TiO2, ρ pure   , and the dopants, ρ Dopants   , as expressed by Equation (10):
Δ ρ   Chargedifference   = ρ Dopedmodel ρ pure   ρ Dopants  
According to the Bader charges in Figure 5, the Mo atoms in Model 2 have significantly higher positive charges (2.12–2.21). The dopants being farther apart might result in a different kind of charge interaction, where the dopants are more evenly distributed throughout the structure. This could allow Mo to donate more electrons compared with when the dopants are close, resulting in a stronger positive charge on Mo. The increased charge on Mo in Model 2 suggests that Mo might interact differently with the surrounding atoms when the dopants are more spread out. The nonmetallic dopants in Model 2 exhibit slightly more negative Bader charges (−0.65, −0.54, −0.36) compared with Model 1 (see Table S1). This suggests that when the dopants are positioned farther apart, they may attract more electron density, potentially increasing their influence on local charge redistribution in the system. The Mo dopant and the neighboring titanium atoms donate electrons, whereas the adjacent oxygen atoms and chalcogen nonmetals tend to attract electrons, as depicted in Figure 24. This is consistent with the BC analysis, which is illustrated in Figure 5.
In summary, in Model 1 (adjacent dopants), Ti atoms are slightly more positively charged, likely due to stronger interactions with the nearby dopants. In Model 2 (doped atoms far apart), Ti atoms are less positively charged because the interactions with the dopants are weaker. Mo atoms are more positively charged in Model 2 (where the dopants are far apart), suggesting that this configuration leads to stronger electron donation by Mo. This increased donation in Model 2 may influence the material’s optoelectronic properties, as reflected in the absorption spectrum shown in Figure 22. In Model 1, the closer positioning of dopants leads to more localized charge transfer to Mo, resulting in slightly lower charges. Oxygen charges are very similar between the two models, with only a minor decrease in Model 2. This suggests that the positioning of dopants has a minimal effect on the oxygen charge distribution. In Model 2, the nonmetallic dopants exhibit slightly more negative Bader charges, suggesting that when the dopants are positioned farther apart, they may attract more electron density from the surrounding lattice. In contrast, in Model 1, the closer proximity of Mo and the nonmetal may lead to stronger Mo–NM interactions, resulting in a more balanced charge distribution. The position of the dopants significantly influences the charge transfer behavior and could affect the material’s electronic properties such as its optoelectronic behavior, which is crucial for applications in clean-energy materials.

8. Spin Density

For the Te-doped Model 1, the net magnetization is zero, suggesting the system may have antiparallel spin polarization, where spin-up and spin-down regions cancel each other out, as shown in the density of states in Figure 17. Even though localized spin density exists, the antiparallel alignment results in zero net magnetization. As a result, the overall spin density could be symmetric or negligible, leading to zero magnetization. Tellurium (Te) is a non-magnetic element, which may not contribute to spin polarization, unlike Mo. According to the Figure 25, in Model 2, the net magnetic moment is −1.98 µB, similar to the Se/Mo system, indicating that the delocalization effect allows Mo to retain its spin contribution. The observed trends in the chart confirm that dopant positioning significantly affects spin polarization.
These results highlight a fundamental trade-off in dopant configuration design. Model 1, where dopants are positioned closely, offers better structural stability, lower ground-state energy, and reduced lattice distortion, which helps minimize defect states and charge recombination. This makes Model 1 more favorable for stable photocatalytic applications. In contrast, Model 2, with dopants placed farther apart, shows greater reductions in bandgap and stronger optical absorption in the visible range, along with enhanced magnetization. However, this comes at the cost of increased lattice strain and reduced stability. Thus, while Model 1 excels in structural and electronic cleanliness, Model 2 is better suited for enhanced optoelectronic and magnetic performance. This trade-off suggests that there is no universally optimal doping configuration. The selection between Model 1 and Model 2 should be based on the specific property requirements of the intended application, such as photocatalysis, photovoltaics, or spintronics, as well as on the feasibility of synthesizing the desired configuration experimentally.

9. Conclusions

This paper presents a calculation and analysis of the electronic and optical properties of anatase TiO2 doped with Mo and S, Se, or Te in two different configurations using density functional theory.
  • When Mo and the chalcogen atoms are placed in adjacent positions (Model 1), the system may exhibit a lower ground-state energy due to more stable interactions between the dopants, such as bonding, charge transfer, or lattice strain compensation, which reduce the overall energy.
  • Model 2 has higher energy because the dopants are farther apart, leading to less interaction and possibly a less stable electronic structure, but the volume remains smaller due to less distortion.
  • The degree of bandgap reduction depends on the distance between the doped Mo and chalcogen atoms, with Model 2 showing a greater reduction. The MoS-1 model, with adjacent dopants, exhibited fewer impurity states and the most optimal structural stability, potentially enhancing photocatalytic efficiency by reducing recombination.
  • Except for Mo/Te co-doped models, all co-doped systems show stronger oxidation power under visible light, similar to pure TiO2. Mo/S and Mo/Se co-doped anatase are effective for oxidation-driven photocatalytic applications but have limited reduction ability, making them less suitable for water splitting.
  • The thermodynamic stability of co-doped TiO2 systems is reflected in their formation energies, with Ti-rich environments being the most favorable for practical applications. This insight can guide further research to enhance material performance.
  • Co-doping TiO2 with Mo and S shifts the absorption edge into the visible region and enhances light absorption, with Mo/S–Model 2 showing a more significant shift from 3.2 eV (pure TiO2) to 1.5 eV.

Supplementary Materials

The following supporting information can be downloaded at: https://www.mdpi.com/article/10.3390/computation13070170/s1, Figure S1: Structural Optimization of Mo and S doped models; Figure S2: Structural Optimization of Mo and Se doped models; Figure S3: Structural Optimization of Mo and Te doped models; Figure S4: Structural Optimization of the doped structures under the Model-1 category. Table S1: Bader charges for doped systems (Model 1 and Model 2).

Author Contributions

Conceptualization, W.A.C.P.W.; Methodology, W.A.C.P.W. and P.V.; Software, W.A.C.P.W.; Validation, W.A.C.P.W.; Formal analysis, W.A.C.P.W. and D.V.; Investigation, W.A.C.P.W.; Writing—original draft, W.A.C.P.W.; Writing—review & editing, W.A.C.P.W., P.V., T.R. and D.V.; Visualization, W.A.C.P.W.; Supervision, P.V., T.R. and D.V.; Project administration, D.V.; Funding acquisition, D.V. All authors have read and agreed to the published version of the manuscript.

Funding

This research received no external funding.

Data Availability Statement

All data included in this article along with the Supplementary Document.

Acknowledgments

The authors extend their gratitude to the Research Council of Norway for the allocation of computational resources (project number NN2867k) at the Norwegian supercomputing facility. This research was supported by Grant No. NORPART2021/10095: Higher Education and Research Collaboration on Nanomaterials for Clean Energy Technologies 2.0 (HRNCET 2.0).

Conflicts of Interest

The authors declare no conflict of interest.

References

  1. Wanniarachchi, W.A.C.P.; Arunasalam, T.; Ravirajan, P.; Velauthapillai, D.; Vajeeston, P. Hybrid Functional Study on Electronic and Optical Properties of the Dopants in Anatase TiO2. ACS Omega 2023, 8, 42275–42289. [Google Scholar] [CrossRef] [PubMed]
  2. Jiang, L.; Zhou, S.; Yang, J.; Wang, H.; Yu, H.; Chen, H.; Zhao, Y.; Yuan, X.; Chu, W.; Li, H. Near-Infrared Light Responsive TiO2 for Efficient Solar Energy Utilization. Adv. Funct. Mater. 2021, 32, 2108977. [Google Scholar] [CrossRef]
  3. Zaleska, A. Doped-TiO2: A review Doped-TiO2: A Review. Recent Patents Eng. 2008, 2, 157–164. [Google Scholar] [CrossRef]
  4. Ibrahim, H.H.; Mohamed, A.A.; Ibrahim, I.A.M. Electronic sand optical properties of mono and co-doped anatase TiO2: First principles calculations. Mater. Chem. Phys. 2020, 252, 123285. [Google Scholar] [CrossRef]
  5. Pan, J.; Li, C.; Zhao, Y.; Liu, R.; Gong, Y.; Niu, L.; Liu, X.; Chi, B. Electronic properties of TiO2 doped with Sc, Y, La, Zr, Hf, V, Nb and Ta. Chem. Phys. Lett. 2015, 628, 43–48. [Google Scholar] [CrossRef]
  6. Umebayashi, T.; Yamaki, T.; Itoh, H.; Asai, K. Analysis of electronic structures of 3d transition metal-doped TiO2 based on band calculations. J. Phys. Chem. Solids 2002, 63, 1909–1920. [Google Scholar] [CrossRef]
  7. Devi, L.G.; Murthy, B.N.; Kumar, S.G. Photocatalytic activity of V5+, Mo6+ and Th4+ doped polycrystalline TiO2 for the degradation of chlorpyrifos under UV/solar light. J. Mol. Catal. A Chem. 2009, 308, 174–181. [Google Scholar] [CrossRef]
  8. Ohno, T.; Akiyoshi, M.; Umebayashi, T.; Asai, K.; Mitsui, T.; Matsumura, M. Preparation of S-doped TiO2 photocatalysts and their photocatalytic activities under visible light. Appl. Catal. A Gen. 2004, 265, 115–121. [Google Scholar] [CrossRef]
  9. Eslami, A.; Amini, M.M.; Yazdanbakhsh, A.R.; Mohseni-Bandpei, A.; Safari, A.A.; Asadi, A. N,S co-doped TiO2 nanoparticles and nanosheets in simulated solar light for photocatalytic degradation of non-steroidal anti-inflammatory drugs in water: A comparative study. J. Chem. Technol. Biotechnol. 2016, 91, 2693–2704. [Google Scholar] [CrossRef]
  10. Bu, X.; Wang, Y.; Li, J.; Zhang, C. Improving the visible light photocatalytic activity of TiO2 by combining sulfur doping and rectorite carrier. J. Alloys Compd. 2015, 628, 20–26. [Google Scholar] [CrossRef]
  11. El-Sheikh, S.M.; Zhang, G.; El-Hosainy, H.M.; Ismail, A.A.; O’SHea, K.E.; Falaras, P.; Kontos, A.G.; Dionysiou, D.D. High performance sulfur, nitrogen and carbon doped mesoporous anatase–brookite TiO2 photocatalyst for the removal of microcystin-LR under visible light irradiation. J. Hazard. Mater. 2014, 280, 723–733. [Google Scholar] [CrossRef] [PubMed]
  12. Mathew, S.; Ganguly, P.; Kumaravel, V.; Harrison, J.; Hinder, S.J.; Bartlett, J.; Pillai, S.C. Effect of chalcogens (S, Se, and Te) on the anatase phase stability and photocatalytic antimicrobial activity of TiO2. Mater. Today Proc. 2020, 33, 2458–2464. [Google Scholar] [CrossRef]
  13. Štengl, V.; Bakardjieva, S.; Bludská, J. Se and Te-modified titania for photocatalytic applications. J. Mater. Sci. 2011, 46, 3523–3536. [Google Scholar] [CrossRef]
  14. Gurkan, Y.Y.; Kasapbasi, E.; Cinar, Z. Enhanced solar photocatalytic activity of TiO2 by selenium(IV) ion-doping: Characterization and DFT modeling of the surface. Chem. Eng. J. 2013, 214, 34–44. [Google Scholar] [CrossRef]
  15. Zheng, J.W.; Bhattcahrayya, A.; Wu, P.; Chen, Z.; Highfield, J.; Dong, Z.; Xu, R. The origin of visible light absorption in chalcogen element (S, Se, and Te)-doped anatase TiO2 photoatalysts. J. Phys. Chem. C 2010, 114, 7063–7069. [Google Scholar] [CrossRef]
  16. Blöchl, P.E. Projector augmented-wave method. Phys. Rev. B 1994, 50, 17953–17979. [Google Scholar] [CrossRef]
  17. Kertesz, M.; Kresse, G. Performance of the Vienna ab iniTiO simulation package (VASP). J. Mol. Struct. 2003, 624, 37. [Google Scholar]
  18. Perdew, J.P.; Burke, K.; Ernzerhof, M. Generalized Gradient approximation Made Simple. Phys. Rev. Lett. 1996, 77, 3865. [Google Scholar] [CrossRef]
  19. Monkhorst, H.J.; Pack, J.D. Special points for Brillouin-zone integrations. Phys. Rev. B 1976, 13, 5188–5192. [Google Scholar] [CrossRef]
  20. Meng, Q.; Wang, T.; Liu, E.; Ma, X.; Ge, Q.; Gong, J. Understanding electronic and optical properties of anatase TiO2 photocatalysts co-doped with nitrogen and transition metals. Phys. Chem. Chem. Phys. 2013, 15, 9549–9561. [Google Scholar] [CrossRef]
  21. Shishkin, M.; Sato, H. DFT+ U in Dudarev’s formulation with corrected interactions between the electrons with opposite spins: The form of Hamiltonian, calculation of forces, and bandgap adjustments. J. Chem. Phys. 2019, 151, 024102. [Google Scholar] [CrossRef] [PubMed]
  22. Jain, A.; Ong, S.P.; Hautier, G.; Chen, W.; Richards, W.D.; Dacek, S.; Cholia, S.; Gunter, D.; Skinner, D.; Ceder, G.; et al. The Materials Project: A materials genome approach to accelerating materials innovation. APL Mater. 2013, 1, 011002. [Google Scholar] [CrossRef]
  23. Heyd, J.; Scuseria, G.E. Efficient hybrid density functional calculations in solids: Assessment of the Heyd-Scuseria-Ernzerhof screened coulomb hybrid functional articles you may be interested in. J. Chem. Phys. 2004, 121, 1187. [Google Scholar] [CrossRef]
  24. Momma, K.; Izumi, F. VESTA 3 for three-dimensional visualization of crystal, volumetric and morphology data. J. Appl. Crystallogr. 2011, 44, 1272–1276. [Google Scholar] [CrossRef]
  25. Togo, A. First-principles phonon calculations with phonopy and phono3py. J. Phys. Soc. Jpn. 2023, 92, 012001. [Google Scholar] [CrossRef]
  26. Zhu, H.X.; Liu, J.M. First principles calculations of electronic and optical properties of Mo and C co-doped anatase TiO2. Appl. Phys. A Mater. Sci. Process 2014, 117, 831–839. [Google Scholar] [CrossRef]
  27. Arlt, T.; Bermejo, M.; Blanco, M.A.; Gerward, L.; Jiang, J.Z.; Olsen, J.S.; Recio, J.M. High-pressure polymorphs of anatase. Phys. Rev. B Condens. Matter Mater. Phys. 2000, 61, 14414–14419. [Google Scholar] [CrossRef]
  28. Al-Oubidy, E.A.; Kadhim, F.J. Photocatalytic activity of anatase titanium dioxide nanostructures prepared by reactive magnetron sputtering technique. Opt. Quantum Electron. 2019, 51, 23. [Google Scholar] [CrossRef]
  29. Sorantin, P.I.; Schwarz, K. Chemical bonding in rutile-type compounds. Inorg. Chem. 1992, 31, 567–576. [Google Scholar] [CrossRef]
  30. Soussi, A.; Hssi, A.A.; Boulkaddat, L.; Boujnah, M.; Abouabassi, K.; Haounati, R.; Asbayou, A.; Elfanaoui, A.; Markazi, R.; Ihlal, A.; et al. First principle study of electronic, optical and electrical properties of Mo doped TiO2. Comput. Condens. Matter 2021, 29, e00606. [Google Scholar] [CrossRef]
  31. Wang, S.; Bai, L.N.; Sun, H.M.; Jiang, Q.; Lian, J.S. Structure and photocatalytic property of Mo-doped TiO2 nanoparticles. Powder Technol. 2013, 244, 9–15. [Google Scholar] [CrossRef]
  32. Tian, F.H.; Liu, C.B. DFT description on electronic structure and optical absorption properties of anionic S-doped anatase TiO2. J. Phys. Chem. B 2006, 110, 17866–17871. [Google Scholar] [CrossRef] [PubMed]
  33. Liu, R.; Zhou, X.; Yang, F.; Yu, Y. Combination study of DFT calculation and experiment for photocatalytic properties of S-doped anatase TiO2. Appl. Surf. Sci. 2014, 319, 50–59. [Google Scholar] [CrossRef]
  34. Erikat, I.; Alkhabbas, M.; Hamad, B.; Alahmad, W. The Chalcogen (S, Se, and Te) Doping Effects on the Structural and Electronic Properties of Anatase (101) TiO2 Thin Surface Layers: DFT Study. Int. J. Photoenergy 2024, 2024, 3489162. [Google Scholar] [CrossRef]
  35. Xie, W.; Li, R.; Xu, Q. Enhanced photocatalytic activity of Se-doped TiO2 under visible light irradiation. Sci. Rep. 2018, 8, 8752. [Google Scholar] [CrossRef] [PubMed]
  36. Wang, G.Z.; Chen, H.; Luo, X.K.; Yuan, H.K.; Kuang, A.L. Bandgap engineering of SrTiO3/NaTaO3 heterojunction for visible light photocatalysis. Int. J. Quantum Chem. 2017, 117, e25424. [Google Scholar] [CrossRef]
  37. Pearson, R.G. Absolute electronegativity and hardness: Application to inorganic chemistry. Inorg. Chem. 1988, 27, 734–740. [Google Scholar] [CrossRef]
  38. Khan, M.; Xu, J.; Chen, N.; Cao, W. First principle calculations of the electronic and optical properties of pure and (Mo, N) co-doped anatase TiO2. J. Alloys Compd. 2012, 513, 539–545. [Google Scholar] [CrossRef]
  39. Yu, X.; Li, C.; Ling, Y.; Tang, T.A.; Wu, Q.; Kong, J. First principles calculations of electronic and optical properties of Mo-doped rutile TiO2. J. Alloys Compd. 2010, 507, 33–37. [Google Scholar] [CrossRef]
  40. Makuła, P.; Pacia, M.; Macyk, W. How To Correctly Determine the Band Gap Energy of Modified Semiconductor Photocatalysts Based on UV-Vis Spectra. J. Phys. Chem. Lett. 2018, 9, 6814–6817. [Google Scholar] [CrossRef]
Figure 1. The calculated bandgap for anatase, TiO2 as a function DFT + U value change.
Computation 13 00170 g001
Figure 2. (a) TiO2 supercell; (b) Mo-doped supercell; (c) co-doped Model 1; (d) co-doped Model 2. In these models, red, blue, yellow, and violet represent oxygen, titanium, S (or Se, Te), and molybdenum atoms, respectively.
Computation 13 00170 g002
Figure 3. Calculated cell volume % relative to the Mo-doped TiO2.
Computation 13 00170 g003
Figure 4. The formation energy values, eV, depicted in the heatmap highlight the thermodynamic stability of different co-doped TiO2 systems under ORC and TRC. Lower formation energies (lighter colors) indicate greater stability, while higher values (darker colors) suggest less favorable configurations.
Computation 13 00170 g004
Figure 5. Bader charges for the doped models Mo/S, Mo/Se, and Mo/Te in Model 1 and Model 2.
Computation 13 00170 g005
Figure 6. Electronic structure of the (a) Pure anatase TiO2 and (b) Mo-doped anatase TiO2.
Computation 13 00170 g006
Figure 7. Calculated total and site-projected density of states for pure anatase, TiO2.
Computation 13 00170 g007
Figure 8. Decomposition of the TiO2 DOS (a) for Ti atom and (b) Oxygen atom.
Computation 13 00170 g008
Figure 9. The molecular orbital diagram of pure TiO2 proposed by Soratin and Schwarz (* represents the π bonding) [29].
Computation 13 00170 g009
Figure 10. Calculated total and site-projected density of states for Mo-doped TiO2.
Computation 13 00170 g010
Figure 11. Bandgap structure and corresponding density of states diagram for the S- and Mo-doped system: (a) Model 1; (b) Model 2.
Computation 13 00170 g011
Figure 12. Calculated total and site-projected density of states for Mo/S-doped TiO2 in Model 1.
Computation 13 00170 g012
Figure 13. Calculated total and site-projected density of states for Mo/S-doped TiO2 in Model 2.
Computation 13 00170 g013
Figure 14. Bandgap structure and corresponding density of states diagram for the Se- and Mo-doped system: (a) Model 1; (b) Model 2.
Computation 13 00170 g014
Figure 15. Calculated total and site-projected density of states for Mo/Se-doped TiO2 in Model 1.
Computation 13 00170 g015
Figure 16. Calculated total and site-projected density of states for Mo/Se-doped TiO2 in Model 2.
Computation 13 00170 g016
Figure 17. Calculated total and site-projected density of states for Mo/Te-doped TiO2 in Model 1.
Computation 13 00170 g017
Figure 18. Bandgap structure and corresponding density of states diagram for the Te- and Mo-doped system: (a) Model 1; (b) Model 2.
Computation 13 00170 g018
Figure 19. Calculated total and site-projected density of states for Mo/Te-doped TiO2 in Model 2.
Computation 13 00170 g019
Figure 20. Computed absorption spectra for the pure and Mo-doped S, Model 1 anatase-doped structures.
Computation 13 00170 g020
Figure 21. The VBM and CBM positions for the co-doped anatase models were determined in relation to the water redox level. The horizontal dotted lines indicate the energy levels of the redox potentials for H+/H2 (0 eV vs. NHE) and O2/H2O (1.23 eV). The black and red colors represent Model 1 and Model 2, respectively.
Computation 13 00170 g021
Figure 22. Computed absorption coefficient for the Mo-doped anatase TiO2 in HSE06 approximation.
Computation 13 00170 g022
Figure 23. Computed absorption spectra for the pure and Mo-doped S, Model 2 anatase-doped structures.
Computation 13 00170 g023
Figure 24. Charge density difference of Mo-doped chalcogen anatase TiO2. Figures (a,d) represent Mo-doped S for Model 1 and Model 2; (b,e) correspond to Mo-doped Se for Model 1 and Model 2; (c,f) show Mo-doped Te for Model 1 and Model 2. Yellow and cyan colors represent charge accumulation and depletion, respectively.
Computation 13 00170 g024
Figure 25. Bar chart of net magnetic moment for the doped models Mo/S, Mo/Se, and Mo/Te in Model 1 and Model 2.
Computation 13 00170 g025
Table 1. Bond lengths of pure and doped models.
System BondsPure TiO2Mo and S Co-Doped TiO2Mo and Se Co-Doped
TiO2
Mo and Te Co-Doped TiO2
Model 1Model 2Model 1Model 2Model 1Model 2
Ti-O1.9564 Å1.9517 Å1.9430 Å1.9512 Å1.9452 Å1.9856 Å1.9641 Å
Mo-S 2.2351 Å4.3079 Å
Mo-Se 2.3487 Å4.2974 Å
Mo-Te 2.5487 Å4.2794 Å
Mo-O 1.9581 Å1.9291 Å1.9609 Å1.9324 Å1.9723 Å1.9525 Å
Ti-S 2.2373 Å2.2009 Å
Ti-Se 2.3431 Å2.3036 Å
Ti-Te 2.6342 Å2.5039Å
Table 2. Band edge positions of co-doped models and pure TiO2.
Band Edges (eV)Mo/S (XS = 5.807)Mo/Se (XSe = 5.805)Mo/Te (XTe = 5.802)Pure TiO2
Model 1Model 2Model 1Model 2Model 1Model 2
CBM0.050.180.160.270.510.96−0.3
VBM2.572.442.452.342.091.642.92
Disclaimer/Publisher’s Note: The statements, opinions and data contained in all publications are solely those of the individual author(s) and contributor(s) and not of MDPI and/or the editor(s). MDPI and/or the editor(s) disclaim responsibility for any injury to people or property resulting from any ideas, methods, instructions or products referred to in the content.

