Next Article in Journal
Solution of Coupled Systems of Reaction–Diffusion Equations Using Explicit Numerical Methods with Outstanding Stability Properties
Previous Article in Journal
Assessing the Validity of k-Fold Cross-Validation for Model Selection: Evidence from Bankruptcy Prediction Using Random Forest and XGBoost
 
 
Due to scheduled maintenance work on our database systems, there may be short service disruptions on this website between 10:00 and 11:00 CEST on June 14th.
Article

Dynamics of an Intraguild Predation Food Web Cooperation Model Under the Influence of Fear and Hunting

by
Alyaa Hussain Naser
and
Dahlia Khaled Bahlool
*
Department of Mathematics, College of Science, University of Baghdad, Baghdad 10071, Iraq
*
Author to whom correspondence should be addressed.
Computation 2025, 13(6), 128; https://doi.org/10.3390/computation13060128
Submission received: 29 March 2025 / Revised: 29 April 2025 / Accepted: 8 May 2025 / Published: 22 May 2025
(This article belongs to the Section Computational Biology)

Abstract

:
This study examines the impact of fear effects and cooperative hunting strategies in the context of intraguild predation food webs. The presented model includes a shared prey species with logistic growth and assumes that both the intraguild prey and intraguild predator draw their sustenance from the same resource. Using a Lyapunov function enables the system’s global stability to be proven. The impacts of key parameters on system stability are determined through bifurcation analysis. Numerical simulations show that even slight increases in the intensity of fear have drastic impacts on intraguild prey populations and, at higher levels, populations may go extinct. In addition, shifts in the parameter of cooperative hunting have a profound impact on the survival of the intraguild prey.

1. Introduction

In this study, we use mathematical models to understand food web predation dynamics. The use of models enables us to understand the variables within the mathematical model that best reflect a solution’s viability [1]. In ecology, intraguild predation (IGP) occurs when one predator consumes another predator species that shares the same prey, resulting in food webs with complex interactions where predators may both compete with and prey upon each other. The dynamics of intraguild interactions influence guild compositions in systems where productive resource utilization can drive interactions. For example, it has been shown that Colpidium striatum, an intraguild prey species, competes with Blepharisma across different productivity levels. Blepharisma, in turn, exhibits stronger competitive effects at elevated productivity levels when both species co-occur. The concept of predation arises from predator defense mechanisms, which can be explained through a mathematical model [2]. The method of defense adaptation allows various animals to coexist, especially if the entire output of the system is high. Still, when output is low, the capacity for coexistence to occur may be limited or improved. When rates of adaptation increase, three-species interactions become more stable. This means that changes in collective behavior affect the structure and dynamics of the ecosystem, which leads to intraguild predation (IGP). The authors of [3] looked at a three-species model and talked about how intraguild predation changes food webs with up to three trophic levels and makes populations unpredictable, especially when the level of intraguild predation is low, due to a Holling type I functional response. The author of [4] examined the consequences of dispersal techniques on intraguild prey and predators, including species that survive by preying on each other. In [5], the responses of a Lotka–Volterra model with three species and intraguild predation were considered. The model includes interactions between a base predator, an intraguild predator, and a top predator that eats both the base predator and the intraguild predator. This type of interaction is linear and considers competition among organisms in the world.
Fear has an impact on the behavior and activities of the shared prey and predators in an intraguild predation model. Some prey species can alter their appearance or hide to evade predators. They may achieve this by avoiding certain areas or changing their hunting strategies to minimize the threat of predation. Studies [6,7] have illustrated these behaviors. Furthermore, there have been studies on the effect of refuge, which we reviewed in previous studies [8,9]. Other studies have combined fear and refuge, such as [10]. Some researchers have studied age levels (for example, [11]), while others have been interested in studying stochastic intraguild predation models [12,13,14,15]. Knowing the complex structure of stochastic intraguild predation models is important for precisely predicting the ecological reactions to change and disturbances in the environment. By incorporating variability into such models, ecologists may obtain knowledge concerning the capacity for ecological structures to survive and maintain stability in an unpredictable environment. Other researchers have been interested in studying a model of the Allee effect in basal prey [16]. Intraguild diffusion was also investigated in [17,18]; the researchers were interested in investigating the stability and features of food webs for intraguild predation through hunting cooperation. The plankton model and its impact on intraguild predation were the focus of [19]. Tri-trophic food chains have also been discussed through bifurcation analyses and with regard to their stability; as an example, see [20]. Mixotrophy, studied in [21,22], refers to the capability of creatures to switch between autotrophic and heterotrophic modes of nutrition. Intraguild predation, on the other hand, refers to the action of one species preying on others inside the same community. Furthermore, research is being conducted on autotrophs, which are organisms that can produce their own food through photosynthesis or chemosynthesis. The authors of [23] showed that body size is an important factor that affects the formation of food webs. In addition, the authors of [24] presented a study conducted to establish a food web with a pest biocontrol setup. Their design featured Macrolophus pygmaeus Rambur and Orius laevigatus consuming thrips and aphids. A study [25] investigated the consequences of ant attendance on intraguild predation within leafcutter ants, which are the top predators in a food web. Another study attempted to identify immature stages [26]. Recent studies have noted the changes caused by cooperative hunting in predator–prey models. For instance, Meng and Xiao [27] analyzed how cooperation in hunting in a zooplankton–phytoplankton system can produce Hopf bifurcations and Turing instabilities, revealing the rich spatiotemporal dynamics that result from delay and diffusion effects. Analogously, Li and Ding [28] studied the implications of cooperative hunting by predators together with anti-predator tendencies in prey on the outcomes of classical predator–prey systems. Their work highlighted the fact that moderate levels of cooperation in hunting can greatly alter population densities and equilibria. Enhanced cooperation in hunting has provided further reasoning for understanding the pattern-forming and bifurcation structure of these systems. Tao and Wang [29] worked on prey-taxis systems and provided globally well-posed solutions, as well as the conditions under which Turing–Hopf bifurcations take place. At the same time, Peng et al. [30] analyzed a delayed predator–prey model with a stage structure and nonlinear response, providing an understanding of the impact that time delays and functional response have on the long-term dynamics and stability of the interacting populations.
In summary, the objectives of this study are as follows: (1) to develop a model that analyzes the interactions among three species—prey, intraguild prey, and intraguild predator—where the predator is capable of consuming both types of prey, and (2) to scrutinize the effects of fear and hunting on the system, with a numerical analysis supporting the existence of such effects.
This paper is arranged as follows: Section 1 presents the introduction. Section 2 presents the formulation of the model. Section 3 discusses the existence of equilibrium points and presents a mathematical basis for analyzing stability at the local level. Section 4 and Section 5 are devoted to examining global stability and the possibility of bifurcation in the recommended model. Section 6 presents an analysis of the numerical simulations performed using Mathematica 13.2. Finally, in Section 7, we present the main conclusions of our investigation.

2. Materials and Methods

In their interactions, intraguild (IG) predators feed on both intraguild prey and shared prey, while the intraguild prey also consume the shared species. This study explores the effects of fear and hunting cooperation among an intraguild prey, intraguild predator, and shared prey. We examine the idea that predator populations work together during hunts and that this cooperation instills fear in the shared prey, leading to more intricate dynamics. Mathematical models are employed to analyze and comprehend the dynamics of the food web system, with the following variables being considered in the models: The shared prey is indicated by P ( T ) , the intraguild prey is indicated by M ( T ) , and the intraguild predator is indicated by N ( T ) , with P 0 0 , M 0 0 , and N 0 0 . The shared prey suffers from a fear rate, denoted by α. In the absence of predators, the prey species undergoes logistic growth with carrying capacity K and intrinsic growth rate r . The consumption rate is denoted by b i , where i = 1,2 for the shared prey consumed by the intraguild prey and predator, respectively, and i = 3 for the intraguild prey consumed by the intraguild predator. e i denotes the conversion rate, where i = 1,2 for conversion of the shared prey into the intraguild prey and predator, respectively, and i = 3 for conversion of the intraguild prey to the intraguild predator. d i i = 1,2 denotes the death rates of the intraguild prey and predator; these are constant parameters. c i i = 1,2 denotes hunting cooperation among the intraguild prey and predator.
A system of nonlinear differential equations can be constructed as follows based on the preceding assumptions and parameters, with all parameters assumed to be positive.
d P d T = r P 1 + α M + N 1 P K b 1 P M b 2 + c 1 N P N ,
d M d T = e 1 b 1 P M b 3 + c 2 N M N d 1 M ,
d N d T = e 2 b 2 + c 1 N P N + e 3 b 3 + c 2 N M N d 2 N .
According to the provided assumptions, we are able to reduce the number of parameters within the model by nondimensionalizing it:
t = r T ,     p = P K ,         m = b 1 r ,   n = b 2 r N
Now, Equation (1) can be rewritten in a nondimensionalized style as follows:
d p d t = p 1 p 1 + s 0 m + s 1 n p m 1 + s 2 n p n = p f 1 ( p , m , n ) ,
d m d t = s 3 p m s 4 1 + s 5 n m n s 6 m = m f 2 ( p , m , n ) ,
d n d t = s 7 1 + s 2 n p n + s 8 1 + s 5 n m n s 9 n = n f 3 ( p , m , n ) .
where
s 0 = α r b 1 ,   s 1 = b 1 b 2 ,   s 2 = c 1 r b 2 2 ,   s 3 = e 1 b 1 K r ,
s 4 = b 3 b 2 ,   s 5 = c 2 r b 2 b 3 ,   s 6 = d 1 r ,
s 7 = e 2 b 2 K r ,   s 8 = e 3 b 3 b 1 ,   s 9 = d 2 r .
Obviously, Equation (3) is defined on R + 3 = { p , m , n R 3 , p 0 , m 0 , n 0 } .
The right-hand side of Equation (3) is characterized by continuous functions with continuous partial derivatives, so it can be argued that they are Lipschitz functions. Hence, Equation (3) has a solution that is unique, proving its existence.
Proposition 1. 
Equation (3) has solutions that are uniformly bounded.
Proof. 
The first formula of Equation (3), which represents the shared prey, is bounded, so
d p d t p 1 p ;     p t 1 ;   t
We define an appositive definite function:
G 1 = p + 1 s 3 m + 1 s 7 n ,
d G 1 d t = d p + 1 s 3 d m + 1 s 7 d n ,
d G 1 d t = p 1 p 1 + s 0 m + s 1 n p m 1 + s 2 n p n s 4 s 3 1 + s 5 n m n s 6 s 3 m
+ 1 + s 2 n p n + s 8 s 7 1 + s 5 n m n s 9 s 7 n ,
p s 4 s 3 s 8 s 7 1 + s 5 n m n s 6 s 3 m s 9 s 7 n
2 p p s 6 s 3 m s 9 s 7 n .
where µ = m i n 1 , s 6 , s 9 . Thus, we have
d G 1 d t + µ G 1 2
Therefore, all the solutions are uniformly bounded, with G 1 ( 0 , 2 µ ] for t .

3. Model Analysis

3.1. The Existence of Equilibrium Points

Equation (3) has five types of non-negative equilibrium points; their existence conditions and stability analyses are described below.
  • The trivial equilibria Ѻ 0 = 0 , 0 , 0 and Ѻ 1 = 1 , 0 , 0 always exist.
The third point Ѻ 2 = p ¯ , m ¯ , 0 exists in the p m -plane, where p ¯ = s 6 s 3 and a positive root is obtained from the quadratic equation s 0 s 3 m 2 + s 3 m s 3 s 6 = 0 .
m ¯ = s 3 2 s 0 s 3 + s 3 2 + 4 s 0 s 3 s 3 s 6 2 s 0 s 3 ;   with   s 3 > s 6
  • The fourth point is Ѻ 3 = p ^ , 0 , n ^ , where P ^ = s 9 s 7 1 + s 2 n ^
  • and n ^ is a solution for the polynomial equation
A 1 n 4 + A 2 n 3 + A 3 n 2 + A 4 n + A 5 = 0
where
A 1 = s 0 s 1 s 2 2 s 7 ,   A 2 = s 2 2 s 7 2 s 0 s 1 s 2 s 7 ,   A 3 = s 7 ( 2 s 2 + s 0 s 1 ) ,
  A 4 = s 7 ( s 2 1 ) ,   A 5 = s 7 s 9 .
Calculations explicitly show that there is one positive root of the above fourth-order polynomial equation, depending on the given conditions:
s 7 < s 9 ,
  • The fifth point is Ѻ 4 = p ¯ ¯ , m ¯ ¯ , n ¯ ¯ , where
    p ¯ ¯ = s 6 + s 4 1 + s 5 n * n * s 3 ,   m ¯ ¯ = s 3 s 9 ( s 6 s 7 + ( s 4 s 7 + s 2 s 6 s 7 ) n * + ( s 4 s 5 s 7 + s 2 s 4 s 7 ) n * 2 + s 2 s 4 s 5 s 7 n * 3 ) s 3 s 8 1 + s 5 n * .
  • and n ¯ ¯ is a positive root of the following seventh-order equation:
    β 1 n 7 + β 2 n 6 + β 3 n 5 + β 4 n 4 + β 5 n 3 + β 6 n 2 + β 7 n + β 8 = 0
The coefficients β i , i = 1, 2, …, 8, are determined as follows:
β 1 = s 0 s 2 2 s 3 2 s 4 2 s 5 3 s 7 2 s 8 + s 0 s 2 2 s 3 3 s 4 s 5 3 s 7 s 8 2 = s 0 s 2 2 s 3 2 s 4 s 5 3 s 7 s 8 s 4 s 7 s 8 ,
  β 2 = 3 s 0 s 2 2 s 3 2 s 4 2 s 5 2 s 7 2 s 8 2 s 0 s 2 s 3 2 s 4 2 s 5 3 s 7 2 s 8 + 3 s 0 s 2 2 s 3 3 s 4 s 5 2 s 7 s 8 2 + 2 s 0 s 2 s 3 3 s 4 s 5 3 s 7 s 8 2 + s 0 s 1 s 2 s 3 3 s 4 s 5 3 s 7 s 8 2 s 0 s 1 s 2 s 3 4 s 5 3 s 8 3 ,
β 3 = 3 s 0 s 2 2 s 3 2 s 4 2 s 5 s 7 2 s 8 6 s 0 s 2 s 3 2 s 4 2 s 5 2 s 7 2 s 8 s 0 s 3 2 s 4 2 s 5 3 s 7 2 s 8 2 s 0 s 2 2 s 3 2 s 4 s 5 2 s 6 s 7 2 s 8 + 3 s 0 s 2 2 s 3 3 s 4 s 5 s 7 s 8 2 + 6 s 0 s 2 s 3 3 s 4 s 5 2 s 7 s 8 2 + 3 s 0 s 1 s 2 s 3 3 s 4 s 5 2 s 7 s 8 2 + s 0 s 3 3 s 4 s 5 3 s 7 s 8 2 + s 0 s 1 s 3 3 s 4 s 5 3 s 7 s 8 2 + s 2 s 3 3 s 4 s 5 3 s 7 s 8 2 + s 0 s 2 2 s 3 3 s 5 2 s 6 s 7 s 8 2 3 s 0 s 1 s 2 s 3 4 s 5 2 s 8 3 s 0 s 1 s 3 4 s 5 3 s 8 3 s 2 s 3 4 s 5 3 s 8 3 s 3 3 s 4 s 5 4 s 8 3 ,
β 4 = s 0 s 2 2 s 3 2 s 4 2 s 7 2 s 8 6 s 0 s 2 s 3 2 s 4 2 s 5 s 7 2 s 8 3 s 0 s 3 2 s 4 2 s 5 2 s 7 2 s 8 4 s 0 s 2 2 s 3 2 s 4 s 5 s 6 s 7 2 s 8 4 s 0 s 2 s 3 2 s 4 s 5 2 s 6 s 7 2 s 8 + s 0 s 2 2 s 3 3 s 4 s 7 s 8 2 + 6 s 0 s 2 s 3 3 s 4 s 5 s 7 s 8 2 + 3 s 0 s 1 s 2 s 3 3 s 4 s 5 s 7 s 8 2 + 3 s 0 s 3 3 s 4 s 5 2 s 7 s 8 2 + 3 s 0 s 1 s 3 3 s 4 s 5 2 s 7 s 8 2 + 3 s 2 s 3 3 s 4 s 5 2 s 7 s 8 2 + s 3 3 s 4 s 5 3 s 7 s 8 2 + 2 s 0 s 2 2 s 3 3 s 5 s 6 s 7 s 8 2 + 2 s 0 s 2 s 3 3 s 5 2 s 6 s 7 s 8 2 + s 0 s 1 s 2 s 3 3 s 5 2 s 6 s 7 s 8 2 3 s 0 s 1 s 2 s 3 4 s 5 s 8 3 3 s 0 s 1 s 3 4 s 5 2 s 8 3 3 s 2 s 3 4 s 5 2 s 8 3 s 3 4 s 5 3 s 8 3 4 s 3 3 s 4 s 5 3 s 8 3 + 2 s 0 s 2 s 3 3 s 4 s 5 2 s 7 s 8 s 9 s 0 s 2 s 3 4 s 5 2 s 8 2 s 9 ,
β 5 = 2 s 0 s 2 s 3 2 s 4 2 s 7 2 s 8 3 s 0 s 3 2 s 4 2 s 5 s 7 2 s 8 2 s 0 s 2 2 s 3 2 s 4 s 6 s 7 2 s 8 8 s 0 s 2 s 3 2 s 4 s 5 s 6 s 7 2 s 8 2 s 0 s 3 2 s 4 s 5 2 s 6 s 7 2 s 8 s 0 s 2 2 s 3 2 s 5 s 6 2 s 7 2 s 8 + 2 s 0 s 2 s 3 3 s 4 s 7 s 8 2 + s 0 s 1 s 2 s 3 3 s 4 s 7 s 8 2 + 3 s 0 s 3 3 s 4 s 5 s 7 s 8 2 + 3 s 0 s 1 s 3 3 s 4 s 5 s 7 s 8 2 + 3 s 2 s 3 3 s 4 s 5 s 7 s 8 2 + 3 s 3 3 s 4 s 5 2 s 7 s 8 2 + s 0 s 2 2 s 3 3 s 6 s 7 s 8 2 + 4 s 0 s 2 s 3 3 s 5 s 6 s 7 s 8 2 + 2 s 0 s 1 s 2 s 3 3 s 5 s 6 s 7 s 8 2 + s 0 s 3 3 s 5 2 s 6 s 7 s 8 2 + s 0 s 1 s 3 3 s 5 2 s 6 s 7 s 8 2 + s 2 s 3 3 s 5 2 s 6 s 7 s 8 2 s 0 s 1 s 2 s 3 4 s 8 3 3 s 0 s 1 s 3 4 s 5 s 8 3 3 s 2 s 3 4 s 5 s 8 3 3 s 3 4 s 5 2 s 8 3 6 s 3 3 s 4 s 5 2 s 8 3 + s 3 4 s 5 3 s 8 3 s 3 3 s 5 3 s 6 s 8 3 s 0 s 1 s 3 4 s 5 2 s 8 2 s 9 + 4 s 0 s 2 s 3 3 s 4 s 5 s 7 s 8 s 9 + 2 s 0 s 3 3 s 4 s 5 2 s 7 s 8 s 9 2 s 0 s 2 s 3 4 s 5 s 8 2 s 9 s 0 s 3 4 s 5 2 s 8 2 s 9 ,
β 6 = s 0 s 3 2 s 4 2 s 7 2 s 8 4 s 0 s 2 s 3 2 s 4 s 6 s 7 2 s 8 4 s 0 s 3 2 s 4 s 5 s 6 s 7 2 s 8 s 0 s 2 2 s 3 2 s 6 2 s 7 2 s 8 2 s 0 s 2 s 3 2 s 5 s 6 2 s 7 2 s 8 + s 0 s 3 3 s 4 s 7 s 8 2 + s 0 s 1 s 3 3 s 4 s 7 s 8 2 + s 2 s 3 3 s 4 s 7 s 8 2 + 3 s 3 3 s 4 s 5 s 7 s 8 2 + 2 s 0 s 2 s 3 3 s 6 s 7 s 8 2 + s 0 s 1 s 2 s 3 3 s 6 s 7 s 8 2 + 2 s 0 s 3 3 s 5 s 6 s 7 s 8 2 + 2 s 0 s 1 s 3 3 s 5 s 6 s 7 s 8 2 + 2 s 2 s 3 3 s 5 s 6 s 7 s 8 2 + s 3 3 s 5 2 s 6 s 7 s 8 2 s 0 s 1 s 3 4 s 8 3 s 2 s 3 4 s 8 3 3 s 3 4 s 5 s 8 3 4 s 3 4 s 4 s 5 s 8 3 + 3 s 3 4 s 5 2 s 8 3 3 s 3 3 s 5 2 s 6 s 8 3 + 2 s 0 s 2 s 3 3 s 4 s 7 s 8 s 9 + 4 s 0 s 3 3 s 4 s 5 s 7 s 8 s 9 + 2 s 0 s 2 s 3 3 s 5 s 6 s 7 s 8 s 9 s 0 s 2 s 3 4 s 8 2 s 9 2 s 0 s 3 4 s 5 s 8 2 s 9 2 s 0 s 1 s 3 4 s 5 s 8 2 s 9 s 3 4 s 5 2 s 8 2 s 9 ,
β 7 = 2 s 0 s 3 2 s 4 s 6 s 7 2 s 8 2 s 0 s 2 s 3 2 s 6 2 s 7 2 s 8 s 0 s 3 2 s 5 s 6 2 s 7 2 s 8 + s 3 3 s 4 s 7 s 8 2 + s 0 s 3 3 s 6 s 7 s 8 2 + s 0 s 1 s 3 3 s 6 s 7 s 8 2 + s 2 s 3 3 s 6 s 7 s 8 2 + 2 s 3 3 s 5 s 6 s 7 s 8 2 s 3 4 s 8 3 s 3 3 s 4 s 8 3 + 3 s 3 4 s 5 s 8 3 3 s 3 3 s 5 s 6 s 8 3 + 2 s 0 s 3 3 s 4 s 7 s 8 s 9 + 2 s 0 s 2 s 3 3 s 6 s 7 s 8 s 9 + 2 s 0 s 3 3 s 5 s 6 s 7 s 8 s 9 s 0 s 3 4 s 8 2 s 9 s 0 s 1 s 3 4 s 8 2 s 9 2 s 3 4 s 5 s 8 2 s 9 s 0 s 3 4 s 5 s 8 s 9 2 ,
β 8 = s 3 3 s 6 s 7 s 8 2 + s 3 4 s 8 3 + 2 s 0 s 3 3 s 6 s 7 s 8 s 9 s 0 s 3 2 s 6 2 s 7 2 s 8 s 3 3 s 6 s 8 3 s 3 4 s 8 2 s 9 s 0 s 3 4 s 8 s 9 2 .
Therefore, for Equation (7), there is at least one positive root if β 1 and β 8 have opposite signs.

3.2. Stability Analysis

We examine the local stability of each equilibrium point by utilizing the Jacobian matrix and determining the eigenvalues. The Jacobian matrix p , m , n can be determined as follows:
p , m , n = f 1 + p f 1 p p f 1 m p f 1 n m f 2 p f 2 + m f 2 m m f 2 n n f 3 p n f 3 m f 3 + n f 3 n = ( a i j ) 3 × 3 ,
a 11 = p 1 1 + s 0 m + s 1 n + m + 1 + s 2 n n + p 1 + s 0 m + s 1 n , a 12 = p s 0 1 p 1 + s 0 m + s 1 n 2 + 1 ,
a 13 = p s 0 s 1 1 p 1 + s 0 m + s 1 n 2 + 1 + 2 s 2 n ,
a 21 = m s 3 ,
a 22 = s 3 p s 4 1 + s 5 n n s 6 ,
a 23 = m s 4 1 + 2 s 5 n ,
a 31 = n s 7 1 + s 2 n ,
a 32 = n s 8 1 + s 5 n ,
a 33 = s 7 1 + s 2 n p + s 8 1 + s 5 n m s 9 + n ( s 2 s 7 p + s 5 s 8 m ) .
The calculated Jacobian matrices can then be used to assess the local stability of the equilibrium points above. Let us determine the local stability around Ѻ 0 by calculating J Ѻ 0 as follows:
J 0 Ѻ 0 = 1 0 0 0 s 6 0 0 0 s 9
We find that l 11 = 1 ,   l 12 = s 6 ,   a n d   l 13 = s 9 , so Ѻ 0 is an unstable point with an unstable manifold in the p-direction and a stable manifold in the m n plane.
To determine the local stability around the second point, Ѻ 1 , we need to find J Ѻ 1 , which is written below:
J 1 Ѻ 1 = 1 1 1 0 s 3 s 6 0 0 0 s 7 s 9
Obviously, l 21 = 1 ,   l 22 = s 3 s 6 ,   a n d   l 23 = s 7 s 9 ; all have negative real parts and, thus, Ѻ 1 is locally asymptotically stable whenever the following conditions are satisfied.
s 3 < s 6 ,
s 7 < s 9 ,
The local stability around the point Ѻ 2 is now calculated from J Ѻ 2 , as follows:
J 2 Ѻ 2 = p ¯ 1 1 + s 0 p ¯ p ¯ s 0 1 p ¯ 1 + s 0 m ¯ 2 + 1 p ¯ s 0 s 1 1 p ¯ 1 + s 0 m ¯ 2 + 1 s 3 m ¯ 0 s 4 m ¯ 0 0 s 7 p ¯ + s 8 m ¯ s 9
The characteristic equation of J 2 Q 2 can be represented in the following form:
( l 2 T 1 l + D 1 ) ( s 7 p + s 8 m ¯ s 9 l ) = 0 ,
where
T 1 = p ¯ 1 1 + s 0 p ¯
D 1 = s 3 m ¯ p s 0 1 p ¯ 1 + s 0 m ¯ 2 + 1
It is clear that all eigenvalues of J 2 Ѻ 2 have a negative real part whenever the following condition is satisfied.
p ¯ < s 9 s 8 m ¯ s 7 ,
To determine the local stability around the point Ѻ 3 , we calculate J 3 Ѻ 3 as follows:
J 3 Ѻ 3 = p ^ 1 1 + s 0 s 1 n ^ p ^ s 0 1 p ^ 1 + s 0 s 1 n ^ 2 + 1 p ^ s 0 s 1 1 p ^ 1 + s 0 s 1 n ^ 2 + 1 + 2 s 2 n ^ 0 s 3 p ^ s 4 1 + s 5 n ^ n ^ s 6 0 n ^ s 7 1 + s 2 n ^ n ^ s 8 1 + s 5 n ^ s 2 s 7 p ^ n ^
The characteristic equation of J 3 Ѻ 3 can be described as follows:
( s 3 p ^ s 4 1 + s 5 n ^ n ^ s 6 l ) ( l 2 T 2 l + D 2 ) = 0
T 2 = p ^ 1 1 + s 0 s 1 n ^ + s 2 s 7 p ^ n ^
D 2 = s 2   s 7 p ^ 2 n ^ 1 1 + s 0 s 1 n ^ + n ^ p ^ s 7 1 + s 2 n ^ s 0 s 1 1 p ^ 1 + s 0 s 1 n ^ 2 + 1 + 2 s 2 n ^
It is easy to show that all eigenvalues of J 3 Ѻ 3 have a negative real part, and, thus, that Ѻ 3 is locally asymptotically stable, whenever the following conditions are satisfied.
p < m i n s 4 1 + s 5 n ^ n ^ + s 6 s 3 , 1 + s 2 n ^ 1 + s 0 s 1 n ^ s 2 s 0 s 1 1 p ^ 1 + s 0 s 1 n ^ 2 + 1 + 2 s 2 n ^
s 2 s 7 1 + s 0 s 1 n ^ n ^ < 1
Our next step is to calculate the local stability around the point Ѻ 4 , using the next theorem.
Proposition 2. 
If the following conditions are satisfied, Equation (3) will have a locally asymptotically stable equilibrium point,  Ѻ 4 .
n ¯ ¯ s 2 s 7 p ¯ ¯ + s 5 s 8 m ¯ ¯ < p ¯ ¯ 1 + s 0 m ¯ ¯ + s 1 n ¯ ¯
s 7 1 + s 2 n ¯ ¯ s 0 1 p ¯ ¯ 1 + s 0 m ¯ ¯ + s 1 n ¯ ¯ 2 + 1 < s 8 1 + s 5 n ¯ ¯ 1 + s 0 m ¯ ¯ + s 1 n ¯ ¯
s 2 s 7 p ¯ ¯ + s 5 s 8 m ¯ ¯ s 0 1 p ¯ ¯ 1 + s 0 m ¯ ¯ + s 1 n ¯ ¯ 2 + 1 < s 8 1 + s 5 n ¯ ¯
s 2 s 7 p ¯ ¯ + s 5 s 8 m ¯ ¯ 1 + s 0 m ¯ ¯ + s 1 n ¯ ¯ < s 7 1 + s 2 n ¯ ¯ s 0 s 1 1 p ¯ ¯ 1 + s 0 m ¯ ¯ + s 1 n ¯ ¯ 2 + 1 + 2 s 2 n ¯ ¯
S 0 s 1 1 p ¯ ¯ 1 + s 0 m ¯ ¯ + s 1 n ¯ ¯ 2 + 1 + 2 s 2 n ¯ ¯ s 8 n ¯ ¯ 1 + s 5 n ¯ ¯ < p ¯ ¯ 1 + s 0 m ¯ ¯ + s 1 n ¯ ¯ s 0 1 p ¯ ¯ 1 + s 0 m ¯ ¯ + s 1 n ¯ ¯ 2 + 1
s 8 n ¯ ¯ 1 + s 5 n ¯ ¯ s 2 s 7 p ¯ ¯ + s 5 s 8 m ¯ ¯ < s 7 p ¯ ¯ 1 + s 2 n ¯ ¯ s 0 1 p ¯ ¯ 1 + s 0 m ¯ ¯ + s 1 n ¯ ¯ 2 + 1
Proof. 
The Jacobian matrix for Equation (3) is represented by
J p ¯ ¯ , m ¯ ¯ , n ¯ ¯ = ( b i j ) 3 × 3 ,
where
b 11 = p ¯ ¯ 1 + s 0 m ¯ ¯ + s 1 n ¯ ¯ ,
b 12 = p ¯ ¯ s 0 1 p ¯ ¯ 1 + s 0 m ¯ ¯ + s 1 n ¯ ¯ 2 + 1 ,
b 13 = p ¯ ¯ s 0 s 1 1 p ¯ ¯ 1 + s 0 m ¯ ¯ + s 1 n ¯ ¯ 2 + 1 + 2 s 2 n ¯ ¯ ,
b 21 = m ¯ ¯ s 3 ,
b 22 = 0 ,
b 23 = m ¯ ¯ s 4 1 + 2 s 5 n ¯ ¯ ,
b 31 = s 7 n ¯ ¯ 1 + s 2 n ¯ ¯ ,
b 32 = s 8 n ¯ ¯ 1 + s 5 n ¯ ¯ ,
b 33 = n ¯ ¯ ( s 2 s 7 p ¯ ¯ + s 5 s 8 m ¯ ¯ ) .
Hence, the characteristic equation of Ѻ 4 can be expressed as
λ 3 + A 1 λ 2 + A 2 λ + A 3 = 0 ,
A 1 = ( b 11 + b 33 ) ,
A 2 = b 12 b 21 b 13 b 31 b 23 b 32 + b 11 b 33 ,
A 3 = b 23 b 12 b 31 b 11 b 32 + b 21 b 12 b 33 b 13 b 32 .
Δ = b 11 + b 33 b 11 b 33 b 13 b 31 + b 21 b 11 b 12 + b 13 b 32 + b 23 b 32 b 33 + b 12 b 31 .
Based on the Routh-Hurwitz criterion, all the roots of Equation (20) contain negative real values if they satisfy the conditions   A 1 > 0 , A 3 > 0 , and Δ > 0 . Based on direct calculations, Conditions (18a)–(18f) are sufficient to fulfil all the requirements of the Routh–Hurwitz criterion. Thus, local asymptotic stability is achieved. □

4. Global Stability

The aim of establishing global stability in dynamical systems, such as predator–prey models or other ecological systems, is to understand and predict the long-term behavior of the system regardless of its initial conditions. Through a global stability analysis, we can determine whether a given system will reach and remain in a stable equilibrium state over time, no matter where it starts. Asymptotic stability in dynamical systems is determined using Lyapunov functions, with an emphasis on global asymptotic stability that ensures the convergence of trajectory parameters across all states. The stability state is studied for each solution point of the system.
Proposition 3. 
Assuming that  Ѻ 1  is locally asymptotically stable, it will also be globally asymptotically stable under the following conditions:
s 7 > s 6 s 8 s 4 > s 3 s 8 s 4
s 9 > s 7 ( 1 + s 2 n m a x )  
Proof. 
We define the real-valued function V 1 = c 1 p ¯ p u p ¯ u d u + c 2 m + c 3 n , with p ¯ = 1 . Direct computation shows that V 1 : U 1 R ,   w h e r e   U 1 = p , m , n R + 3 : p > 0 , m 0 , n 0 ; therefore, V 1 Ѻ 1 = 0   &   V 1 p , m , n > 0 , p , m , n U 1 Ѻ 1 . Moreover, straightforward computations give the following:
d V 1 d t = c 1 p 1 p d p d t + c 2 d m d t + c 3 d n d t ,
D V 1 d t c 1 p 1 2 1 + s 0 m + s 1 n c 1 c 2 s 3 p m c 1 c 2 s 6 m c 3 s 9 c 1 1 + s 2 n n c 1 + c 3 s 7 + 1 + s 2 n p n c 2 s 4 c 3 s 8 1 + s 5 n m n .
Selecting positive constant values c 1 = s 7 , c 2 = s 8 s 4 , and c 3 = 1 , then applying the maximization concept with upper-bound constant µ, yields the following:
d V 1 d t s 7 p 1 2 1 + s 0 m + s 1 n m a x s 7 s 3 s 8 s 4 p m m a x s 7 s 6 s 8 s 4 m m a x ( s 9 s 7 ( 1 + s 2 n m a x ) ) n m a x .
where m m a x and n m a x are the upper bounds of m and n , respectively; hence, Conditions (21a) and (21b) give d V 1 d t < 0 . Therefore, Ѻ 1 is globally asymptotically stable. □
Proposition 4. 
Assuming that  Ѻ 2  is locally asymptotically stable, it will also be globally asymptotically stable under the following conditions:
s 3 s 8 s 4 < s 7 s 0 1 p ¯ H m a x H ¯ + 1
s 7 s 0 s 1 1 p ¯ p ¯ H m a x H ¯ + s 7 1 + s 2 n m a x p ¯ + s 8 1 + s 5 n m a x m ¯ < s 9
where H m a x = 1 + s 0 m m a x + s 1 n m a x , and m m a x and n m a x are the upper bounds of m and n , respectively.
Proof. 
We define the real-valued function V 2 = γ 1 p ¯ p u p ¯ u d u + γ 2 m ¯ m u m ¯ u d u + c 3 n . Direct computation shows that V 2 : U 2 R ,   w h e r e   U 2 = p , m , n R + 3 : p > 0 , m > 0 , n 0 ; therefore, V 2 Ѻ 2 = 0   &   V 2 p , m , n > 0 , p , m , n U 2 Ѻ 2 . Moreover, straightforward computations give the following:
d V 2 d t = γ 1 p p ¯ p d p d t + γ 2 m m ¯ m d m d t + γ 3 d n d t
d V 2 d t = γ 1 s 0 1 p ¯ H H ¯ + 1 p p ¯ m m ¯ γ 1 1 s 0 m ¯ H H ¯ p p ¯ 2 γ 1 s 0 s 1 1 p ¯ p p ¯ n H H ¯ γ 1 γ 3 s 7 1 + s 2 n p n + γ 1 1 + s 2 n p ¯ n + γ 2 s 3 m m ¯ p p ¯ γ 2 s 4 γ 3 s 8 1 + s 5 n m n + γ 2 s 4 1 + s 5 n m ¯ n γ 3 s 9 n ,
where H = 1 + s 0 m + s 1 n and H ¯ = 1 + s 0 m ¯ . By selecting the positive constant values γ 1 = s 7 , γ 2 = s 8 s 4 ,   a n d   γ 3 = 1 , we obtain the following:
d V 2 d t s 7 s 0 1 p ¯ H m a x H ¯ + 1 s 3 s 8 s 4 p p ¯ m m ¯ s 7 1 s 0 m ¯ H m a x H ¯ p p ¯ 2 + s 7 s 0 s 1 1 p ¯ p ¯ n H m a x H ¯ + s 7 1 + s 2 n p ¯ n + s 8 1 + s 5 n m ¯ n s 9 n
Further manipulation leads to
d V 2 d t s 7 s 0 1 p ¯ H m a x H ¯ + 1 s 3 s 8 s 4 m m ¯ 2 2 s 7 1 s 0 m ¯ H m a x H ¯ + 1 2 s 7 s 0 1 p ¯ H m a x H ¯ + 1 s 3 s 8 s 4 p p ¯ 2 s 9 s 7 s 0 s 1 1 p ¯ p ¯ H m a x H ¯ s 7 1 + s 2 n m a x p ¯ s 8 1 + s 5 n m a x m ¯ n m a x
Hence, Conditions (22a) and (22b) give d V 2 d t < 0 . Therefore, Ѻ 2   is globally asymptotically stable. □
Proposition 5. 
Assuming that  Ѻ 3  is locally asymptotically stable, it will also be globally asymptotically stable under the following conditions:
s 4 s 7 s 3 s 8 1 + s 2 n m a x < s 0 s 1 1 p ^ H m a x H ^ + 1 + s 2 n ^ ,
s 0 1 p ^ H ^ p ^ + p ^ < s 6 s 3 + s 4 s 3 n ^ ,
where H m a x = 1 + s 0 m m a x + s 1 n m a x , and m m a x   and n m a x are the upper bounds of m and n , respectively.
Proof. 
We define the real-valued function V 3 = ϖ 1 p ^ p u p ^ u d u + ϖ 2 m + ϖ 3 n ^ n u n ^ u d u . Direct computation shows that V 3 : U 3 R ,   w h e r e   U 3 = p , m , n R + 3 : p > 0 , m 0 , n > 0 ; therefore, V 3 Ѻ 3 = 0   &   V 3 p , m , n > 0 , p , m , n U 3 Ѻ 3 . Moreover, straightforward computations give the following:
d V 3 d t = ϖ 1 p p ^ p d p d t + ϖ 2 d m d t + ϖ 3 n n ^ n d n d t ,
d V 3 d t = ϖ 1 1 + s 0 s 1 n ^ H H ^ p p ^ 2 + ϖ 3 s 2 s 7 p ^ n n ^ 2 ϖ 1 s 0 1 p ^ H H ^ p m + ϖ 1 s 0 1 p ^ H H ^ p ^ m s 0 s 1 ϖ 1 1 p ^ H H ^ + β 1 1 + s 2 n ^ + n ϖ 3 s 7 s 2 n + 1 p p ^ n n ^ ϖ 1 ϖ 2 s 3 p m ϖ 2 s 4 ϖ 3 s 8 1 + s 5 n n m ϖ 2 s 6 m + ϖ 1 m p ^ ϖ 3 s 8 1 + s 5 n n ^ m ,
where H = 1 + s 0 m + s 1 n and H ^ = 1 + s 0 s 1 n ^ . By selecting the positive constant values ϖ 1 = 1 , ϖ 2 = 1 s 3 ,   a n d ϖ 3 = s 4 s 3 s 8 , we obtain the following:
d V 3 d t 1 + s 0 s 1 n ^ H m a x H ^ p p ^ 2 + s 2 s 7 s 4 s 3 s 8 p ^ n n ^ 2 s 0 s 1 1 p ^ H m a x H ^ + 1 s 4 s 7 s 3 s 8 1 + s 2 n + s 2 n ^ p p ^ n n ^ + s 0 1 p ^ H m a x H ^ p ^ m s 6 s 3 m + m p ^ s 4 s 3 1 + s 5 n n ^ m
Further manipulation leads to
d V 3 d t 1 + s 0 s 1 n ^ H m a x H ^ + 1 2 s 0 s 1 1 p ^ H H ^ + 1 s 4 s 7 s 3 s 8 1 + s 2 n + s 2 n ^ p p ^ 2 1 2 s 0 s 1 1 p ^ H H ^ + 1 s 4 s 7 s 3 s 8 1 + s 2 n + s 2 n ^ s 2 s 7 s 4 s 3 s 8 p ^ n n ^ 2 s 6 s 3 + s 4 s 3 n ^ s 0 1 p ^ H m a x H ^ p ^ p ^ m
Hence, Conditions (23a) and (23b) give d V 3 d t < 0 . Therefore, Ѻ 3   is globally asymptotically stable. □
Proposition 6. 
Assuming that  Ѻ 4  is locally asymptotically stable, it will also be globally asymptotically stable under the following conditions:
s 8 s 7 < s 4 s 3
2 s 2 s 7 p ̿ + s 5 s 8 m ̿ s 7 < s 4 s 5 s 3 n ̿
Proof. 
We define the real-valued function V 4 = τ 1 p ̿ p u p ̿ u d u + τ 2 m ̿ m u m ̿ u d u + τ 3 n ̿ n u n ̿ u d u . Direct computation shows that V 4 : U 4 R ,   w h e r e   U 4 = p , m , n R + 3 : p > 0 , m > 0 , n > 0 ; therefore, V 4 Ѻ 4 = 0   &   V 4 p , m , n > 0 , p , m , n U 4 Ѻ 4 . Moreover, straightforward computations give the following:
d V 4 d t = τ 1 p p ̿ p d p d t + τ 2 m m ̿ m d m d t + τ 3 n n ̿ n d n d t
d V 4 d t τ 1 1 + s 0 1 p ̿ 1 + s 0 m + s 1 n 1 + s 0 m ̿ + s 1 n ̿ m m ̿ p p ̿ + τ 3 s 7 1 + s 2 n p p ̿ n n ̿ τ 1 s 2 n n ̿ + 1 + s 0 s 1 1 p ̿ 1 + s 0 m + s 1 n 1 + s 0 m ̿ + s 1 n ̿ n n ̿ p p ̿ τ 1 p p ̿ 2 1 + s 0 m + s 1 n + τ 2 s 3 m m ̿ p p ̿ τ 2 s 4 1 + s 5 n + n ̿ n n ̿ m m ̿ + τ 3 s 8 s 5 n + 1 n n ̿ m m ̿ + τ 3 s 2 s 7 p ̿ + s 5 s 8 m ̿ n n ̿ 2 .
where H = 1 + s 0 m + s 1 n   and   H ̿ = 1 + s 0 m ̿ + s 1 n ̿ .
By selecting the positive constant values τ 1 = 1 , τ 2 = 1 s 3 , a n d τ 3 = 1 s 7 and completing some manipulations, we obtain the following:
d V 4 d t 1 2 s 0 1 + s 1 1 p ̿ H m a x H ̿ + s 2 n ̿ + 2 H p p ̿ 2 1 2 s 0 1 p ̿ H m a x H ̿ + s 4 s 3 s 8 s 7 1 + s 5 n ̿ + s 4 s 5 s 3 n m m ̿ 2 1 2 s 2 n ̿ + s 0 s 1 1 p ̿ H m a x H ̿ + s 4 s 3 s 8 s 7 1 + s 5 n ̿ + s 4 s 5 s 3 n 2 s 2 s 7 p ̿ + s 5 s 8 m s 7 n n ̿ 2
where H m a x = 1 + s 0 m m a x + s 1 n m a x , and m m a x   and n m a x are the upper bounds of m and n , respectively. Hence, Conditions (24a) and (24b) give d V 4 d t < 0 . Therefore, Ѻ 4 is globally asymptotically stable. □

5. Bifurcation Analysis

In a dynamic system, the bifurcation parameter is defined to determine whether an equilibrium point is hyperbolic. Employing Sotomayor’s theorem, researchers can determine the existence of local bifurcations. We rewrite Equation (3) in vector form as follows:
d X d t = F X
where X = p , m , n Τ and F X = p f 1 , m f 2 , n f 3 Τ .
Now, for every vector V = v 1 , v 2 , v 3 Τ , Equation (25) has a second directional derivative with respect to X , given by
D 2 F p , m , n V , V = Ω i j 3 × 1 .
where
Ω 11 = 2 v 1 2 1 + s 0 m + s 1 n 2 s 0 v 1 v 2 1 + s 0 m + s 1 n 2 + 4 s 0 p v 1 v 2 1 + s 0 m + s 1 n 2 2 v 1 v 2 2 s 0 s 1 v 1 v 3 1 + s 0 m + s 1 n 2 + 4 s 0 s 1 p v 1 v 3 1 + s 0 m + s 1 n 2 2 v 1 v 3 4 s 2 n v 1 v 3 + 2 1 p p s 0 2 v 2 2 1 + s 0 m + s 1 n 3 + 4 1 p p s 0 2 s 1 v 2 v 3 1 + s 0 m + s 1 n 3 + p 2 1 p s 0 2 s 1 2 1 + s 0 m + s 1 n 3 2 s 2 v 3 2 ,
Ω 21 = 2 s 3 v 1 v 2 2 s 4 v 2 v 3 4 s 4 s 5 n v 2 v 3 2 s 4 s 5 m v 3 2 ,
Ω 31 = s 2 1 + 2 s 7 n v 1 v 3 + s 8 1 + 2 s 5 n v 2 v 3 + 2 s 2 s 7 p v 3 2 + 2 s 5 s 8 m v 3 2 .
Proposition 7. 
Equation (3) undergoes transcritical bifurcation around the equilibrium point  Ѻ 1  when s 9   i s   e q u a l   t o   s 9 * = s 7 , provided the following condition:
1 2 s 7 0 ,
Proof. 
The Jacobian matrix given by (10) with s 9 * = s 7 can be written in the following form:
L Ѻ 1 , s 9 * = 1 1 1 0 s 3 s 6 0 0 0 0 .
where λ 11 = 1   a n d λ 12 = s 3 s 6 are eigenvalues of L Ѻ 1 , s 9 * , with λ 13 * = 0 . Thus, at equilibrium in the absence of predation, Ѻ 1 becomes a non-hyperbolic point.
V 1 * = v 11 , v 12 , v 13 Τ is the eigenvector of L Ѻ 1 , s 9 * associated with eigenvalue λ 13 * = 0 . Therefore, a straightforward calculation obtains V 1 * = v 13 , 0 , v 13 Τ , where v 13 is any real number not equal to zero.
Let the vector Ψ 1 = Ψ 11 , Ψ 12 , Ψ 13 Τ be the eigenvector of L Ѻ 1 , s 9 * Τ associated with the zero eigenvalue λ 13 * = 0 . Direct computation shows that Ψ 1 = 0 , 0 , Ψ 13 Τ , where Ψ 13 is any real number not equal to zero.
Accordingly, F s 9 = F s 9 = 0 , 0 , n Τ and, consequently, Ψ 1 Τ F s 9 Ѻ 1 , s 9 * = 0 .
The bifurcation in Equation (3) at Ѻ 1 with direct calculation gives the following:
D F s 9 Ѻ 1 , s 9 * = 0 0 0 0 0 0 0 0 1 ,
D F s 9 Ѻ 1 , s 9 * V 1 * = 0 , 0 , v 13 Τ
Then, Ψ 1 Τ D F s 9 E 1 , s 9 * V 1 * = Ψ 13 v 13 0 . Using Equation (26) with V 1   a t Ѻ 1 , s 9 * gives the following:
D 2 F Ѻ 1 , s 9 * V 1 * , V 1 * = 2 v 13 2 2 s 0 s 1 v 13 2 + 2 v 13 2 0 2 s 2 v 13 2 + 2 s 2 s 7 v 13 2 ,
Then,
Ψ 1 Τ D 2 F Ѻ 1 , s 9 * V 1 * , V 1 * = s 2 v 13 2 Ψ 13 ( 1 2 s 2 ) 0 .
Thus, Equation (3) experiences a transcritical bifurcation according to Sotomayor’s theorem at Ѻ 1   w h e n   s 9 * = s 7 and Condition (27) is satisfied. □
Proposition 8. 
Suppose that   s 9  is equal to s 9 * * = s 7 p ¯ + s 8 m ¯ ; then, Equation (3) undergoes transcritical bifurcation around the equilibrium point Ѻ 2 under the following condition:
s 2 ε 1 + s 8 ε 2 + 2 s 2 s 7 p ¯ + 2 s 5 s 8 m ¯ 0 .
Proof. 
The Jacobian matrix given by (12) with s 9 * * = s 7 p ¯ + s 8 m ¯ can be written in the following form:
L Ѻ 2 , s 9 * * = p ¯ 1 1 + s 0 m ¯ p ¯ s 0 1 p ¯ 1 + s 0 m ¯ 2 + 1 p ¯ s 0 s 1 1 p ¯ 1 + s 0 m ¯ 2 + 1 s 3 m ¯ 0 s 4 m ¯ 0 0 0 = ς i j .
Direct computation shows that L Ѻ 2 , s 9 * * has an eigenvalue of λ 23 * = 0 . Thus, the equilibrium point Ѻ 2 becomes a non-hyperbolic point. V 2 * = v 21 , v 22 , v 23 Τ is the eigenvector of L Ѻ 2 , s 9 * * associated with the eigenvalue λ 23 * = 0 . Therefore, straightforward calculations show that V 2 * = ε 1 v 23 , ε 2 v 23 , v 23 Τ , where v 23 is any real number not equal to zero, and
ε 1 = ς 23 ς 21 ,   ε 2 = ς 11 ς 23 ς 13 ς 21 ς 21 ς 12 .
Let the vector Ψ 2 * = Ψ 21 * , Ψ 22 * , Ψ 23 * Τ be the eigenvector of L Ѻ 2 , s 9 * * Τ associated with the zero eigenvalue λ 23 * * = 0 . In this case, direct computations show that Ψ 2 * = 0 , 0 , Ψ 23 * Τ , with Ψ 13 * 0 .
Accordingly,
F s 9 = F s 9 = 0 0 n ,
Hence, Ψ 2 * Τ F s 9 Ѻ 2 , s 9 * * = 0 .
The bifurcation in Equation (3) at Ѻ 2 , with direct calculation, gives the following:
D F s 9 Ѻ 2 , s 9 * * = 0 0 0 0 0 0 0 0 1
D F s 9 Ѻ 2 , s 9 * * V 2 * = 0 0 v 23
Then, Ψ 2 * Τ D F s 9 * * Ѻ 2 , s 9 * * V 2 * = v 23 Ψ 23 * 0 . Using Equation (26) with V 2 *   a t Ѻ 2 , s 9 * * gives the following:
Ψ 2 * Τ D 2 F Ѻ 2 , s 9 * V 2 * , V 2 * = s 2 ε 1 + s 8 ε 2 + 2 s 2 s 7 p ¯ + 2 s 5 s 8 m ¯ v 23 2 Ψ 23 * 0 .
Thus, Equation (3) experiences a transcritical bifurcation at Ѻ 2   w h e n   s 9 * * = s 7 p ¯ + s 8 m ¯ and Condition (28) is satisfied. □
Proposition 9. 
Equation (3) undergoes transcritical bifurcation around the equilibrium point  Ѻ 3  when s 6   i s   e q u a l   t o   s 6 * = s 3 p ^ s 4 1 + s 5 n ^ n ^ , provided that
s 3 η 1 s 4 η 2 ( 1 + 2 s 5 n ^ ) 0
Proof. 
The Jacobian matrix given by Equation (15) with s 6 * = s 3 p ^ s 4 1 + s 5 n ^ n ^ can be written in the following form:
L Ѻ 3 , s 6 * = p ^ 1 1 + s 0 s 1 n ^ p ^ s 0 1 p ^ 1 + s 0 s 1 n ^ 2 + 1 p ^ s 0 s 1 1 p ^ 1 + s 0 s 1 n ^ 2 + 1 + 2 s 2 n ^ 0 0 0 n ^ s 7 1 + s 2 n ^ n ^ s 8 1 + s 5 n ^ s 2 s 7 p ^ n ^ = ϱ i j .
Under Condition (18a), we have L Ѻ 3 , s 6 * with λ 32 * = 0 . Thus, at equilibrium in the absence of predation, Ѻ 3 becomes a non-hyperbolic point.
V 3 * = v 31 , v 32 , v 33 Τ is the eigenvector of L Ѻ 3 , s 6 * associated with the eigenvalue λ 32 * = 0 . Therefore, straightforward calculations show that V 3 * = η 1 v 32 , v 32 , η 2 v 32 Τ , where v 32 can be any real number not equal to zero, with
η 1 = ϱ 13 ϱ 32 ϱ 12 ϱ 33 ϱ 11 ϱ 33 ϱ 13 ϱ 31   and   η 2 = ϱ 12 ϱ 31 ϱ 11 ϱ 32 ϱ 11 ϱ 33 ϱ 13 ϱ 31 .
Let the vector Ψ 3 * = Ψ 31 * , Ψ 32 * , Ψ 33 * Τ be the eigenvector of L Ѻ 3 , s 6 * Τ associated with the zero eigenvalue λ 32 * = 0 . In this case, direct computations obtain Ψ 3 * = 0 , Ψ 32 * , 0 Τ , where Ψ 32 * is any real number not equal to zero.
Accordingly,
F s 6 = F s 6 = 0 m 0 ;   hence ,   Ψ 3 * Τ F s 6 Ѻ 3 , s 6 * = 0 .
Direct calculations give
D F s 6 Ѻ 3 , s 6 * = 0 0 0 0 1 0 0 0 0 and, consequently, the following:
D F s 6 Ѻ 3 , s 6 * V 3 * = 0 v 32 0 ,
Then, Ψ 3 * Τ D F s 6 Ѻ 3 , s 6 * V 3 * = v 32 Ψ 32 * 0 . By using Equation (26) with V 3 *   a t Ѻ 3 , s 6 * , we obtain
Ψ 3 * Τ D 2 F Ѻ 3 , s 6 * V 3 * , V 3 * = 2 s 3 η 1 s 4 η 2 ( 1 + 2 s 5 n ^ ) v 32 2 Ψ 32 * 0 .
Thus, Equation (3) experiences a transcritical bifurcation at Ѻ 3   w h e n   s 6 * = s 3 p ^ s 4 1 + s 5 n ^ n ^ under Condition (29). □
Proposition 10. 
A saddle-node bifurcation occurs near equilibrium  Ѻ 4  when parameter s 3 passes through the positive value  s 3 * = b 23 b 12 b 31 b 11 b 32 m ¯ ¯ b 12 b 33 b 13 b 32 , provided that Conditions (18a) and (18c), together with the following condition, are satisfied:
ξ 3 Ω 11 * + ξ 4 Ω 21 * + Ω 31 * 0 .
Proof. 
Consider the Jacobian matrix at Ѻ 4 given by Equation (19), which can be written in the following form:
J Ѻ 4 , s 3 * = [ b i j ( s 3 * ) ] ;   i , j = 1,2 , 3 .
The characteristic Equation (20) shows that coefficient A 3 = 0 when s 3 = s 3 * . Hence, it has the following eigenvalues:
λ 41 * = 0 ,
λ 42 * = A 1 2 1 2 A 1 2 4 A 2 ,
λ 43 * = A 1 2 + 1 2 A 1 2 4 A 2 .
Therefore, Ѻ 4 is a nonhyperbolic point. Let V 4 * = v 41 , v 42 , v 43 Τ be the eigenvector of J Ѻ 4 , s 3 * . Straightforward calculations show that V 4 * = ξ 1 v 43 , ξ 2 v 43 , v 43 Τ , where v 43 can be any real number not equal to zero, ξ 1 = b 23 b 21 , and ξ 2 = b 11 b 23 b 13 b 21 b 12 b 21 .
Let the vector ζ 4 * = ζ 41 * , ζ 42 * , ζ 43 * Τ be the eigenvector of δ Ѻ 4 , s 3 * Τ associated with the zero eigenvalue λ 41 * = 0 . Direct computations show that ζ 4 * = ξ 3 ζ 43 * , ξ 4 ζ 43 * , ζ 43 * Τ , where ζ 42 * is any real number not equal to zero, ξ 3 = b 32 b 12 , and ξ 4 = b 11 b 32 b 12 b 31 b 12 b 21 . Additionally, F s 3 = ( 0 , p ¯ ¯ m ¯ ¯ , 0 ) T , giving the following:
ζ 4 * Τ F s 3 Ѻ 4 , s 6 * = ξ 4 ζ 43 * p ¯ ¯ m ¯ ¯ 0 .
Now, by using Equation (26) with V 4 * at Ѻ 4 , w 6 * , we obtain
D 2 F Ѻ 4 , w 6 * V 4 * , V 4 * = Ω i 1 * 3 × 1 .
where
Ω 11 * = 2 ξ 1 2 v 43 2 1 + s 0 m ¯ ¯ + s 1 n ¯ ¯ 2 s 0 1 2 p ¯ ¯ 1 + s 0 m ¯ ¯ + s 1 n ¯ ¯ 2 + 2 ξ 1 ξ 2 v 43 2 2 s 0 s 1 1 2 p ¯ ¯ 1 + s 0 m ¯ ¯ + s 1 n ¯ ¯ 2 + 1 + 2 s 2 n ¯ ¯ ξ 1 v 43 2 + 2 1 p ¯ ¯ p ¯ ¯ s 0 2 ξ 2 2 v 43 2 1 + s 0 m ¯ ¯ + s 1 n ¯ ¯ 3 + 4 1 p ¯ ¯ p s 0 2 s 1 ξ 2 v 43 2 1 + s 0 m ¯ ¯ + s 1 n 3 + p ¯ ¯ 2 1 p s 0 2 s 1 2 1 + s 0 m ¯ ¯ + s 1 n 3 2 s 2 v 43 2 ,
Ω 21 * = 2 s 3 ξ 1 ξ 2 v 43 2 2 s 4 ξ 2 v 43 2 ( 1 + 2 s 5 n ¯ ¯ ) 2 s 4 s 5 m ¯ ¯ v 43 2 ,
Ω 31 * = s 2 1 + 2 s 7 n ¯ ¯ ξ 1 v 43 2 + s 8 1 + 2 s 5 n ¯ ¯ ξ 2 v 43 2 + 2 s 2 s 7 p ¯ ¯ v 43 2 + 2 s 5 s 8 m ¯ ¯ v 43 2 .
Therefore, by using Condition (30), it can be concluded that ζ 4 * Τ D 2 F Ѻ 4 , s 6 * V 4 * , V 4 * = ( ξ 3 Ω 11 * + ξ 4 Ω 21 * + Ω 31 * ) ζ 43 * 0 . Thus, Equation (3) experiences a saddle-node bifurcation. □

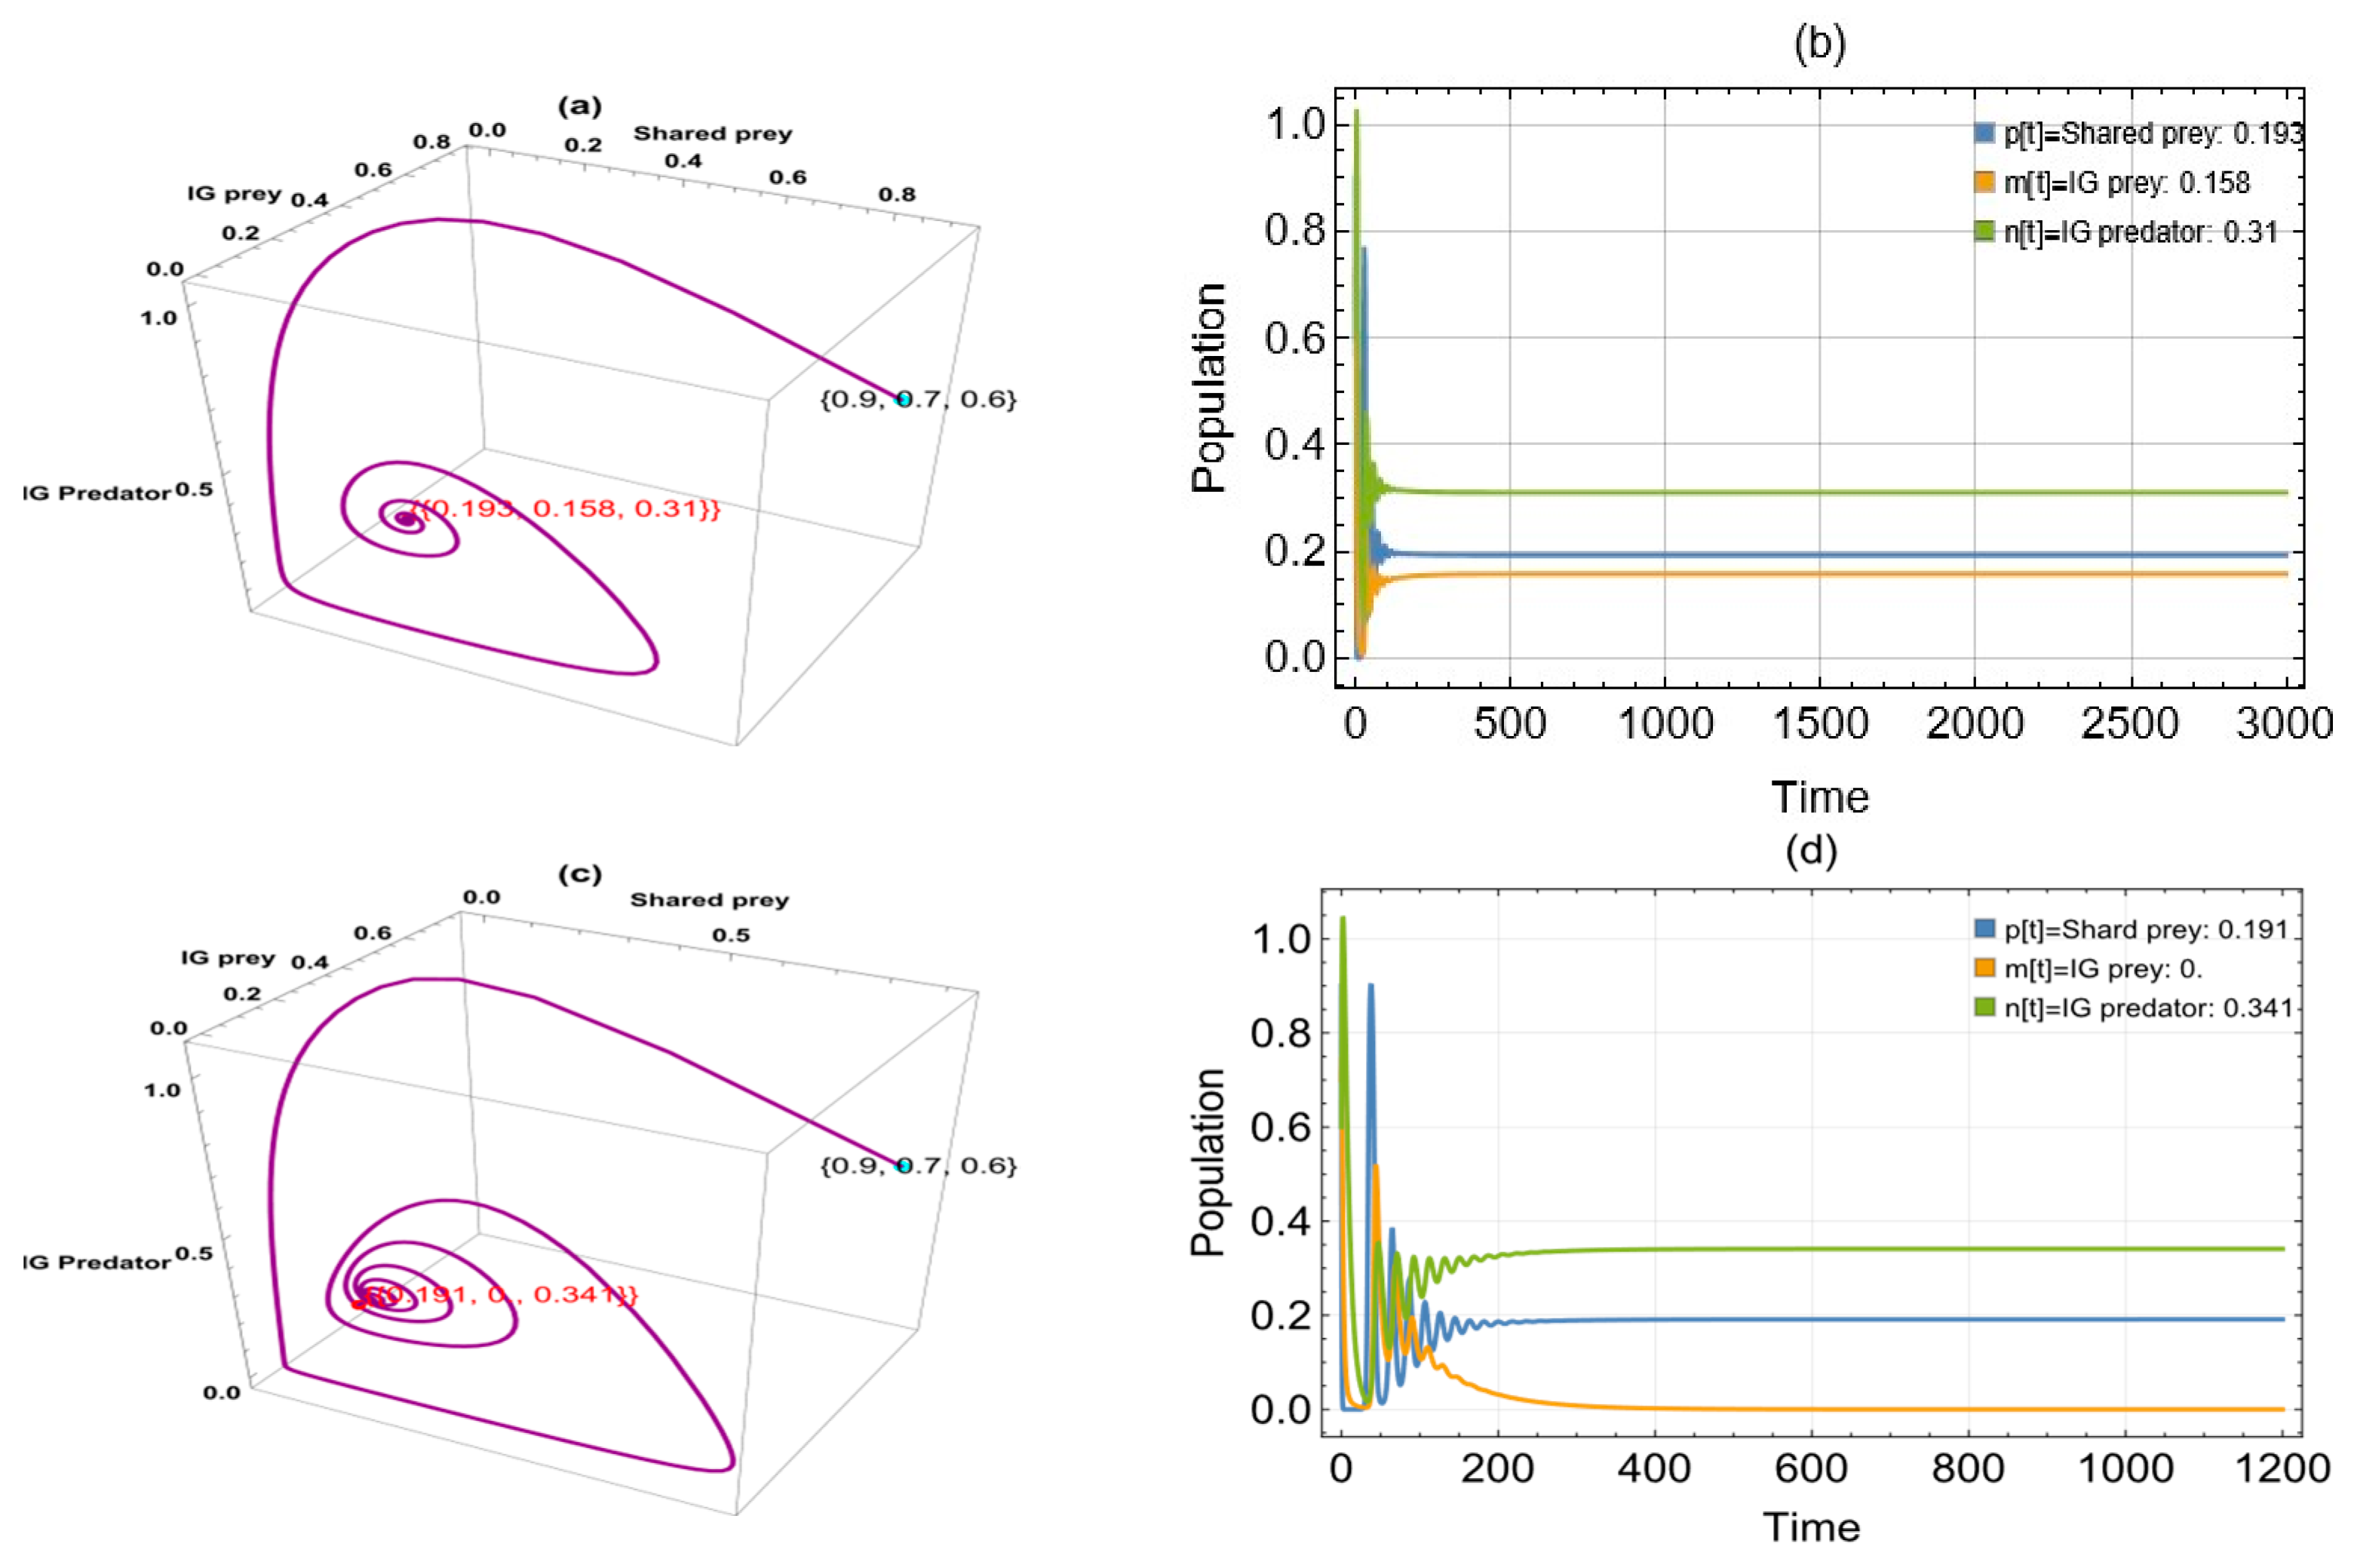
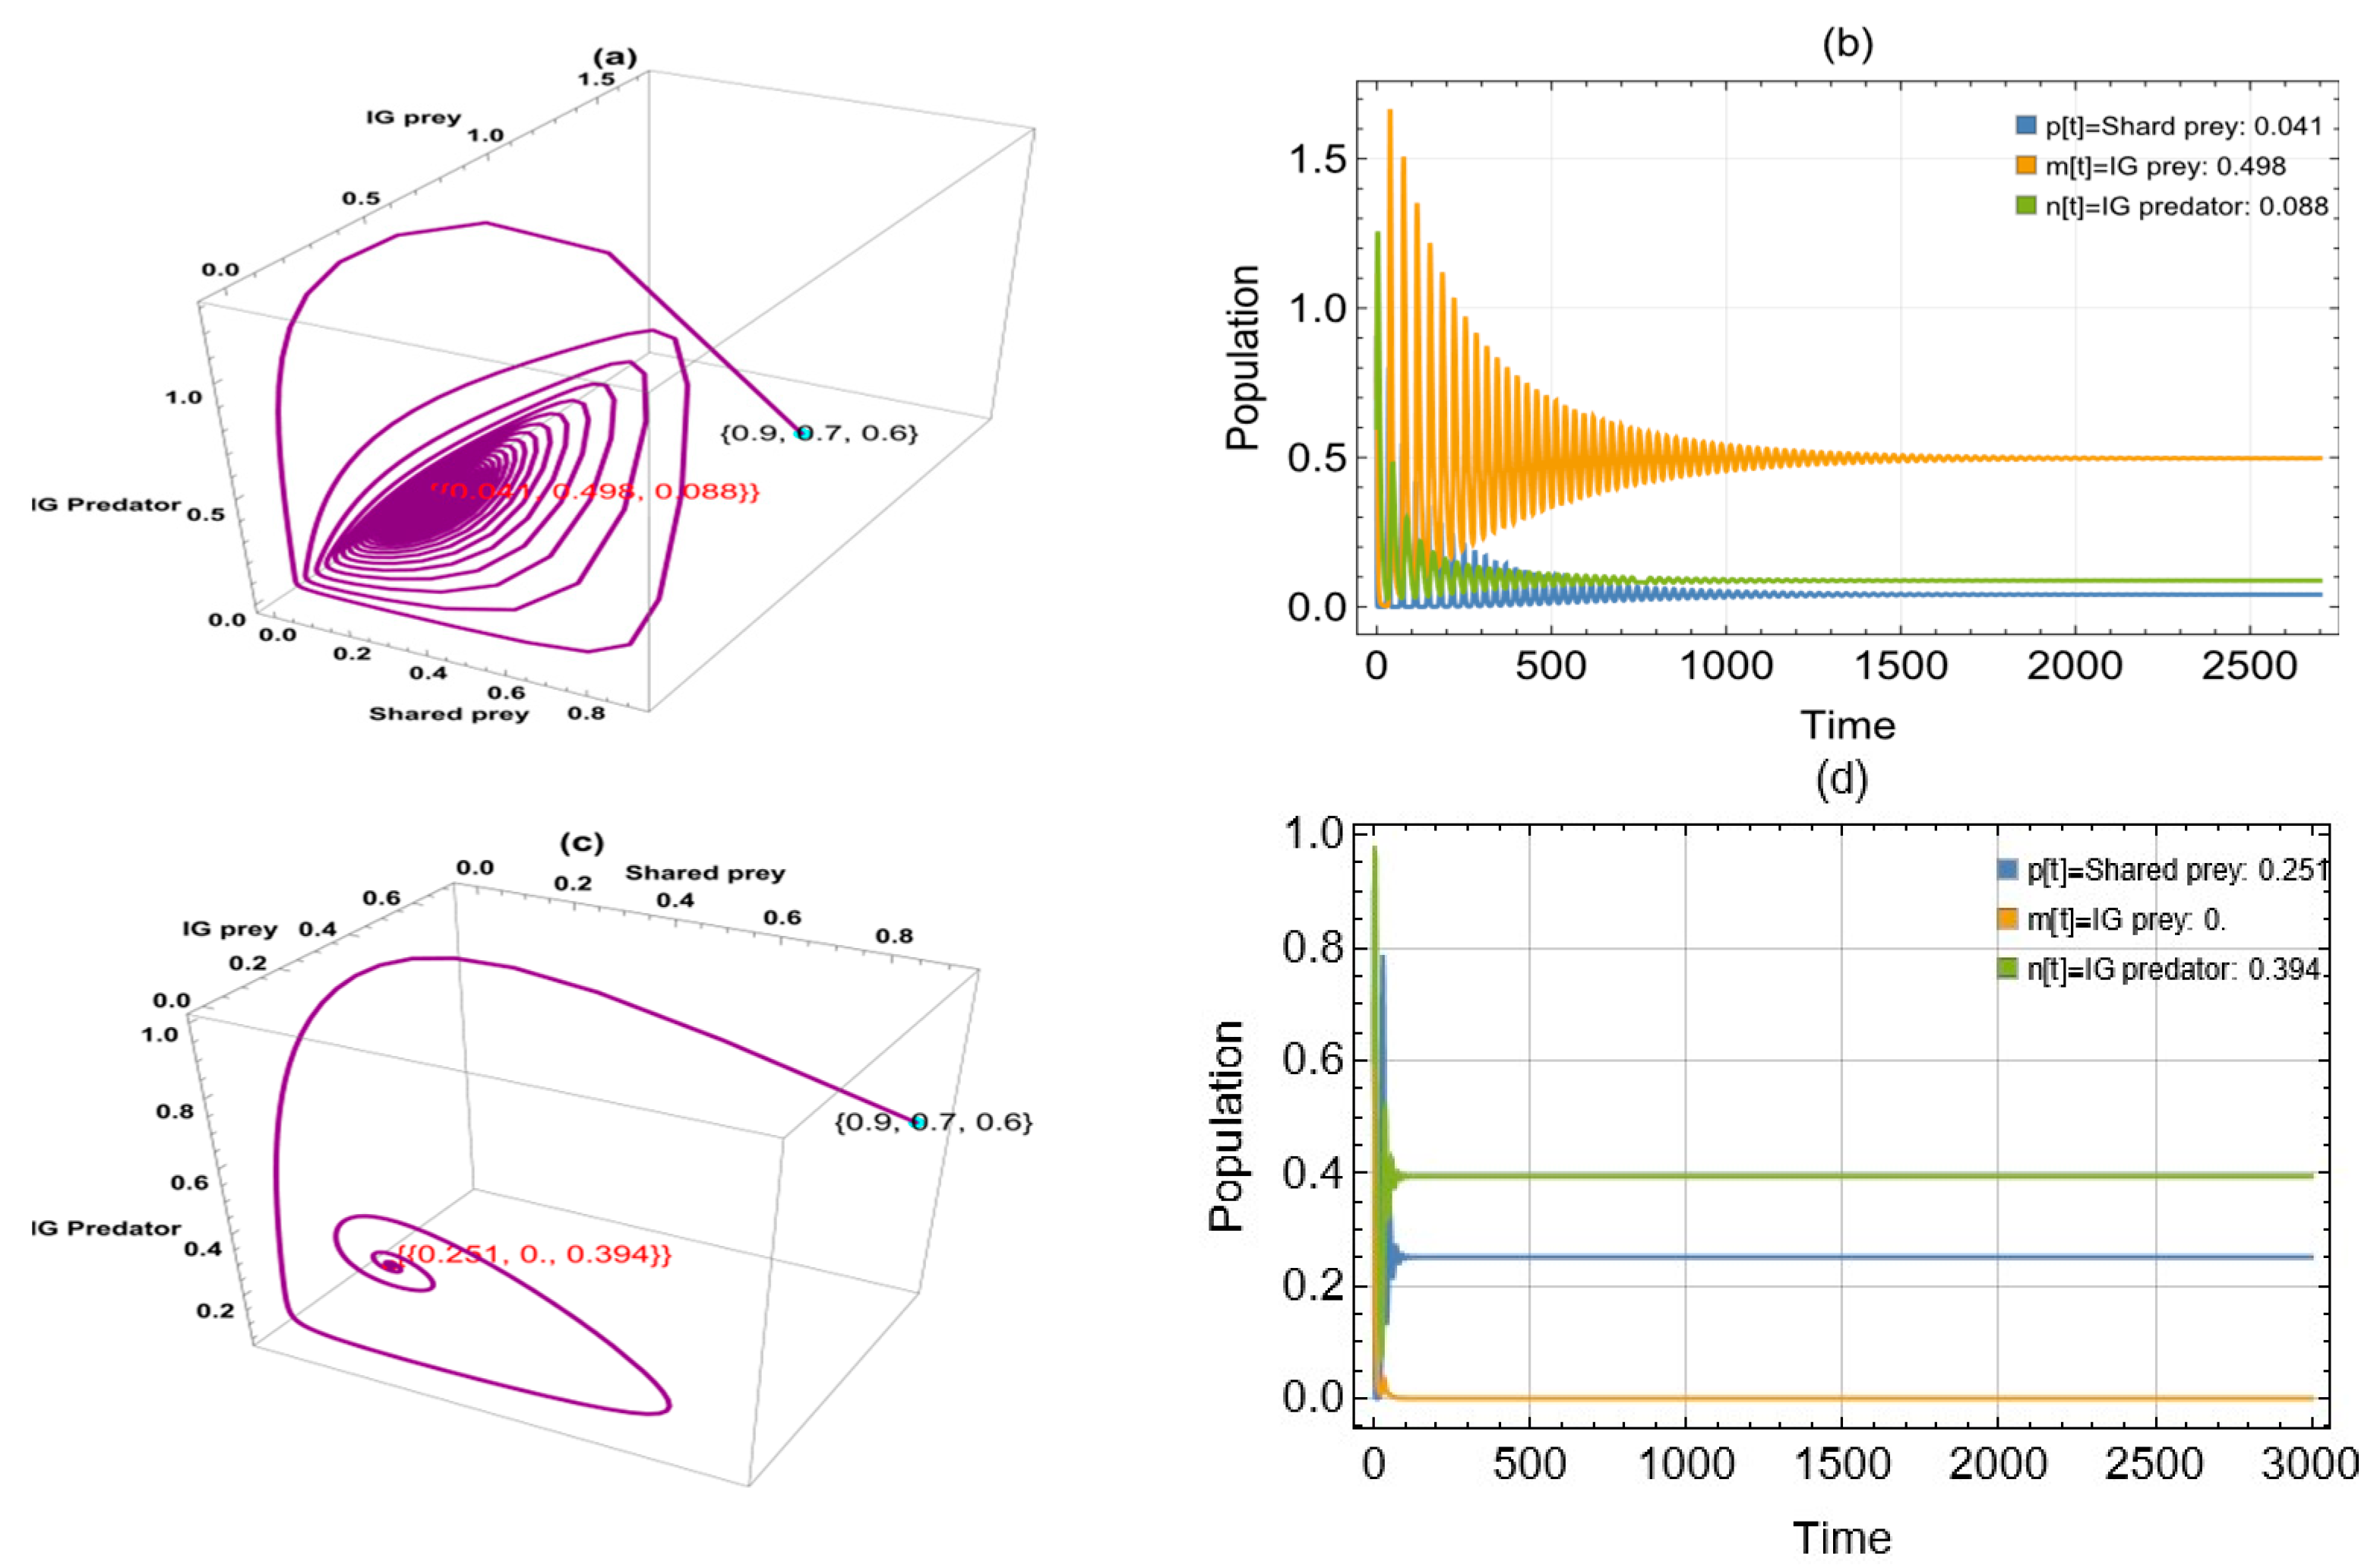
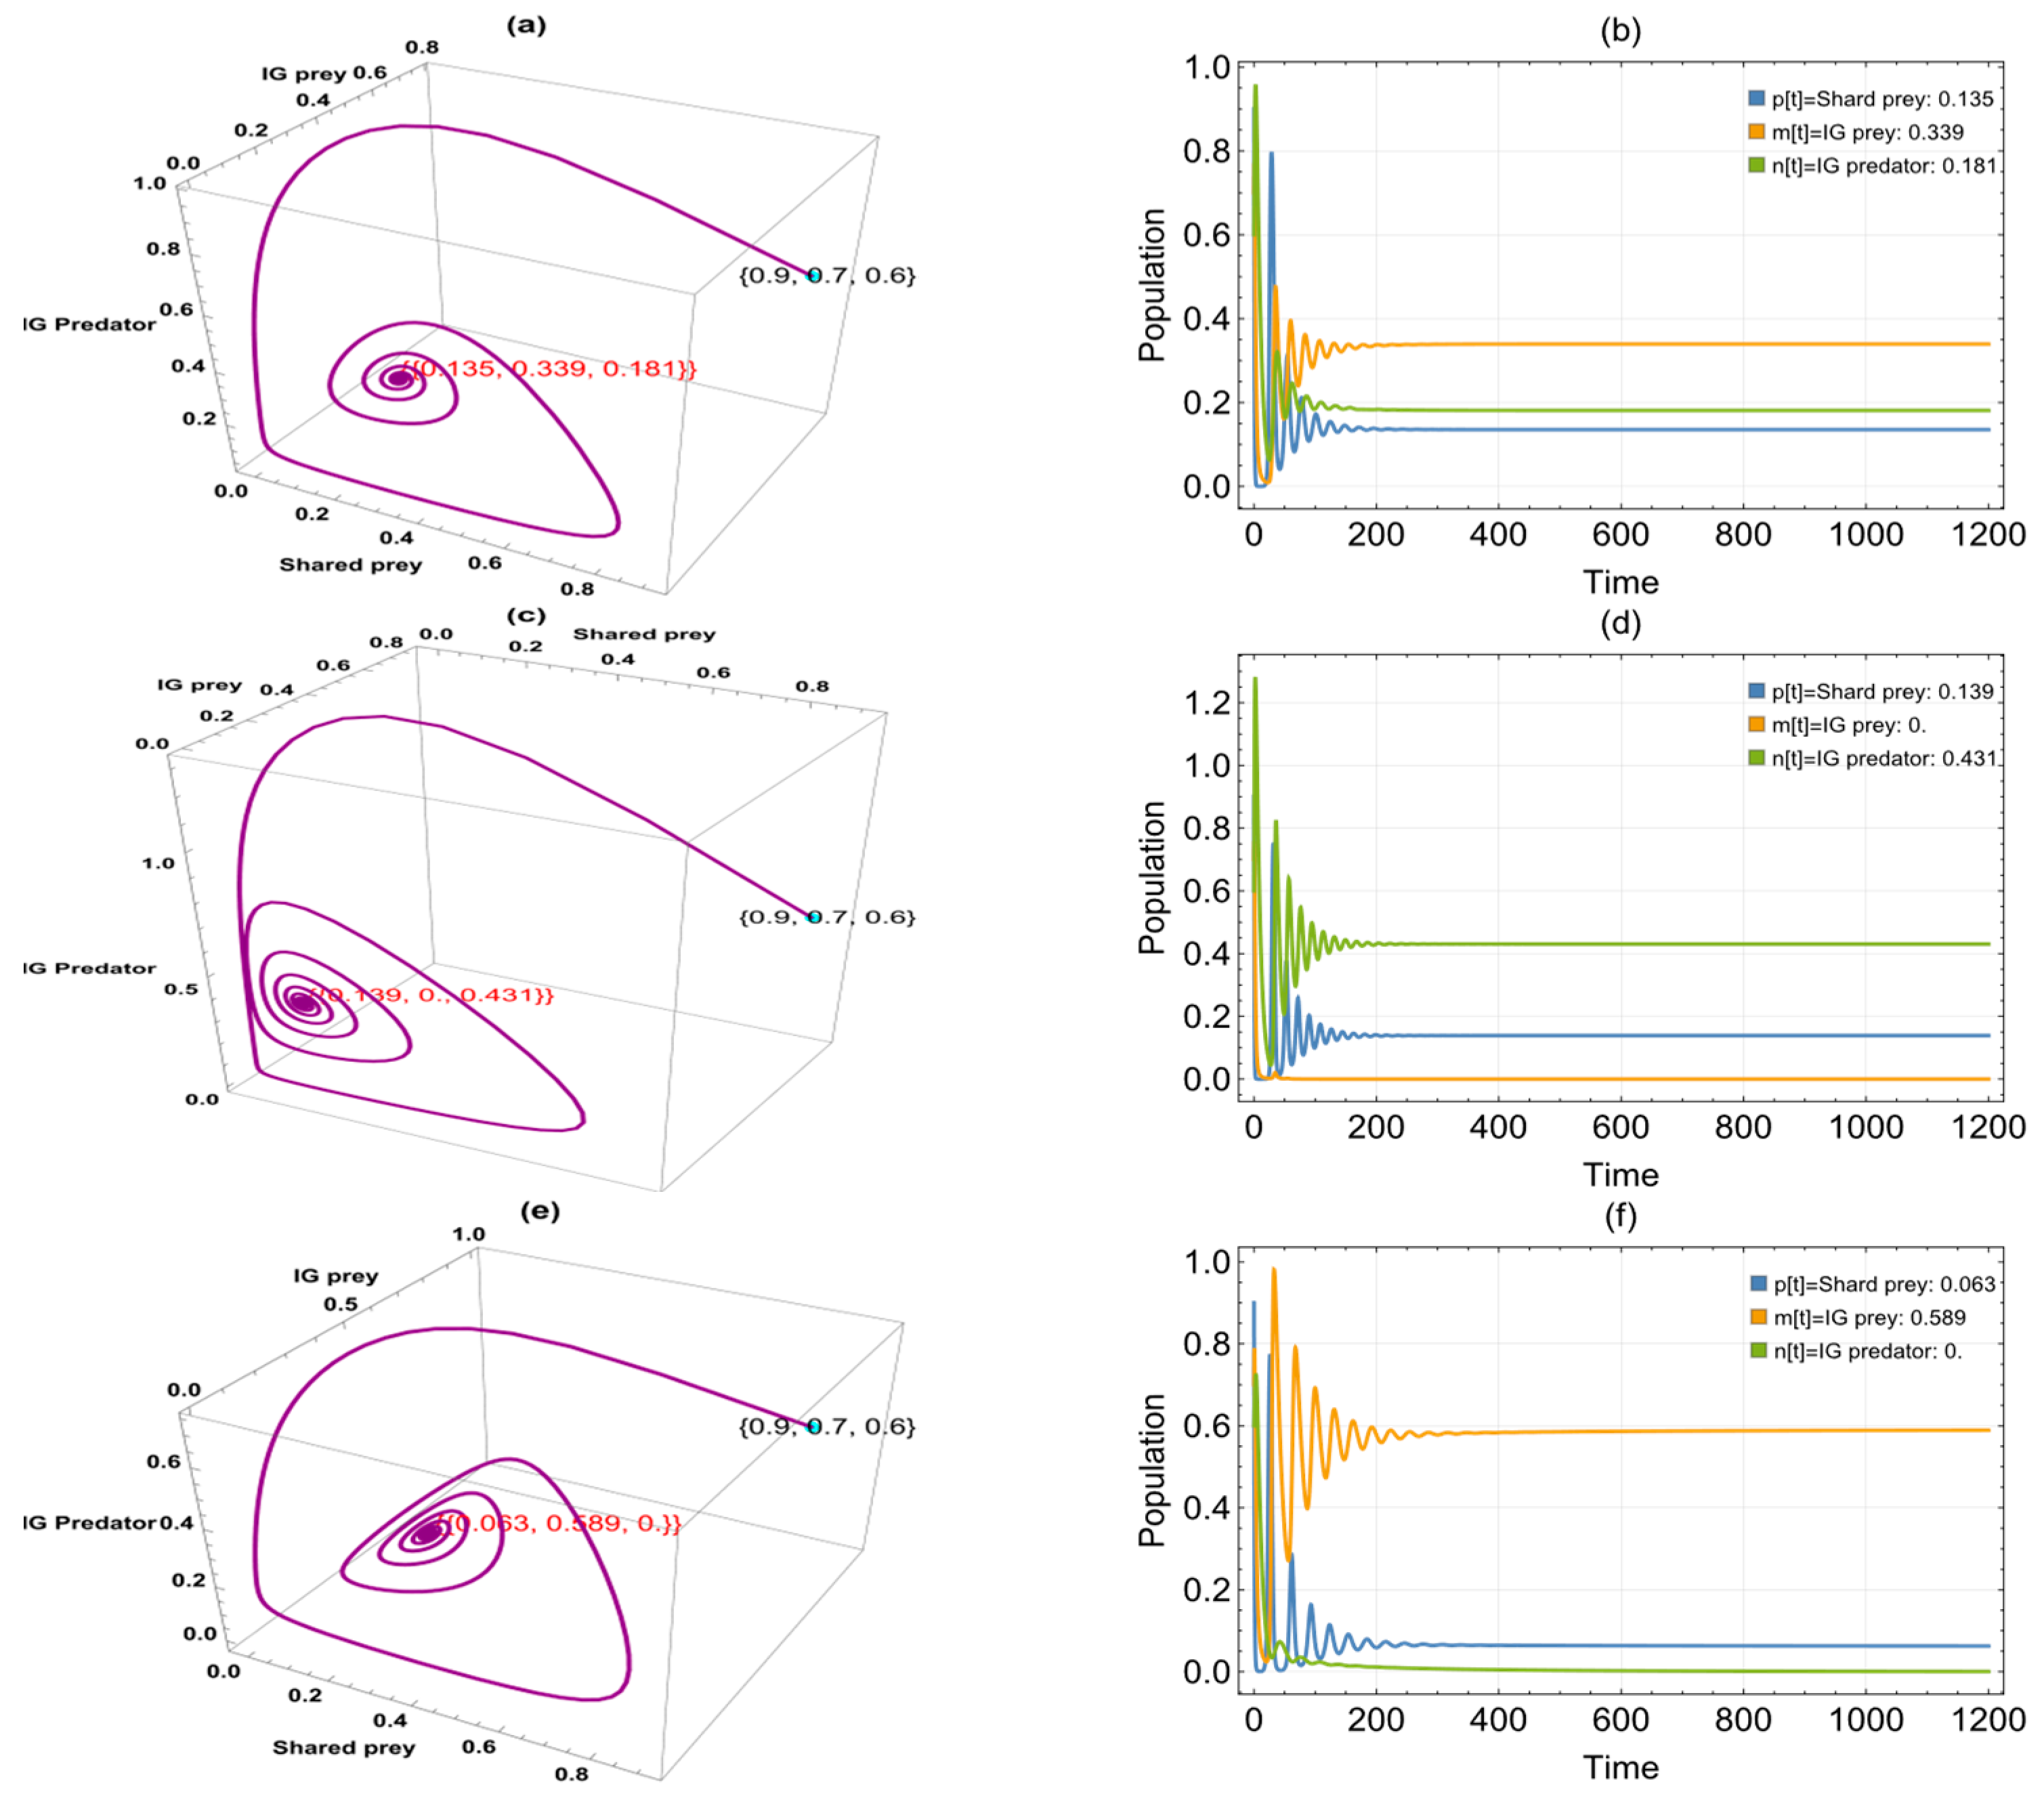
6. Numerical Simulation

Numerical graphing enables the presentation of model results, time phase spaces, trajectories, and susceptibility parameter examinations. Graphs can help to understand the dynamics of complex systems. Data and mathematical models provide important knowledge and understanding, and play an essential role in Mathematica graphing because they create the appropriate mathematical and analytical basis to generate accurate and attractive graphs, such as those for Equation (3). A carefully chosen set of data was obtained, and hypothetical values for all the parameters were considered as shown in Table 1.
As a result of substituting the data in Table 1 into Equation (3), asymptotically stable positive points Ѻ 4 were acquired. As shown in Figure 1, each case was drawn separately for the shared prey, for the intraguild prey, and for the intraguild predator. For each of the three species, we selected five initial points and noted that they all reached an approximate solution in a stable state of Ѻ 4 = 0.201 , 0.117 , 0.327 . For these three species combined, Figure 2 shows the positive point with one condition, along with the time series and phase portrait for Ѻ 4 .
Let us investigate every variable and its effects on the system. As a consequence of substituting for the parameter s 0 , the system has three cases: the first one approaches a globally asymptotically stable positive point, Ѻ 4 = 0.219 , 0.073 , 0.363 , in the interval 0.62 ,   2.63 ; the second approaches Ѻ 3 = 0.244 , 0 , 0.458 , in the interval 0 , 0.62 ; and the last one approaches Ѻ 2 = 0.063 , 0.403 , 0 , in the interval [2.63, 10). These cases are shown in Figure 3.
By substituting for parameter s 1 in the system, we obtained two approaches to globally asymptotically stable points: Ѻ 4 = 0.203 , 0.112 , 0.331 in the interval 1.02 , 1.9 and Ѻ 3 = 0.241 , 0 , 0.487 in the interval 0 , 1.02 . These cases are shown in Figure 4.
By substituting for parameter s 2 in the system, we obtained two approaches to globally asymptotically stable points in the system: Ѻ 4 = 0.193 , 0.158 , 0.31 in the interval 0 , 1.134 and Ѻ 3 = 0.191 , 0 , 0.431 in the interval 1.134 , 1.9 . These are shown in Figure 5.
Figure 6 shows the two approaches to globally asymptotically stable points obtained when substituting for parameter s 3 in the system: Ѻ 4 = 0.041 , 0.497 , 0.088 , in the interval 0.73 , 1.9 , and Ѻ 3 = 0.191 , 0 , 0.431 , in the interval 0 , 0.73 .
By substituting for parameter s 4 in the system, we obtained two approaches to globally asymptotically stable points, namely, Ѻ 4 = 0.231 , 0.045 , 0.368 in the interval [0.08, 0.34) and Ѻ 3 = 0.244 , 0 , 0.458 in the interval [ 0.34 , 1 ) . These are shown in Figure 7.
As a consequence of substituting for s 5 in the system, we obtained two approaches to globally asymptotically stable points: Ѻ 4 = 0.173 , 0.195 , 0.279 in the interval 0 , 0.766 and Ѻ 3 = 0.251 , 0 , 0.394 in the interval [0.766, 1). These are shown in Figure 8.
Through parameter substitution of s 7 in the system, as shown in Figure 9, we obtained three approaches to globally asymptotically stable points: Ѻ 4 = 0.135 , 0.339 , 0.181 , in the interval 0.0033 , 0.539 ; Ѻ 3 = 0.139 , 0 , 0.431 ,   in the interval [0.539, 1); and Ѻ 2 = 0.063 , 0.589 , 0 , in the interval (0, 0.0033].
As a result of substituting for parameter s 8 in the system, we obtained two approaches to globally asymptotically stable points: Ѻ 4 = 0.07 , 0.566 , 0.018 in the interval 0.191 , 0.742 and Ѻ 2 = 0.063 , 0.59 , 0 in the interval (0, 0.191]. These are shown in Figure 10.
By substituting for parameter s 9 in the system, we obtained three approaches to globally asymptotically stable points: Ѻ 4 = 0.144 , 0.311 , 0.2 , in the interval 0.141 , 0.18 ; Ѻ 3 = 0.165 , 0 , 0.422 , in the interval (0, 0.141]; and Ѻ 2 = 0.063 , 0.59 , 0 , in the interval [0.18, 1). These are shown in Figure 11.

7. Discussion

Predators in natural environments regularly show social actions and have adopted cooperative hunting methods over time. Although working together improves the possibility of catching prey, it also creates fear in the prey, eventually affecting their ability to reproduce. In this research, we studied the effects of fear and hunting in a predator–prey model that contained shared prey and two predators, one of them being an intraguild predator and the other being intraguild prey. The system was transformed into a dimensionless model to reduce the number of parameters and facilitate modular solutions without units. Solution points with proven existence and stability were also obtained. The system’s local and global stability were studied, along with the associated conditions. To conclude, combining fear and cooperative hunting interactions in an intraguild food web has spawned new theories that have yet to be tested, bridging mathematical biology and behavioral ecology. These findings could aid in predator-centric conservation and ecosystem management systems where perception-dominated prey systems are the focus. Bifurcation was used in this study to obtain theories that proved the stability of the system, as well as the effects of fear and hunting, thus fulfilling the study’s purpose. In particular, we applied an intraguild predation approach considering the effects of fear and cooperative hunting. For a qualitative study, we carried out a stability check using Lyapunov functions and bifurcation analysis to find the critical transition points in the governing system. Moreover, video tracking of the system depending on certain key parameters, such as fear and cooperation intensity, was performed computationally to demonstrate species survival or extinction prevalence. With these results, we hope to elucidate the influence of ecosystem biology on the structure of food webs and inform their appropriate management in the future. During our study, we noticed that the parameters s 0 and s 4 had an impact and turned points around. After that, we used the numerical methods available in Mathematica to discuss all the parameters and their effects on the system, where they are stable, and during which intervals the points turn into other points.

Author Contributions

Data curation, A.H.N.; Writing–original draft, A.H.N.; Supervision, D.K.B.; Writing—review & editing, D.K.B. All authors have read and agreed to the published version of the manuscript.

Funding

This research received no external funding.

Data Availability Statement

The research provided in the paper did not use any data.

Acknowledgments

The authors thank all the reviewers for their insightful comments, which tremendously improved the completeness and relevance of our work.

Conflicts of Interest

The authors confirm their independence and that no known conflicting financial interests or personal ties could have potentially influenced the findings given in this paper.

References

  1. Morin, P. Productivity, Intraguild predation, and population dynamics in experimental food webs. Ecology 1999, 80, 752–760. [Google Scholar] [CrossRef]
  2. Nakazawa, T.; Miki, T.; Namba, T. Influence of predator-specific defense adaptation on intraguild predation. Oikos 2010, 119, 418–427. [Google Scholar] [CrossRef]
  3. Sen, D.; Ghorai, S.; Banerjee, M. Complex dynamics of a three species prey-predator model with intraguild predation. Ecol. Complex. 2018, 34, 9–22. [Google Scholar] [CrossRef]
  4. Amarasekare, P. Spatial dynamics of communities with intraguild predation: The role of dispersal strategies. Am. Nat. 2007, 170, 819–831. [Google Scholar] [CrossRef] [PubMed]
  5. Sk, N.; Mondal, B.; Sarkar, A.; Santra, S.S.; Baleanu, D.; Altanji, M. Chaos emergence and dissipation in a three-species food web model with intraguild predation and cooperative hunting. AIMS Math. 2024, 9, 1023–1045. [Google Scholar] [CrossRef]
  6. Pal, S.; Pal, N.; Samanta, S.; Chattopadhyay, J. Effect of hunting cooperation and fear in a predator-prey model. Ecol. Complex. 2019, 39, 100770. [Google Scholar] [CrossRef]
  7. AL-Momen, S.; Naji, R.K. Effect of hunting cooperation and fear in a food chain model with intraspecific competition. Commun. Math. Biol. Neurosci. 2023, 2023, 119. [Google Scholar] [CrossRef]
  8. Meng, X.Y.; Feng, Y. Dynamical behaviour of an intraguild predator–prey model with prey refuge and hunting cooperation. J. Biol. Dyn. 2023, 17, 2222142. [Google Scholar] [CrossRef]
  9. Mendonça, J.P.; Gleria, I.; Lyra, M.L. Prey refuge and morphological defense mechanisms as nonlinear triggers in an intraguild predation food web. Commun. Nonlinear Sci. Numer. Simul. 2020, 90, 105373. [Google Scholar] [CrossRef]
  10. Hadi, Z.M.; Bahlool, D.K. The effect of alternative resource and refuge on the dynamical behavior of food chain model. Malays. J. Math. Sci. 2023, 17, 731–754. [Google Scholar] [CrossRef]
  11. Bahlool, D.K. The dynamics of a stage-structure prey-predator model with hunting cooperation and anti-predator behavior. Commun. Math. Biol. Neurosci. 2023, 2023, 59. [Google Scholar] [CrossRef]
  12. Xing, Z.; Cui, H.; Zhang, J. Dynamics of a stochastic intraguild predation model. Appl. Sci. 2016, 6, 118. [Google Scholar] [CrossRef]
  13. Liu, R.; Liu, G. Complex dynamics and optimal harvesting for a stochastic food-web model with intraguild predation and time delays. Int. J. Biomath. 2022, 15, 2250050. [Google Scholar] [CrossRef]
  14. Liu, R.; Liu, G. Analysis on stochastic food-web model with intraguild predation and mixed functional responses. Phys. A Stat. Mech. Its Appl. 2019, 531, 121782. [Google Scholar] [CrossRef]
  15. Qi, H.; Meng, X. Dynamics of a stochastic predator-prey model with fear effect and hunting cooperation. J. Appl. Math. Comput. 2022, 69, 2077–2103. [Google Scholar] [CrossRef]
  16. Ch-Chaoui, M.; Mokni, K. A multi-parameter bifurcation analysis of a prey–predator model incorporating the prey Allee effect and predator-induced fear. Nonlinear Dyn. 2025, 2023, 1–23. [Google Scholar] [CrossRef]
  17. Feng, Y.; Meng, X. Dynamic behaviors of a diffusion intraguild predation model with hunting cooperation. Adv. Appl. Math. 2022, 11, 4323–4334. [Google Scholar] [CrossRef]
  18. Ji, J.; Lin, G.; Wang, L.; Mai, A. Spatiotemporal dynamics induced by intraguild predator diffusion in an intraguild predation model. J. Math. Biol. 2022, 85, 1. [Google Scholar] [CrossRef] [PubMed]
  19. Friederike Prowe, A.E.; Su, B.; Nejstgaard, J.C.; Schartau, M. Food web structure and intraguild predation affect ecosystem functioning in an established plankton model. Limnol. Oceanogr. 2022, 67, 843–855. [Google Scholar] [CrossRef]
  20. Giricheva, E. Stability and bifurcation analysis of a tri-trophic food chain model with intraguild predation. Int. J. Biomath. 2022, 16, 2250073. [Google Scholar] [CrossRef]
  21. Karnatak, R.; Wollrab, S. Mixotrophy and intraguild predation—Dynamic consequences of shifts between food web motifs. Eur. Phys. J. Spec. Top. 2017, 226, 2135–2144. [Google Scholar] [CrossRef]
  22. Chen, M.; Zhang, J.; Ejegul, S. Dynamics of autotroph–mixotroph interactions with the intraguild predation structure. J. Biol. Dyn. 2022, 16, 186–206. [Google Scholar] [CrossRef]
  23. Woodward, G.; Hildrew, A.G. Body-size determinants of niche overlap and intraguild predation within a complex food web. J. Anim. Ecol. 2002, 71, 1063–1074. [Google Scholar] [CrossRef]
  24. Costa, M.I.d.S.; dos Anjos, L. Intraguild predation does not necessarily have negative effects on pest biological control: Insights from a multiple consumer-multiple resource food web population model. BioControl 2022, 67, 263–274. [Google Scholar] [CrossRef]
  25. Amiri-Jami, A. Effect of ant-attendance on the occurrence of intraguild predation. Food Webs 2022, 32, e00240. [Google Scholar] [CrossRef]
  26. Faria, L.D.B.; Costa, M.I.d.S.; Godoy, W.A.C. A model for intraguild predation dynamics between immature stages. Ecol. Model. 2011, 222, 3295–3299. [Google Scholar] [CrossRef]
  27. Meng, X.-Y.; Xiao, L. Hopf bifurcation and Turing instability of a delayed diffusive Zooplankton–Phytoplankton model with hunting cooperation. Int. J. Bifurc. Chaos 2024, 34, 2450090. [Google Scholar] [CrossRef]
  28. Li, Y.; Ding, M. Impact of hunting cooperation in predator and anti-predator behaviors in prey in a predator–prey model. Math. Methods Appl. Sci. 2024, 48, 237–252. [Google Scholar] [CrossRef]
  29. Tao, W.; Wang, Z.-A. Global well-posedness and Turing–Hopf bifurcation of prey-taxis systems with hunting cooperation. Eur. J. Appl. Math. 2025, 1–27. [Google Scholar] [CrossRef]
  30. Peng, M.; Lin, R.; Zhang, Z.; Huang, L. The dynamics of a delayed predator-prey model with square root functional response and stage structure. Electron. Res. Arch. 2024, 32, 3275–3298. [Google Scholar] [CrossRef]
Figure 1. Trajectories of Equation (3) originating from diverse beginning positions and employing the data from Table 1: (a) trajectories illustrating the movements of shared prey over time; (b) trajectories depicting the motions executed by intraguild prey over time; (c) trajectories depicting the moves executed by the predator over time; (d) time series for Ѻ4; (e) the phase portrait of Equation (3).
Computation 13 00128 g001
Figure 2. ( a ) The phase portrait of Equation (3); ( b ) time series exhibiting the trajectories of Equation (3), using the data from Table 1, converging towards Ѻ 4 = 0.201 , 0.117 , 0.327 .
Computation 13 00128 g002
Figure 3. The trajectories of Equation (3) using the data from Table 1 with differing values of s 0 : (a,b) the phase portrait and time series for the trajectories at s 0 = 0 .9; (c,d) the phase portrait and time series for the trajectories at s 0 = 0.5 ; (e,f) the phase portrait and time series for the trajectories at s 0 = 3.3 .
Computation 13 00128 g003
Figure 4. The trajectories of Equation (3) using the data from Table 1 with differing values of s 1 : ( a , b ) the phase portrait and time series for the trajectories at s 1 = 1.48 ; (c,d) the phase portrait and time series for the trajectories at s 1 = 0.52 .
Computation 13 00128 g004
Figure 5. The trajectories of Equation (3) using the data from Table 1 with differing values of s 2 : ( a , b ) the phase portrait and time series for the trajectories at s 2 = 0.3 ; (c,d) the phase portrait and time series for the trajectories at s 2 = 1.67 .
Computation 13 00128 g005
Figure 6. The trajectories of Equation (3) using the data from Table 1 with differing values of s 3 : (a,b) the phase portrait and time series for the trajectories at s 3 = 1.89 ; (c,d) the phase portrait and time series for the trajectories at s 3 = 0.438 .
Computation 13 00128 g006
Figure 7. The trajectories of Equation (3) using the data from Table 1 with differing values of s 4 : (a,b) the phase portrait and time series for the trajectories at s 4 = 0.32 ; (c,d) the phase portrait and time series for the trajectories at s 4 = 0.449 .
Computation 13 00128 g007
Figure 8. The trajectories of Equation (3) using the data from Table 1 with differing values of s 6 : (a,b) the phase portrait and time series for the trajectories at s 6 = 0.026 ; (c,d) the phase portrait and time series for the trajectories at s 6 = 0.8 .
Computation 13 00128 g008
Figure 9. The trajectories of Equation (3) using the data from Table 1 with differing values of s 7 : (a,b) the phase portrait and time series for the trajectories at s 7 = 0 .4; (c,d) the phase portrait and time series for the trajectories at s 7 = 0.89 ; (e,f) the 3 D phase portrait and time series for the trajectories at s 7 = 0.0033 .
Computation 13 00128 g009
Figure 10. The trajectories of Equation (3) using the data from Table 1 with differing values of s 8 : (a,b) the phase portrait and time series for the trajectories at s 8 = 0 .198; (c,d) the phase portrait and time series for the trajectories at s 8 = 0.179 .
Computation 13 00128 g010
Figure 11. The trajectories of Equation (3) using the data from Table 1 with differing values of s 9 : (a,b) the phase portrait and time series for the trajectories at s 9 = 0 .1634; (c,d) the phase portrait and time series for the trajectories at s 9 = 0.1 ;   (e,f) the 3D phase portrait and time series for the trajectories at s 9 = 0.7 .
Computation 13 00128 g011
Table 1. Valuation data for parameters.
s 0 s 1 s 2 s 3 s 4 s 5 s 6 s 7 s 8 s 9
1 1.5 0.5 0.8 0.3 0.4 0.05 0.5 0.25 0.15
Disclaimer/Publisher’s Note: The statements, opinions and data contained in all publications are solely those of the individual author(s) and contributor(s) and not of MDPI and/or the editor(s). MDPI and/or the editor(s) disclaim responsibility for any injury to people or property resulting from any ideas, methods, instructions or products referred to in the content.

