Abstract
Predicting corporate bankruptcy is a key task in financial risk management, and selecting a machine learning model with superior generalization performance is crucial for prediction accuracy. This study evaluates the effectiveness of k-fold cross-validation as a model selection strategy for random forest and XGBoost classifiers using a publicly available dataset of Taiwanese listed companies. We employ a nested cross-validation framework to assess the relationship between cross-validation (CV) and out-of-sample (OOS) performance on 40 different train/test data partitions. On average, we find k-fold cross-validation to be a valid selection technique when applied within a model class; however, k-fold cross-validation may fail for specific train/test splits. We find that 67% of model selection regret variability is explained by the particular train/test split, highlighting an irreducible uncertainty real world practitioners must contend with. Our study extensively explores hyperparameter tuning for both classifiers and highlights key insights. Additionally, we investigate practical implementation choices in k-fold cross-validation—such as the value of k or prediction strategies. We conclude that k-fold cross-validation is effective for model selection within a model class and on average, but it can be unreliable in specific cases or when comparing models from different classes—this latter issue warranting further investigation.
1. Introduction
Estimating the probability of bankruptcy is a critical component of financial risk assessment, providing valuable insights for different stakeholders, mostly for creditors and investors. Predicting the likelihood of business failure enables creditors to minimize potential financial losses and to establish risk-adjusted credit terms.
Various quantitative models, such as Altman’s Z-score [1], logistic regression [2], and, more recently, machine learning (ML) and deep learning techniques have been developed for predicting the probability of default or firm failure, using financial ratios, but also industry and macroeconomic indicators.
Machine learning models have been extensively compared with more traditional approaches and found to outperform them in bankruptcy prediction [3]. Random forests [4] and gradient boosting methods, such as XGBoost [5], have been shown to perform well in bankruptcy prediction [3,6]. Indeed, Alanis et al. find that XGBoost outperforms other ML methods [6].
Deep learning methods have also been studied in bankruptcy prediction. For example, Mai et al. [7] show that when incorporating textual data from financial reports alongside financial ratios and market data, deep learning methods “can further improve the prediction accuracy”. However, Grinsztajn et al. [8] compare deep learning models with XGBoost and random forest and conclude that “tree-based models remain state-of-the-art on medium-sized data (~10K samples) even without accounting for their superior speed”. These findings suggest that while deep learning may offer certain benefits when large amounts of data or unstructured data are available, their applicability in practical bankruptcy prediction problems is limited by data availability, which is usually structured, tabular, and of medium size.
With such a diverse array of options, model selection becomes crucial. Besides choosing between model classes, the practitioner must also optimize a model’s hyperparameters to achieve the best possible performance when used with new, unseen data. While all models are susceptible to overfitting the training set, ML models—being both more powerful and more complex—are particularly prone to this risk.
Overfitting the training sample leads to poor generalization performance and also model instability.
To address this problem and improve generalization performance, practitioners often employ k-fold cross-validation for model selection. The available dataset is split into k disjoint sets (folds). Models are iteratively trained on k-1 folds and tested on the remaining fold. This allows for out-of-fold predictions and performance metrics to be calculated for the entire dataset. The model’s performance calculated using this approach is referred to as cross-validation (CV) performance.
Cawley and Talbot [9] demonstrate that, on a finite sample of data, it is possible to overfit any model selection criteria. Specifically, they show that tuning hyperparameters and choosing the model with the best CV performance improves out-of-sample (OOS) performance—defined as the performance on an unseen test set—only up to a point. Beyond that, OOS performance starts to deteriorate—continued tuning may even degrade generalization. This effect is primarily the result of variance in the CV performance metric, rather than its bias [9]. As a result, Cawley and Talbot [9] suggest using a nested cross-validation approach for model selection.
However, Wainer and Cawley [10] later argue that, in practical applications, k-fold cross-validation is sufficiently accurate and that nested cross-validation benefits do not justify the significantly increased computational effort.
In this research, we use a publicly available database of Taiwanese listed companies [11] and try to identify the model with the best generalization performance for bankruptcy prediction. We follow Teodorescu and Toader [12], who use the same database and investigate logistic regression with regularization, random forests, and XGBoost. They tune hyperparameters and use k-fold cross-validation for model selection. In the present paper, we extend their analysis by employing a nested cross-validation approach.
Our main goal is to evaluate whether k-fold cross-validation is a valid methodology for selecting the best performing model for generalization with new, unseen data. To simulate real-world deployment scenarios, we evaluate model selection reliability across 40 different random train/test splits, derived using a nested cross-validation approach.
Our main finding is that k-fold cross-validation is a valid technique on average for selecting the best-performing model on new data. However, on specific train/test tuples, the method may fail to produce the best results, selecting models with poor OOS performance. We define regret as the loss in OOS performance from selecting the model with the best CV performance relative to the one with the best OOS performance. Using variance decomposition, we show that 67% of the variability in the model selection outcome (regret) is due to statistical differences between the training and test datasets.
Furthermore, we observe that both regret and the correlation between CV and OOS performance are stable for multiple runs using the same type of model (XGBoost) and the same train/test split. This stability reinforces our key finding that the success of model selection depends mostly on the relationship between training and test data, rather than the selection procedure itself. Further support for our conclusion comes from the observation that the correlation of OOS performance on different test sets is, on average, positive, but, in structure, it can be negative.
A puzzling finding, which requires further investigation, is that correlations between CV and OOS performance for random forest models are different than those for XGBoost for the same train/test splits. As a result, it seems that the CV performance’s predictive power is mitigated by both differences in data samples and by different model types.
We investigate random forest and XGBoost models and use grid search to tune hyperparameters and to study the relationship between CV and OOS performance. We present some key insights regarding important hyperparameters, such as eta for XGBoost and splitrule for random forest.
We also investigate and present some important findings regarding the practical implementation of k-fold cross-validation, such as setting the value of k or the way predictions could be calculated for new data (as the average of all k models’ predictions or as predictions of a single model, retrained on the full dataset). Our results indicate that large values of k may overfit the test fold for XGBoost models, leading to improvements in CV performance with no corresponding gains in OOS performance.
2. Materials and Methods
2.1. Dataset
Our database consists of a publicly available dataset, compiled by Liang, Lu, Tsai, and Shih [11]. This database contains financial data covering the period 1999–2009, for Taiwanese nonfinancial listed companies that had at least three years of available data—spanning both firms that experienced bankruptcy or financial distress and those that remained healthy. It includes 6819 firm-year observations, with 220 bankruptcies (for an aggregate bankruptcy rate of 3.23%). It provides 95 independent variables representing financial ratios from 7 categories: solvency, capital structure, profitability, turnover, cash flow, growth, and other.
We selected this dataset for several reasons. First, it contains a large number of predictors, with some correlated, making it particularly suitable for investigating the behavior of various machine learning algorithms.
Second, the dataset has a relatively modest size for machine learning models, allowing for extensive investigation of alternative methodologies.
Third, it is a high-quality database, having little noise and no missing data.
Our choice for this database was motivated by its public availability, its quality, and its manageable size, which made it appropriate for experiments requiring repeated resampling and careful model tuning.
The data were made available at https://doi.org/10.24432/C5004D (last accessed: 30 March 2025).
2.2. Performance Metric
Various performance metrics can be used to evaluate bankruptcy prediction models [13]: sensitivity, specificity, Type I and Type II errors, AUROC, and F1 score. We chose AUROC for three reasons: (1) it is a widely used metric [13], (2) it is directly implemented by XGBoost as a performance measure to be optimized, and (3) it does not require the setting of an extra hyperparameter, the threshold.
2.3. k-Fold Cross-Validation
The k-fold cross-validation technique is implemented by randomly splitting the available data into k-folds. Models are trained on k-1 folds and tested on the remaining kth fold. By iterating over all k-folds, the practitioner can obtain out-of-fold predictions and performance for the entire dataset. This is referred to as cross-validation (CV) performance. k-fold cross-validation is widely used by practitioners for model selection—choosing both between model classes and tuning hyperparameters [13].
2.4. Machine Learning Models
We evaluate two ML ensemble tree-based classifiers: random forests [4] and XGBoost [5]. Both models have been shown to perform well in bankruptcy prediction [3,6].
To implement random forest, we use the ranger library in R [14].
In random forest, trees grow independently of each other. In contrast, XGBoost is an iterative model—successive trees are added to the existing forest in such a way as to improve its past performance. As a result, XGBoost can improve its performance on the training data ad infinitum. However, such an improvement will result in out-of-sample performance improvement only up to point. Hence, the algorithm needs to be stopped at some point. One way of deciding the best iteration to stop the algorithm is to use a separate test set: the algorithm will stop when performance on the test set will not improve for a specified number of iterations. In the context of k-fold cross-validation, the kth fold can also be used for stopping the algorithm. This implies that CV performance is no longer completely out-of-sample, since the test fold is used during training, albeit just for stopping the algorithm—potentially leading to an optimistic bias. This optimistic bias would pose a problem when comparing models from different classes (such as comparing XGBoost with random forest—since the latter do not use the kth fold at all during training) and when the magnitude of the optimistic bias in the CV performance might be dependent on hyperparameter values. As a result, it is worth investigating in detail the potential overfitting of the CV performance metric in the case of XGBoost and its behavior.
2.5. Experimental Design
To assess the validity of the k-fold cross-validation technique for selecting the best performing model on new data, we employ a nested cross-validation technique.
We first divide the data into four equal outer folds. We use three of these folds for training and model selection based on CV performance, while the fourth is used to compute out-of-sample (OOS) performance. We repeat the process iteratively using all four outer folds as test folds, while the remaining three serve as training folds. Our objective is to analyze the relationship between CV performance (computed within the three training outer folds) and OOS performance (computed on the fourth outer fold). A diagram and pseudocode for the nested cross-validation technique is presented in Appendix B.
Our experimental design simulates the real-world use case where a practitioner uses k-fold cross-validation to train and select a model (on three outer folds) and then uses it with new data (the fourth outer fold).
To thoroughly study the relationship between cross-validation performance and out-of-sample performance, we repeat this process on 10 different data splits, each comprising of 4 outer folds. As a result, for each type of model tested and for each hyperparameter set, we have a total of 10 runs × 4 outer folds = 40 pairs of train/test data splits, corresponding to 40 pairs of cross-validation and out-of-sample performance measures (each computed using the k models required by the k-fold cross-validation technique).
We perform both the outer split and the inner split using a stratified sampling approach over the target value Y. As such, the class balance is maintained in all outer and inner folds.
Our dataset has an imbalance ratio of 30:1. López et al. [15] and Moreno-Torres et al. [16] show that, when the dataset is imbalanced, k-fold cross-validation may lead to folds with different data distributions. Even if stratified sampling is performed, thus resulting in folds with the same class balance, various clusters in terms of explanatory variables may not be equally and uniformly represented in the resulting folds. On the other hand, Rodriguez et al. [17] show that k-fold cross-validation error variance is mainly attributable to the training set variability rather than changes in the folds, a result consistent with ours. Our choice of plain stratified cross-validation (SCV) is further supported by Fontanari et al.’s [18] findings that, for imbalanced datasets, “SCV remained the most frequent winner” for performance estimation when compared to more elaborate CV strategies.
When applying k-fold cross-validation, as Forman and Scholz [19] point out, there are two options for calculating CV performance: as an average of the k performance measures calculated for each of the k-folds (CVavg) or as a single measure, calculated across all k-folds and using aggregate predictions (CVagg). Forman and Scholz [19] show that, although the latter option is less common in practice, it is a valid approach when stratified sampling is used. We also employ this approach, motivated by a number of factors: in many machine learning pipelines, there are multiple layers, and at each layer, predictions from previous layers are used as inputs. As such, well-calibrated predictions across folds are needed. Moreover, random forests and XGBoost models produce well-calibrated results. Indeed, our results show little difference between CVavg and CVagg in our case.
2.6. Oversampling
An important aspect when modelling imbalanced datasets is investigating whether oversampling techniques may lead to an improvement in performance. Santos et al. [20] investigate a number of oversampling approaches and conclude that oversampling should be applied after the data are split into train, test, and validation sets and only on the training set. Applying oversampling on the whole dataset will lead to label leakage and overoptimism in the performance metric. The same result is noted by Neunhoeffer and Sternberg [21], who show that incorrectly applying oversampling to the whole dataset before partitioning it may overestimate the CV performance measure to the point of completely invalidating an article’s results.
Santos et al. [20] also conclude that a number of techniques may lead to overfitting, especially random oversampling (ROS). They note that oversampling may have opposite effects: on the one hand, it may exacerbate the effect of noise, but, on the other hand, may also increase the importance of rare cases. One of Santos et al.’s [20] findings is that some oversampling techniques that rely on generating new, synthetic observation of the minority class(such as SMOTE—synthetic minority oversampling technique), may, when combined with cleaning procedures, such as Tomek links (TL) or edited nearest neighbor (ENN), offer superior performance.
Indeed, Gnip et al. [22] use 15 publicly available databases for bankruptcy prediction (including the Taiwanese database used here) to assess the performance of various oversampling approaches. They find that SMOTE+ENN outperforms other techniques on the Taiwan bankruptcy prediction database when using XGBoost models. However, they do not benchmark their results on the datasets without oversampling.
We briefly investigate the performance of ROS, SMTE, SMOTE + TL, and SMOTE + ENN in 8 of the 40 train/test splits. We perform the oversampling technique on the training set only (at each iteration, the k-1 folds used for training). Since we use AUC as a performance metric, we do not need to recalibrate the predictions on the test sets.
2.7. Hyperparameter Tuning
For both random forest and XGBoost models, the grid search was performed manually based on a predefined list of values for each hyperparameter. We selected values covering the whole range of values considered appropriate for each hyperparameter. No special software or library was used.
2.7.1. Random Forest
We used the ranger [14] library in R and we tuned the following hyperparameters: ntree, mtry, min.node.size, sample.fraction, and splitrule (with value “gini” and “hellinger”). We used a complete grid search approach for these hyperparameters.
2.7.2. XGBoost
We used the xgboost library in R and tuned the following hyperparameters: eta, min.child.weight, max_depth, subsample, colsample_bytree, gamma, scale_pos_weight, and max_delta_step. Due to the higher number of hyperparameters considered and also due to the higher computational effort required to train a single model, we used a guided grid search approach—we first tried a couple of well-established values for each hyperparameter and then refined our search around those with the best CV performance.
2.8. Stability and Correlation Metrics
To investigate the k-fold cross-validation technique’s validity for model selection, we calculated the Spearman correlation coefficient ρ between CV performance and OOS performance for each of the 40 train/test pairs that we investigated.
In the same context of model selection, we defined the model selection regret δ. Let {M1, M2, …, Mn} be a set of alternative models trained on a training dataset Dtraining and to be evaluated on a test dataset Dtest. Furthermore, let CV(M) be the CV performance on model M on Dtraining and OOS(M) the out-of-sample performance of model M on dataset Dtest. We were ultimately interested in maximizing OOS(M) over M in {M1, M2, …, Mn}. Let MCV be the model with the highest CV performance and MOOS the model with the highest OOS performance. We define regret as follows:
δ = OOS(MOOS) − OOS(MCV)
To understand the sources of model selection regret variability, we performed a variance decomposition, attributing it to train/test splits, inner CV fold assignments, and model training stochasticity.
3. Results
3.1. k-Fold Cross-Validation Reliability for Model Selection
As noted above in Section 2.5, we employed a nested cross-validation approach to investigate the relationship between CV and OOS performance.
We began by training multiple random forest and XGBoost models to tune their hyperparameters. We trained 58 XGBoost models on each of the 40 train/test splits and 288 random forest models on the same 40 train/test splits. Half of the random forest models had significantly lower performance due to one hyperparameter (splitrule = “gini”), resulting in high correlations between CV and OOS performance. However, in model selection, we needed a procedure that was sensitive enough to discriminate between the best models. Including poor-performing models (on both CV and OOS) will lead to a misleadingly high correlation coefficient, hiding the method’s behavior on models with superior performance. As a result, we eliminated all models with splitrule = “gini” from our further analysis in Section 3.1.
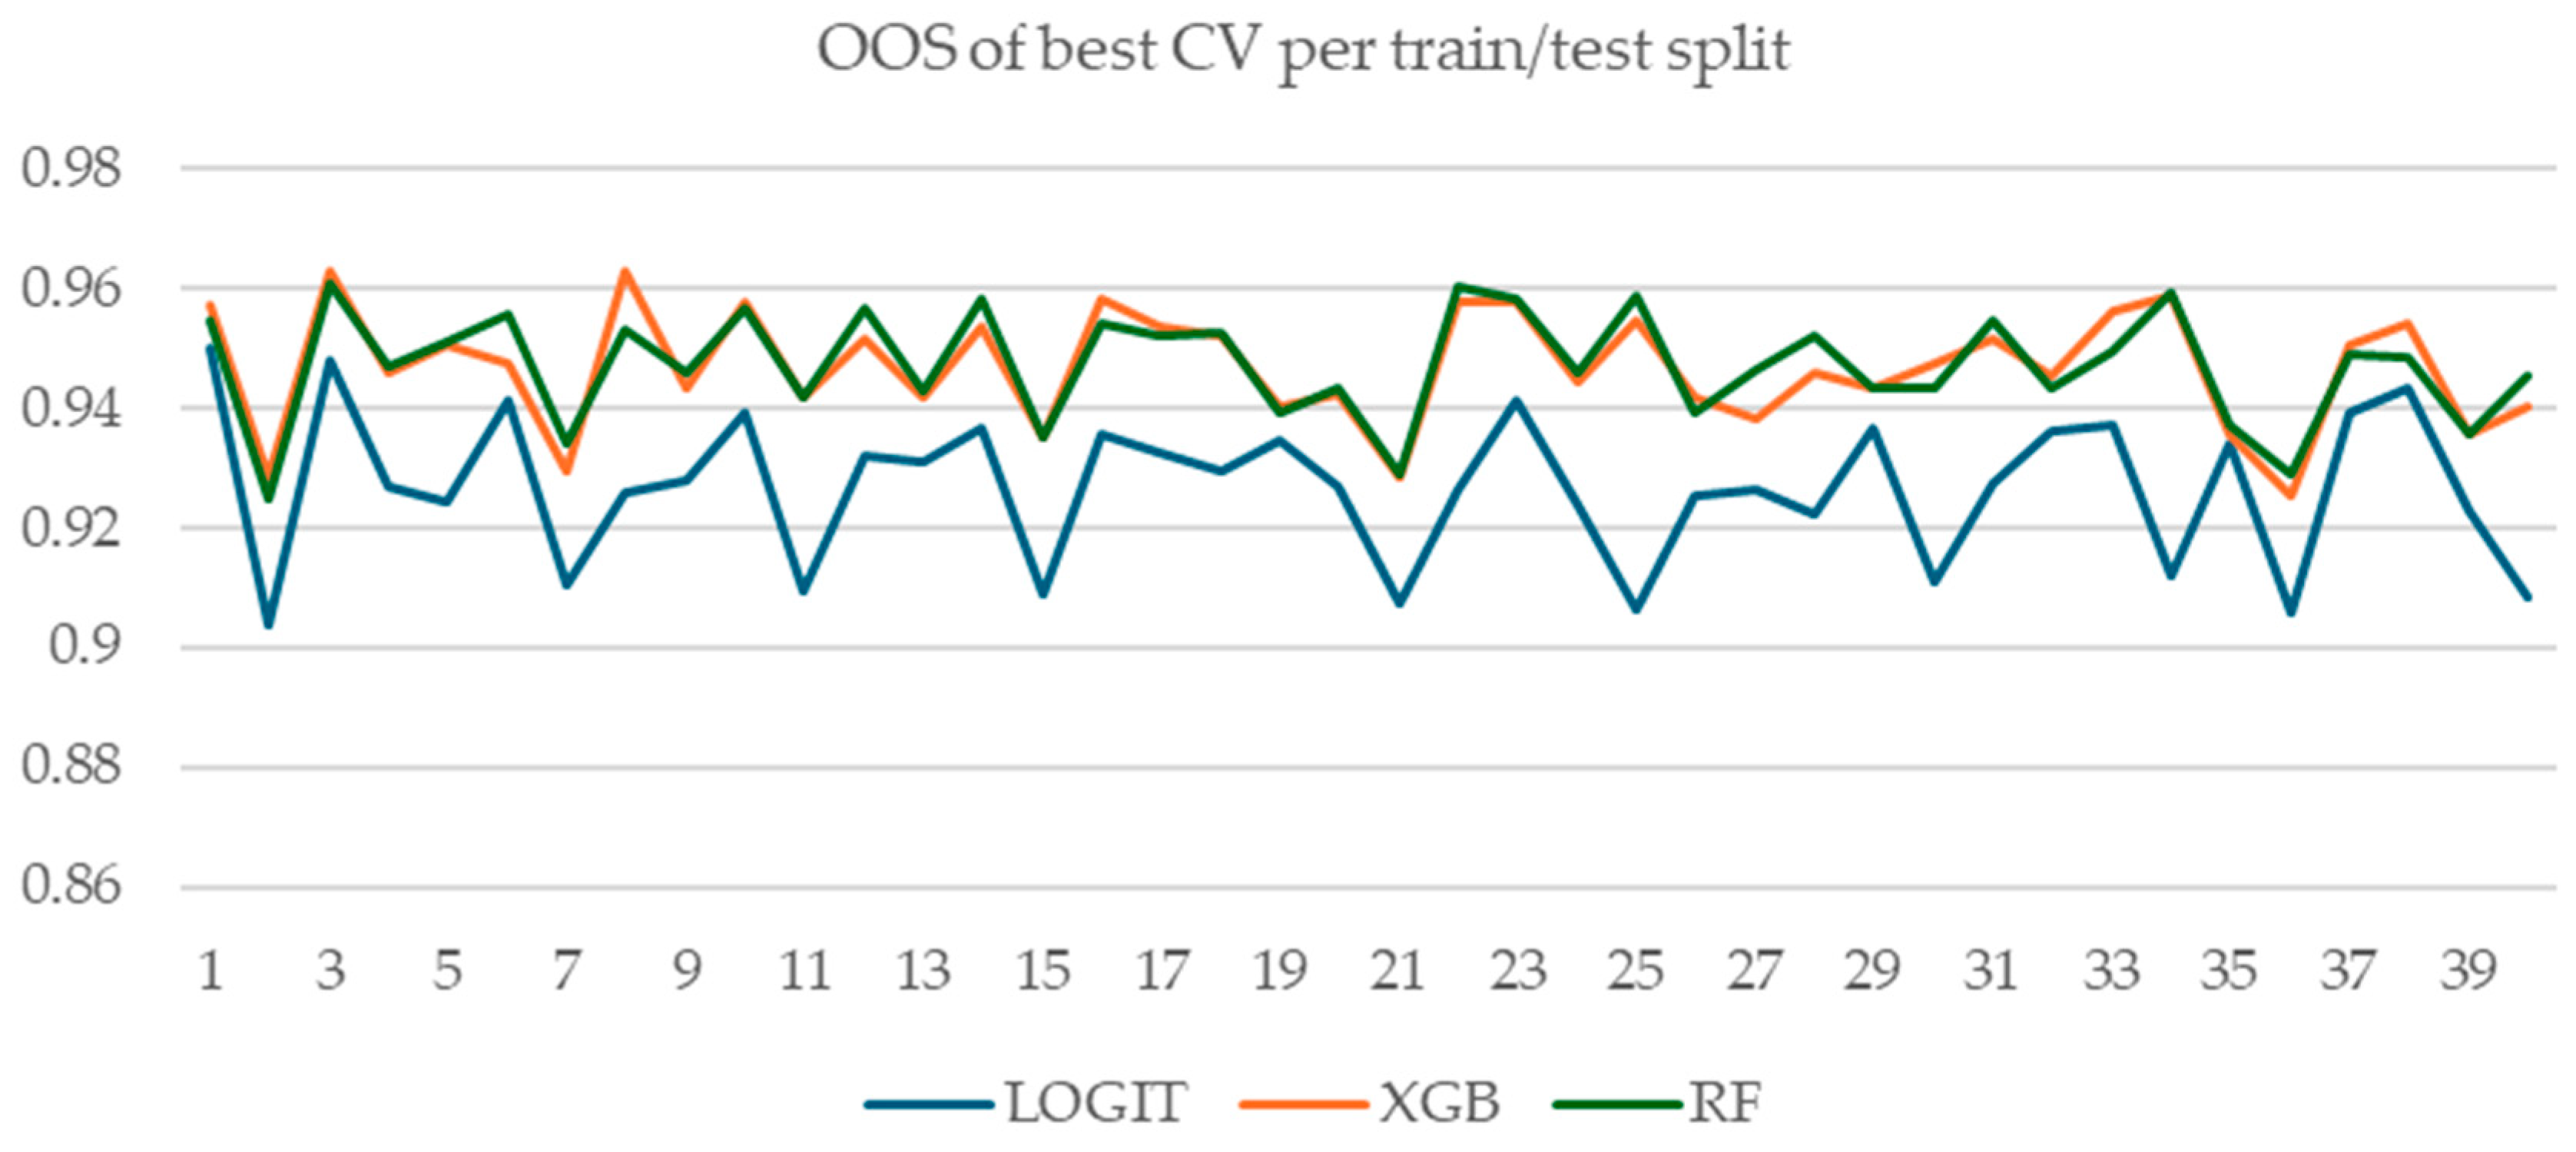
Appendix C presents the OOS performance of the model with the best CV performance for XGBoost, random forest, and logistic regression with regularization, across each of the 40 train/test splits. It is noteworthy that random forests and XGBoost models had similar performances, while the logistic regression models, used here as a benchmark, significantly underperformed both.
We briefly investigated the use of oversampling, testing ROS (with a target ratio of 1:1) SMOTE, SMOTE + TL, and SMOTE + ENN on 8 of the 40 train/test splits. Our results show inferior performance, both in CV and OOS. We conclude that k-fold cross-validation is efficient in selecting between oversampling vs. no oversampling conditions, as both CV and OOS performance measures indicate the superiority of the no oversampling condition. As a result, we decided to continue our experiments without oversampling.
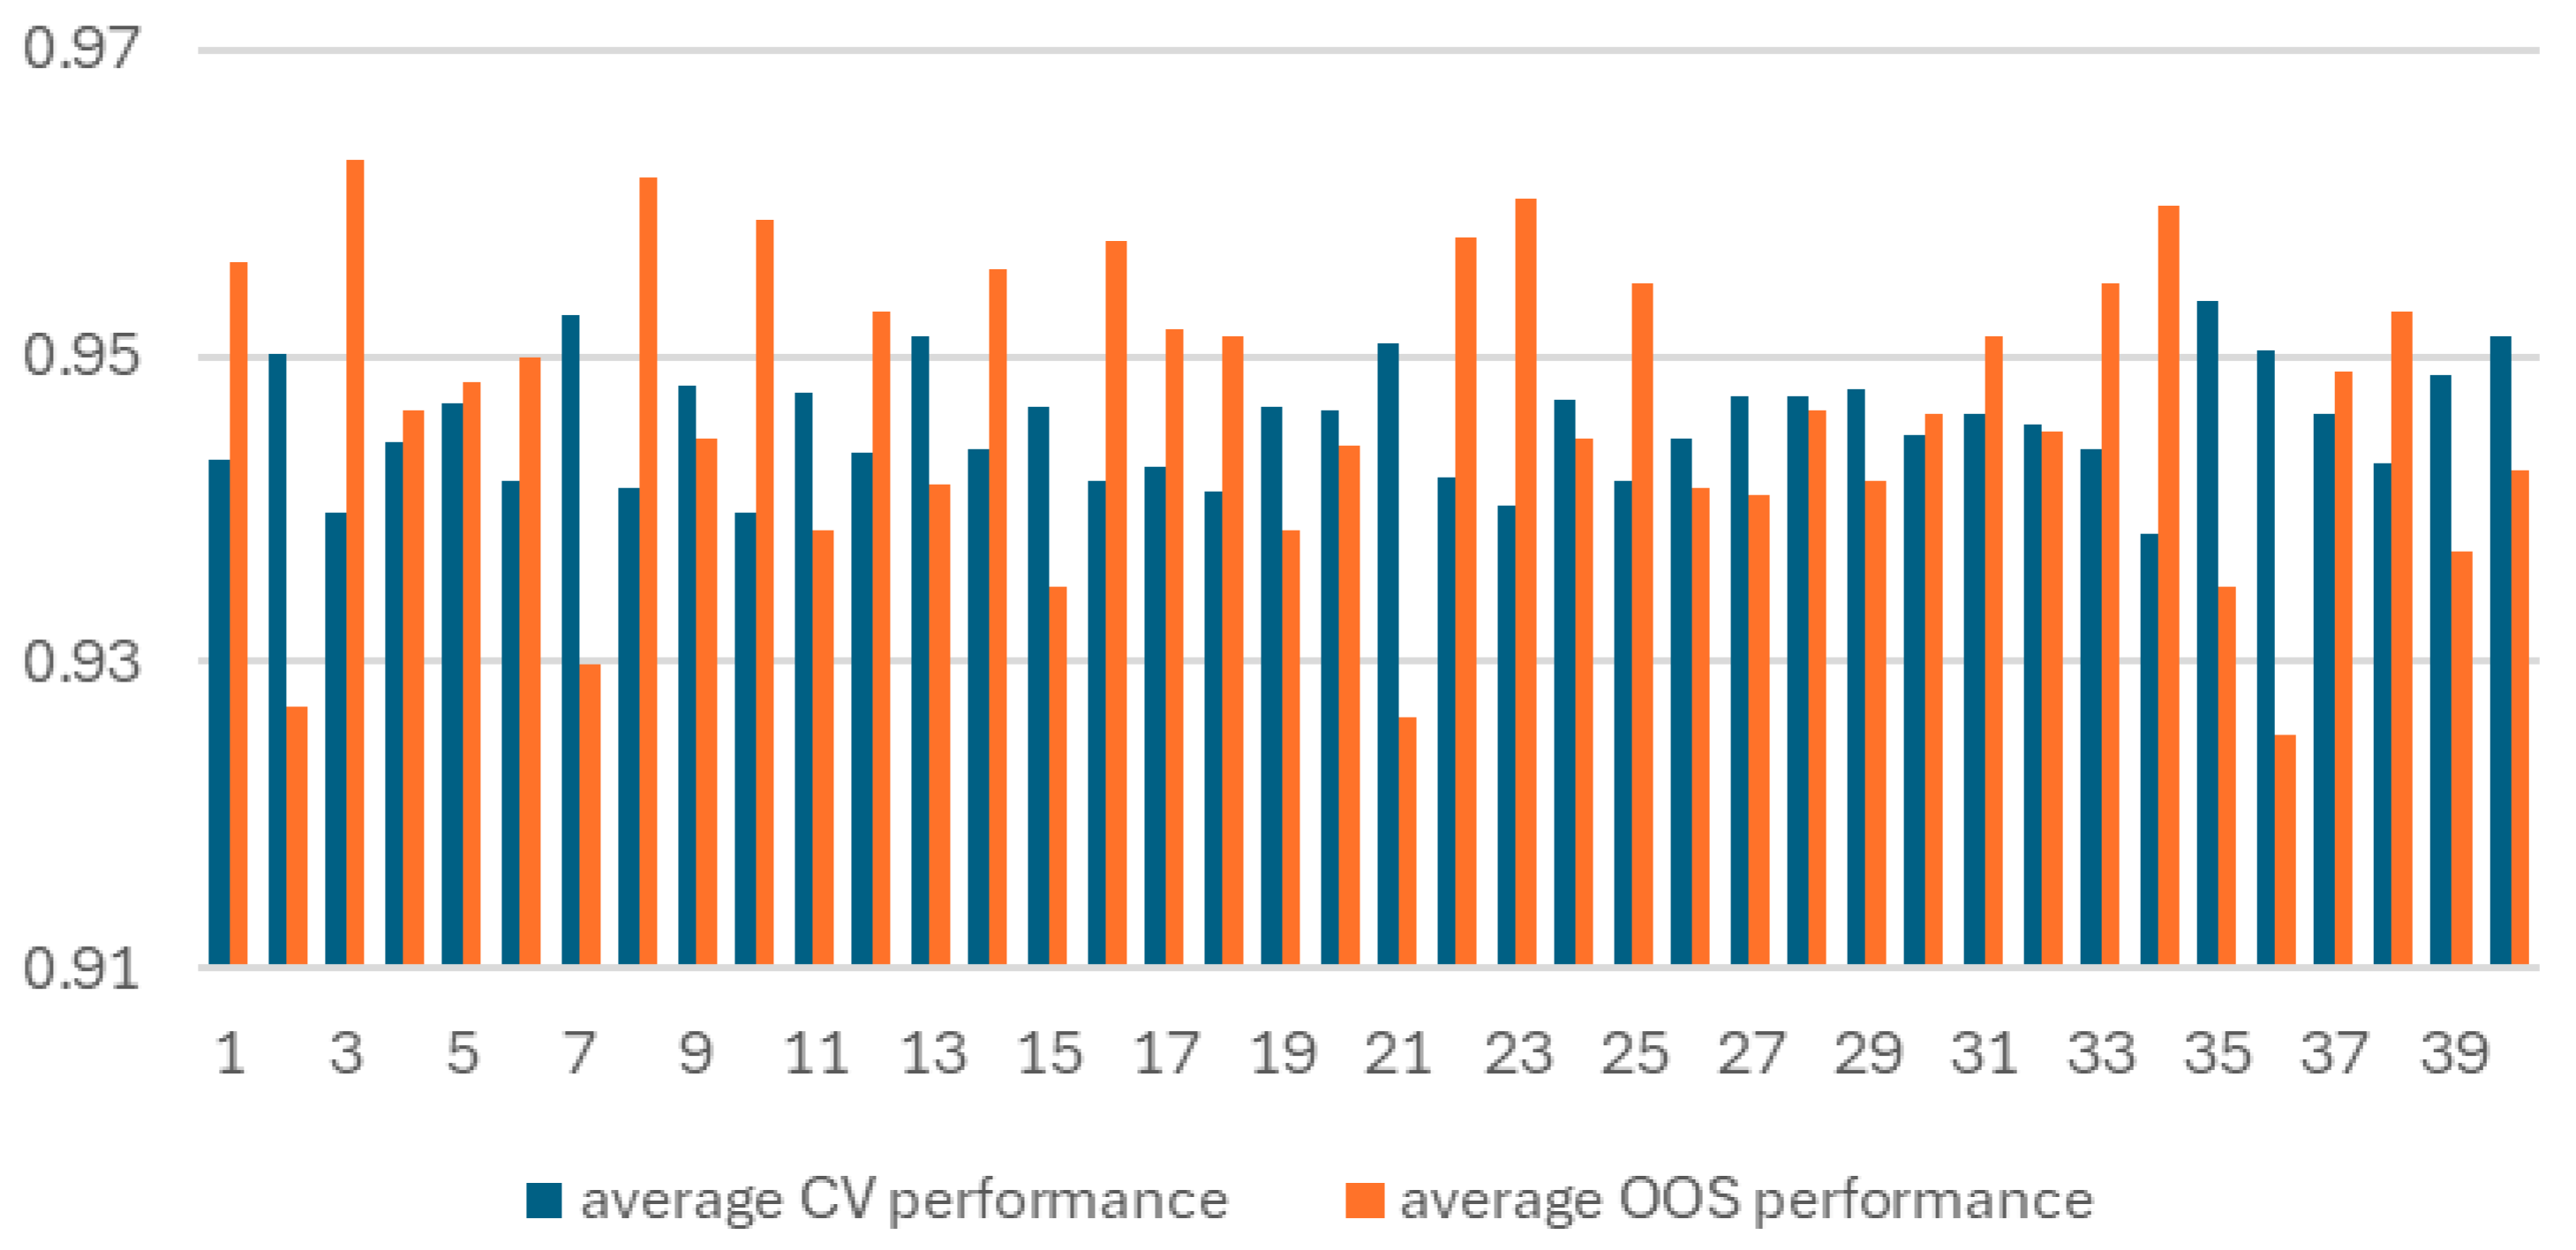
The first result that stands out is the large variability in the level of CV and OOS performance across all 40 train/test splits (Figure 1). This between train/test split variability is significantly larger than the within split variability between individual model performances.
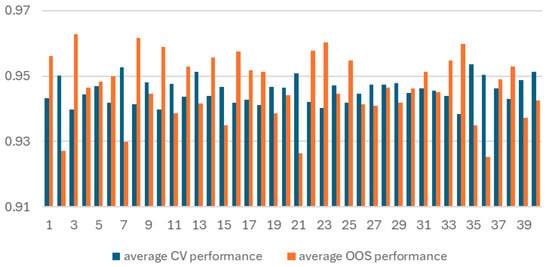
Figure 1.
Average CV and OOS performance for 58 XGBoost models trained on each of the 40 train/test splits.
3.1.1. Initial Validation of k-Fold Cross-Validation as a Model Selection Technique
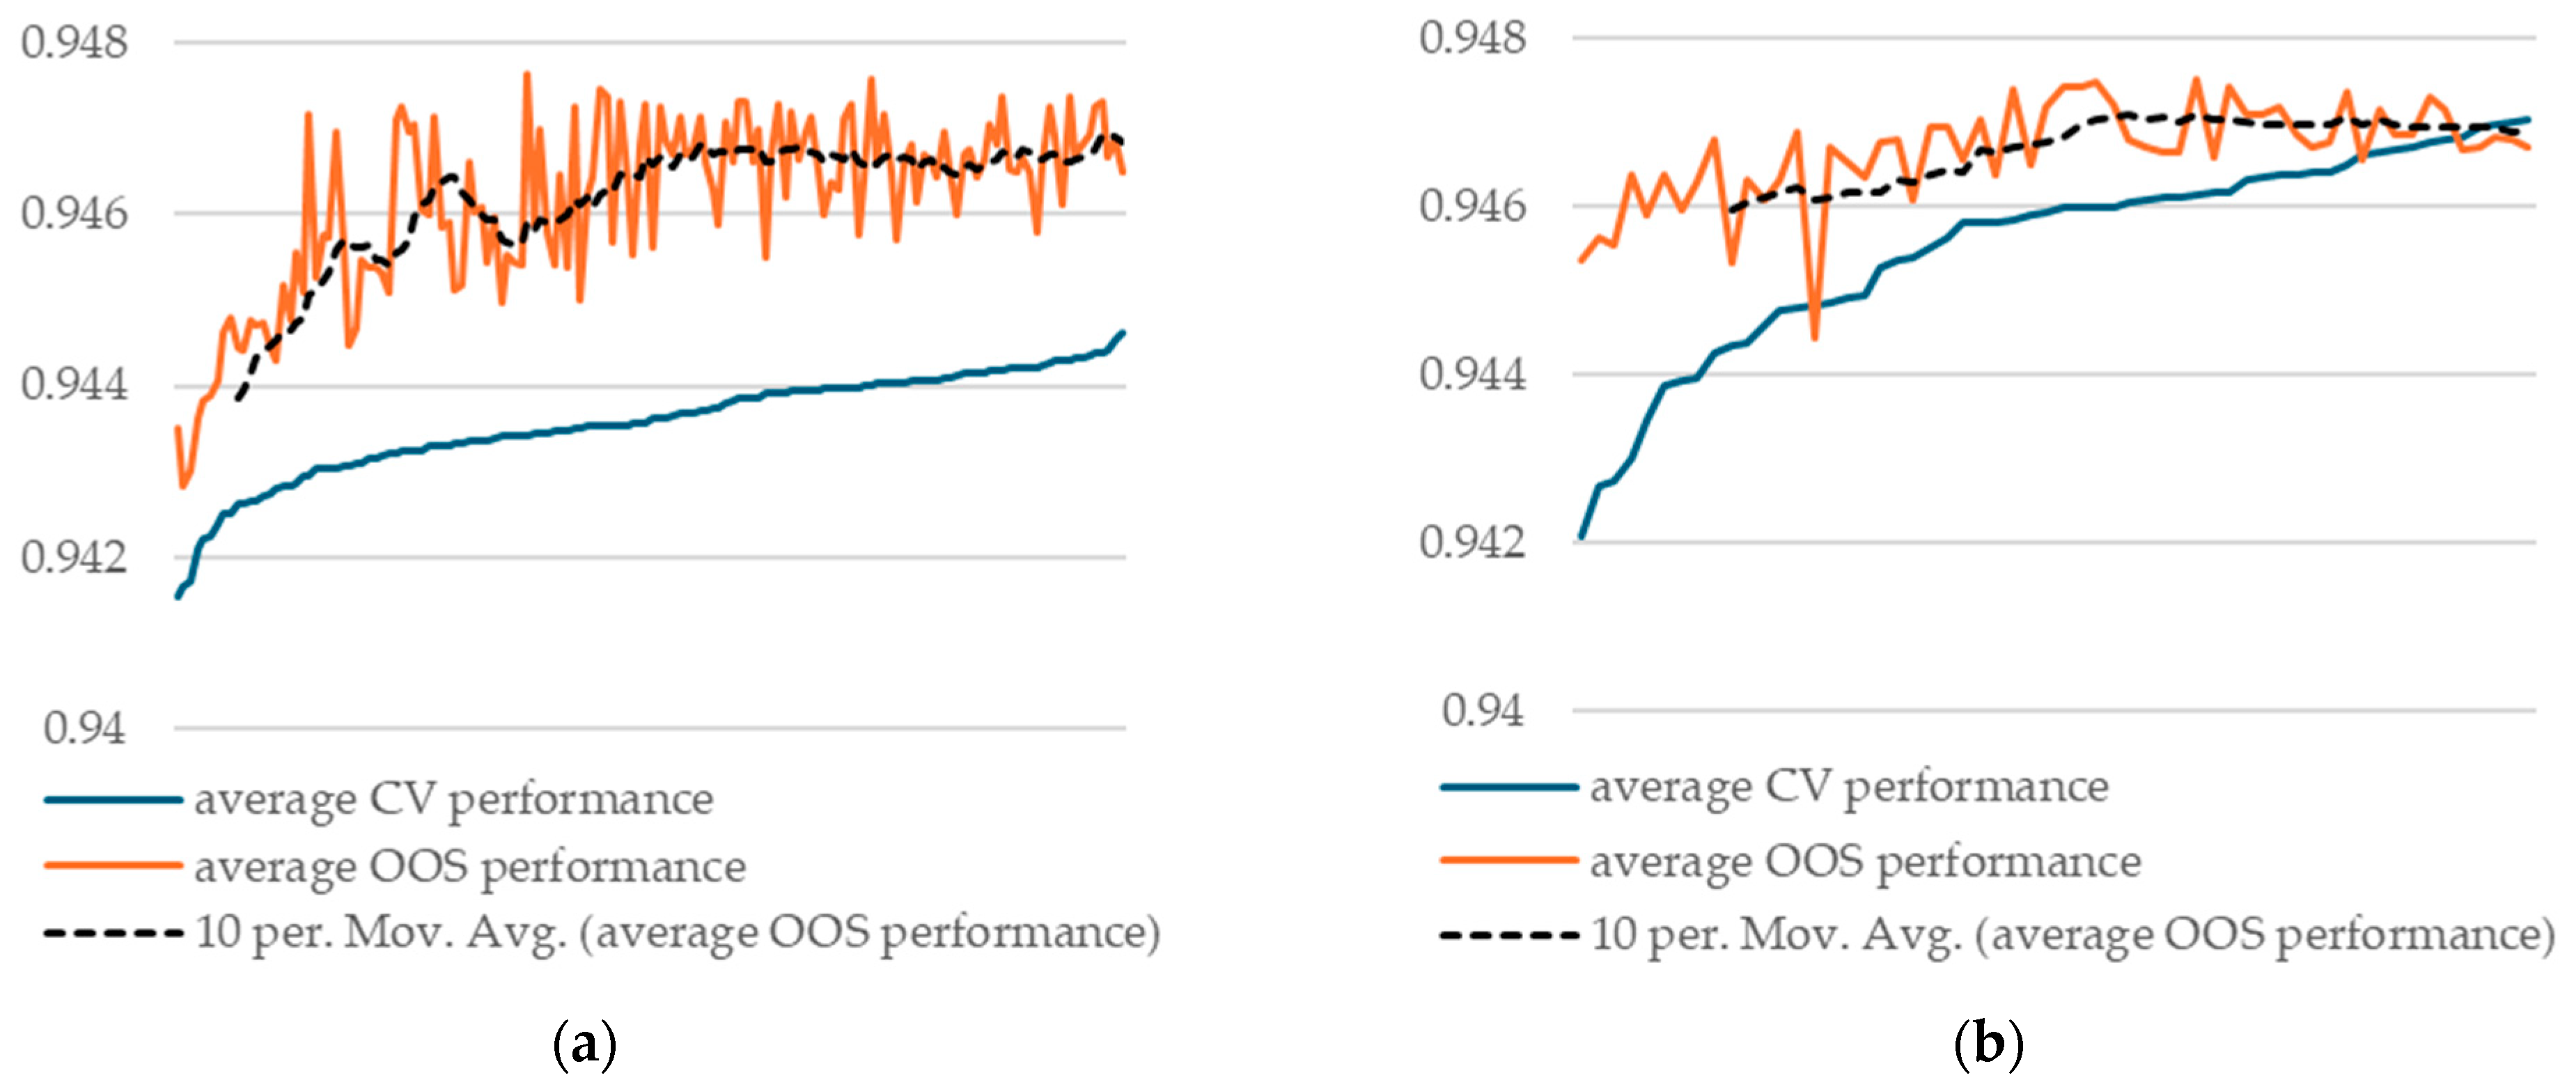
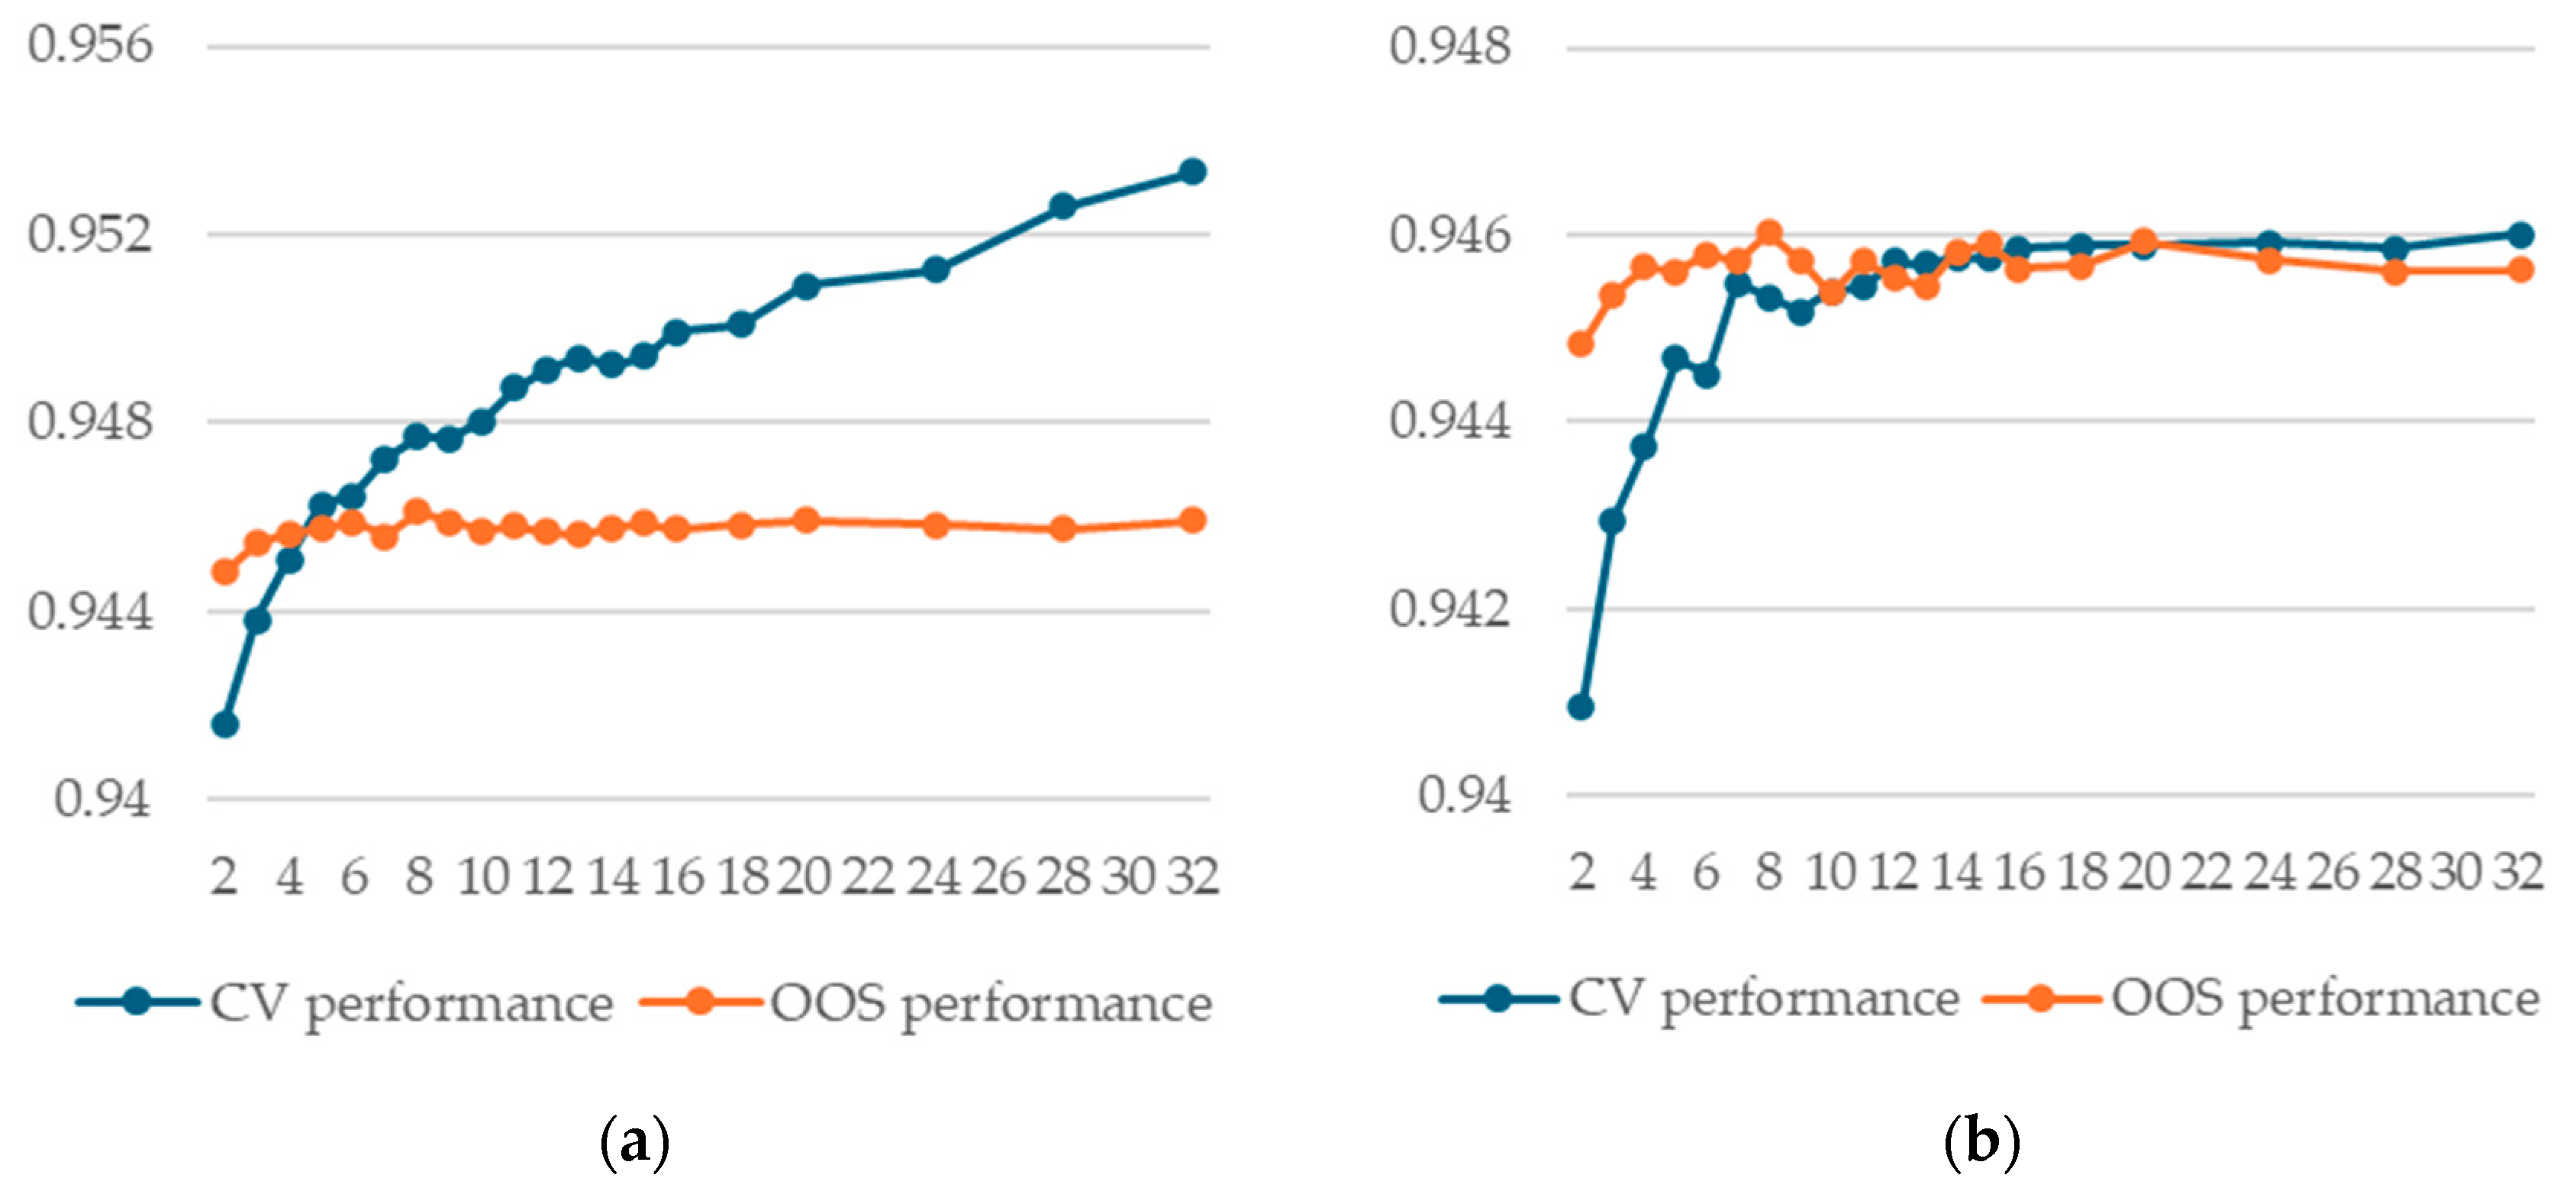
Our results show that, when averaging CV and OOS for each model across all 40 train/test runs, we obtained good agreement between the two measures. Hence, we conclude that, on average, k-fold cross-validation is a valid methodology for model selection. This result stands for both the random forest and XGBoost models (Figure 2).
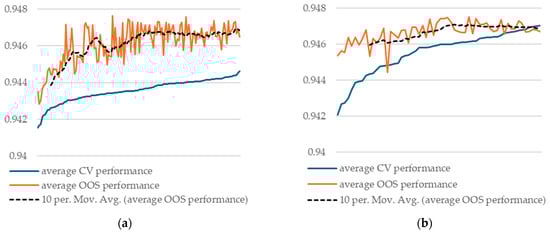
Figure 2.
Average CV and OOS performance across all 40 train/test splits, sorted by CV performance: (a) 144 different random forest models with splitrule = “hellinger”/split; (b) 58 different XGBoost models/split.
Our result empirically confirms the theoretical findings of Cawley and Talbot [9]. They show that continued hyperparameter tuning based on CV performance might even deteriorate OOS performance beyond a certain point. Our results indicate that beyond a certain point, there are no more gains in OOS performance.
Additionally, we observe that model selection regret remains low when averaged over all 40 train/test splits, reinforcing the above conclusion.
3.1.2. Stability of CV-OOS Relationship Within Splits
When looking at individual train/test splits, we note high variability in both correlation coefficients between CV and OOS performance (Figure 3) and in model selection regret.
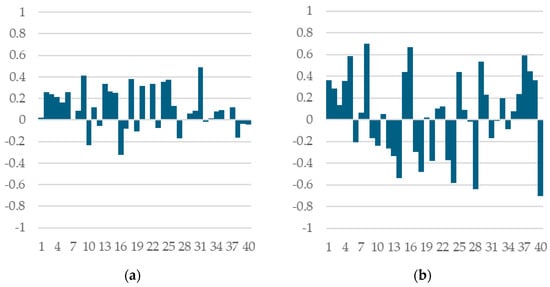
Figure 3.
Correlation coefficients between CV and OOS performance across all 40 train/test splits (a) random forest models with splitrule = “hellinger”; (b) XGBoost models.
To understand where this variability comes from, we trained multiple XGBoost models on the same train/test split but with different inner partitions into k-folds, or with the same inner partition but with different training seeds.
We find that both the correlation between CV and OOS performance and also regret remains stable across multiple runs on a given train/test split. This suggests that the success or failure of the k-fold cross-validation technique in selecting the model with the best OOS performance is largely due to the specific train/test data partition rather than the stochasticity of model training algorithm or to the inner partitioning into k-folds.
3.1.3. Variance Decomposition of Model Selection Regret
We calculated the total variance of regret δ across all 40 train test splits and decomposed it into the following sources (see Table 1):

Table 1.
Variance decomposition of model selection regret for XGBoost.
- Model training stochasticity—calculated from the models we trained on the same train/test outer split and the same inner split into k-folds;
- CV fold assignment—calculated from the models we trained on the same train/test outer split but with different inner splits into k-folds, as total variance minus the variance due to model training stochasticity;
- Train/test split—calculated as the difference between total variance and CV fold assignment variance.
These findings show that for XGBoost models, the majority (almost 67%) of variability in model selection regret comes from the train/test split, suggesting that the statistical properties of the two datasets—data available at the training stage and new data on which the model will be used (which are both out of the practitioner’s control)—play a larger role than other factors that are within the practitioner’s control (such as training data partitioning). These findings lead us to conclude that k-fold cross-validation is a valid technique for model selection on average, while in specific cases its performance is largely determined by the relationship between training and test datasets. As a result, more sophisticated model selection techniques might have only limited benefits that come with a high computational cost.
3.1.4. Statistical Analysis of CV and OOS Performance Metrics for XGBoost Models
Since there is a lot of variability between the level (average) performance across train/test splits (for both CV and OOS performance measures), we fitted a mixed effects model to determine if CV is an unbiased estimator of OOS. The dependent variable was the difference between CV and OOS performance. The model included a single fixed effect and one random effect with 40 levels (1 per train/test split). It was estimated using restricted maximum likelihood (REML) using the lme4 [23] library in R.
The fixed intercept was not statistically different from zero (t = −0.53, p = 0.60), indicating no systematic bias between CV and OOS performance.
We also performed an F-test to investigate whether the variance of CV is different than the variance of OOS performance measure. Given the aforementioned difference in average performance across splits, we performed the test using the centered measures (the corresponding average performance for each train/test split was subtracted from each performance measure). Our results indicate that OOS variance is significantly lower than CV variance (F = 1.54, p < 0.001).
Detailed tables with the statistical results are shown in Appendix D.
3.1.5. Statistical Analysis of CV and OOS Performance Metrics for Random Forest Models (With splitrule = “hellinger”)
The same observation regarding the variability of CV and OOS performance metrics between train/test splits holds for random forest models as well. In fact, they follow the same pattern.
We fitted a similar mixed effects model to determine if CV performance is an unbiased estimator of OOS performance. We found that CV slightly underestimates OOS, with the fixed effect intercept estimated at −0.0032. However, the result is only weakly significant (t = −1.707, p = 0.09).
We also performed an F-test to investigate whether CV performance variance is different than OOS performance variance. Our results indicate that CV performance variance was lower than OOS performance variance by a small, but statistically significant, margin (F = 0.888, p < 0.001), a result opposite to that obtained with XGBoost models.
Detailed tables with the statistical results are shown in Appendix D.
3.1.6. OOS Correlations Across Outer Splits
To further support our finding that generalization performance depends largely on the train/test splits, we computed pairwise correlations between OOS performances across all 40 train/test pairs. For this calculation, we used single models retrained on the whole train dataset with the same configurations as the models investigated in k-fold cross-validation. While the average correlation is positive, we found that some pairs of splits exhibit negative correlations, indicating that a specific model may perform well relative to competing models in one setting but poorly in another. This observation reinforces our conclusion that the statistical properties of the train/test split will play an important role in determining the success or failure of any model selection procedure a practitioner may use.
3.1.7. Stability of CV-OOS Relationship Across Model Classes
A surprising result is that the correlation between CV and OOS performance differs on the same split between random forests and XGBoost models. This suggests that there are more complex interactions at play than just the statistical properties of the train and test datasets.
Figure 4 plots on the X axis the difference in CV performance for the best XGBoost model and the best random forest model (as measured by CV performance). The Y axis plots the difference in OOS performance of the same two models. Each dot corresponds to one of the 40 train/test splits. As can be seen, decisions between model classes taken using CV performance will, more often than not, be incorrect. This surprising fact warrants further research.
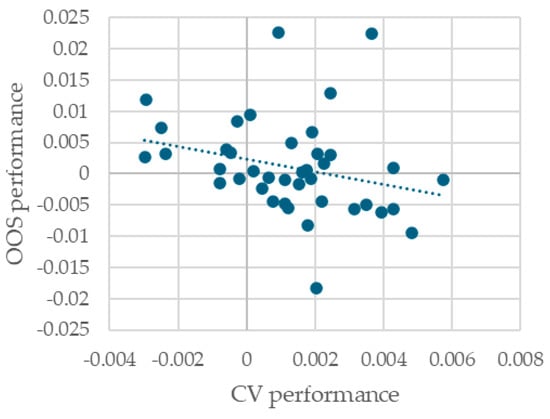
Figure 4.
Difference in CV and OOS performance between the best-performing (CV performance) random forest and XGBoost model for each train/test split.
3.2. k-Fold Cross-Validation Implementation Recommendations
In order to compare various k-fold cross-validation implementation options, we employed the same nested cross-validation approach. Some of the available options lead to significant impacts on CV performance. Our approach was motivated by the desire to answer the following question: are changes in CV performance due to different k-fold cross-validation options reflected in changes in OOS performance? Our results show that the CV metric can be easily overfitted by some implementation choices.
3.2.1. Determining Whether the Model Is at Capacity or Not
This is an important step in any modelling exercise because it can guide the data partition setup. A model is said to be at capacity when additional data will not improve performance. Whether a model is at capacity or not depends both on its ability to learn additional details and complexities from data but also on the characteristics of the new data presented—if the new data are very similar to the existing, there is no more information that can be extracted, no matter how capable the model is.
If a model is not at capacity, then the practitioner is motivated to use all available data to learn the model’s parameters. In such cases, techniques such as k-fold cross-validation are especially useful because they allow the practitioner to use all available data both for learning parameters and tuning hyperparameters.
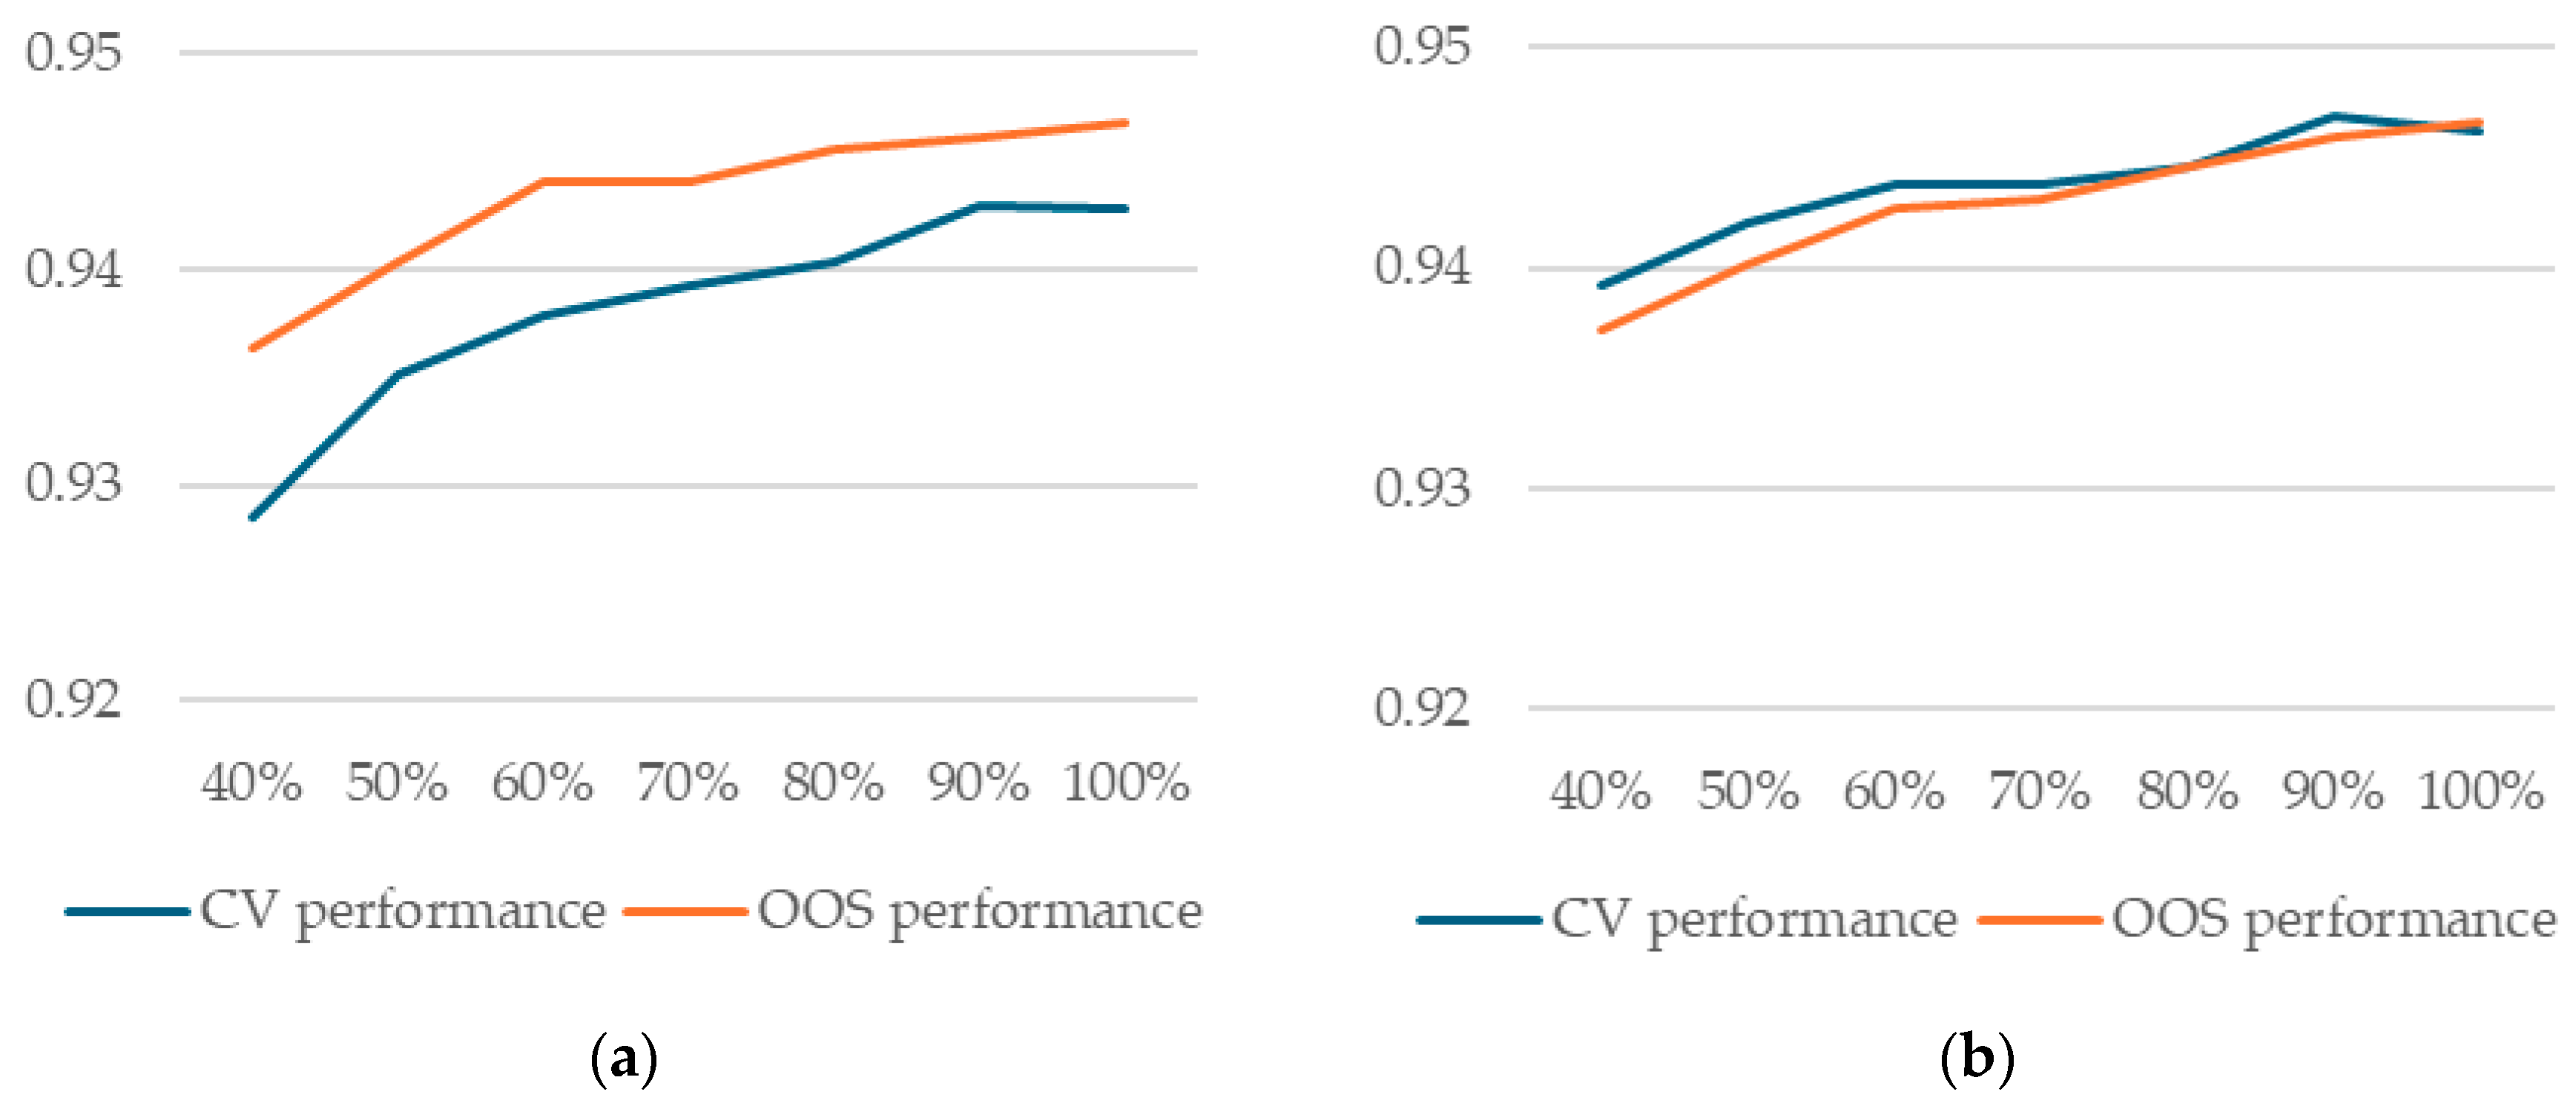
Our results show that, in our case, neither random forest nor XGBoost models are at capacity. We trained both types of models on smaller samples of the three outer folds used as training data (50%, 60%, 70%, 80%, 90%, and 100%) and evaluated both CV and OOS performance. Our results show that both are still increasing as more data are added (Figure 5).
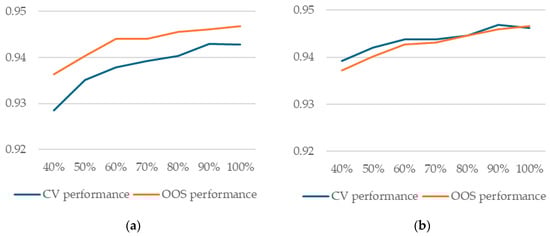
Figure 5.
Model performance as a function of percentage of training data used in training (a) random forest models with splitrule = “hellinger”; (b) XGBoost models.
A practical conclusion from this result is that no matter what procedure a practitioner uses to select the model with best generalization performance, training (learning its parameters from data) should be performed on the whole dataset, one way or another (as we shall see, there are more options for this aspect as well). This observation will prove important in the discussion below in Section 4.
3.2.2. Determining the Optimal Value for k
We computed cross-validation and out-of-sample performance using our nested cross-validation approach for various values for k, ranging from 2 to 32, using XGBoost. We ran the experiment 15 times for robust results using different seeds for data partitioning and training. We investigated two options in calculating predictions (both for the inner and outer folds): using the best iteration for each of the k models or using the median iteration calculated across all k models.
Our results show that using the best iteration leads to a significant optimistic bias for the cross-validation performance metric, increasing with k (Figure 6).

Figure 6.
Cross-validation and out-of-sample performance as a function of k for XGBoost models (a) using best iteration; (b) using average of best iteration for each k.
Another important result regarding the optimal value for k is that a larger k will only marginally (if at all) improve out-of-sample performance. As a result, given that the computational effort required for training is somewhat directly proportional to k, it follows that smaller values are preferred.
As a result, two important conclusions can be drawn: (1) when evaluating CV performance for different values of k, the average iteration calculated across all k models should be used, and (2) larger values for k do not lead to improved OOS performance, but entail a significant computational cost.
3.2.3. Splitting the Data into k-Folds
Both López et al. [15] and Moreno-Torres et al. [16] show that, with imbalanced datasets, stratified cross-validation may lead to inaccurate performance error estimates. On the other hand, Rodriguez et al. [17] show that k-fold cross-validation error variance is mainly attributable to the training set variability rather than changes in the folds.
We selected a single XGBoost model with relatively good performance and retrained it 15 times for each train/test split using different inner splits into k-folds. Our results show significant CV performance variance, a result consistent with López et al. [15], Moreno-Torres et al. [16], and also Teodorescu and Toader [12], but also little OOS performance variance, a result consistent with Rodriguez et al. [17]. We conclude that the actual split into k-folds is less relevant for a model’s generalization capacity, even if the reported CV performance may be inaccurate.
We performed the same experiment with a random forest model and obtained the same results.
3.2.4. Using k Models for Predictions on New Data vs. Retraining a Single Model on the Whole Dataset
After training a number of models with different hyperparameter configurations using k-fold cross-validation, one will be selected. The practitioner now has two options when using the model with new data: to average all k models that are already trained, or to retrain a single new model with that particular hyperparameter configuration on the whole training dataset. Since there are no data left to use to determine the optimal stopping round for XGBoost models, the algorithm will be stopped at the average of the best iterations of the corresponding k models.
Our results show that for XGBoost models, there is practically no difference in OOS performance between the two options. This observation will prove important in the discussion below in Section 4.
3.2.5. When Using XGBoost with New Data, Is There a Difference Between Using Best Iteration or Average of All k Best Iterations?
There are two options if the practitioner chooses to use all k models trained during the k-fold cross-validation model selection phase: to use each model’s best iteration in calculating the predictions on new data, or to use the average across all k models. We found that there is no difference in either CV performance, OOS performance, or model rankings based on the two metrics.
3.3. Hyperparameter Tuning Insights
3.3.1. Random Forest
We performed a complete grid search analysis of the following hyperparameters: ntree, mtry, min.node.size, sample.fraction, and splitrule (for values “gini” and “hellinger”). We analyzed both CV and OOS performance and, as previously noted, found that there is, on average, good agreement between the two measures.
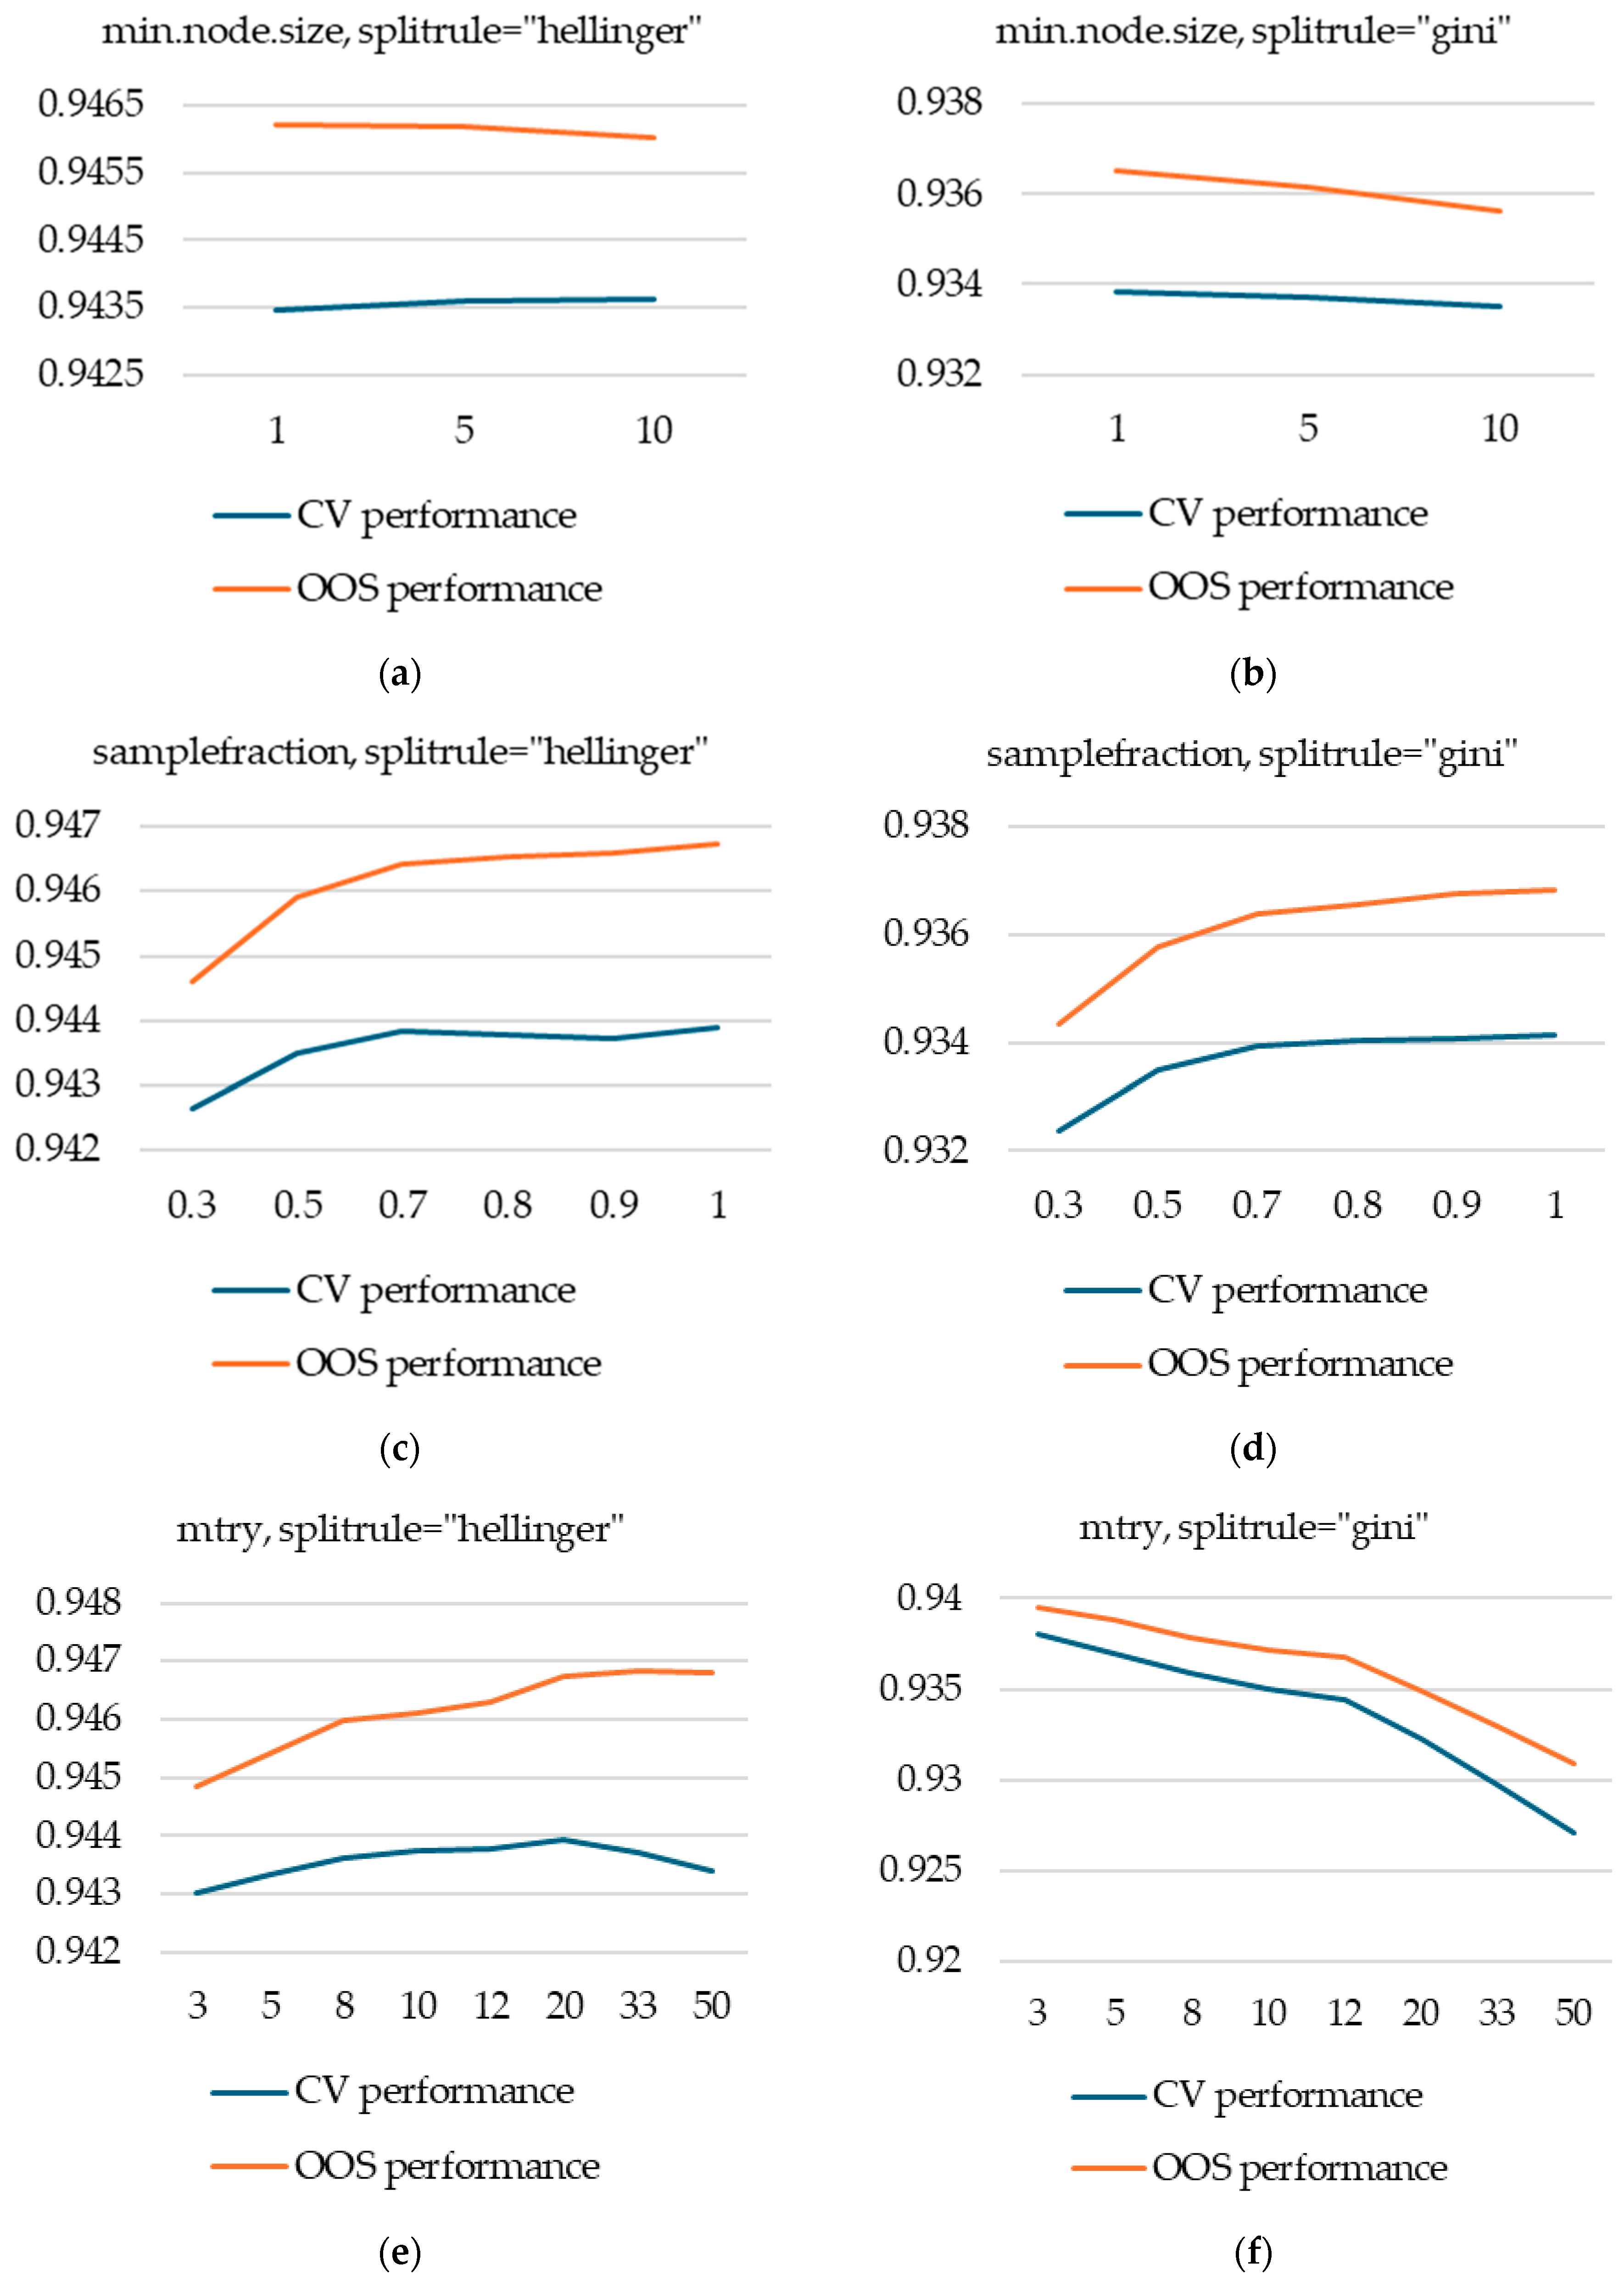
Our main finding is that the hyperparameter splitrule has the biggest effect on performance: splitrule = “hellinger” significantly outperforms splitrule = “gini”. For splitrule = “hellinger”, the random forest model’s performance is equal to that of an XGBoost model, which is a slightly unexpected finding, as generally XGBoost outperforms random forest.
Another important finding is that the two options investigated for splitrule will have a different impact on the performance of other hyperparameters: for splitrule = “hellinger”, the mtry parameter needs to be a lot higher (with optimal values between 20 and 50) than for splitrule = “gini” (where a value of 3 outperforms others).
We also found that min.node.size has almost no impact on performance for the values tested (1, 5, and 10), while samplefraction should not be set too low, as values below 0.5 will degrade both CV and OOS performance.
Figure A1 in Appendix A presents the CV and OOS performances with respect to the hyperparameters tuned.
3.3.2. XGBoost
According to our results, the most important hyperparameter is eta, as it can dramatically impact performance if it is set too high. However, decreasing the value of eta below a certain point will not improve performance in a meaningful way. The computational effort to train a model is inversely proportional to eta; hence, setting it too low has significant costs.
Another important observation is that out-of-sample performance is not impacted as much as cross-validation performance (even though the impact remains significant). We recommend studying the behavior of eta at the early stages of modelling using a nested cross-validation approach to observe both cross-validation and out-of-sample performance. In this paper, we assumed a practitioner will only use k-fold cross-validation, and our main finding is that, indeed, using k-fold cross-validation is both valid and sufficient for hyperparameter tuning. We only employed the nested cross-validation approach to validate the k-fold cross-validation technique. However, in the case of eta, due to its importance and also due to the significantly different behavior of the two performance metrics based on eta values, we recommend using the nested cross-validation technique. This effect arises because smaller values of eta are more effective in overfitting the validation fold in k-fold cross-validation since it makes the algorithm more granular. Other hyperparameters have much more stable overfitting behavior—the bias being almost constant across different values they may take.
This is an important observation with practical implications. For instance, in this paper, we followed Teodorescu and Toader [12], who selected a value of 0.01 for eta based on cross-validation performance. However, when looking at out-of-sample performance, we observed that we could have used 0.05 without any significant loss in out-of-sample performance. This would have allowed us to train our models almost 5 times as fast (Figure 7).
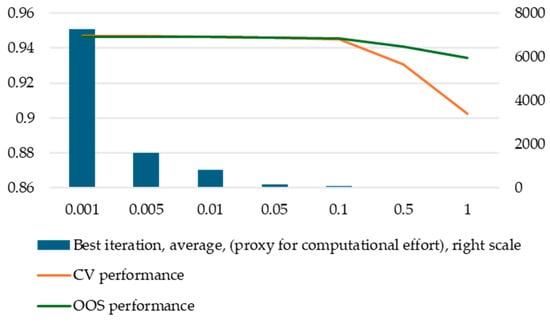
Figure 7.
Computational effort, CV, and OOS performance by eta values.
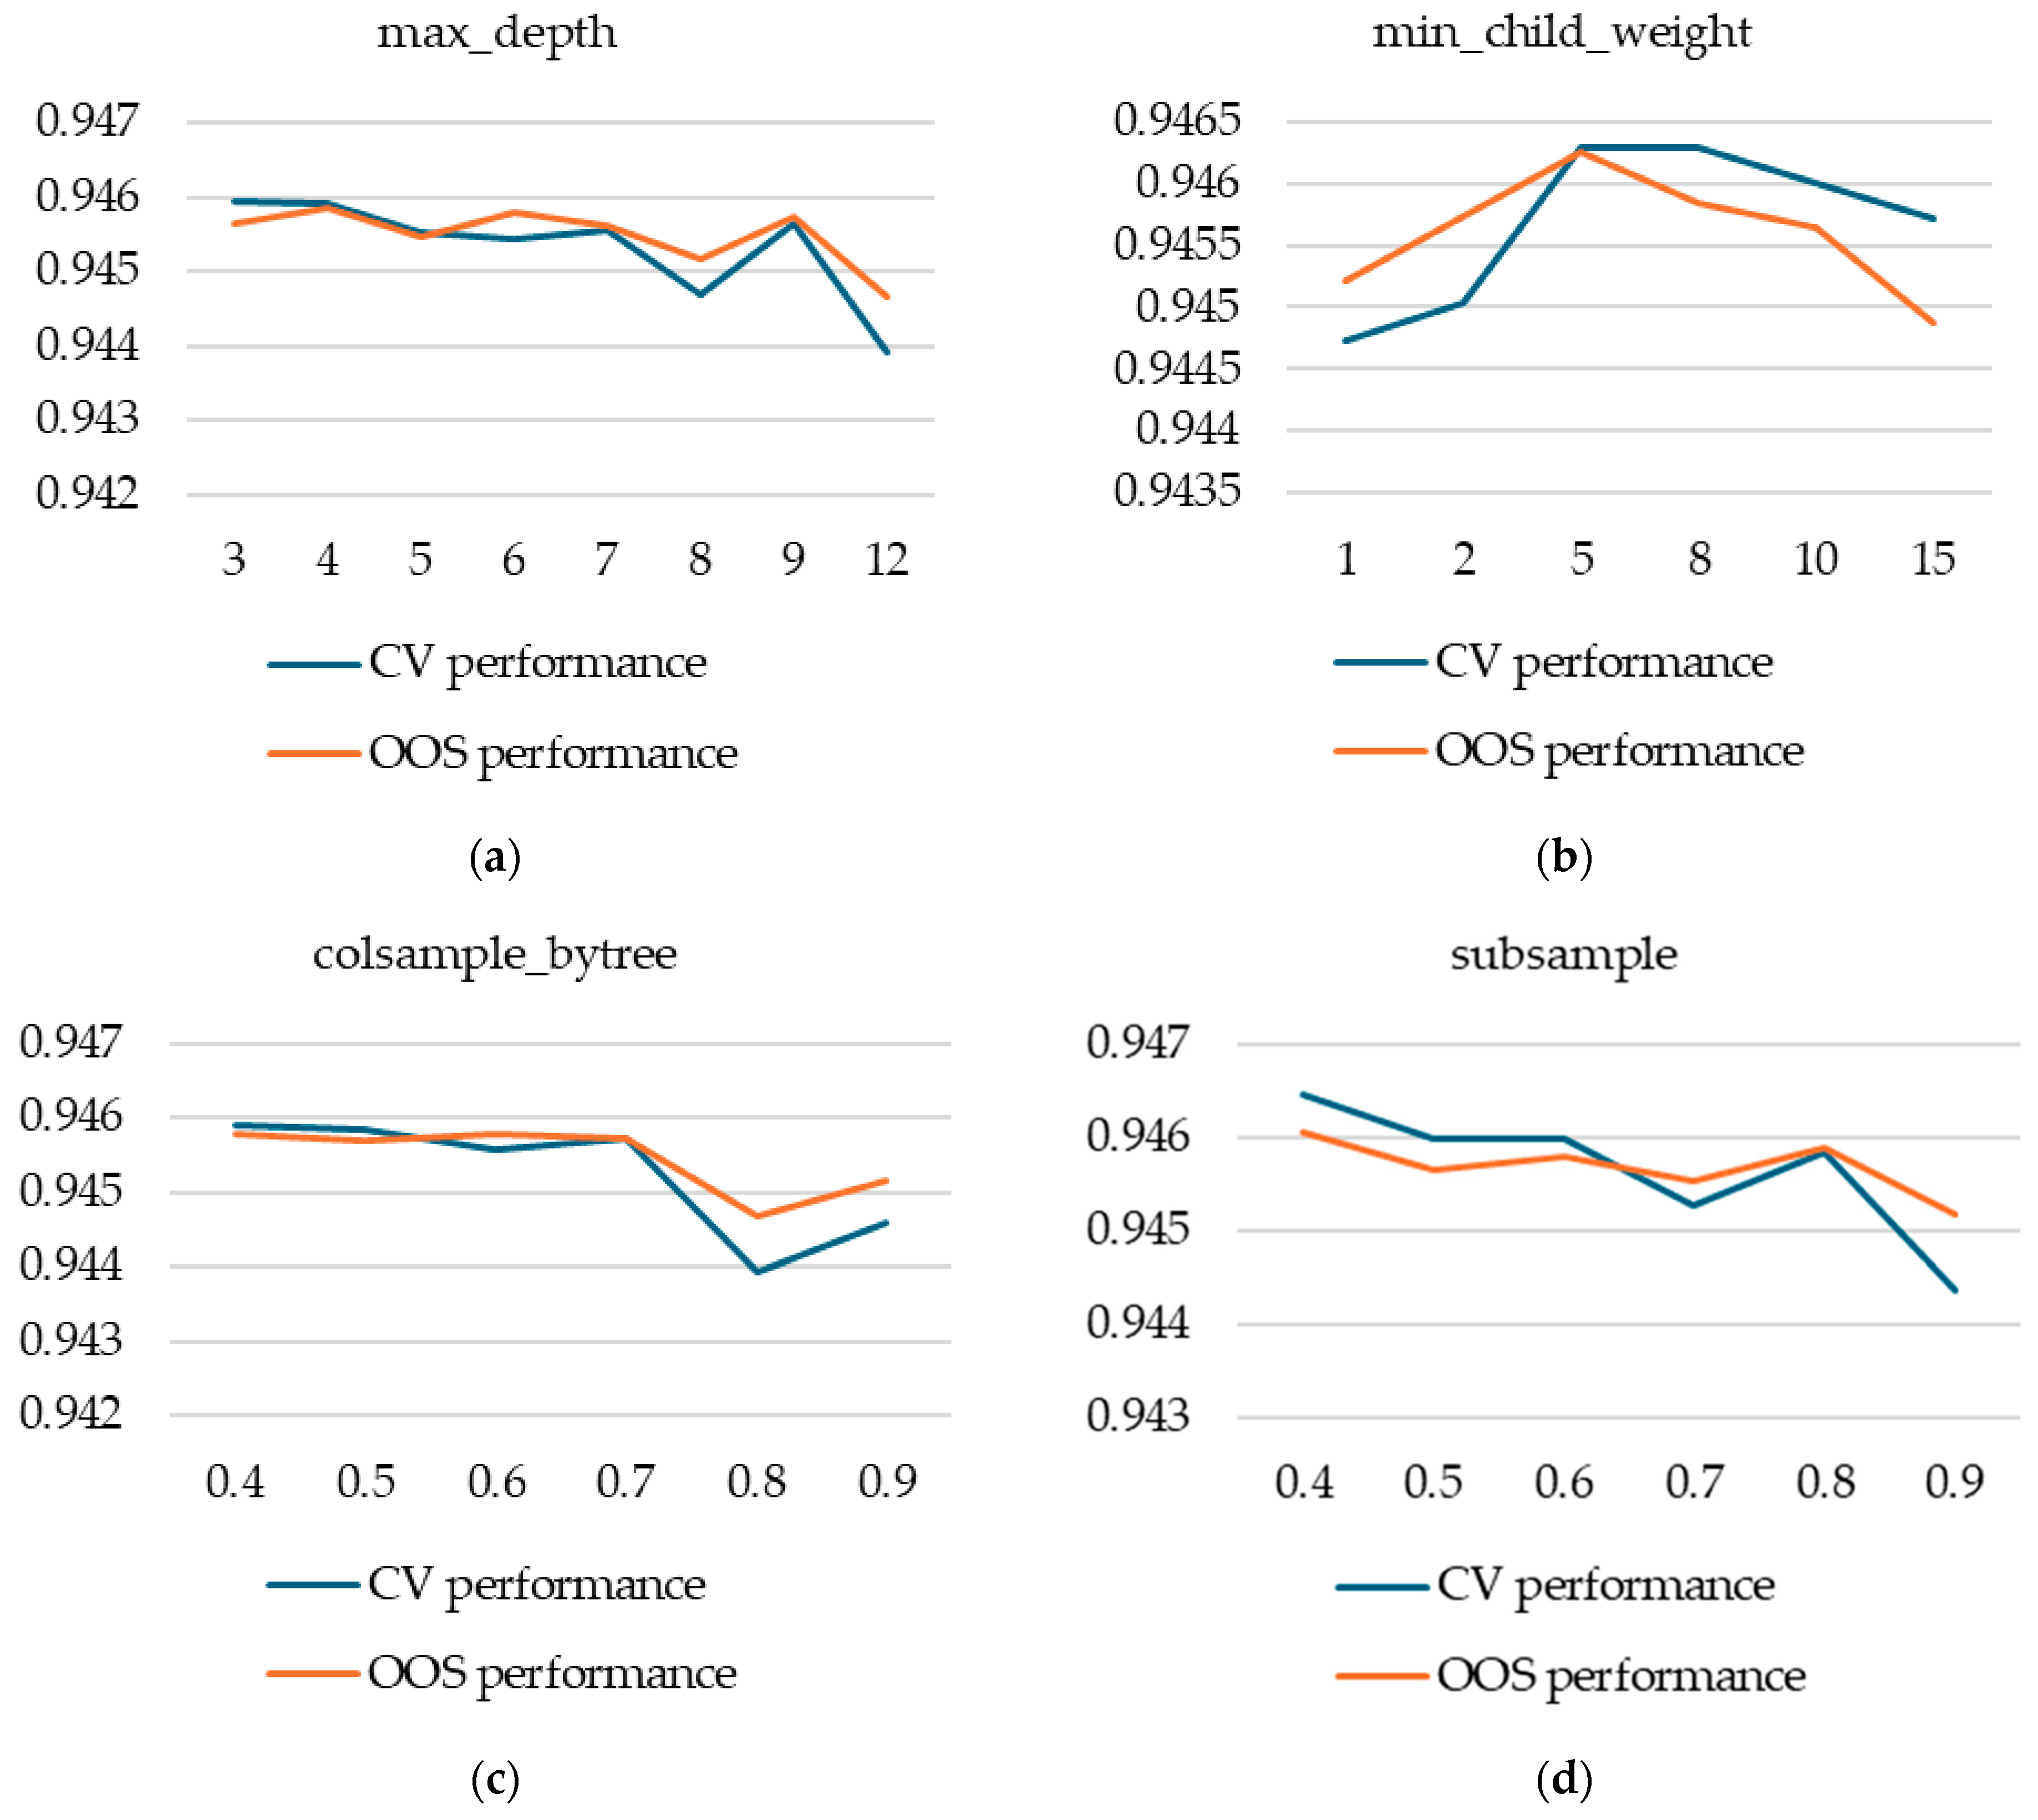
Other important hyperparameters for XGB models are: max_depth, min.child.weight, subsample, and colsample_bytree. We studied them by performing a guided grid search for a total of 58 configurations of these four hyperparameters. We started, at first, with fewer configurations and extended the grid search around values with higher cross-validation performance and also in spaces not well covered by our first selection. Our results show that the impact of varying hyperparameters is larger on CV performance than on OOS performance, but it is consistent on average.
Next, we turned our attention to what we a priori expected, based on our previous experience, to be hyperparameters with less potential to improve performance: max_delta_step, scale_pos_weight, and gamma. We fixed the five hyperparameters already discussed above to values that produced relatively high CV performance and that are somewhat in the middle of the values tested (eta = 0.01, max_depth = 5, min_child_weight = 5, subsample = 0.5, colsample_bytree = 0.5) and then studied, one by one, different values for the max_delta_step, scale_pos_weight, and gamma hyperparameters.
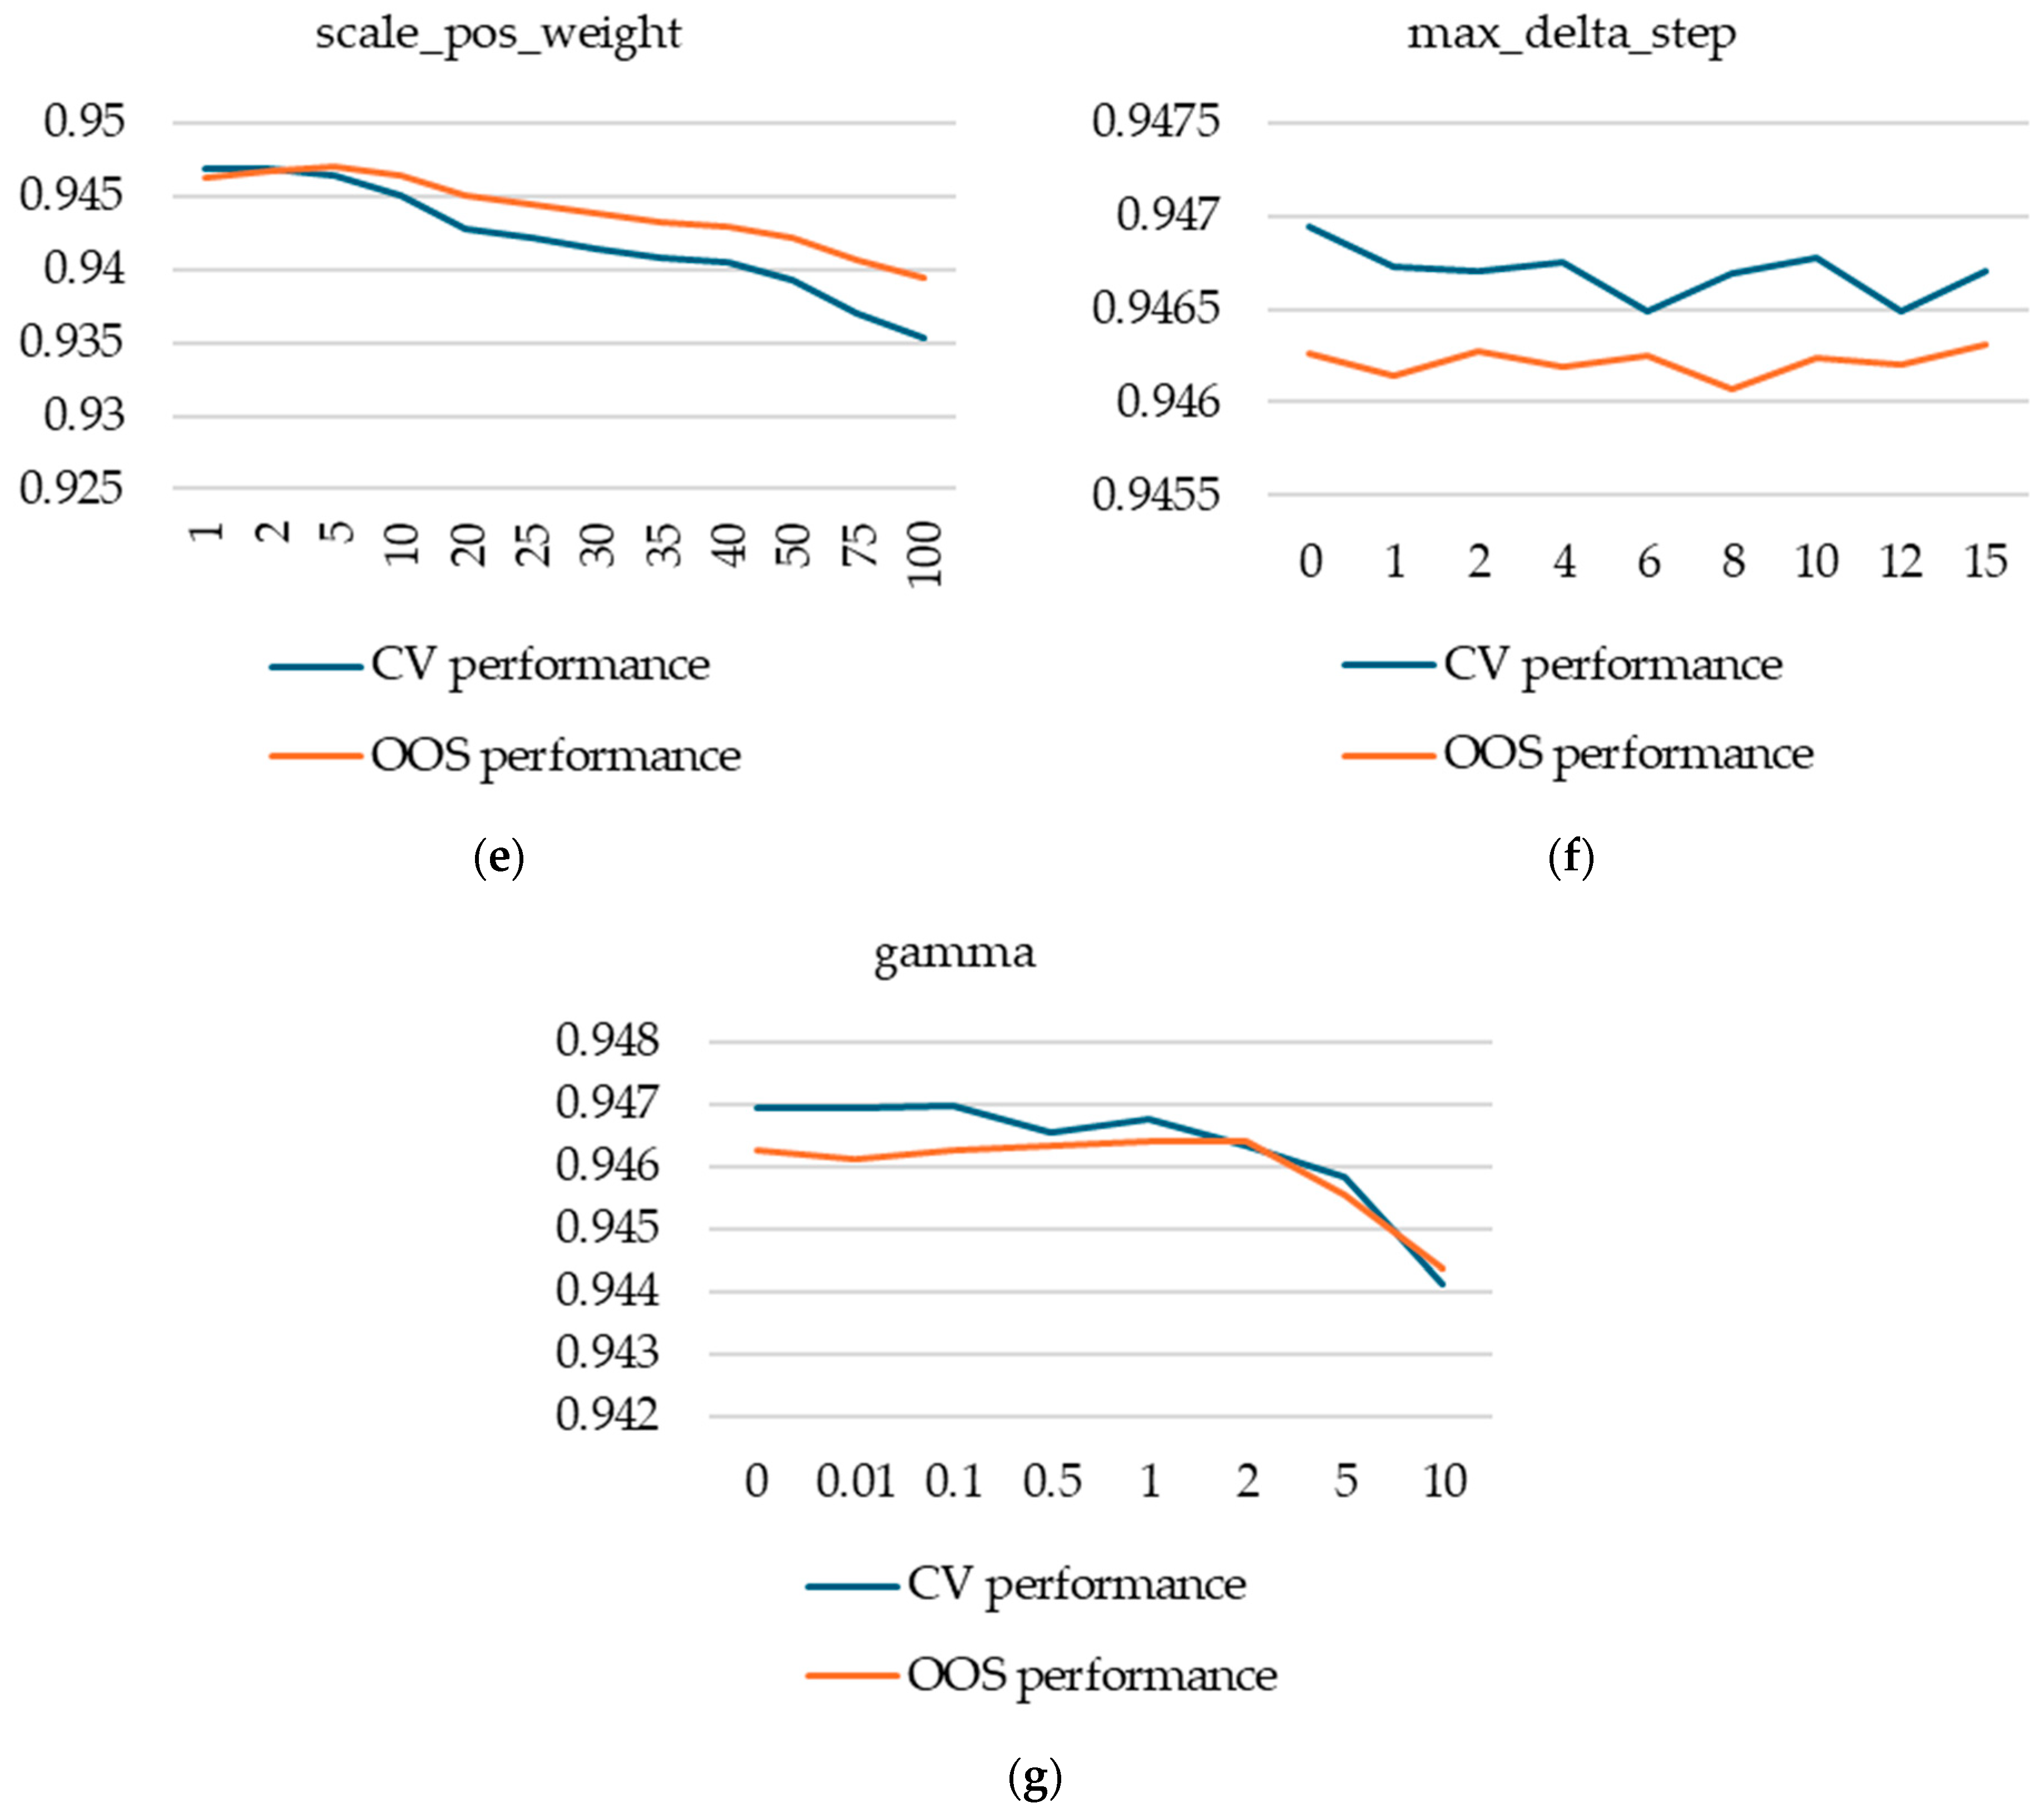
For scale_pos_weight, we found that the default values produce significantly higher performance, even though its intended purpose was to correct for class imbalance—our database exhibiting high class imbalance. Moreover, the decrease in performance for higher values of scale_pos_weight is doubled by a significant increase in computational effort.
We found max_delta_step to be completely irrelevant for our case, with no variation in performance (both cross-validation and out-of-sample) or computational effort.
Figure A2 in Appendix A presents the CV and OOS performances with respect to the hyperparameters tuned.
4. Discussion
Our results provide empirical evidence on the effectiveness of k-fold cross-validation as a model selection methodology within the same model class.
We find that although k-fold cross-validation performs well as a model selection tool on average, it may fail in specific cases. Our findings suggest that such failures are largely attributable to the inherent properties of the dataset available to the practitioner during training and the data on which the model will be deployed. These properties are outside of the practitioner’s control and are a given in any real-world modelling exercise. This conclusion is supported by our variance decomposition analysis, which shows that almost 67% of model selection regret is attributable to the train/test split.
Three key observations lead to our conclusion:
- The model is not at capacity; hence, it will benefit from being trained on the full dataset (result from Section 3.2.1)
- Retraining a single model on the whole dataset produces practically the same results on new data as using all k models trained during the k-fold cross-validation model selection phase (result from Section 3.2.2)
- Pairwise correlations between OOS performance measures of single retrained models on the full training set for each of the 40 runs are sometimes negative (result from Section 3.1.3)
Observations 1 and 2 lead us to conclude that, regardless of which model a selection process selects, a practitioner will ultimately arrive at a situation equivalent to having a single (selected) model trained on the full training dataset to be used in practice with new data. This conclusion, combined with observation 3, leads us to conclude that any model selection procedure that a practitioner may implement will ultimately be largely affected by the characteristics of the training and deployment datasets. From a practical perspective, this conclusion is in line with Wainer and Cawley [10], who argue that more complex model selection techniques do not provide sufficient benefits to justify their increased computational cost.
These insights are further reinforced by the stability of the Spearman correlation between CV and OOS performance and also of the model selection regret within a fixed train/test split: when the inner k-folds or the model training seeds are varied, correlations between CV and OOS performance remain stable in both sign and magnitude.
As noted, according to our results, k-fold cross-validation apparently fails to select the best model between classes of models (random forest and XGBoost), suggesting that the interaction between data properties and model type is more complex. This observation warrants further research.
As shown, k-fold cross-validation can overfit the CV performance metric if care is not used, with no corresponding OOS performance gains. For XGBoost models, for example, setting k too high and using the best iteration, using a small eta, or trying out multiple alternative splits into k-folds may entail significant computational cost and artificially increase CV performance with no impact on OOS performance.
A limitation of our study stems from not having access to actual new data. Other research papers split the data according to time. Models are trained on data from earlier periods and tested on data from later periods. Such a setup would simulate the arrival of new data from the real world, but it was not possible to implement it in our case because the data sample, even though it spans across multiple years, does not have a time stamp.
It is important to note that our study is an empirical in-depth analysis based on a single dataset. Although our findings offer valuable insights into the use of k-fold cross-validation for model selection and also into hyperparameter tuning for random forest and XGBoost models, they may not fully generalize to other datasets.
Our findings are relevant beyond bankruptcy prediction, offering insights for practitioners using k-fold cross-validation as a model selection strategy in various financial and risk modeling tasks.
Author Contributions
Conceptualization, V.T. and L.O.B.; methodology, V.T. and L.O.B.; software, V.T.; validation, V.T.; formal analysis, V.T. and L.O.B.; investigation, V.T.; writing—original draft preparation, V.T.; writing—review and editing, L.O.B.; visualization, V.T.; supervision, L.O.B. All authors have read and agreed to the published version of the manuscript.
Funding
This paper was cofinanced by The Bucharest University of Economic Studies during the PhD program.
Data Availability Statement
Data were made publicly available by the authors that compiled them [11] and are available at: https://doi.org/10.24432/C5004D (last accessed: 30 March 2025).
Acknowledgments
The authors would like to express their gratitude to the administrative staff at Research Center of Bucharest University of Economic Studies for their invaluable support in facilitating the research process.
Conflicts of Interest
The authors declare no conflicts of interest.
Abbreviations
The following abbreviations are used in this manuscript:
| CV | Cross-validation |
| OOS | Out-of-sample |
| ML | Machine learning |
| ROS | Random oversampling |
| SMOTE | Synthetic minority oversampling technique |
| TL | Tomek links |
| ENN | Edited nearest neighbor |
Appendix A. Hyperparameter Tuning
Appendix A.1. Random Forest Hyperparameter Tuning
The following figure presents the results of hyperparameter tuning for random forest models. All values are averages over all runs and models with a particular value for a particular hyperparameter.
A note of caution is warranted: complex interactions between hyperparameters will be lost when plotting such averages. Additionally, if a certain value V of a certain hyperparameter H is only used in models where other hyperparameters induce poor performance, this might incorrectly lead to the conclusion that H = V will produce poor performance. We have made efforts to spread hyperparameter values evenly with respect to the rest of the hyperparameters, but this cautionary warning is still warranted.
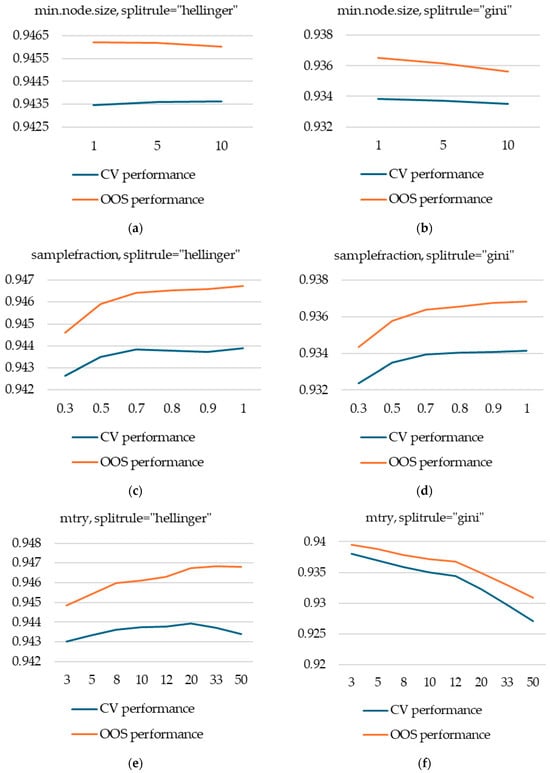
Figure A1.
Hyperparameter tuning for random forest models (a) min.node.size, with splitrule = “hellinger”; (b) min.node.size, with splitrule = “gini”; (c) samplefraction, with splitrule = “hellinger”; (d) samplefraction, with splitrule = “gini”; (e) mtry, with splitrule = “hellinger”; (f) mtry, with splitrule = “gini”.
Appendix A.2. XGBoost Hyperparameter Tuning
The following figure presents the results of hyperparameter tuning XGBoost models. All values are averages over all runs and models with a particular value for a particular hyperparameter.
A note of caution is warranted: complex interactions between hyperparameters will be lost when plotting such averages. Additionally, since we did not perform a complete grid search for XGBoost, if a certain value V of a certain hyperparameter H is only used in models where other hyperparameters induce poor performance, this might incorrectly lead to the conclusion that H = V will produce poor performance. We have made efforts to spread hyperparameter values evenly with respect to the rest of the hyperparameters, but this cautionary warning is still warranted.
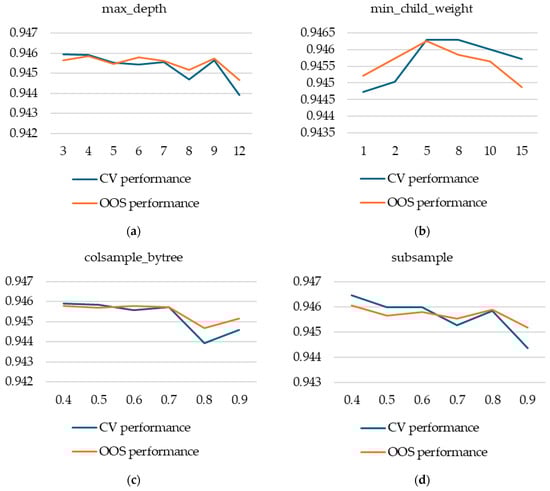

Figure A2.
Hyperparameter tuning for XGBoost models. (a) max_depth; (b) min_child_weight; (c) colsample_bytree; (d) subsample; (e) scale_pos_weight; (f) max_delta_step; (g) gamma.
Figure A2.
Hyperparameter tuning for XGBoost models. (a) max_depth; (b) min_child_weight; (c) colsample_bytree; (d) subsample; (e) scale_pos_weight; (f) max_delta_step; (g) gamma.
Appendix B. Diagram and Pseudocode for the Nested Cross-Validation Experimental Design
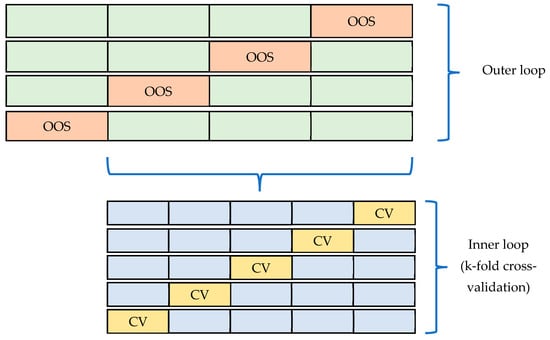
Figure A3.
Diagram of the nested cross-validation technique.
Figure A3.
Diagram of the nested cross-validation technique.
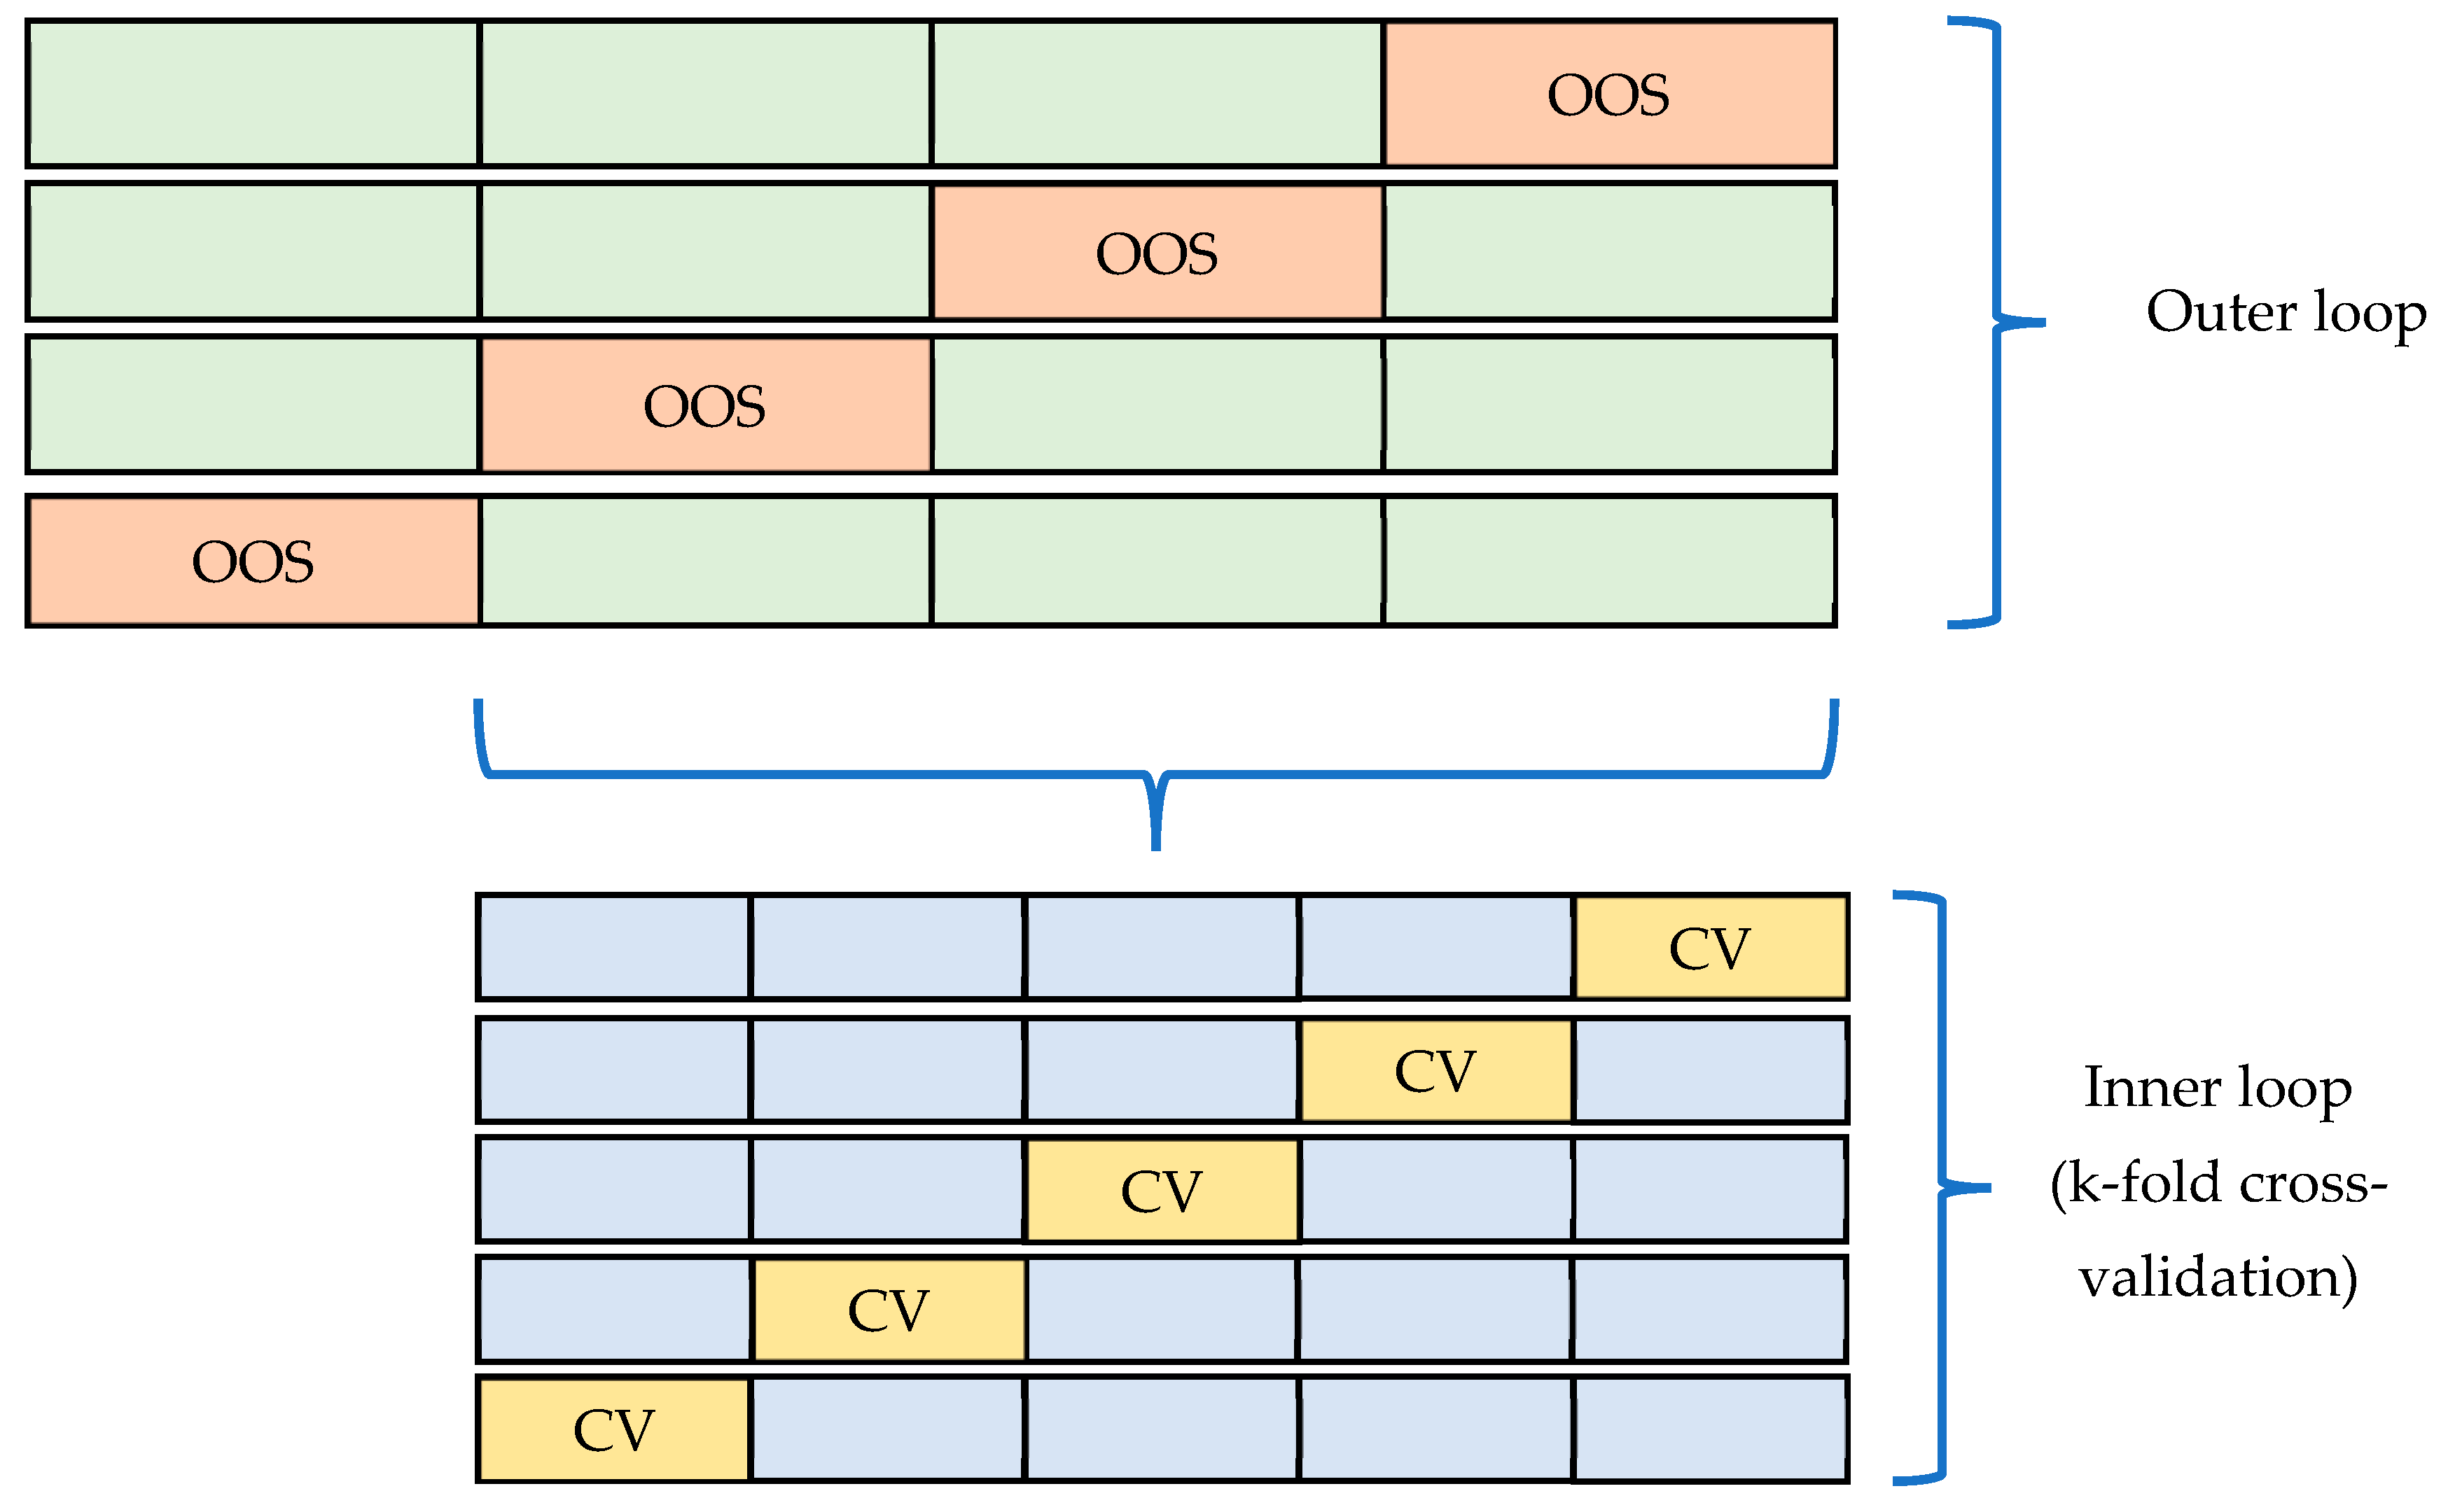
Pseudocode for the nested cross-validation technique:
Split data into 4 outer folds
For i = 1:4
{
Set Test_outer_fold = outer fold #i
Set Train_outer_folds = Whole dataset − Test_outer_fold
Split Train_outer_folds into k inner folds
For j = 1:k
{
Set Cross_validation_test_fold = inner fold #j
Set Cross_validation_train_folds = Train_outer_folds – Cross_validation_test_fold
Train model on Cross_validation_train_folds
Compute predictions for Cross_validation_test_fold
Compute predictions for Test_outer_fold
}
Compute Cross_validation_performance_i (using predictions on Train_outer_folds)
Compute Out_of_sample_performance_i (using average of the k predictions on Test_outer_fold)
}
Appendix C. Benchmarking XGBoost, Random Forest, and Logistic Regression with Regularization Models
Figure A4 and Figure A5 show the comparative OOS performance of logistic regression with regularization, random forest, and XGBoost models for all 40 train/test splits. Figure A5 shows the OOS performance of the model with the best CV performance for each train/test split, while Figure A4 shows the best-performing model in terms of OOS. Interestingly, for four train/test splits, the best logistic regression model outperforms XGBoost and random forest models. However, this is of little practical importance, given our experimental setup and goal: we simulated a practitioner that can only observe CV performance, OOS being unobservable at the time of modelling (i.e., when model selection is performed). Hence, the relevant metrics are those presented in Figure A5—the OOS performance of the best-performing model in terms of CV performance.
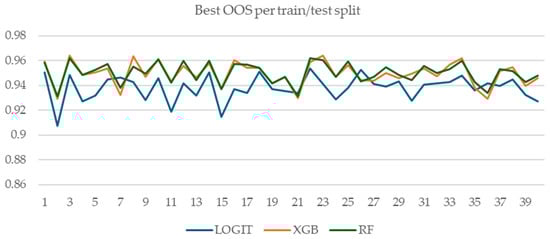
Figure A4.
OOS performance of the best performing model per train/test split.
Figure A4.
OOS performance of the best performing model per train/test split.
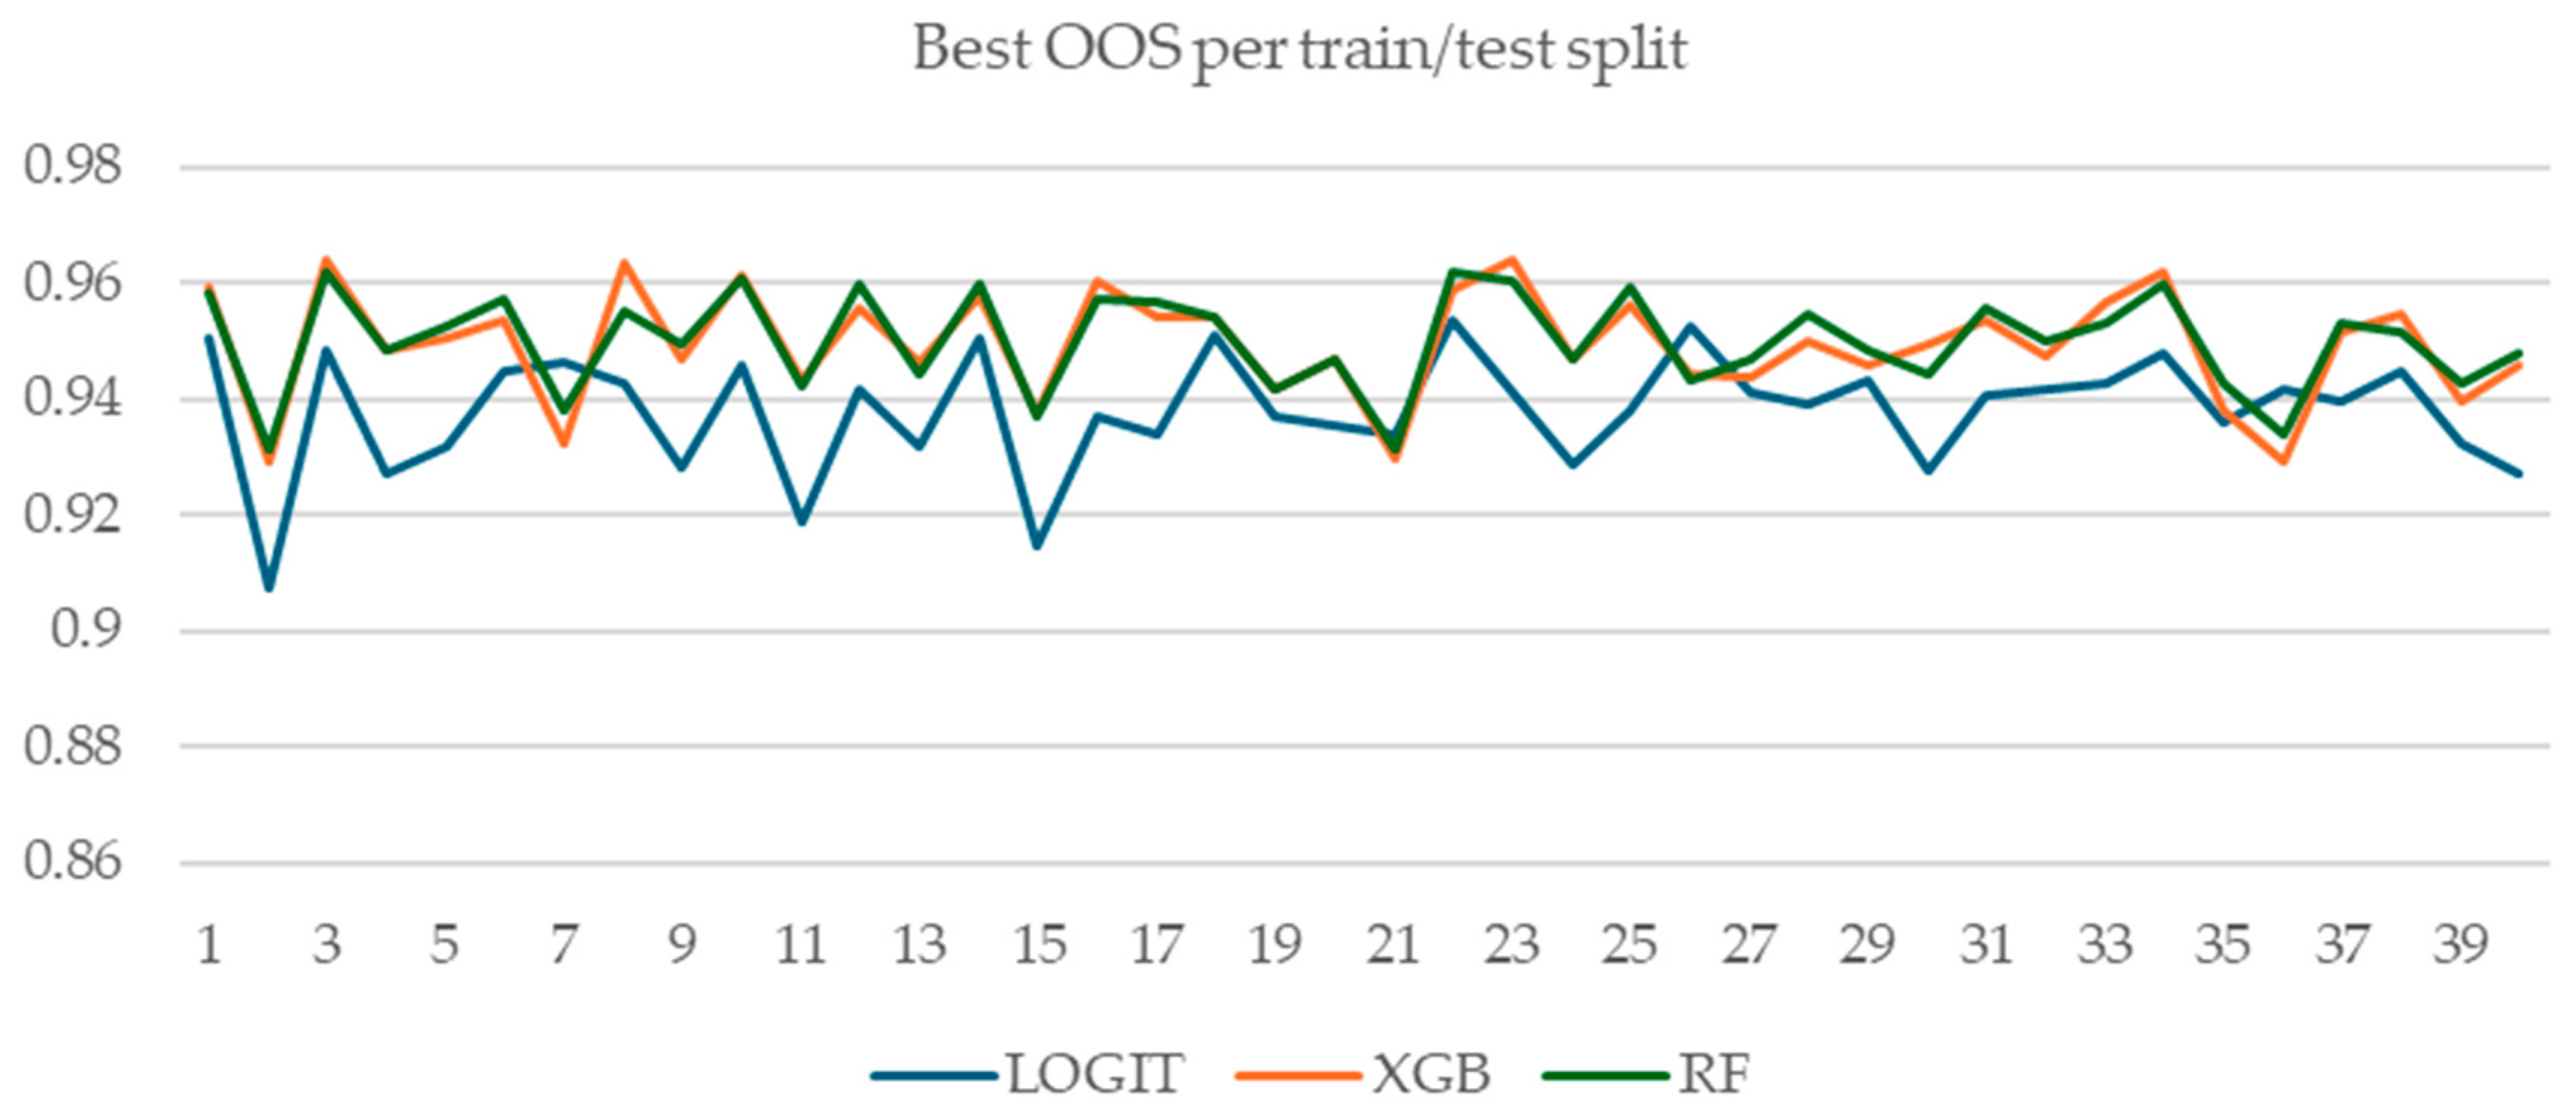
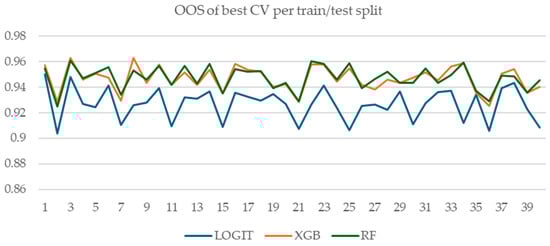
Figure A5.
OOS performance of the model with best CV performance per train/test split.
Figure A5.
OOS performance of the model with best CV performance per train/test split.
Appendix D. Summary of Statistical Tests for the Differences in CV Performance and OOS Performance
Table A1.
Mixed effects model results for XGBoost.
Table A1.
Mixed effects model results for XGBoost.
| Fixed Effect | Estimate | Std. Error | df | t-Value | p-Value |
|---|---|---|---|---|---|
| (Intercept) | −0.001119 | 0.002118 | 39 | −0.528 | 0.6 |
| Random Effect | Variance | Std. Dev | |||
| Train/test split | 1.793 × 10⁻⁴ | 0.013391 | |||
| Residual | 5.742 × 10⁻⁶ | 0.002396 | |||
Table A2.
F-Test for variance comparison between CV and OOS performance for XGBoost.
Table A2.
F-Test for variance comparison between CV and OOS performance for XGBoost.
| Statistic | Value |
|---|---|
| Alternative hypothesis | True ratio of variances is not equal to 1 |
| F-statistic | 1.5357 |
| Degrees of freedom (numerator, CV) | 2319 |
| Degrees of freedom (denominator, OOS) | 2319 |
| p-value | <2.2 × 10⁻¹⁶ |
| 95% Confidence interval for variance ratio | (1.416, 1.666) |
| sample variance ratio (CV/OOS) | 1.5357 |
Table A3.
Mixed effects model results for random forest (splitrule = “hellinger”).
Table A3.
Mixed effects model results for random forest (splitrule = “hellinger”).
| Fixed Effect | Estimate | Std. Error | df | t-Value | p-Value |
|---|---|---|---|---|---|
| (Intercept) | −0.003218 | 0.001885 | 39 | −1.707 | 0.0958 |
| Random Effect | Variance | Std. Dev | |||
| Train/test split | 1.422 × 10⁻⁴ | 0.011923 | |||
| Residual | 5.140 × 10⁻⁶ | 0.002267 | |||
Table A4.
F-Test for variance comparison between CV and OOS performance for random forest (splitrule = “hellinger”).
Table A4.
F-Test for variance comparison between CV and OOS performance for random forest (splitrule = “hellinger”).
| Statistic | Value |
|---|---|
| Alternative hypothesis | True ratio of variances is not equal to 1 |
| F-statistic | 0.8883 |
| Degrees of freedom (numerator, CV) | 5759 |
| Degrees of freedom (denominator, OOS) | 5759 |
| p-value | 7.072 × 10⁻⁶ |
| 95% Confidence interval for variance ratio | (0.844, 0.935) |
| sample variance ratio (CV/OOS) | 0.8883 |
References
- Altman, E.I. Financial Ratios, Discriminant Analysis and the Prediction of Corporate Bankruptcy. J. Financ. 1968, 23, 589–609. [Google Scholar] [CrossRef]
- Ohlson, J.A. Financial Ratios and the Probabilistic Prediction of Bankruptcy. J. Account. Res. 1980, 18, 109–131. [Google Scholar] [CrossRef]
- Barboza, F.; Kimura, H.; Altman, E. Machine Learning Models and Bankruptcy Prediction. Expert Syst. Appl. 2017, 83, 405–417. [Google Scholar] [CrossRef]
- Breiman, L. Random Forests. Mach. Learn. 2001, 45, 5–32. [Google Scholar] [CrossRef]
- Chen, T.; Guestrin, C. XGBoost: A Scalable Tree Boosting System. In Proceedings of the 22nd ACM SIGKDD International Conference on Knowledge Discovery and Data Mining (KDD ’16), San Francisco, CA, USA, 13–17 August 2016; pp. 785–794. [Google Scholar] [CrossRef]
- Alanis, E.; Chava, S.; Shah, A. Benchmarking Machine Learning Models to Predict Corporate Bankruptcy. J. Credit. Risk 2023, 19, 77–110. [Google Scholar] [CrossRef]
- Mai, F.; Tian, S.; Lee, C.; Ma, L. Deep Learning Models for Bankruptcy Prediction Using Textual Disclosures. Eur. J. Oper. Res. 2019, 274, 743–758. [Google Scholar] [CrossRef]
- Grinsztajn, L.; Oyallon, E.; Varoquaux, G. Why Do Tree-Based Models Still Outperform Deep Learning on Tabular Data? arXiv 2022, arXiv:2207.08815. Available online: https://arxiv.org/abs/2207.08815 (accessed on 29 April 2025).
- Cawley, G.C.; Talbot, N.L.C. On Over-Fitting in Model Selection and Subsequent Selection Bias in Performance Evaluation. J. Mach. Learn. Res. 2010, 11, 2079–2107. [Google Scholar]
- Wainer, J.; Cawley, G.C. Nested Cross-Validation When Selecting Classifiers Is Overzealous for Most Practical Applications. Expert Syst. Appl. 2021, 182, 115222. [Google Scholar] [CrossRef]
- Liang, D.; Lu, C.-C.; Tsai, C.-F.; Shih, G.-A. Financial Ratios and Corporate Governance Indicators in Bankruptcy Prediction: A Comprehensive Study. Eur. J. Oper. Res. 2016, 252, 561–572. [Google Scholar] [CrossRef]
- Teodorescu, V.; Toader, C.-I. Using Machine Learning to Model Bankruptcy Risk in Listed Companies. In Proceedings of the 7th International Conference on Economics and Social Sciences, Bucharest, Romania, 13–14 June 2024; Volume 6, Issue 1. pp. 610–619. [Google Scholar] [CrossRef]
- Dasilas, A.; Rigani, A. Machine Learning Techniques in Bankruptcy Prediction: A Systematic Literature Review. Expert Syst. Appl. 2024, 255, 124761. [Google Scholar] [CrossRef]
- Wright, M.N.; Ziegler, A. ranger: A Fast Implementation of Random Forests for High Dimensional Data in C++ and R. J. Stat. Softw. 2017, 77, 1–17. [Google Scholar] [CrossRef]
- López, V.; Fernández, A.; Herrera, F. On the Importance of the Validation Technique for Classification with Imbalanced Datasets: Addressing Covariate Shift When Data Is Skewed. Inf. Sci. 2014, 257, 1–13. [Google Scholar] [CrossRef]
- Moreno-Torres, J.G.; Sáez, J.A.; Herrera, F. Study on the Impact of Partition-Induced Dataset Shift on K-Fold Cross-Validation. IEEE Trans. Neural Netw. Learn. Syst. 2012, 23, 1304–1312. [Google Scholar] [CrossRef] [PubMed]
- Rodriguez, J.D.; Perez, A.; Lozano, J.A. Sensitivity Analysis of K-Fold Cross Validation in Prediction Error Estimation. IEEE Trans. Pattern Anal. Mach. Intell. 2009, 32, 569–575. [Google Scholar] [CrossRef] [PubMed]
- Fontanari, T.; Fróes, T.C.; Recamonde-Mendoza, M. Cross-Validation Strategies for Balanced and Imbalanced Datasets. In Intelligent Systems; Xavier-Junior, J.C., Rios, R.A., Eds.; Lecture Notes in Computer, Science; Springer: Cham, Switzerland, 2022; Volume 13653, pp. 626–640. [Google Scholar] [CrossRef]
- Forman, G.; Scholz, M. Apples-to-Apples in Cross-Validation Studies: Pitfalls in Classifier Performance Measurement. ACM SIGKDD Explor. Newsl. 2010, 12, 49–57. [Google Scholar] [CrossRef]
- Santos, M.S.; Soares, J.P.; Abreu, P.H.; Araujo, H.; Santos, J. Cross-Validation for Imbalanced Datasets: Avoiding Overoptimistic and Overfitting Approaches. IEEE Comput. Intell. Mag. 2018, 13, 59–76. [Google Scholar] [CrossRef]
- Neunhoeffer, M.; Sternberg, S. How Cross-Validation Can Go Wrong and What to Do About It. Polit. Anal. 2019, 27, 101–106. [Google Scholar] [CrossRef]
- Gnip, P.; Kanász, R.; Zoričak, M.; Drotár, P. An Experimental Survey of Imbalanced Learning Algorithms for Bankruptcy Prediction. Artif. Intell. Rev. 2025, 58, 104. [Google Scholar] [CrossRef]
- Bates, D.; Mächler, M.; Bolker, B.; Walker, S. Fitting Linear Mixed-Effects Models Using lme4. J. Stat. Softw. 2015, 67, 1–48. [Google Scholar] [CrossRef]


Disclaimer/Publisher’s Note: The statements, opinions and data contained in all publications are solely those of the individual author(s) and contributor(s) and not of MDPI and/or the editor(s). MDPI and/or the editor(s) disclaim responsibility for any injury to people or property resulting from any ideas, methods, instructions or products referred to in the content. |
© 2025 by the authors. Licensee MDPI, Basel, Switzerland. This article is an open access article distributed under the terms and conditions of the Creative Commons Attribution (CC BY) license (https://creativecommons.org/licenses/by/4.0/).