Abstract
Universal Health Coverage (UHC) remains a core Sustainable Development Goal challenge for Arab nations, with structural inequalities and conflict ongoing in threatening equal access to health. Although literature concurs on the presence of a relationship between UHC and financial inclusion, contextual mechanisms underpinning this relationship remain poorly understood. This study offers an integrated Explainable AI (XAI)–Econometric methodology to unveil how financial inclusion—through digital as well as physical channels for services—drives UHC progress in 17 Arab nations (2011–2022). With the use of Feasible Generalized Least Squares (FGLS), Panel-Corrected Standard Errors (PCSE), and Random Forest regression with SHAP (SHapley Additive exPlanations) values, we estimate both average causal and heterogeneous contextual effects. The combined model increases predictive strength by 18% over conventional econometric baselines (R2 = 0.83), while the SHAP results identified top predicators. The findings suggest that ATM density and electricity access remain the overriding drivers of UHC whereas digital financial services play a role only with the complement of strong public health expenditures. The diagnostic result allows policymakers to designate country-specific challenges and prioritize joint investments in infrastructure and inclusive finance. While data constraints in conflict settings need cautious interpretation, the proposed XAI–econometric strategy supplies a replicable methodology template for contextualized SDG diagnostics.
1. Introduction
1.1. General Introduction
Health is one of the most fundamental aspects of human life, a prime determinant of individual well-being, economic function, and collective societal development [1]. Despite its universal importance, equitable access to good-quality healthcare remains a chronic dilemma for health systems globally, with particularly glaring inequities apparent in low- and middle-income countries. In the Arab world alone, disparities in access to healthcare assume especially stark expressions, where conflict-stricken nations such as Yemen and Syria contend with the most extreme systemic challenges stemming from ruined health infrastructure, perennially scarce fiscal means, and perpetual political instability [2]. There are numerous examples: Syria, for instance, now allocates less than 5% of GDP to health expenditure—a proportion well below global averages—while Yemen’s entire healthcare infrastructure has essentially collapsed under the twin pressures of persistent conflict and catastrophic funding shortfalls [3]. Even in comparatively more stable regional settings like Egypt and Jordan, recent estimates suggest that approximately half of national populations continue to lack stable access to basic health services, a stark statistic that underscores the pressing need for innovative policy solutions to bridge these systemic divides [4].
The emerging sector of financial inclusion, and particularly through new digital financial service platforms (fintech), has increasingly been recognized as having tremendous potential to solve these healthcare access challenges [5,6]. Contemporary fintech innovations—ranging from mobile payment platforms to blockchain-based health financing platforms and microinsurance schemes—have demonstrated considerable potential in initial applications by simultaneously reducing barriers of out-of-pocket health expenditure while enhancing transactional transparency across healthcare systems [7]. Examples at the regional level span from Egypt’s rapidly expanding mobile health payment ecosystems to Jordan’s inaugural blockchain-based health financing platforms, both of which have seen concrete success in streamlining healthcare payments while enhancing financial inclusion metrics [8]. However, the adoption and measurable impact of such fintech solutions across the Arab region remain extremely uneven, with Gulf Cooperation Council (GCC) member states demonstrating relatively mature fintech adoption trajectories and low-income and conflict-ridden regional counterparts experiencing extreme lag effects as a result of underdeveloped digital infrastructure and chronically low connectivity rates [9].
Despite growing recognition of fintech’s potential, a significant research gap persists regarding the systematic impact of financial inclusion on UHC in the diverse contexts of the Arab world [10,11]. Crucially, existing studies have predominantly relied on traditional linear econometric models [12]. While valuable for establishing correlations, these methods are ill-equipped to capture the complex, non-linear relationships, and interaction effects between financial, infrastructural, and health system variables that likely characterize this relationship. This study bridges this gap by employing an integrated analytical framework that combines robust econometrics for causal inference with machine learning to uncover these hidden patterns, providing a more comprehensive evidence base for policy. This knowledge gap assumes a specific urgency given the region’s particular challenges, ranging from perennially high rates of unbanked populations to glaring disparities in per capita healthcare expenditure, to compounding crises that range from global pandemics to natural disasters [13]. The COVID-19 pandemic’s regional devastation coupled with the 2023 Turkey-Syria earthquake’s disaster have provided heart-wrenching case studies in the manner in which compromised health and financial systems can exacerbate human suffering during crises [14,15].
This study employs a multi-method analytical framework to explore systematically correlations between healthcare access indicators and financial inclusion metrics across 17 Arab countries during the years 2011–2022. The investigation centers on three principal study questions: First, to what extent do traditional and digital financial inclusion indicators significantly drive progress in UHC across Arab countries? Second, what are the most potent predictors of UHC—including financial, infrastructural, and economic factors—and what complex, non-linear relationships exist among them, as revealed by a machine learning approach? And third, what integrated policy strategies, informed by both causal inference and predictive analytics, can most effectively leverage financial inclusion to accelerate progress toward SDG 3.8 in the region?
By addressing these research priorities, the actual study aims to make a significant contribution to emerging research at the intersection of health policy and financial technology, with applied policy briefs for three stakeholder groups: national policymakers seeking to implement SDG-compliant health financing reforms, healthcare providers operating in resource-poor contexts, and fintech developers looking to create contextually appropriate solutions for Arab markets. The study’s mixed-methods design, which combines cutting-edge econometric approaches with machine learning, seeks to establish a new benchmark of evidence on the dynamics of such relationships in subnational contexts.
1.2. Literature Review
1.2.1. Theoretical Literature Review
Health is also a central aspect of the Sustainable Development Goals (SDGs), aiming to achieve a healthy and secure life for all without resulting in financial expenses. Universal Health Coverage (UHC) is now a fundamental tool in building financial services that enhance the accessibility of healthcare, particularly for the poor, in order to attain financial security and better health status [4].
The intersection of healthcare access and financial inclusion must be understood through integrated economic and biosocial lenses. The biosocial framework proposed by Kinsey et al. [16] illuminates how systemic and environmental factors create and compound health disparities, a dynamic that is critically relevant to the Middle East and North Africa (MENA) region. This interplay is evident in maternal and child health, where Nikoloski et al. [17] demonstrate that strengthening primary healthcare systems—a key component of which is financial access—is pivotal for improving equitable coverage of essential services. Their research underscores that financial barriers, often exacerbated by gender and wealth-based inequities, can direct poorer populations toward public facilities and limit timely care, thereby reinforcing the very biosocial vulnerabilities outlined by Kinsey and colleagues.
The Health Belief Model provides a useful framework for investigating these disparities. Sallam et al.’s [18] study on COVID-19 vaccine hesitancy in Jordan, Kuwait, and other Arab countries revealed that structural access, while necessary, is insufficient; significant barriers were rooted in health beliefs, including misinformation and conspiracy theories, rather than financial or logistical constraints. This underscores that providing fintech or digital payment solutions, which are crucial for financial inclusion as tracked in the Global Findex Database [7], does not automatically translate into health behavior change. A comprehensive approach must therefore address these deeply held beliefs and low health literacy in parallel with improving financial access, aligning with the transtheoretical model’s emphasis on the multifaceted nature of staged behavior change.
1.2.2. Financial Inclusion in the Arab Region
New studies indicate stark variations in the impacts of financial inclusion on various groups. Islam’s [1] UAE case study found that although 78% of Emirati families could access emergency health funds through digital platforms, migrant worker households who represent 85% of society remained cut off due to stringent identification criteria. This “inclusion paradox” even persists in GCC nations with extremely advanced fintech ecosystems [9].
For instance, Elouaourti and Ibourk [8] emphasize persistent structural disparities in digital financial inclusion across MENA economies, shaping citizens’ ability to afford and access health-related services Niankara et al. [11] demonstrate that financial inclusion significantly drives the adoption of digital payment solutions across Gulf Cooperation Council (GCC) economies, highlighting how inclusive financial ecosystems can stimulate broader participation in health and social services. Lattof et al. [12], while focusing on the mesoeconomics of abortion, contribute relevant evidence since access to reproductive and maternal-health services—including safe abortion—is one of the WHO’s 14 tracer indicators within the Universal Health Coverage framework, thereby representing a crucial dimension of service accessibility.
Emerging technologies offer new avenues for advancing both financial and health literacy. Cannistrà et al. [19] demonstrated that interactive, game-based financial education programs significantly improved users’ budgeting and decision-making skills across multiple countries, underscoring the potential of digital learning tools to promote inclusive capability development. Building on this evidence, such approaches could be adapted to integrate health-related financial training—for example, encouraging preventive-care spending among vulnerable families. Nevertheless, Harris and McDade’s [16] biosocial framework reminds us that sociocultural and infrastructural differences must be considered: digital education strategies that thrive in urbanized contexts like Dubai may fail in rural Yemen, where smartphone access among women remains limited to about 34% [20].
1.2.3. Fintech and Healthcare Access
Existing studies emphasize the key role of financial inclusion in combating healthcare inequalities. Al-Hanawi et al. [21] affirm that digital financial inclusion significantly deterred emergency medical financing difficulty in Saudi Arabia, having a coefficient estimate of −0.262, with its value in alleviating finance-related burdens of care. Additionally, digital payments infrastructure in India improved levels of financial inclusion among small farm owners residing in rural areas through enabling the accessing of adequate levels of care.
Financial inclusion improves access to health care through three principal mechanisms. First, by expanding access to credit and savings instruments, it mitigates catastrophic health expenditure and enhances financial protection. Second, the availability of digital and physical financial channels—such as ATMs, agents, and mobile payments—reduces transactional frictions, facilitating prepayment and insurance enrollment. Third, digital transaction systems strengthen public health system efficiency and accountability by enabling transparent, traceable fund flows. Collectively, these mechanisms operationalize financial inclusion as a foundational determinant of UHC rather than a mere correlate of income.
However, fintech use in the health sector in Sub-Saharan Africa is limited by digital literacy disparities and infrastructure shortcomings. Mobile money has improved inclusion but requires greater digital skills for long-term use in healthcare services [22]. Cyberspace threat problems in electronic financial services also induce risks, especially in rural regions of the regions where fraud risk awareness tends to be low [23].
Synthesizing insights from both economic and biosocial theories, we propose a conceptual framework that links financial inclusion to UHC through three primary transmission channels: (1) financial protection, whereby expanded access to formal savings, credit, and insurance reduces catastrophic health expenditure; (2) service accessibility, where digital and physical financial infrastructure (e.g., ATMs, mobile banking agents) lowers transaction frictions and facilitates prepayment for care; and (3) system efficiency, through which transparent digital transactions improve accountability and resource targeting. These channels are moderated by infrastructural enablers—notably electricity access and internet penetration—that determine whether financial technologies can function effectively.
2. Materials and Methods
2.1. Data Collection
The analysis draws on a balanced panel dataset covering 17 Arab countries between 2011 and 2022. Core indicators were extracted from the World Bank’s Global Findex Database (financial inclusion), the World Development Indicators (macroeconomic and infrastructure variables), and the World Health Organization’s Universal Health Coverage (UHC) Service Coverage Index. The sample includes 17 Arab countries: Bahrain, Djibouti, Egypt, Iraq, Jordan, Kuwait, Lebanon, Libya, Morocco, Oman, Qatar, Saudi Arabia, Sudan, Somalia, Syria, Tunisia, and Yemen. The UHC Service Coverage Index aggregates 14 tracer indicators spanning reproductive, maternal, infectious, and non-communicable health services, together with workforce and system-capacity dimensions, scaled 0–100. Missing data were handled using forward-carry imputation for short gaps (≤2 years) and cross-validation against regional averages [24]. All financial inclusion variables were standardized (z-scores) prior to inclusion in PCA and Random Forest models to ensure comparability and numerical stability. The dataset remains balanced across the study period, facilitating consistent panel estimation.
Financial inclusion is measured using a number of indicators, emphasized in previous studies [21,24]: Mobile services access by adults 35–59 (MOB), internet access (INT) by adults aged 35–59, proportion of adults with active accounts (ACC), proportion of adults who have borrowed from a bank or used a credit card (BOR), number of deposit accounts per 1000 adults (DEP), commercial bank branches density and ATMs per 100,000 adults (ATM), number of debit cards per 1000 adults (DEB), and number of payment service agents per 100,000 adults (AGE). UHC is measured by the UHC service coverage index, which tracks coverage of major health services. Control variables such as access to electricity (ELE), general government final consumption expenditure (EXP), GDP growth (GDP), and inflation (INFL) are controlled in the estimates to guarantee credible results. General government expenditure (% of GDP) was retained as a control variable to reflect the broader fiscal environment, recognizing its strong positive correlation with health-sector expenditure. In macroeconomic terms, higher overall public expenditure typically translates into greater health investment, ensuring that the control variable captures fiscal-commitment effects without distorting the core relationship between financial inclusion and UHC outcomes.
The focus on the 35–59 age cohort for key indicators is based on the rationale that this group typically represents a nation’s core economically active population, who are primary decision-makers for household finances and healthcare expenditures, thus providing a critical lens through which to analyze the finance-health nexus.
2.2. Econometric Models
This research examines the relationship between financial inclusion and Universal Health Coverage (UHC) in 17 Arab countries (2011–2022) through an integrated analytical framework combining machine learning and econometric techniques. The study employs Random Forest (RF) regression as its primary machine learning approach, complemented by traditional econometric methods to ensure robust and interpretable results.
2.2.1. Panel Models (FGLS & PCSE)
We implemented traditional econometric techniques to address specific challenges in panel data analysis. The Feasible Generalized Least Squares model (FGLS) provides parametric estimates that control for heteroscedasticity and cross-sectional dependence, while the Panel-Corrected Standard Errors approach (PCSE) offers robust inference against autocorrelation [25]. These methods validate and complement the patterns identified by the Random Forest algorithm (RF).
To ensure robust and interpretable results, the analysis employs a tripartite econometric strategy complemented by machine learning. The Feasible Generalized Least Squares model (FGLS) provides efficient estimates by controlling for heteroscedasticity and cross-sectional dependence, while the Panel-Corrected Standard Errors approach (PCSE) offers robust inference against autocorrelation [26].
2.2.2. Dynamic Panel Models (GMM)
The econometric analysis is complemented by Principal Component Analysis (PCA) to distill the multifaceted financial inclusion indicators into core latent components, mitigating multicollinearity and revealing underlying structural drivers [4,5]. This econometric triad is then integrated with the Random Forest algorithm, which captures complex, non-linear relationships and interaction effects without restrictive parametric assumptions, creating a comprehensive analytical framework.
In order to study the individual effect of financial inclusion and other determinants on UHC, a mathematical model is defined:
The econometric specification thus ensures both efficiency and unbiasedness in estimating the structural determinants of UHC. Goodness-of-fit metrics (within-R2 and Wald χ2) are reported to facilitate comparison with the machine-learning models.
2.3. Machine Learning Models
2.3.1. Random Forest (RF)
The Random Forest algorithm served as the foundation of our analysis, providing a non-parametric method to capture complex relationships between financial inclusion indicators and UHC outcomes. This ensemble learning technique constructs multiple decision trees through bootstrap aggregation, offering inherent advantages in handling non-linear effects and variable interactions without restrictive parametric assumptions. The implementation uses standard parameters including 500 regression trees and consideration of 3 variables at each split. All financial inclusion indicators and control variables are incorporated in their original forms, allowing the algorithm to determine optimal transformations through its recursive partitioning process.
2.3.2. Explainable AI (XAI) for Causal Pathway Analysis
While the Random Forest model has robust predictive power and global variable importance, its ensemble character can render it a “black box,” with little interpretability to guide policy design. To ensure that this otherwise inherent disadvantage is overcome and to bring actionable insights into contextual determinants of UHC, this article uses a post hoc Explainable AI (XAI) technique known as SHAP (SHapley Additive exPlanations) [27].
SHAP values have their foundation in cooperative game theory and capture the marginal contribution of each predictor variable to the ultimate prediction for each and every observation (i.e., country-year) in our data set. The approach yields three valuable contributions to our analysis:
- Heterogeneous Effect Detection: It is more sensitive than average effects to report how the relative contribution of a variable (e.g., mobile banking) varies in alternative country contexts (e.g., in high-infrastructure versus low-infrastructure settings).
- Visualization of Non-Linear Pathway: SHAP dependence plots can visually reveal the precise, non-linear relationship between a feature and the UHC index, precisely locating significant thresholds and points of saturation.
- Quantification of Interaction Effects: It can automatically identify and measure most prominent interaction effects between variables, revealing the synergistic or conditional relations that drive UHC outcomes.
SHAP analysis was used using the TreeExplainer method to the trained Random Forest model and got a single score of effect direction and feature importance for each data point and transformed our prediction model to a diagnostic one.
2.4. Robustness Tests
In order to ensure confidence in the robustness of the results, several diagnostic tests were conducted to address potential issues like heteroscedasticity, autocorrelation, and multicollinearity [6]. The tests validate the integrity of the econometric models used in the study according to best practice in financial inclusion and health economics [7,24].
2.4.1. Multicollinearity (VIF & PCA)
To check for multicollinearity between the explanatory variables, a Variance Inflation Factor (VIF) test was conducted. VIF values of all variables were below the threshold value of 10 and had an average value of VIF as 2.26, indicating that multicollinearity is not a serious issue in the model [5,6]. This is particularly important for the validity of regression results since high multicollinearity can produce biased and inconsistent estimates [11]. The small values of VIF confirm that explanatory variables are not correlated with one another, thus making the results strong [6].
Principal Component Analysis (PCA) was applied to convert the indicators of financial inclusion to lower-dimensional space to eliminate any possible multicollinearity. PCA picked three principal components—Financial Services (PC1), Physical Structures (PC2), and Agents and Card Usage (PC3)—which collectively retain the majority of the data variance [4]. Principal components were varimax-rotated to enhance interpretability of factor loadings. The PCA-derived components (PC1–PC3) were entered jointly with control variables in the dynamic GMM model to capture both structural financial-inclusion effects and contextual determinants [5].
2.4.2. Heteroscedasticity and Autocorrelation
The Breusch-Pagan test was conducted to determine heteroscedasticity in the residuals. The test confirmed the presence of heteroscedasticity, which necessitated the use of FGLS and PCSE models, which are robust to heteroscedasticity [10,28]. The Wooldridge test for autocorrelation in panel data was also conducted, and the results confirmed the presence of autocorrelation. This further justified the use of FGLS and GMMs, which account for autocorrelation in the error terms [26]. The tests ensure that the parameter estimates are unbiased and efficient even in the presence of heteroscedasticity and autocorrelation.
3. Results
3.1. Descriptive Statistics
Figure 1 illustrates the UHC trends for each country from 2011 to 2022. The column representation highlights the cross-national disparities and the gradual convergence observed in several middle-expenditure economies. This descriptive view provides the empirical foundation for the econometric analysis presented in the subsequent section.
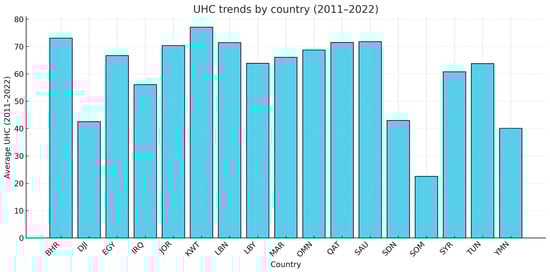
Figure 1.
Universal Health Coverage (UHC) Trends by Country, 2011−2022. Average Universal Health Coverage (UHC) levels across the 17 analyzed countries from 2011 to 2022. The column representation highlights cross-country differences and convergence patterns, showing that several middle-expenditure economies exhibit steady improvements over the observed period.
Table 1 presents the descriptive statistics for all variables. The dependent variable, the UHC service coverage index, has a mean of 59.53 with a standard deviation of 14.93, indicating substantial variation in healthcare access across the 17 Arab countries from 2011 to 2022. The range (17.17 to 78.00) underscores the stark disparity between high-income Gulf states and conflict-affected nations. Financial inclusion indicators also show considerable variation. Mobile phone access (MOB) is near-universal (mean 92.77%), while internet access (INT) is lower (mean 62.24%). The density of ATMs (ATM) and the proportion of adults with active accounts (ACC) exhibit uneven distribution, with means of 26.52 per 100,000 adults and 40.08%, respectively. Among control variables, access to electricity (ELE) averages 87.31%, yet a minimum of 38.31% highlights severe deficits in some areas. Government consumption expenditure (EXP) averages 17.21% of GDP.

Table 1.
Descriptive Statistics.
3.2. Correlation Matrix and VIF Values
The correlation matrix (Table 2) reveals a very strong positive association between UHC and access to electricity (ELE, 0.877). Financial inclusion indicators such as ATM density (0.534) and active accounts (ACC, 0.209) show moderate positive correlations with UHC. The Variance Inflation Factor (VIF) test results indicate that multicollinearity is not a concern, with a mean VIF of 2.26, well below the common threshold of 10.
Table 2.
Pearson’s correlation matrix.
3.3. Traditional Econometric Models
The Feasible Generalized Least Squares (FGLS) and Panel-Corrected Standard Errors (PCSE) models demonstrate remarkable consistency in identifying the core drivers of UHC. Principal Component Analysis (PCA) reduced the financial inclusion indicators to three components (Table 3): PC1 (Digital Financial Services), PC2 (Physical Infrastructure), and PC3 (Agents and Card Usage).
Table 3.
PCA components with the highest contributions and their compositions.
As shown in Table 4, panel econometric models showed a significant positive effect for ATM density (FGLS: β = 0.1413, p < 0.01; PCSE: β = 0.1162, p < 0.01) and access to electricity (FGLS: β = 0.5856, p < 0.01; PCSE: β = 0.6818, p < 0.01), underscoring the fundamental role of physical infrastructure. Government expenditure (EXP) also emerges as a strong, consistent predictor across both models (FGLS: β = 0.3837, p < 0.01; PCSE: β = 0.5498, p < 0.01). The PCSE model additionally identifies bank branch density (BRN, β = 0.2580, p < 0.01) as a significant factor. The convergence of FGLS and PCSE results provides high confidence in the robustness of these average causal effects. The Generalized Method of Moments (GMM) model using the resulting components showed that PC1 (β = 1.484, p < 0.01) and PC2 (β = 0.864, p < 0.1) had a significant positive impact on UHC, while PC3 had a significant negative coefficient (β = −0.361, p < 0.05). The Arellano-Bond tests confirmed the validity of the instruments (AR(1) p = 0.334; AR(2) p = 0.514).
Table 4.
Impact of financial inclusion and control indicators on universal health coverage in Arab countries for the period (2011–2022) FGLS, PCSE and 2-steps GMM methods. Dependent variable: Universal Healthcare Coverage.
3.4. Machine Learning Model
The Random Forest model was implemented using Stata’s (version 17) rforest package (500 trees, mtry = 3, minimum node size = 5). Model tuning followed a 10-fold cross-validation procedure minimizing out-of-bag (OOB) error to prevent overfitting. The model’s out-of-sample R2 reached 0.83, representing an 18% improvement over baseline econometric fits. Variable importance was computed using permutation importance, standardized against the model’s baseline mean-squared error (MSE). The combination of variable rankings and SHAP values allowed simultaneous assessment of feature relevance and marginal effect direction, providing both predictive and explanatory insights into the UHC–financial inclusion nexus.
The Random Forest permutation importance analysis revealed distinctive patterns in UHC drivers across Arab nations (Table 5). Electricity access (ELE) and ATM density emerged as the dominant predictors with 25.03% and 20.57% importance, respectively, highlighting the critical role of physical infrastructure. Digital financial indicators showed varied impacts, with internet access (INT, 4.51%) and active accounts (ACC, 7.92%) demonstrating moderate predictive power, while mobile banking (MOB, 2.26%) showed more limited standalone effects. The negative permutation importance of payment agents (AGE, −6.92%) arises because this feature seemed to introduce redundant information highly correlated with ATM density (r = 0.77). When permuted, the model benefits from noise reduction, yielding improved accuracy. Such effects are consistent with multicollinearity-induced variance inflation, even in ensemble methods tolerant to correlated features.
Table 5.
Random Forest Permutation importance values.
Post hoc SHAP analysis provided nuanced insights into heterogeneous effects across contexts. The SHAP summary plot (Figure 2) identifies electricity access as the most influential variable, with its contribution to predicted UHC values. The marginal benefit of electrification rises steeply up to near-universal coverage (≈100%), indicating sustained though diminishing returns rather than a strict saturation threshold.
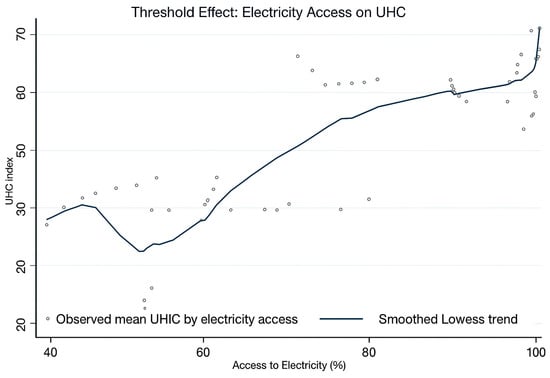
Figure 2.
Threshold Effect of Electricity Access on UHC.
Furthermore, Figure 3 reveals important conditional relationships in healthcare system effectiveness. The analysis demonstrates that higher health expenditure levels in Saudi Arabia are associated with accelerated UHC progress, with the most substantial improvements observed in high-spending environments compared to medium and low-spending contexts during 2011–2021.
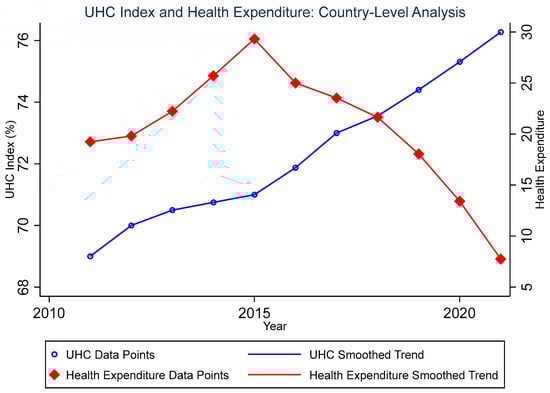
Figure 3.
Relationship between Universal Health Coverage (UHC) Index and health expenditure in Saudi Arabia from 2011 to 2021. The scatter points represent annual observations, while the smoothed trend lines illustrate the overall temporal patterns. The UHC Index (left axis, blue) measures population coverage of essential health services on a scale of 0–100%, while health expenditure (right axis, red) reflects total health spending. The parallel upward trends suggest a positive association between health financing and service coverage over the study period.
To provide a more integrated perspective, Figure 4 plots the co-evolution of UHC and financial inclusion—proxied by the mobility index (MOB)—for three expenditure tiers (low, medium, and high). The solid lines represent UHC trajectories (left axis), while the dashed lines denote MOB trends (right axis).
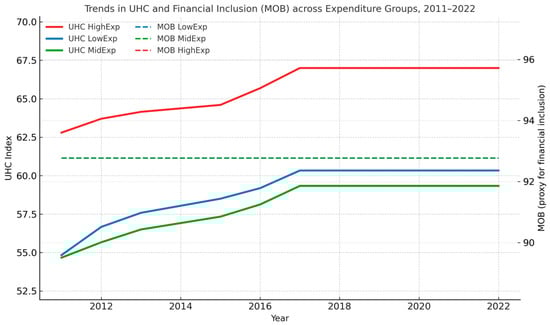
Figure 4.
Trends in UHC and Financial Inclusion (MOB) across Expenditure Groups, 2011–2022. Dual-axis plot illustrating the co-evolution of Universal Health Coverage (UHC, solid lines; left axis) and the financial inclusion proxy (MOB, dashed lines; right axis) for low-, middle-, and high-expenditure country groups.
The figure reveals that higher-expenditure countries not only achieve faster UHC improvements but also sustain stronger upward trajectories in financial inclusion. In contrast, low-expenditure countries exhibit flatter curves in both indicators, suggesting that limited mobility and financial participation constrain health system inclusiveness. These visual patterns reinforce the regression results, which indicate that expenditure efficiency and inclusive financial environments jointly drive progress toward universal coverage.
The negative importance scores for payment agents (AGE: −6.92%) and borrowing (BOR: −0.31%) indicate these variables contain redundant information already captured by other predictors in the ensemble. This suggests that in the Arab regional context, the predictive information in these financial access measures overlaps substantially with other infrastructure and digital finance variables.
Financial inclusion indicators show a clear hierarchy: physical access points (ATM: 20.57%, ELE: 25.03%) dominate predictions, while digital and account-based services show more moderate effects. The substantial importance of inflation (INFL: 8.62%) underscores the sensitivity of healthcare access to macroeconomic stability in the region.
Model validation (R2 = 0.83) confirms that infrastructure variables collectively drive UHC predictions in the Arab world, with the combination of electricity, financial access points, and digital connectivity outweighing the effects of traditional economic indicators and some financial service metrics.
4. Discussion
4.1. Interpretation of Key Findings and Novel Contributions
The integrated framework yields strong convergence between econometric and machine-learning results, affirming that physical infrastructure—particularly electricity and ATM density—forms the foundational layer upon which digital financial inclusion exerts its influence. While government expenditure exerts a consistently positive causal effect, its uniform distribution across countries limits its contribution to predictive differentiation—that is, its ability to explain variance in UHC outcomes. In contrast, ATM density captures tangible disparities in financial-service reach, acting as a proxy for infrastructural readiness that enables health payments and insurance transactions. In lower-digital or rural settings, such physical infrastructure directly expands access to formal health financing and essential services. This asymmetry highlights a sequencing logic for policy: physical and fiscal infrastructure must precede digital expansion to maximize health outcomes. By moving beyond correlation to diagnose context-specific thresholds, the study introduces an operational roadmap for policy targeting.
The paramount importance of electricity access (ELE) is unequivocally demonstrated across the methodological spectrum. It is a dominant predictor in the Random Forest analysis (25.03% permutation importance) and shows strongly significant coefficients in both FGLS (β = 0.5856, p < 0.01) and PCSE (β = 0.6818, p < 0.01) models. Crucially, the SHAP analysis added a layer of diagnostic precision unreachable by traditional methods, revealing a clear threshold effect where benefits plateau above 85% electrification.
Similarly, the role of physical financial infrastructure is consistently validated. ATM density is a top predictor in the Random Forest (20.57% importance) and is strongly significant in both econometric models. The PCA further corroborates this by forming a “Physical Infrastructure” component (PC2), which includes ATM and bank branch density and itself shows a significant positive impact on UHC (β = 0.864, p < 0.1) in the GMM model. Interestingly, PC3 (agents and card use) exhibits a statistically significant negative association with UHC. This pattern may reflect an urban bias where fintech deployment concentrates in already-served populations, thereby widening rural access gaps. Alternatively, excessive reliance on card-based systems in low-infrastructure contexts seems to impose new transaction frictions, offsetting inclusion gains. Recognizing this asymmetry reinforces the importance of sequencing digital expansion after foundational infrastructure is secured.
However, the framework also reveals critical divergences that highlight the value of a multi-method approach. For instance, while government expenditure (EXP) is a strongly significant driver in the FGLS and PCSE models, it has modest predictive importance (1.12%) in the Random Forest. This suggests that while public spending is a crucial average causal driver, its predictive power for differentiating between country-year outcomes is low, as it may be a necessary but insufficient condition, or its effect may be more uniform across the region. Conversely, the PCA revealed that the latent dimension of “Digital Financial Services” (PC1) is a significant driver, a finding that was obscured when examining individual digital indicators like mobile banking (MOB) in isolation in the linear models.
This synergy between public finance and private fintech innovation represents a significant nuance for policy design, one that only becomes apparent by layering the causal, average-effect lens of econometrics with the predictive, pattern-recognition power of machine learning and the dimensionality reduction in PCA.
4.2. Theoretical and Practical Implications
This study demonstrates the profound value of integrating XAI with traditional econometrics in development economics. While econometrics establishes causality on average, XAI opens the “black box” to reveal for whom and under what conditions these causal relationships hold. This allows for the construction of a diagnostic typology for policymakers (Table 6), which directly translates our complex findings into an actionable framework.
Table 6.
A Diagnostic Typology for UHC-Financial Inclusion Policy in the Arab World.
Practically, this typology provides a clear, evidence-based guide for resource allocation. It argues that the question is no longer if financial inclusion matters, but which type of financial inclusion intervention is most appropriate for a given national context. For instance, recommending mobile banking solutions to a country in the “Infrastructure-Constrained” cluster is likely an inefficient use of resources until the electricity threshold is met.
5. Conclusions
This study demonstrates that the relationship between financial inclusion and UHC in the Arab world is not monolithic but is critically contingent on infrastructural and fiscal context. By integrating XAI with robust econometrics, we move beyond average effects to provide a diagnostic tool for policymakers. The findings advocate a non-negotiable, phased investment strategy: first, achieve minimum electrification and fiscal thresholds; second, expand physical financial access points like ATMs; and only then, third, scale complex digital inclusion programs. This sequential approach ensures that financial innovation is built on a foundation of readiness, maximizing its potential to drive equitable and sustainable health coverage. Future research should incorporate granular governance and educational data into this framework and employ temporal forecasting to track progress towards the 2030 SDG agenda.
Author Contributions
Conceptualization, M.A. and M.A.D.; Methodology, M.A. and H.M.N.; Software, H.M.N.; Validation, H.M.N., M.A. and M.A.D.; Formal Analysis, M.A. and H.M.N.; Investigation, M.A.; Resources, M.A.D.; Data Curation, M.A. and H.M.N.; Writing—Original Draft Preparation, M.A.; Writing—Review and Editing, M.A. and M.A.D.; Visualization, M.A. and H.M.N.; Supervision, M.A.D.; Project Administration, M.A. All authors have read and agreed to the published version of the manuscript.
Funding
This research received no external funding.
Data Availability Statement
The data supporting the findings of this study are publicly available from the World Bank and World Health Organization repositories. The specific datasets and indicators used are detailed within the manuscript.
Conflicts of Interest
The authors declare no conflicts of interest.
References
- Islam, M.R.; Gharaibeh, F.A. Good Health and Well-Being in Asian Arab Countries: Some Critical Observations. Int. J. Community Soc. Dev. 2023, 5, 413–434. [Google Scholar] [CrossRef]
- Bertone, M.P.; Jowett, M.; Witter, S. Health Financing in Fragile and Conflict-Affected Settings: How to Account for the “Cost of Doing Business”. Health Policy Plan. 2019, 34 (Suppl. S2), ii1–ii14. [Google Scholar] [CrossRef]
- Dafallah, A.; Elmahi, O.K.; Ibrahim, M.E.; Elsheikh, R.E.; Blanchet, K. Destruction, Disruption and Disaster: Sudan’s Health System amidst Armed Conflict. Confl. Health 2023, 17, 43. [Google Scholar] [CrossRef] [PubMed]
- Al-Hanawi, M.K.; Chirwa, G.C.; Kamninga, T.M.; Manja, L.P. Effects of Financial Inclusion on Access to Emergency Funds for Healthcare in Saudi Arabia. J. Multidiscip. Healthc. 2020, 13, 1157–1167. [Google Scholar] [CrossRef] [PubMed]
- Girma, A.G.; Huseynov, F. The Causal Relationship between FinTech, Financial Inclusion, and Income Inequality in African Economies. J. Risk Financ. Manag. 2024, 17, 2. [Google Scholar] [CrossRef]
- Alomari, M.; Aladi, I. Financial Inclusion and Market-Based Performance: Empirical Evidence from Syrian Banks. J. Financ. Econ. Policy 2024, 16, 60–79. [Google Scholar] [CrossRef]
- Demirgüç-Kunt, A.; Klapper, L.; Singer, D.; Ansar, S. The Global Findex Database 2021: Financial Inclusion, Digital Payments, and Resilience in the Age of COVID-19; The World Bank: Washington, DC, USA, 2022; p. 131. Available online: https://documents1.worldbank.org/curated/en/099818107072234182/pdf/IDU06a834fe908933040670a6560f44e3f4d35b7.pdf (accessed on 1 March 2025).
- Elouaourti, Z.; Ibourk, A. Financial Technologies for All MENA Citizens: Tackling Barriers and Promoting Inclusion. Reg. Sci. Policy Pract. 2024, 16, 100019. [Google Scholar] [CrossRef]
- Akmal, S.; Talha, M.; Faisal, S.M.; Ahmad, M.; Khan, A.K. Perceptions about FinTech: New Evidence from the Middle East. Cogent Bus. Manag. 2023, 10, 2217583. [Google Scholar] [CrossRef]
- Jaca, A.; Malinga, T.; Iwu-Jaja, C.J.; Nnaji, C.A.; Okeibunor, J.C.; Kamuya, D.; Wiysonge, C.S. Strengthening the Health System as a Strategy to Achieving a Universal Health Coverage in Underprivileged Communities in Africa: A Scoping Review. Int. J. Environ. Res. Public Health 2022, 19, 587. [Google Scholar] [CrossRef]
- Niankara, I. The Impact of Financial Inclusion on Digital Payment Solution Uptake within the Gulf Cooperation Council Economies. Int. J. Innov. Stud. 2023, 7, 1–17. [Google Scholar] [CrossRef]
- Lattof, S.R.; Coast, E.; Rodgers, Y.; Brittany, M.; Poss, C. The Mesoeconomics of Abortion: A Scoping Review and Analysis of the Economic Effects of Abortion on Health Systems. PLoS ONE 2020, 15, e0237227. [Google Scholar] [CrossRef]
- Berguiga, I.; Adair, P. Determinants of Youth Financial Inclusion in MENA Countries: Account Holding versus Fintech Use. In Proceedings of the 2023 IEEE International Conference on Advances in Data-Driven Analytics and Intelligent Systems (ADACIS), Marrakesh, Morocco, 2–4 November 2023; pp. 1–6. [Google Scholar] [CrossRef]
- AlQutob, R.; Moonesar, I.A.; Tarawneh, M.R.; Al Nsour, M.; Khader, Y. Public Health Strategies for the Gradual Lifting of the Public Sector Lockdown in Jordan and the United Arab Emirates during the COVID-19 Crisis. JMIR Public Health Surveill. 2020, 6, e20478. [Google Scholar] [CrossRef]
- Gupta, S.; Agrawal, A. Analytical Study of Fintech in India: Pre & Post Pandemic Covid-19. Indian J. Econ. Bus. 2021, 20, 33–71. Available online: http://www.ashwinanokha.com/IJEB.php (accessed on 1 March 2025).
- Kinsey, D.; Paul, C.P.; Taylor, D.; Caricchio, R.; Kulathinal, R.J.; Hayes-Conroy, A. The Whole Lupus: Articulating Biosocial Interplay in Systemic Lupus Erythematosus Epidemiology and Population Disparities. Health Place 2018, 51, 205–213. [Google Scholar] [CrossRef] [PubMed]
- Nikoloski, Z.; Wannis, H.; Wannis, H.; Menchini, L.; Chatterjee, A. Primary Healthcare and Child and Maternal Health in the Middle East and North Africa (MENA): A Retrospective Analysis of 29 National Survey Data from 13 Countries. SSM Popul. Health 2021, 14, 100727. [Google Scholar] [CrossRef] [PubMed]
- Sallam, M.; Dababseh, D.; Eid, H.; Al-Mahzoum, K.; Al-Haidar, A.; Taim, D.; Yaseen, A.; Ababneh, N.A.; Bakri, F.G.; Mahafzah, A. High Rates of COVID-19 Vaccine Hesitancy and Its Association with Conspiracy Beliefs: A Study in Jordan and Kuwait among Other Arab Countries. Vaccines 2021, 9, 42. [Google Scholar] [CrossRef]
- Cannistrà, M.; De Beckker, K.; Agasisti, T.; Amagir, A.; Põder, K.; Vartiak, L.; De Witte, K. The Impact of an Online Game-Based Financial Education Course: Multi-Country Experimental Evidence. J. Comp. Econ. 2024, 52, 825–847. [Google Scholar] [CrossRef]
- Mpofu, F.Y. Industry 4.0 in Finance, Digital Financial Services and Digital Financial Inclusion in Developing Countries: Opportunities, Challenges, and Possible Policy Responses. Int. J. Econ. Financ. Issues 2024, 14, 120–135. [Google Scholar] [CrossRef]
- Al-Hanawi, M.K.; Al Rahahleh, N. Mitigating Role of Financial Inclusion on the Perceived Difficulties, Concerns, and Borrowing for Medical Expenses in Saudi Arabia. Cost Eff. Resour. Alloc. 2024, 22, 2. [Google Scholar] [CrossRef]
- Voptia, E.B.K.; Stukalina, Y. Financial Inclusion in Sub-Saharan Africa: The Case of Mobile Money. Ekonomika 2024, 103, 81–96. [Google Scholar] [CrossRef]
- Asif, M.; Khan, M.N.; Tiwari, S.; Wani, S.K.; Alam, F. The Impact of Fintech and Digital Financial Services on Financial Inclusion in India. J. Risk Financ. Manag. 2023, 16, 122. [Google Scholar] [CrossRef]
- Borhan, N.A.; Muda, R.; Mohamad, S. Measuring Financial Inclusion in Developing Economies: A Multidimensional Index. Asia-Pac. Manag. Account. J. 2021, 16, 301–326. [Google Scholar] [CrossRef]
- Youssef, A.H.; Abozaid, E.S.; Abdel Latif, S.H. Handling Multi-Collinearity Using Principal Component Analysis with the Panel Data Model. EUREKA Phys. Eng. 2023, 2023, 1–16. [Google Scholar] [CrossRef]
- Chitimira, H.; Warikandwa, T.V. Financial Inclusion as an Enabler of United Nations Sustainable Development Goals in the Twenty-First Century: An Introduction. In Ius Gentium; Springer Science and Business Media B.V.: Berlin/Heidelberg, Germany, 2023; Volume 106, pp. 1–22. [Google Scholar] [CrossRef]
- Ribeiro, M.T.; Singh, S.; Guestrin, C. “Why Should I Trust You?”: Explaining the Predictions of Any Classifier. In Proceedings of the 22nd ACM SIGKDD International Conference on Knowledge Discovery and Data Mining (KDD ’16), San Francisco, CA, USA, 13–17 August 2016; pp. 1135–1144. [Google Scholar] [CrossRef]
- Mhlanga, D. Block chain Technology for Digital Financial Inclusion in the Industry 4.0, Towards Sustainable Development? Front. Blockchain 2023, 6, 1035405. [Google Scholar] [CrossRef]


Disclaimer/Publisher’s Note: The statements, opinions and data contained in all publications are solely those of the individual author(s) and contributor(s) and not of MDPI and/or the editor(s). MDPI and/or the editor(s) disclaim responsibility for any injury to people or property resulting from any ideas, methods, instructions or products referred to in the content. |
© 2025 by the authors. Licensee MDPI, Basel, Switzerland. This article is an open access article distributed under the terms and conditions of the Creative Commons Attribution (CC BY) license (https://creativecommons.org/licenses/by/4.0/).