Abstract
With the rapid advancement of the Internet and big data, data sharing has become pivotal for enhancing operational efficiency and user experience across industries. In the restaurant sector, the emergence of smart kitchens has accelerated digital transformation, underscoring the critical importance of data sharing. In this study, we investigate the evolutionary dynamics among four key stakeholders in the smart kitchen ecosystem: data providers, data-sharing platforms, data consumers, and regulators. We develop a four-party evolutionary game model to analyze the strategic interactions and behavioral evolution of each participant, applying replicator dynamics and Lyapunov stability theory. Our findings reveal that (1) data providers’ willingness to supply high-quality data is strongly influenced by platform incentives; (2) platforms’ adoption of data governance mechanisms depends on associated governance costs; (3) regulatory subsidies contribute significantly to system stability; and (4) increased financial support for regulators promotes favorable system evolution. This work offers both theoretical insights and practical guidance for data sharing in smart kitchens, providing a novel perspective on digital transformation within the restaurant industry.
1. Introduction
Amid the increasing complexity of the contemporary big data ecosystem, innovation in data-driven business models is characteristic of complex systems [1]. The integration of smart kitchen technologies and the adoption of data-driven development approaches are now widely regarded as pivotal drivers of industry advancement. The proliferation of modern information and communication technologies, notably the Internet of Things (IoT) and big data analytics, has not only accelerated the digital transformation of the restaurant sector but has also resulted in the generation of extensive data resources [2].
China’s catering industry has undergone rapid digitalization, propelled by policy initiatives and market demand. In 2023, the market reached RMB 5.29 trillion, with digital transformation identified as a primary growth driver (China Catering industry Development Report 2024) [3]. Within the digital ecosystem, data providers—such as catering enterprises and takeaway platforms—are principal sources of large-scale data, encompassing order information, user preferences, and operational metrics. As reported by the China Internet Network Information Center (CNNIC), online food delivery users numbered 554 million by 2024 [4], producing vast but highly fragmented datasets across platforms and enterprises. To address the challenges of data fragmentation and “data silos” [5], the development of effective data-sharing mechanisms has become imperative. The State Council’s “Opinions on Promoting the Development of the Platform Economy” calls for strengthened data interoperability and sharing among digital platforms to maximize economic value and foster innovation. Enhanced data sharing improves information utilization and supports the digital economy’s development [6]. Integration frameworks, as shown in recent studies [7], further reinforce the stability and interpretability of data-sharing systems in big data environments.
The development of unified data-sharing platforms enables more efficient data discovery, access, and management [8]. Secure solutions, such as multi-blockchain architectures [9], and unified data governance frameworks further enhance data reliability and reduce redundancy [10,11,12], offering valuable insights for optimizing supply chain resources and advancing digital transformation.
Within this ecosystem, catering data providers, data-sharing platforms, data consumers, and regulators have emerged as key stakeholders in the digital transformation of the catering industry sector. Digital transformation significantly drives industry innovation [13], resulting in increased sales, revenue growth, value creation, and operational flexibility [14]. Data providers collect and organize information, which is uploaded to data-sharing platforms for analysis and refinement. These platforms then deliver actionable insights to data consumers, supporting market decisions, product optimization, and other strategic initiatives.
According to the China Chain Store & Franchise Association’s Digital Transformation Report, enterprises implementing comprehensive data sharing strategies achieved 25% higher operational efficiency and 18% increased revenue compared to traditional operators. Catering data providers play a pivotal role in the collection and organization of data, which is subsequently uploaded to data-sharing platforms [15]. Acting as the primary driver of the catering data ecosystem, regulators play an essential role in fostering data sharing by offering subsidies, which maximize the benefits for all parties involved—data providers, data-sharing platforms, and data consumers [16]. This collaborative framework not only strengthens the ecosystem but also enhances its capacity to generate value and facilitate industry-wide innovation.
The digital transformation of the catering industry has a positive impact on catering enterprises, helping to address issues such as low productivity. Therefore, promoting participation in data sharing through well-designed incentive mechanisms and subsidy policies is crucial for advancing the digital transformation of the catering industry sector [17,18,19]. This paper constructs an evolutionary game model involving four key players: catering data providers, catering data-sharing platforms, catering data consumers, and regulators. It analyzes the strategic interactions and evolutionary paths of these stakeholders under different strategies and external incentive mechanisms. We explore various factors influencing the game’s outcomes, such as the cost of high-quality data sharing for catering data providers, the cost of data acquisition for catering data consumers, and the level of subsidies provided by regulators.
In summary, the main contributions of this paper are as follows:
- This study advances the academic literature by introducing a novel four-party evolutionary game framework tailored to the catering industry. Whereas prior research on data-sharing games has predominantly focused on manufacturing, healthcare, agriculture, and supply chains, systematic analyses of data sharing in catering—particularly in smart kitchen contexts—remain conspicuously absent. In addition, existing studies rarely consider the simultaneous role of both data-sharing platforms and regulatory authorities, limiting their ability to capture the full dynamics of industry ecosystems. By integrating data providers, platforms, consumers, and regulators into a unified framework, this study demonstrates how government subsidies, platform governance, and reputation incentives jointly shape high-quality data-sharing behaviors, offering a more realistic and comprehensive representation of the catering ecosystem.
- Strategic Stability and Equilibrium Analysis: We analyze the strategic stability of the four parties, develop a replicated dynamic equation, and determine the equilibrium point of the model using the Lyapunov method, followed by a stability verification of this equilibrium. While most existing literature centers on two- or three-party game models, it often overlooks the crucial roles that platforms and regulators play in data sharing. By introducing a regulatory mechanism, we examine how platforms shape the behavior of other participants through incentives and data quality control, offering a novel perspective on the dynamics of smart catering data sharing.
- Data Quality and Regulatory Incentives: Data quality is paramount in catering data sharing systems. This study explores how regulatory subsidy policies can incentivize catering data providers, data-sharing platforms, and data consumers to adopt cooperative strategies, with particular focus on how these policies can enhance data quality and ensure the security of data sharing. While existing literature often centers on privacy protection and security in data sharing, the influence of platform governance and government regulation on data quality control remains underexplored. This research addresses this gap, highlighting the pivotal role of regulatory incentives in improving both the quality and stability of data sharing.
- Simulation and Policy Implications: We adjusted several parameters through numerical simulations and observed their effects on the strategies of each stakeholder. The results demonstrate that when platforms implement data quality control and incentives, the willingness of catering companies to participate increases significantly. Additionally, government incentives and penalties play a crucial role in fostering cooperation among catering companies and enhancing the efficiency of data sharing. Compared to an unregulated environment, government regulation proves to be an effective mechanism for promoting the high-quality flow of data within the restaurant industry. Based on these findings, this study proposes stabilization strategies that offer valuable insights—particularly regarding how platform governance and government regulation can enhance the efficiency and quality of data sharing during the digital transformation of the smart restaurant industry.
The structure of this paper is organized as follows: Section 2 provides an extensive literature review on catering data sharing, smart restaurant systems, and game-theoretic approaches in data ecosystems, identifying key research gaps that motivate our modeling approach. Section 3 introduces a four-party evolutionary game model involving catering data providers, data-sharing platforms, consumers, and regulators. We define the strategies, formulate payoff functions based on cost–benefit structures, and establish assumptions regarding their interrelationships and incentives. Section 4 employs replicator dynamics (describes how the proportion of strategies in a population changes over time) to analyze the evolution of strategy frequencies, deriving equations for each group and examining their trajectories. Section 5 presents a strategy stability analysis through equilibrium conditions—which can provide insights about if players make small changes to their strategies, or if the game is perturbed slightly, does the system (players’ strategies) return to equilibrium, phase diagrams (describe how the proportions of different strategies change over time), and eigenvalue analysis—it determines whether small changes near an equilibrium point will die out (stable) or grow (unstable) by analyzing the eigenvalues of the system’s Jacobian matrix at that point. Section 6 applies Lyapunov stability theory to assess system stability, ensuring convergence under specific parameters. Section 7 conducts numerical simulations with an initial cooperative strategy, validates the model with three-dimensional evolutionary trajectories, and performs cross-impact and sensitivity analyses on key variables. Finally, Section 8 synthesizes the findings, discusses implications for data governance in the restaurant industry, and concludes with future research directions. This structure is illustrated in Figure 1.
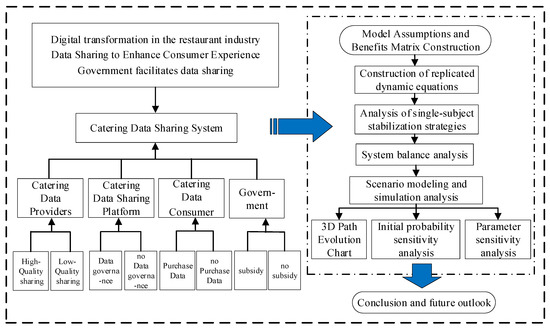
Figure 1.
General framework diagram of this paper.
2. Related Work
2.1. Catering Data Sharing
The widespread adoption of infrastructures such as the Internet and mobile Internet, coupled with advancements in cloud computing, big data, and machine learning technologies, has enabled the extensive collection and analysis of behavioral data. Artificial intelligence and data sharing are increasingly intertwined [20], prompting numerous companies and industries to harness the potential value of data. This trend is particularly evident in the catering industry, where evolving market conditions necessitate an innovation-driven approach [21]. Big data influences every facet of supply chain management [22], allowing for the monitoring of the food supply chain and enabling more informed production decisions through data sharing technologies [23]. By exchanging and sharing information, various stakeholders within the catering sector can optimize resource allocation, enhance operational efficiency, and improve user experiences. Studies reveal that, under significant data disclosure, restaurant operators are inclined to share their data when they perceive it as advantageous, thereby triggering contextual reciprocity [24]. Zhu et al. investigated how the external environment influences consumers’ willingness to participate in data sharing [25], underscoring the growing importance of data sharing and data analytics for supply chain innovation [26].
However, most prior studies have remained confined to technical solutions or single-agent behavioral analyses, paying limited attention to the complex strategic interactions among multiple stakeholders within the catering sector. In particular, the simultaneous role of data-sharing platforms and regulators in shaping incentives and governance has been largely overlooked. This gap limits the explanatory power of prior models when applied to the catering industry. To address this deficiency, the present study develops a four-party evolutionary game framework that explicitly incorporates data providers, platforms, consumers, and regulators, thereby filling a critical gap in the literature.
2.2. Smart Catering and Smart Restaurants
The application of big data technology in the catering sector is experiencing a significant upward trajectory, exemplified by the emergence of smart restaurants that integrate artificial intelligence (AI) and other advanced technologies [27]. A comprehensive dynamic decision-making model is developed using an evolutionary game framework, offering valuable insights and effective strategies for policymakers to foster the adoption of green methanol-powered ships through tailored parameter design and equilibrium point selection [28]. Current research on smart dining predominantly focuses on AI and robotics, highlighting their roles in enhancing operational efficiency and customer experience. The restaurant industry, being a vital economic sector, increasingly employs catering robots to streamline operations and improve overall efficiency [29]. Robots, powered by big data and machine learning, are transforming the restaurant industry by enabling personalized dish recommendations and intelligent ordering systems. Leveraging shared data, restaurants can analyze customer preferences, optimize inventory management, and enhance operational efficiency. This collaborative approach fosters a more efficient catering ecosystem and supports sustainable industry growth, driving innovation across the sector.
Nevertheless, much of the current literature on smart catering continues to emphasize the technical applications of artificial intelligence and robotics, while overlooking the fundamental mechanisms of data sharing that underpin their effectiveness. In particular, few studies have systematically examined how data-sharing platforms and regulatory incentives influence the governance and efficiency of smart restaurant ecosystems. By integrating evolutionary game analysis with the context of smart kitchens, this study goes beyond the technical level to capture the dynamics of cooperation and governance in data sharing, thereby providing new theoretical insights into the digital transformation of the catering industry.
2.3. Evolutionary Game
Currently, data sharing plays a pivotal role in the digital transformation across various industries, with numerous studies exploring its mechanisms and incentives. Tan’s study demonstrated that participants’ initial willingness significantly influenced their data sharing behavior, while factors such as incentive income and social penalties positively shaped the evolution toward active sharing strategies [30]. Li and Mei, from the perspective of platform empowerment, investigated data sharing dynamics between large enterprises and SMEs, highlighting the crucial role of platforms in facilitating cooperative strategies [31]. Similarly, Zhang et al. proposed a dynamic incentive mechanism grounded in evolutionary game theory to enhance data interoperability and sharing willingness [32]. Furthermore, Dong et al. employed a three-party stochastic evolutionary game approach to address cross-sectoral data sharing in digital government initiatives, emphasizing the essential role of government subsidies in fostering inter-party cooperation [33]. Liu et al. examined data sharing and platform empowerment within smart logistics eco-cooperation through an evolutionary game model, recommending appropriate agency fees to achieve equilibrium in eco-cooperation [34]. Gao et al. developed a three-party evolutionary game model for medical data sharing, underscoring the importance of data security and regulatory frameworks in ensuring system stability. Fan et al. constructed a three-party evolutionary game model under government coordination from a supply chain perspective, finding that government incentives significantly promoted data openness and sharing among supply chain enterprises, thereby facilitating supply chain digital transformation [35]. Van der Burg et al. examined the role of trust in data sharing through an analysis of the EU Code of Conduct for Agricultural Data Sharing, advocating for enhanced contract transparency and information customization [36]. Sun et al. investigated the key factors shaping government decision-making in data sharing, including administrative costs, incentives from higher levels of government, and the associated benefits, costs, and risks faced by local authorities [18]. Liu et al. developed a three-party evolutionary game model of shared manufacturing under a government regulatory mechanism, identifying that the efficiency of government regulatory inputs and the equitable distribution of shared revenue significantly impact system stability. Zhao and Yang analyzed stakeholders’ decision-making behaviors in the agricultural data supply chain using a three-way evolutionary game model, revealing the critical roles of initial strategy, regulatory intensity, and incentive mechanisms in maintaining the stability of the information sharing ecosystem [37]. Lastly, Liu and Li utilized a four-party evolutionary game analysis to investigate the decision-making behavior of third parties in livestock and poultry waste recycling and treatment, highlighting the dominant role of government subsidies in promoting cooperation among all parties [38].
In summary, evolutionary game theory has been widely applied in diverse domains, including manufacturing, healthcare, agriculture, and government governance, demonstrating its value in analyzing incentives and cooperative mechanisms. However, applications within the catering industry remain limited, and few models concurrently incorporate both platform governance and government regulation. Existing three-party models cannot fully capture the multi-agent complexity of the catering ecosystem. Building on these gaps, this study constructs a four-party evolutionary game model tailored to the restaurant data-sharing ecosystem, encompassing data providers, platforms, consumers, and regulators. The proposed framework addresses the overlooked interaction of subsidies, governance, and reputation incentives, thereby filling an important gap in the literature and offering a comprehensive understanding of the digital transformation of the catering industry.
3. An Evolutionary Game Model for Data Sharing in Smart Kitchens
3.1. Analysis of Application Scenarios and Game Players
Based on the operational characteristics of the catering industry, we develop a data-sharing model for smart kitchens that involves four key stakeholders: catering data providers, catering data-sharing platforms, catering data consumers, and regulators. The model also examines the game dynamics among these stakeholders under various strategies, as illustrated in Figure 2.
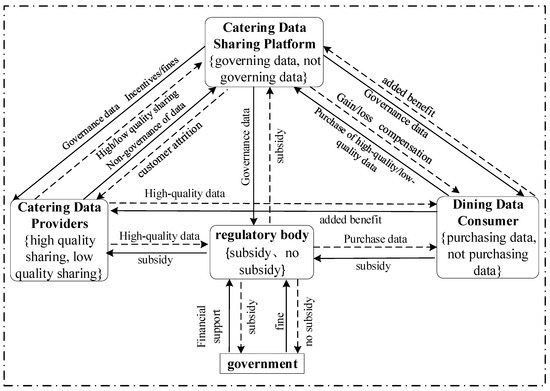
Figure 2.
Stakeholder Relationship Diagram.
In a smart catering data sharing system, data providers supply information to a sharing platform, which rewards them for providing high-quality data and imposes fines for poor-quality data. Catering data consumers can purchase data from the platform, benefiting from more informed decision-making when they access high-quality data. Both platforms and data providers, in turn, gain reputational benefits. Consumers are entitled to compensation from the platform if they suffer losses due to purchasing low-quality data. Regulators offer subsidies to parties that adopt proactive strategies to promote the stability of the catering data ecosystem, in addition to financial support from the government. More detailed relationships are outlined in the hypotheses. In this complex ecosystem, balancing the interests of all parties is crucial to ensuring a stable and sustainable system.
3.2. Model Assumptions and Parameter Definitions
In the game model of smart kitchen data sharing, four main participants are involved: catering data providers, catering data sharing platforms, catering data consumers, and regulators. Each participant is considered a finite rational agent, influenced by the actions of the other parties. The key assumptions of the model are as follows:
Hypothesis 1.
For catering data providers—including restaurants and food suppliers—the decision to share data is typically governed by two key factors: data quality and the associated cost of sharing. The sector is undergoing rapid digital transformation, reflecting a profound restructuring of value creation and exchange across the catering ecosystem. The strategy of a catering data provider (such as a user, restaurant, or ingredient supplier) is represented by: (High-quality sharing, low-quality sharing). The catering data provider chooses (high-quality sharing, data quality levels, willingness to share, data integrity, credibility, transparency, etc.) with a probability of , and (low-quality sharing,) with a probability of , where ranges from . At present, most restaurant data-sharing platforms have established governance mechanisms to safeguard data quality. For instance, some data-sharing platforms enforce stringent quality controls on restaurant data and have introduced a “merchant integrity rating” system, under which low-quality data are penalized while high-quality contributions are incentivized. The strategy of the Catering Data Sharing Platform is: (govern data, don’t govern data). The Food and Beverage data sharing platform chooses (data cleaning and analysis through intelligent algorithms) with a probability of , and chooses (as a passive data exchange platform that does not participate in governance) with a probability of , where the value of ranges from . The strategy of the restaurant data consumer is denoted as (buy data, don’t buy data). A restaurant data consumer chooses strategy (to purchase data from the data-sharing platform to optimize operational decisions, such as order prediction and inventory management) with a probability of , and strategy (not to purchase data) with a probability of , where ranges from . The regulator’s strategy is (subsidy, no subsidy). The regulator chooses (providing subsidies to catering data providers, data sharing platforms, and consumers to support intelligent applications) with a probability of , and (no subsidy) with a probability of , where ranges from .
Hypothesis 2.
In the catering industry, the costs of data sharing extend beyond system maintenance and data integration to include real-time data processing and transmission. For example, some catering companies employ smart kitchen systems that monitor ingredient consumption in real time and forecast inventory demand; however, the establishment, updating, and maintenance of such systems involve substantial expenditures. When food service data providers choose high-quality data sharing, they obtain revenue and incur additional costs . When food service data providers choose low-quality data sharing, they obtain revenue and incur only basic data sharing costs .
Hypothesis 3.
When the catering data sharing platform chooses to govern the data, it will employ intelligent algorithms and data inspection techniques. The cost of governance for the platform will be denoted as . For example, data-sharing platforms reward and penalize merchants based on the quality of the data they share. If a catering data provider is detected sharing high-quality data, it is rewarded with , if it is detected sharing low-quality data, it is fined and incurs an additional cost to correct the data. If the platform chooses not to govern the data and simply acts as an intermediary for data flow, no governance costs are incurred. However, if catering data providers share low-quality data, the platform will suffer a loss of consumer trust, disrupting the data ecosystem of smart kitchens, which will result in a trust deficit .
Hypothesis 4.
When catering data consumers choose to purchase data, they pay a fee to the data platform. By using the high-quality data, they make optimized decisions (e.g., automated dish recommendations, inventory management), resulting in an efficiency gain . At the same time, the data provider and the platform that governs the data both receive a reputational benefit . For example, inaccurate customer reviews and order data provided by the data-sharing platform may cause restaurants to misjudge customer demand, resulting in either an excess or shortage of food. Therefore, if the purchased data is of inferior quality, it may lead to operational failures, such as mismanagement of ingredients, resulting in losses . In this case, the data consumer can claim compensation from the platform. If a data consumer chooses not to purchase data, no immediate loss is incurred. However, in the long term, the lack of high-quality data will lead to a decline in operational efficiency, resulting in a potential loss .
Hypothesis 5.
When the regulator chooses to provide subsidies, the aim is to promote the smart transformation of the catering industry. The regulator will subsidize the data provider, the data sharing platform, and the data consumer to encourage cooperation among the three parties. In addition, the regulator will receive a special government grant
. The subsidy for catering data providers is , which is primarily used for the collection and organization of high-quality data. The subsidy for catering data sharing platforms is , which supports the enhancement of the platform’s intelligent governance capabilities and technological upgrades. The subsidy for data consumers is , which is allocated to support their purchase and use of intelligent data for operational decision-making. Subsidized by the regulator, the regulator gains reputational benefits if a cooperative situation emerges in which data providers share high-quality data, data platforms govern proactively, and data consumers purchase data, resulting in an efficiency gain . If regulators choose not to subsidize, the smart kitchen ecosystem may face stagnation and a loss of credibility . Additionally, regulators could incur fines for improper subsidization if low-quality data results in reduced efficiency in the catering supply chain and smart kitchen operations.
The relevant parameters and abbreviations in this paper are shown in Table 1.

Table 1.
Main symbols and definitions used in the paper.
3.3. Model Construction
Based on the previous analysis and assumptions, we present a benefit matrix that illustrates the interactions among catering data providers, catering data sharing platforms, catering data consumers, and regulators, as shown in Table 2.
Table 2.
Matrix of benefits for each stakeholder.
4. Construction of Dynamic Equations for Replication
4.1. Equations for Replication Dynamics for Catering Data Providers
The expected benefit to the catering data provider of choosing a ‘high-quality sharing’ strategy is :
The expected benefit of the catering data provider choosing the ‘low quality sharing’ strategy is:
The average expected return for catering data providers is:
The replication dynamics equation for the catering data provider is:
4.2. Replicated Dynamic Equations for a Catering Data Sharing Platform
The expected return for the platform choosing the ‘Governance Data’ strategy is:
The expected return of the platform choosing the ‘no data governance’ strategy is:
The average expected return of the platform is:
The equations for the replication dynamics of the platform are:
4.3. Replicated Dynamic Equations for Consumers of Restaurant Data
The expected benefit of a restaurant data consumer choosing the ‘buy data’ strategy is:
The expected benefit of a restaurant data consumer choosing the ‘no data purchase’ strategy is:
The average expected return for consumers of catering data is:
The replication dynamics equation for restaurant data consumers is:
4.4. Replicating Dynamic Equations for Regulators
The expected return for the regulator choosing the ‘subsidy’ strategy is:
The regulator chooses the ‘no subsidy’ strategy with an expected return of :
The average expected return for regulators is:
The replication dynamic equation for the regulator is:
5. Stability Analysis of Single-Subject Strategies
5.1. Stability Analysis of Catering Data Provider Strategies
According to the stability theorem and properties, we can get the stable point when , : , , . We obtain this by taking the derivative of :
when , at which point all are evolutionarily stable strategies. When , and are evolutionarily stable strategies.
Let , , , is an increasing function with respect to .
When , , , , is the Evolutionarily Stable Strategy (ESS), meaning that the ‘High-Quality Sharing’ strategy is the evolutionarily stable strategy for the catering data provider.
When , , , , is the Evolutionarily Stable Strategy (ESS), meaning that the ‘Low-Quality Sharing’ strategy is the evolutionarily stable strategy for the catering data provider.
Based on the above analysis, we can derive the phase diagram illustrating the evolution of the catering data provider’s strategy, as shown in Figure 3.
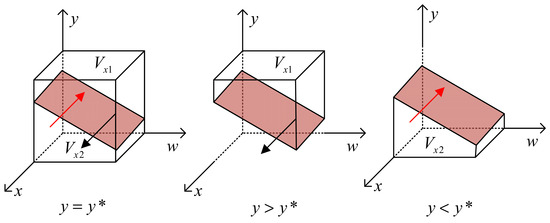
Figure 3.
Phase diagram of the evolution of catering data provider strategies.
When the policy space of the catering data provider is located at , , . At this point is an evolutionarily stable strategy point in the space ; When the policy space of the catering data provider is located at , , , . At this point is an evolutionarily stable strategy point in the space . The results show that the benefits of catering data providers are influenced by the strategies of catering data sharing platforms, catering data consumers, and regulators. When all three parties are involved, the benefits of the “high-quality sharing” strategy for catering data providers are greater than those of the “low-quality sharing” strategy. If the regulator supports the ‘subsidy’ strategy, the catering data provider’s strategy tends to evolve toward ‘high-quality sharing’; conversely, when the regulator does not provide subsidies, the provider’s strategy evolves towards ‘low-quality sharing’.
5.2. Stability Analysis of Catering Data Sharing Platform Strategies
According to the stability theorem and properties, we can get the stable point when , : , , . We obtain this by taking the derivative of :
When , , at which point all are evolutionarily stable strategies. When , and are evolutionarily stable strategies.
Let , . When , , is an increasing function of ; When , , is a subtractive function of .
When :
When , , , . At this point, is the evolutionarily stable strategy, meaning that the ‘governance data’ strategy is the evolutionarily stable strategy.
When , , , . At this point, is the evolutionarily stable strategy, meaning that the ‘no governance data’ strategy is the evolutionarily stable strategy.
When , , , . At this point, is the evolutionarily stable strategy, meaning that the ‘no governance data’ strategy is the evolutionarily stable strategy.
When , , , . At this point, is the evolutionarily stable strategy, meaning that the ‘governance data’ strategy is the evolutionarily stable strategy.
Based on the above analysis, we can derive a phase diagram illustrating the evolution of the catering data provider’s strategy, as shown in Figure 4.
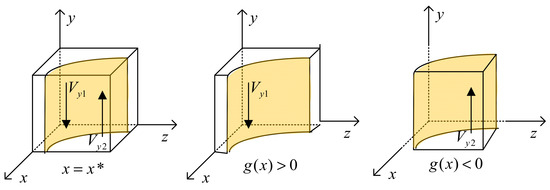
Figure 4.
Phase diagram of the evolution of the catering data sharing platform strategy.
When the catering data sharing platform is located within , , is the evolutionarily stable strategy for the catering data sharing platform; When the catering data sharing platform is located within , , is the evolutionarily stable strategy for the catering data sharing platform. The benefits of food and beverage data sharing platforms are influenced by the strategies of data providers, data consumers, and regulators. When the platform generates revenue, it prefers the ‘data governance’ strategy. Conversely, when the platform incurs losses, it prefers the ‘no data governance’ strategy.
5.3. Stability Analysis of Consumer Strategies for Restaurant Data
According to the stability theorem and properties, we can get the stable point when , : .
We obtain this by taking the derivative of :
When , , at which point all are evolutionarily stable strategies; When , and are the points of evolutionary stability for the strategies.
Let , , So is an increasing function with respect to .
When , , , . At this point, is the evolutionarily stable strategy point, meaning that ‘buying data’ is the evolutionarily stable strategy.
When , , , . At this point, is the evolutionarily stable strategy point, meaning that ‘no buying data’ is the evolutionarily stable strategy.
Based on the above analysis, we can derive a phase diagram illustrating the evolution of the strategies of catering data consumers, as shown in Figure 5.

Figure 5.
Phase diagram of consumer evolution of catering data.
When the catering data consumer is in , where , represents the evolutionarily stable strategy for the catering data consumer. Conversely, when the catering data consumer is in , where , becomes the evolutionarily stable strategy for the consumer. The benefits for catering data consumers are influenced by the strategies of catering data providers, catering data sharing platforms, and regulators. Under the combined influence of these three parties, catering data consumers benefit from choosing the ‘buy data’ strategy. On the other hand, when the influence shifts, catering data consumers lean towards the ‘don’t buy data’ strategy.
5.4. Stability Analysis of Regulators’ Strategies
According to the stability theorem and properties, we can get the stable point when , : , , . We obtain this by taking the derivative of :
When , , at which point all are evolutionarily stable strategies; When , and are the points of evolutionary stability for the strategies.
Let , .
When , , is an increasing function with respect to ; When , , is a subtractive function of .
When :
When , , , . At this point, is the evolutionarily stable strategy, meaning the ‘subsidy’ strategy is evolutionarily stable.
When , , , , At this point, is the evolutionarily stable strategy, meaning the ‘no subsidy’ strategy is evolutionarily stable.
When :
When , , , . At this point, is the evolutionarily stable strategy, meaning the ‘no subsidy’ strategy is evolutionarily stable.
When , , , . At this point, is the evolutionarily stable strategy, meaning the ‘subsidy’ strategy is evolutionarily stable.
Based on the above analysis, we can derive a phase diagram illustrating the evolution of the regulator’s strategy, as shown in Figure 6.
Figure 6.
Phase diagram of the evolution of the regulator’s strategy.
When the regulator is in , , and is the evolutionarily stable strategy for the regulator; when the regulator is in , , and is the evolutionarily stable strategy. The regulator’s revenue is influenced by the strategies of catering data providers, catering data sharing platforms, and catering data consumers. Under the combined influence of these three parties, the regulator will benefit from adopting the ‘subsidy’ strategy, whereas, conversely, the regulator will favor the ‘no-subsidy’ strategy.
6. System Stability Analysis
By analyzing the replicated kinetic equations above, a four-dimensional kinetic system involving catering data providers, catering data sharing platforms, catering data consumers, and regulators can be derived:
Let , , , . We can obtain the local stability points, which represent the stable solutions of the game model involving the four subjects: catering data providers, catering data sharing platforms, catering data consumers, and regulators. From these, we can derive 16 strategic equilibrium points, that is , , , , , , , , , , , , , , , . According to the Lyapunov stability theorem, we can establish differential equations to study the stability of the system. By calculating the corresponding Jacobian matrix, we can determine the eigenvalues, and the equilibrium point will be locally stable if the real parts of all the eigenvalues are less than zero. We can derive the Jacobian matrix for the catering data system scenario and then analyze the stability of each equilibrium point:
Among them,
We calculate the eigenvalues of the sixteen equilibrium points based on the above equations, as presented in Table 3.
Table 3.
Eigenvalues of equilibrium points.
Based on the actual situation and research findings, catering data providers tend to share low-quality data, avoiding the cost of acquiring data and achieving higher returns, i.e., . Catering data sharing platforms that do not govern the data may face a crisis of trust and market competition pressure. These losses typically outweigh the cost of data governance and correction, i.e., . Catering data consumers, to maximize benefits, will generally prefer to purchase high-quality data, as it improves the accuracy of decision-making, with the benefits often exceeding the cost of purchase, i.e., . Based on these assumptions, we can analyze the stability of the sixteen equilibrium points, as shown in Table 4.
Table 4.
Stability analysis of equilibrium points.
According to Lyapunov stability theory, an equilibrium point is asymptotically stable when all the eigenvalues of the corresponding Jacobian matrix are negative, and unstable when all eigenvalues are positive. If the eigenvalues are mixed, with both positive and negative values, the equilibrium point is classified as a saddle point. Based on this analysis, we identify six possible stable scenarios.
Scenario 1.
In the four-player game, the system stabilizes to the strategy combination of (low-quality sharing, governing data, purchasing data, no subsidy) when
, is satisfied. At this point, the catering system will reach a stable state at the point (0, 1, 1, 0). Specifically, means that the difference between the benefit to the catering data provider from choosing ‘low-quality sharing’ and the fine it pays is greater than the difference between the platform subsidy it receives for choosing ‘high-quality sharing’ and the benefit of trust, minus the associated costs. When
, the regulator’s loss from choosing a ‘no subsidy’ strategy is less than the total cost of ‘subsidizing’ the platform and consumers, minus the government subsidy it receives.
Scenario 2.
The system will stabilize at the strategy combination of (low-quality sharing, governing data, buying data, subsidies) when
and
are satisfied. At this point, the catering system reaches stability at the state point (0, 1, 1, 1).
This scenario is similar to the first one, except that the regulator increases the subsidy to the food and beverage data sharing platform, making the steady state more unstable. When , it means that the regulator’s subsidy to the platforms and consumers is less than the loss it would incur if it had chosen a ‘subsidy’ strategy.
Scenario 3.
When
, and are satisfied, the system tends to a combination of strategies (high-quality sharing, no data governance, data purchasing, no subsidies) and reaches stability at state point (1, 0, 1, 0). Specifically, means that the benefit to the catering data provider from choosing ‘low-quality sharing’ is less than the combined benefit minus cost plus the platform subsidy from choosing ‘high-quality sharing’. means that the platform gains more from the credibility of ‘data governance’ than from the losses incurred when choosing ‘no data governance’, which will prompt the platform to choose the ‘data governance’ strategy. When , the regulator will be inclined to favor the ‘subsidy’ strategy, either due to the increased losses from the ‘no subsidy’ strategy or because the subsidies provided to catering data providers and consumers in the ‘subsidy’ strategy outweigh the cost, ultimately leading to the adoption of the ‘subsidy’ strategy.
Scenario 4.
When
,
, and are satisfied, the system will stabilize at the combination of strategies (high-quality sharing, no data governance, data purchase, subsidy), reaching equilibrium at the state point (1, 0, 1, 1). In this case,
implies that the benefits of choosing ‘low-quality sharing’ are less than the net benefits of choosing ‘high-quality sharing’, which include the regulator’s subsidy and trust benefits minus the associated costs. Simultaneously, suggests that the greater the credibility benefit or the larger the subsidy provided by the regulator, the more likely the platform will favor the ‘data governance’ strategy. Finally, indicates that an increase in government funding to the regulator or a higher reputational benefit for the regulator from adopting the ‘subsidy’ strategy will incentivize the regulator to favor the ‘subsidy’ approach.
Scenario 5.
When
,
, and
are satisfied, the system will stabilize with the combination of strategies (high-quality sharing, governing data, purchasing data, and no subsidy). At this point, the catering system will reach stability at the state point (1, 1, 1, 0). In this case, means that the benefit (including subsidy) to the catering data provider from choosing ‘high-quality sharing’ is greater than the net benefit of choosing ‘low-quality sharing’ after subtracting the penalty.
Scenario 6.
When
, , and are satisfied, the system will stabilize with the combination of strategies (high-quality sharing, governing data, purchasing data, subsidies), at which point the catering system will reach stability at the state point (1, 1, 1, 1). indicates that the total benefit to catering data providers from choosing “high-quality sharing,” which includes the platform subsidy, regulator subsidy, and trust benefit, exceeds the net benefit they would receive from choosing “low-quality sharing.” implies that the greater the trust benefit of choosing “data governance” or the larger the subsidy from the regulator, the more likely the platform will opt for the “data governance” strategy. Finally, suggests that regulators will be incentivized to favor the “subsidy” strategy either through increased reputational gains from government subsidies or due to the heightened losses associated with the “no subsidy” strategy.
7. Scenario Simulation
Based on the analysis above, the strategies for Scenario 5 include High Quality Sharing, Data Governance, Data Purchase, and No Subsidies. For Scenario 6, the strategies are High Quality Sharing, Data Governance, Data Purchase, and Subsidy. Among these, the strategies in Scenario 6—particularly High-Quality Sharing, Data Governance, Data Purchase, and Subsidy—represent the most desirable outcomes. However, in practice, achieving such a scenario is challenging, as market mechanisms alone often struggle to facilitate effective tripartite cooperation. Scenario 6, where a cooperative equilibrium is established with regulatory incentives, therefore reflects a more realistic evolutionary outcome. Accordingly, we selected Scenario 6 for simulation.
In line with expert recommendations, we assigned initial values to the four key variables of the evolutionary game within the catering ecosystem. These initial assignments are designed to capture the relationships between the key variables and do not alter the study’s conclusions. For the numerical simulations, we employed MATLAB 2023a ODE45 solver, an adaptive step-size method based on the Runge–Kutta technique. This method is known for its computational efficiency and high accuracy, making it well-suited for most nonlinear problems. The simulation results for Scenario 6 are presented below.
7.1. Model Validity Analysis Based on 3D Path Evolution
The parameter settings in this study are grounded in industry reports, regulatory cases, and market research data. The revenue and cost parameters for catering enterprises are specified as and , based on the average operating revenue and costs reported in the 2023 Beijing Catering Industry Development Report for small and medium-sized enterprises, thereby reflecting industry-level benchmarks. Consumer-related parameters, and [39], are determined by combining the scale of Beijing’s catering consumption market with average customer expenditure, while accounting for the typical proportion of operating costs relative to revenue. The penalty and loss parameters, and , are derived from the range of fines and opportunity costs observed in violation cases involving small and medium-sized catering enterprises. Governance-related parameters, , , , and [40], are informed by distinct sources: compliance costs are approximated using Meituan’s (Meituan is a catering-oriented online food delivery platform in China) annual expenditures on regulatory governance, while the reputation benefit parameter is drawn from the customer traffic gains attributed to the “Trusted Merchant” designation within Meituan’s credit evaluation system.
Government subsidy ratios are set according to NDPE statistics, which indicate that subsidies in developed eastern regions generally exceed 50%, whereas those in western regions typically fall below this threshold. To reflect such regional disparities, the model adopts Beijing as a representative case, assigning subsidy parameters , , and . Weighting factors are established as , , , , , , , and [41], referencing McKinsey’s report Digital Transformation in the Food Service Industry. These values capture the relative investment proportions of stakeholders in processes such as R&D, user engagement, and compliance activities. Finally, non-compliance penalty parameters are calibrated against enforcement cases documented under China’s Data Security Law (2021), ensuring that the model reflects realistic constraints arising from policy enforcement.
As illustrated in Figure 7, when the regulator adopts the subsidy strategy with a probability of , the evolutionary trajectories of catering data providers, data sharing platforms, and data consumers converge toward the stable equilibrium point (1, 1, 1). The simulation was conducted over 50 iterations using numerical integration methods to solve the replicator dynamic equations, with multiple initial conditions randomly distributed across the strategy space to ensure the robustness of the convergence results. The three-dimensional phase portrait displays the evolutionary paths from diverse starting points, all demonstrating consistent convergence behavior. These simulation results validate our theoretical predictions and confirm the model’s effectiveness in capturing the strategic evolution dynamics of the four-party catering data sharing ecosystem.
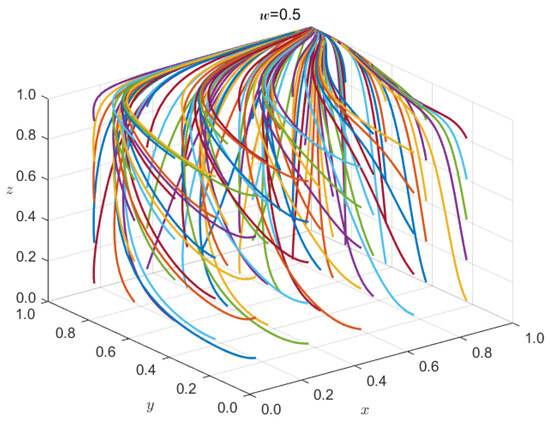
Figure 7.
Three-dimensional Evolution Diagram.
7.2. The Impact of Initial Probabilities of Each Party on the System Evolution Results
When the catering data provider selects the ‘high-quality sharing’ strategy with an increased initial selection probability of 0.9, the system’s evolution results are shown in Figure 8a. As the initial probability of choosing the ‘high-quality sharing’ strategy increases, the system evolution time is shortened and it ultimately converges to 1. The study findings suggest that the higher the probability of the catering data provider choosing the ‘high-quality sharing’ strategy, the faster the system evolves and the stronger its convergence. When the catering data provider adopts the ‘low-quality sharing’ strategy, the system fails to reach the desired stable state. This result indicates that the catering data provider’s upload of high-quality data promotes the system’s evolution toward a positive strategy, helping the system reach the desired stable point.
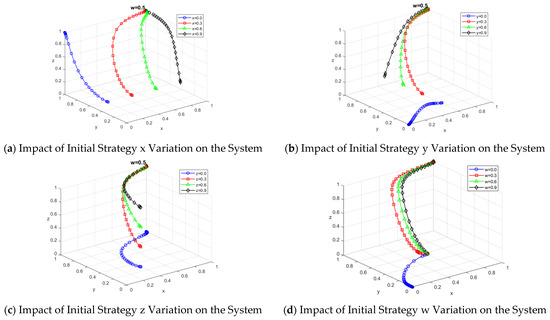
Figure 8.
Influence of the initial strategy on the evolutionary results of the system.
When the catering data sharing platform chooses the ‘data governance’ strategy with an increased initial selection probability of 0.9, the system’s evolution is shown in Figure 8b. As the initial probability of the platform selecting the ‘data governance’ strategy increases, the system evolves more quickly toward the ideal state of ‘high-quality sharing, data governance, data purchase, subsidy’, eventually converging to 1. The results indicate that the platform’s increased motivation to adopt a ‘data governance’ strategy enhances the willingness of catering data providers and consumers to adopt proactive strategies. When the platform chooses the ‘no data governance’ strategy, the system evolves towards ‘low-quality sharing, no data governance, no data purchase, and no subsidy’. This suggests that when platforms do not govern data, catering data providers tend to opt for the ‘low-quality sharing’ strategy as they face no penalties, while catering data consumers lean towards the ‘no data purchase’ strategy due to the poor quality of the data. However, when the platform adopts the ‘data governance’ strategy, it promotes the evolution of positive strategies among the system’s participants.
When the catering data consumer chooses the ‘buy data’ strategy, with the initial selection probability increased to 0.9, the system evolution is shown in Figure 8c. As the initial probability of consumers choosing the ‘buy data’ strategy increases, the time for the system to reach the desired steady state decreases, and it eventually converges to 1. In contrast, when consumers choose the ‘do not buy data’ strategy, the system fails to reach the desired steady state. The study suggests that the choice of the ‘buy data’ strategy by catering data consumers can drive the evolution of other actors in the system towards more positive strategies.
To further explore the impact of the regulator’s subsidy strategy on the evolution of each subject in the system, the probability of selecting the regulator’s subsidy strategy, is gradually increased from 0 to 0.9. Here, indicates that the regulator chooses the ‘no-subsidy’ strategy. The system evolution results for different values of are shown in Figure 8d. When the regulator adopts the ‘no-subsidy’ strategy, the system evolves to the state of ‘low-quality sharing, no data governance, no data purchase, and no subsidy’. As www increases, the system accelerates towards the ideal state of ‘high-quality sharing, data governance, data purchase, and subsidy’. The results demonstrate that the subsidy strategy implemented by the regulator can effectively promote the evolution of other actors in the system towards more positive strategies.
7.3. Sensitivity Analysis of Model Parameters
7.3.1. Impact of Regulators’ Subsidy Ratios , and on the Evolution of Each Subject’s Strategy
To investigate the influence of the regulator’s subsidy on the three parties in the catering data system, the parameter is set to values in the range of [0.1, 0.3, 0.5, 0.7, 0.9]. The impact of different values of on the evolution strategies of the three parties is shown in Figure 9a. The graphs illustrate the system’s evolution under different values. As increases, the system’s evolution towards the ideal state accelerates significantly, ultimately converging to 1. This suggests that the greater the subsidy provided by the regulator to the catering data provider, the faster the subjects in the system evolve towards a positive strategy.
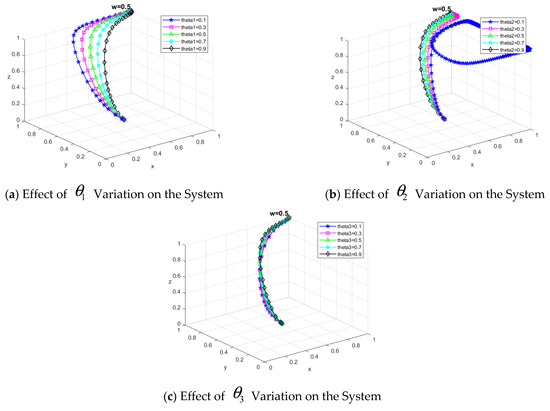
Figure 9.
, and on the evolution of the game subject’s strategy.
Similarly, is set to values in the range of [0.1, 0.3, 0.5, 0.7, 0.9] to analyze its effect on the strategies of the three subjects. As shown in Figure 9b, the system’s evolution for different values of is illustrated. When , the catering data sharing platform tends to converge to the ‘no data governance’ strategy. However, when , the system gradually evolves towards the ideal state. The larger the value of , the faster the system converges. This result may be attributed to the fact that the subsidy from the regulator to the catering data sharing platform has a more significant impact on the system, as the platform plays a key role as the intermediary in data flow.
Additionally, we set the value of to [0.1, 0.3, 0.5, 0.7, 0.9] to investigate its influence on the evolutionary strategies of the three subjects. Figure 9c shows the system’s evolution results for different values of . As increases, the convergence rate of the system to the ideal state slightly improves, but the growth trend is not significant. This could be explained by the fact that the strategy choices of catering data consumers are more likely influenced by the quality of the data in the system, rather than the direct effect of the regulator’s subsidy.
The results show that the regulator’s subsidy strategy has varying degrees of impact on the evolutionary outcome of the system, with subsidies for catering data providers and data sharing platforms playing a more significant role in accelerating the system’s evolution towards the desired state.
7.3.2. Catering Data Providers Receive Platform Subsidies Impact on Subjects
To explore the effect of the subsidy from the restaurant data sharing platform on the strategy evolution of the game participants, the values of are set as [50, 40, 30, 20, 10]. The impact of these different values on the strategies of each subject is analyzed, and the results are shown in Figure 10.
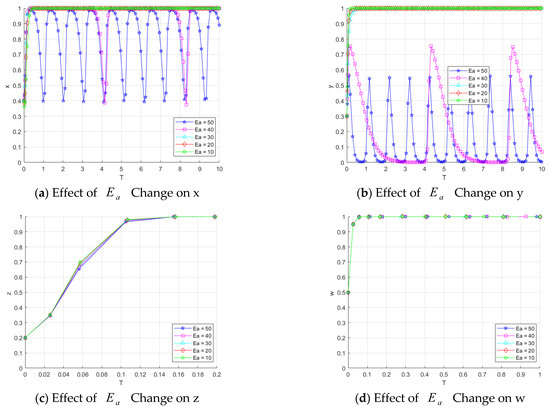
Figure 10.
Impact on the evolution of the game subject’s strategy.
Figure 10a shows the effect of different values of on the catering data provider’s strategy. When is set to 10, 20, and 30, the convergence rate to 1 for catering data providers accelerates as the value of increases. This suggests that a moderate increase in subsidies effectively encourages catering data providers to adopt a positive strategy. However, when reaches 40 and 50, the strategies of catering data providers become more volatile. This indicates that excessively high subsidies may lead catering data sharing platforms to lean towards a ‘no data governance’ strategy, introducing uncertainty and volatility in the catering data provider’s behavior.
Figure 10b shows the effect of different values of on the restaurant data sharing platform’s strategy. The results indicate that when is set to 10, 20, and 30, the convergence rate to 1 for the catering data sharing platform slows slightly as increases. This may be because a moderate increase in subsidies leads to more conservative strategy choices by the platform. However, when reaches 40 and 50, the platform’s strategies exhibit significant volatility. This could be explained by the fact that high subsidies increase the financial burden on the catering data sharing platforms, triggering instability in their strategic decisions.
Additionally, Figure 10c illustrates the impact of different values on the catering data consumer’s strategy. As decreases from 50 to 10, the rate of convergence for catering data consumers towards 1 slightly accelerates. This phenomenon may be attributed to the fact that a lower subsidy encourages the catering data sharing platform to prefer the ‘Govern Data’ strategy, which in turn improves the quality of the data in the system. This enhanced data quality motivates catering data consumers to adopt the ‘Buy Data’ strategy.
Finally, Figure 10d shows that changes in have a minimal impact on the regulator’s strategy, suggesting that subsidy variations do not significantly influence the regulator’s behavior. Overall, moderate subsidies help drive the subjects toward positive strategies, while excessive subsidies may lead to system instability and strategy fluctuations.
7.3.3. Catering Data Sharing Platform Governance Data Loss Impact on Subjects
As a key hub of data flow, the catering data sharing platform directly affects the quality of data in the system. In order to study the impact of the loss brought by the platform in choosing the ‘no data governance’ strategy on the system evolution, we assign the loss parameter to [10, 20, 30, 40], and analysis its effect on the strategy evolution of each subject. The results are as follows:
First, Figure 11a demonstrates the impact of different values on the catering data provider. When the value is 10 and 20, the strategies of catering data providers show fluctuations. The possible explanation is that when the F&B data sharing platform chooses ‘no data governance’, the providers tend to choose the “low quality sharing” strategy because they are not constrained by fines. When the platform chooses to “govern data”, providers are more likely to choose the “high quality sharing” strategy to avoid fines. When the value increases to 30 and 40, the strategies of data providers gradually converge to 1, which indicates that the larger loss motivates platforms to be more proactive in data governance, and thus pushes data providers to adopt positive strategies.
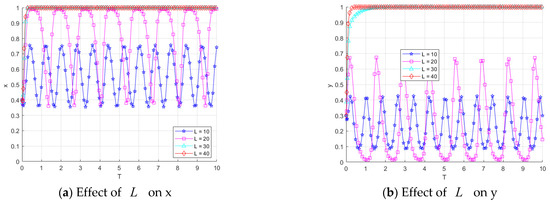
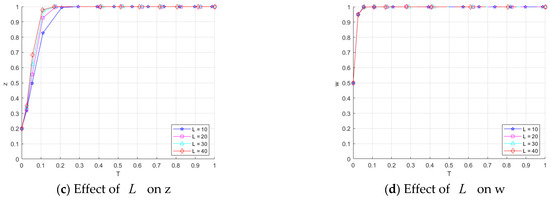
Figure 11.
Effect of on the evolution of strategies of the game subjects.
Second, Figure 11b demonstrates the impact of different values on the restaurant data-sharing platform. When the value is 10 or 20, the platform’s strategy shows volatility. This may be because, when the platform chooses the “no data governance” strategy, the incurred loss is relatively small, resulting in only a minimal cost difference between the “data governance” and “no data governance” strategies. As a result, the platform’s strategy becomes difficult to stabilize. However, as the value increases to 30 or 40, the platform gradually converges to the “govern data” strategy. This indicates that as the potential loss increases, the risk associated with ‘no data governance’ outweighs the cost of “data governance”, leading the platform to prefer the ‘govern data’ strategy. Moreover, the larger the value, the faster the system converges to the ideal state.
Finally, Figure 11c shows the effect of different values on consumers of restaurant data. As the value increases from 10 to 40, the consumers’ strategies converge faster and they gradually choose the “buy data” strategy. This may be because the platform’s adoption of the “govern data” strategy encourages data providers to upload high-quality data, thereby increasing consumers’ willingness to acquire such data and further motivating them to choose the “buy data” strategy. In addition, as can be seen from Figure 11d, the change in value has a small impact on the regulator’s strategy, indicating that the change in platform loss does not have a significant impact on the regulator’s action.
In summary, an increase in the loss parameter encourages restaurant data-sharing platforms to favor the ‘data governance’ strategy. This leads to improved data quality within the system, which, in turn, fosters the adoption of more positive strategies by both data providers and consumers.
7.3.4. Regulators’ Access to Government Funding Support Impact on Subjects
In the catering data ecosystem, the regulator plays a crucial role. By providing subsidies to the three parties involved in the game, the regulator can steer the evolution of each subject toward a positive strategy. To explore the impact of different subsidy amounts on the strategies of the system’s participants, we simulate scenarios with varying values of (0, 10, 20, 30, 40). The results are as follows:
First, Figure 12a illustrates the impact of different values on the strategy of the catering data provider. When values are set to 0 or 10, the provider’s strategy displays fluctuations. A possible explanation for this is that with low government subsidies to the regulator, the catering data provider does not receive adequate support for the cost of data processing. As a result, the provider’s strategy becomes unstable, oscillating between high-quality and low-quality data sharing.
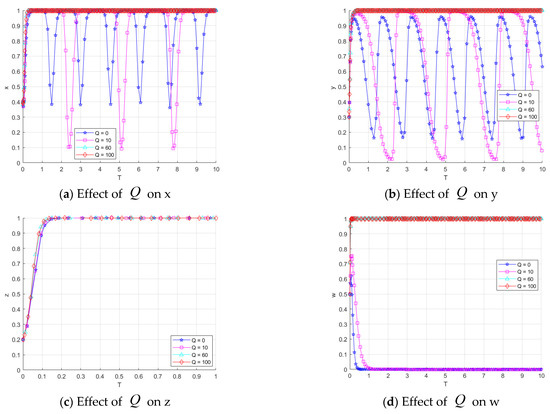
Figure 12.
Effect of on the evolution of strategies of the game subjects.
Second, Figure 12b illustrates the effect of different values on the restaurant data sharing platform strategies. When values are 0 and 10, the platform’s strategies also exhibit volatility. This may be due to the high costs associated with data governance, and when the regulator’s subsidy is low, the platform struggles to decide between ‘data governance’ and ‘no data governance’, resulting in an uncertain strategy. As increases, the platforms receive more financial support, allowing them to gradually converge towards the ‘data governance’ strategy.
Third, Figure 12c illustrates the impact of different values on the consumer strategies for restaurant data. Overall, consumer strategies are relatively insensitive to changes in the values. While an increase in causes a slight acceleration in the convergence of consumer strategies, the effect is not substantial. This may be because consumer strategies are more influenced by the quality of the data than by direct subsidies from the regulator.
Finally, Figure 12d shows the effect of different values on the regulator’s strategy. When the value is 0 or 10, the regulator’s strategy quickly converges to 0, indicating that with insufficient funding, the regulator faces greater financial pressure and opts for the ‘no subsidy’ strategy. As the value increases, the regulator receives more financial support, easing the financial burden, and thus gradually shifts towards the ‘subsidy’ strategy. This encourages the evolution of data providers and sharing platforms towards high-quality data governance.
In summary, different subsidy amounts have a significant impact on the strategies of the subjects in the catering data ecosystem. When the value of is low, the strategies of the providers and platforms are more volatile, making it difficult for the system to converge to the desired state. However, as increases, the regulator gains the ability to drive the positive evolution of the system through subsidies, leading the subjects to converge towards positive strategies more quickly.
7.3.5. The Effect of Different Combinations of and About the Game
Figure 13a shows the impact of different combinations of and on the catering data provider’s strategy. When and , the catering data provider’s strategy converges to 1, indicating that the provider chooses the ‘high-quality sharing’ strategy. In this case, the provider can effectively bear the cost of high-quality data sharing, and the higher government subsidy encourages this choice. When and , the provider’s strategy still converges to 1, but at a slower rate. However, when and , the provider’s strategy converges to 0, meaning the provider opts for the ‘low-quality sharing’ strategy. As increases further and continues to decrease, the provider’s strategy converges to 0 more quickly. This suggests that when the cost of high-quality sharing is high and the government subsidy is low, the provider prefers ‘low-quality sharing’ because the benefits of high-quality sharing are outweighed by the costs compared to low-quality sharing.
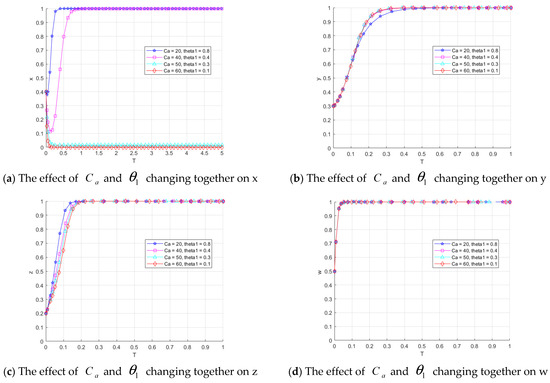
Figure 13.
Effect of and on the evolution of game subjects’ strategies.
Figure 13b shows the impact of different combinations of and on the restaurant data sharing platform’s strategy. As increases from 20 to 40 and decreases from 0.8 to 0.4, the convergence rate of the platform’s strategy to 1 increase, indicating that the platform prefers to “govern the data.” However, as continues to increase and decreases further, there is little change in the rate of convergence. This suggests that the platform’s strategy is sensitive to changes in and within a certain range, but its effect stabilizes once these parameters reach a certain threshold.
Figure 13c shows the effect of different combinations of and on restaurant data consumers. As increases and decreases, the consumer strategy converges to 1 faster, indicating that consumers are more likely to choose the “buy data” strategy. This may be because when restaurant data providers prefer “high-quality sharing,” consumers are able to make more informed decisions based on high-quality data, which leads to greater benefits and, consequently, increases their willingness to purchase data.
As shown in Figure 13d, changes in and do not have a significant impact on the regulator’s strategy. This may be because the primary role of the regulator is to promote the evolution of proactive strategies among the three parties through subsidies and policies, rather than being directly involved in the production or consumption of data. As a result, the regulator’s strategy is less sensitive to variations in these two parameters.
7.3.6. Effects of Different Combinations of and on Each Subject of the Game
Figure 14a shows the impact of different combinations of and on the restaurant data providers. When and , or and , the catering data provider chooses the “high quality sharing” strategy, although the level of this strategy slightly decreases. However, when and , the provider’s strategy starts to fluctuate. This may be due to the increased uncertainty when the catering data sharing platform faces higher costs for governing the data. Unable to maintain effective data governance, providers may seek to avoid penalties by choosing low-quality sharing for higher immediate returns. When and , providers eventually converge to 0, indicating a preference for the “low quality sharing” strategy.
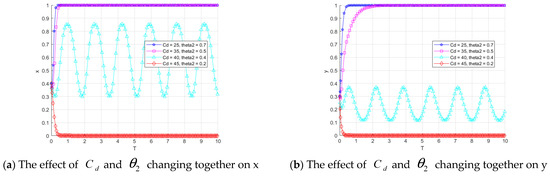
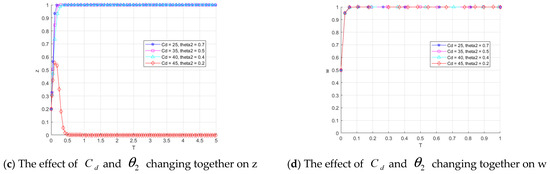
Figure 14.
Effect of and on the evolution of game subjects’ strategies.
Figure 14b illustrates the impact of different and combinations on the restaurant data sharing platform. The strategy evolution of the platform follows a similar pattern to that of the provider. When and , the platform’s strategy also fluctuates. This suggests that as the cost of data governance increases, a decrease in subsidies from the regulator reduces the gap between the benefits of “data governance” and “no data governance,” leading to greater uncertainty in the platform’s strategy. When and , the platform ultimately chooses the “no data governance” strategy, as the high cost of data governance makes it difficult for the platform to sustain effective data governance.
Figure 14c shows the impact of different combinations of and on restaurant data consumers. When and , and , and , consumers choose the “buy data” strategy, which converges to 1. However, as the combination of and changes, the convergence of the consumer strategy slows down, indicating that consumers’ willingness to buy decreases slightly when the effect of data governance is weakened. When and , consumers’ strategy shifts, and they eventually choose not to buy data. This is likely because the deterioration in data quality makes purchasing data no longer profitable.
Overall, the impact of changes in and on the regulator’s strategy is minimal. This suggests that the regulator’s decisions are more influenced by the broader system dynamics and external subsidy policies, rather than being directly driven by changes in the combination of and parameters alone.
7.3.7. Effects of Different Combinations of and About the Game
Figure 15 illustrates the effects of different values of and on the strategies of restaurant data providers, data sharing platforms, and consumers. It can be observed that as the value of increases and decreases, the rate of convergence to strategy 1 decreases significantly for each subject. This suggests that when the difficulty of data governance increases (as reflected by the rise in ) and the regulator’s subsidy decreases (as indicated by the drop in ), the tendency of the game players to adopt positive strategies, such as “high-quality sharing” and “data governance,” is weakened.
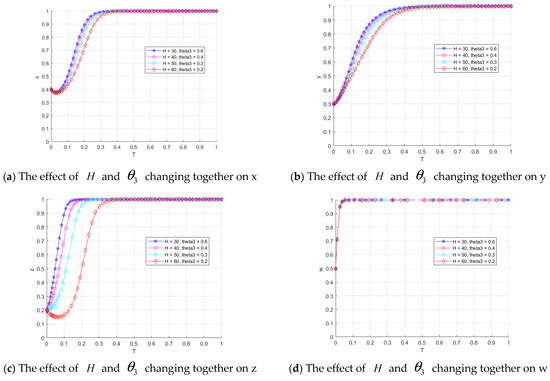
Figure 15.
Effect of and on the evolution of game subjects’ strategies.
The strategy of restaurant data consumers plays a crucial role in driving the entire system. Figure 15c shows that when consumers choose the “buy data” strategy, they pay a certain amount of money to the data sharing platform, which directly affects the platform’s revenue. In this scenario, data sharing platforms are more likely to adopt the “govern data” strategy, as high-quality data attracts more consumers, thereby increasing the platform’s revenue. This choice by the platform further influences the strategy of restaurant data providers. With effective data governance in place, providers are incentivized to choose “high-quality sharing” to enhance the market value of their data.
However, as can be seen in Figure 15d, changes in and have no significant effect on the regulator’s strategy. This implies that the role of the regulator is mainly to influence the other gaming agents in the system through external subsidy policies or macro-controls, and is not directly affected by changes in the parameters of and . This suggests that the regulator’s behavior is driven more by the overall effect of the system and changes in subsidy policy than by the combination of parameters under a particular game condition.
7.4. Cases in the Catering Industry
To further substantiate the practical relevance and applicability of the proposed model, it is instructive to draw on real-world industry cases. One illustrative example is Meituan’s Merchant Integrity Score mechanism, under which the platform has established a stringent data governance system to continuously evaluate the authenticity and completeness of data submitted by food and beverage merchants. High-quality data providers are rewarded with preferential traffic allocation and enhanced visibility, whereas merchants submitting low-quality or fraudulent data are penalized through ranking demotion and restricted recommendations. According to the Meituan Research Institute (2022), the implementation of this mechanism led to a reduction of approximately 15% in merchants’ average negative review rates, alongside an increase of more than 20% in the proportion of high-quality data. This practice aligns closely with this study’s hypothesis regarding the dynamic of “platform governance costs—rewards and penalties—reputation gains,” thereby providing empirical confirmation of the pivotal role of platform governance in steering data providers toward high-quality sharing strategies.
8. Conclusions and Recommendations
In this paper, we developed an evolutionary game model involving four key stakeholders: catering data providers, catering data-sharing platforms, catering data consumers, and regulators. We examined in detail the interactions among these stakeholders under various strategy combinations. By identifying and analyzing the stabilization points, we determined the key factors influencing the data-sharing strategies of each party. Based on this analysis, we derived a mechanism to promote the effective operation of the catering data-sharing platform, as illustrated in Figure 16.
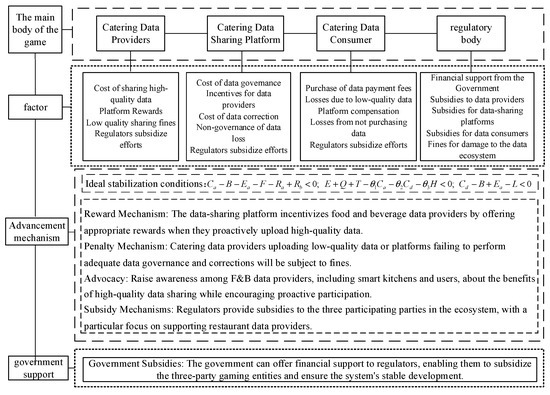
Figure 16.
Catering Data Sharing Promotion Mechanism.
The key conclusions are as follows:
- The effect of the initial strategy of each stakeholder on system stability
The results demonstrate that an increase in the initial propensity of any stakeholder to adopt a cooperative strategy significantly accelerates the convergence of all stakeholders toward the stable equilibrium point. Among all stakeholders, the data-sharing platform and the regulator exert the most pronounced influence on system dynamics. Specifically, when the data-sharing platform adopts a “no data governance” strategy, the system converges to the equilibrium point (0, 0, 0, 0), representing a state of no data sharing, no data governance, no data purchase, and no subsidy. This finding confirms that the platform’s adoption of data governance strategies and the regulator’s implementation of subsidy policies are critical factors in enhancing system performance and promoting effective data sharing and circulation. For restaurants, this implies that their willingness to share data is highly dependent on platform governance and government guidance; for platforms, the results highlight that governance is not optional but a prerequisite for maintaining the ecosystem; and for regulators, it demonstrates that subsidies play a decisive role in preventing system collapse.
- II.
- Influence of key parameters for each stakeholder
- (1).
- When a restaurant data provider chooses to upload data to the data sharing platform, the platform should offer appropriate incentives. Our analysis reveals that when the incentive value is within the range of 10–30, it effectively promotes convergence to a stable cooperative equilibrium, where all parties engage in collaborative behavior. This indicates that restaurants are motivated to provide high-quality data when they see tangible rewards, while platforms can secure stable participation by calibrating incentive levels within this range.
- (2).
- Data sharing platforms that do not implement data governance strategies experience significant losses due to the withdrawal of data providers and consumers. The analysis shows that once these losses exceed the threshold of 30, platforms are compelled to adopt cooperative strategies to retain and attract stakeholders, thereby facilitating convergence to a stable system state. This finding suggests that platforms cannot ignore governance costs indefinitely; the economic pressure forces them to adopt cooperative strategies, which indirectly benefit both restaurants and consumers by stabilizing the environment for data transactions.
- (3).
- The study reveals critical cost-subsidy dynamics across all stakeholder groups. Data providers incur costs when uploading data to sharing platforms, but regulatory subsidies substantially increase their willingness to participate—specifically, when upload costs are 40 and the regulatory subsidy coefficient reaches 0.4, system stability is achieved. Similarly, data-sharing platforms require significant financial resources for governance activities; government subsidies effectively incentivize participation when governance costs are 35 and the subsidy coefficient is set at 0.5. For data consumers, regulatory subsidies can enhance their willingness to purchase data; however, if purchase costs exceed 60 and subsidies are insufficient, consumer participation declines significantly, threatening overall system stability. In practice, this means that restaurants can overcome the burden of data uploading through targeted subsidies, platforms can offset governance expenses with financial support, and consumers are more likely to engage in purchasing data if their costs are balanced by regulatory incentives. Regulators, therefore, must design differentiated subsidy levels tailored to each stakeholder’s cost structure.
- (4).
- Regulatory subsidy strategies require substantial financial investment to support stakeholders throughout the system. The availability of financial backing is a key determinant of regulators’ propensity to implement subsidy policies. The results indicate that when financial support exceeds 60, regulators are more likely to adopt cooperative strategies, thereby enabling comprehensive catering data sharing and circulation. This highlights that regulators’ fiscal capacity directly determines the long-term sustainability of data-sharing ecosystems: without adequate financial resources, even well-designed strategies cannot be maintained.
- III.
- Achieving the optimal evolutionary equilibrium is challenging yet attainable
When all parties adjust their strategies within the recommended parameter ranges, the system can converge to the ideal equilibrium state (1, 1, 1, 1), where
Data providers opt for high-quality sharing.
Platforms actively engage in data governance.
Consumers consistently purchase data.
Regulators continue to provide stable incentives.
This outcome not only aligns with theoretical Nash equilibrium and Lyapunov stability but also provides a practical pathway for advancing the digital transformation of the smart catering industry. Concretely, this means that restaurants can reliably improve data quality while benefiting from incentives, platforms can strengthen governance without incurring unsustainable costs, consumers can enjoy higher service quality with manageable expenses, and regulators can achieve policy objectives of efficiency and innovation in the catering sector.
Based on these findings, we propose the following recommendations:
- (1).
- Prioritize support for data providers and platforms.
Data providers are the primary source of high-quality data, while platforms play a central role in data governance. It is recommended that incentive efforts focus on these two actors, particularly through the provision of technical assistance, operational subsidies, and reputational rewards for entities that consistently share high-quality data.
- (2).
- Establish effective incentive and constraint mechanisms for platform governance.
The platform’s commitment to data governance directly influences the overall quality of the data ecosystem. Regulatory bodies should employ a combination of financial incentives, industry-standard guidance, and clearly defined governance responsibilities to encourage sustained platform investment in data management and oversight.
- (3).
- Optimize consumer incentive structures to enhance data utilization.
While individual subsidies may have a limited effect on consumer behavior, they can still lower the cost of data acquisition and improve usage efficiency. This, in turn, enhances consumers’ willingness to engage in data-related transactions and helps steer the system toward positive strategic evolution.
- (4).
- Dynamically calibrate incentive intensity to prevent systemic volatility.
To avoid the risks of “incentive overload” or diminished effectiveness, it is advisable to implement a feedback-based incentive mechanism. This mechanism would allow for real-time adjustments to subsidy levels based on behavioral data and system responses, thereby enhancing policy adaptability and stability.
The sustainable evolution of the smart catering data-sharing ecosystem depends not only on the optimization of individual participants’ strategies but also on coordinated promotion and mechanism design across regulators, platforms, enterprises, and consumers. This study provides a theoretical framework and policy insights that can inform practical decision-making and contribute to the digital transformation of the catering industry.
- IV.
- Shortcomings and Limitations
Although the conclusions of this study are robust, several limitations should be acknowledged. First, the model parameters are mainly drawn from industry reports and case studies, which, while representative, may not fully capture the heterogeneity of the catering industry across regions and enterprise scales. Second, the simulation results are derived under simplified assumptions (e.g., bounded rationality and homogeneous agent behavior), which inevitably overlook the complexity and diversity of real-world decision-making. Third, the analysis primarily emphasizes two external incentives—government subsidies and platform governance—while giving limited attention to other critical factors such as data security risks, consumer privacy protection, and inter-platform competition. Finally, although illustrative cases such as Meituan’s Merchant Integrity Score provide empirical support, the absence of large-scale empirical validation remains a constraint. Future research could address these limitations by incorporating richer datasets, applying agent-based simulation approaches, and conducting extensive empirical studies to further validate and extend the proposed framework.
9. Prospects
- (1)
- Recent advances have highlighted the use of stochastic differential games to analyze the sensitivity of investors’ terminal returns [40]. At the same time, new methodologies have emerged that offer broad applicability to systems modeled by differential equations, expanding the toolkit for studying complex dynamic processes [42]. In future work, we will integrate more realistic factors—such as the continuous fluctuations in market and policy environments—and further examine how additional uncertainties influence the game process through the application of stochastic differential equation approaches.
- (2)
- Blockchain technology and federated learning can be leveraged to develop catering data-sharing platforms that ensure both the security and efficiency of data, thereby assisting catering enterprises in making more informed decisions and improving management practices. Studies have also demonstrated the effectiveness of blockchain technology in safeguarding original data within the smart food and beverage ecosystem [43].
- (3)
- Ethical considerations regarding data privacy and data sharing will be addressed in subsequent research
Author Contributions
J.X. performed the experimental design, data assignment, and first draft review in this article; S.C. wrote the first draft, implemented the code, and drew the graphs; Z.W. did theoretical analysis, data validation, method optimization; M.Z. designed the research framework, revised the paper, and supervised the project; C.Y. provided experimental resources, discussed results, and final review. All authors have read and agreed to the published version of the manuscript.
Funding
This research was supported by the National Key R&D Program of China (Grant No. 2023YFD2101001).
Data Availability Statement
No new datasets were generated or analyzed during the current. The custom code used in this study was written by the authors and is available upon reasonable request. For access, please contact the corresponding author.
Conflicts of Interest
The authors declare no conflicts of interest.
References
- Wang, F.; Jiang, J.; Cosenz, F. Understanding data-driven business model innovation in complexity: A system dynamics approach. J. Bus. Res. 2025, 186, 114967. [Google Scholar] [CrossRef]
- Chang, V.; Ji, Z.; Xu, Q.A. Big data applications in Guangzhou restaurants analysis. Big Data 2021, 9, 358–372. [Google Scholar] [CrossRef] [PubMed]
- China Hospitality Association. 2024 Report on The Development of China’s Catering Industry in Chinese; China Hospitality Association: Beijing, China, 2024. [Google Scholar]
- China Internet Network Information Center. The 53rd Statistical Report on Internet Development in China; China Internet Network Information Center: Beijing, China, 2024. [Google Scholar]
- Gao, Y.; Zhu, Z.; Yang, J. An evolutionary game analysis of stakeholders’ decision-making behavior in medical data sharing. Mathematics 2023, 11, 2921. [Google Scholar] [CrossRef]
- Yu, H.; He, X. Corporate Data Sharing, Leakage, and Supervision Mechanism Research. Sustainability 2021, 13, 931. [Google Scholar] [CrossRef]
- Xu, C.; Zhu, P.; Wang, J.; Fortino, G. Improving the local diagnostic explanations of diabetes mellitus with the ensemble of label noise filters. Inf. Fusion 2025, 117, 102928. [Google Scholar] [CrossRef]
- Devriendt, T.; Shabani, M.; Lekadir, K.; Borry, P. Data sharing platforms: Instruments to inform and shape science policy on data sharing? Scientometrics 2022, 127, 3007–3019. [Google Scholar] [CrossRef]
- Hu, J.; Zhu, P.; Li, J.; Qi, Y.; Xia, Y.; Wang, F.-Y. A Secure Medical Information Storage and Sharing Method Based on Multiblockchain Architecture. IEEE Trans. Comput. Soc. Syst. 2024, 11, 6392–6406. [Google Scholar] [CrossRef]
- Spengler, H.; Gatz, I.; Kohlmayer, F.; Kuhn, K.A.; Prasser, F. Improving data quality in medical research: A monitoring architecture for clinical and translational data warehouses. In Proceedings of the 2020 IEEE 33rd International Symposium on Computer-Based Medical Systems (CBMS), Rochester, MN, USA, 22–24 July 2020; pp. 415–420. [Google Scholar]
- Oktaviana, S.; Handayani, P.W.; Hidayanto, A.N. Health Data Governance Issues in Healthcare Facilities: Perspective of Hospital Management. In Proceedings of the 2022 10th International Conference on Information and Communication Technology (ICoICT), Bandung, Indonesia, 2–3 August 2022; pp. 1–5. [Google Scholar]
- Geng, Y.; Xiang, X.; Zhang, G.; Li, X. Digital transformation along the supply chain: Spillover effects from vertical partnerships. J. Bus. Res. 2024, 183, 114842. [Google Scholar] [CrossRef]
- Mukesh, H.V. Digital transformation taking centre stage: How is digital transformation reshaping entrepreneurial innovation? J. Entrep. 2022, 31, 364–401. [Google Scholar] [CrossRef]
- Marczewska, M. Digital transformation: A challenging opportunity for the food industry companies. Br. Food J. 2024, 126, 2027–2040. [Google Scholar] [CrossRef]
- China Chain Store and Franchise Association. Digital Transformation Report; China Chain Store and Franchise Association: Beijing, China, 2024. (In Chinese) [Google Scholar]
- Li, Y.; Zou, H.; Qin, H.; Liu, B.; Ji, H. Research on Government Incentive and Enterprise Data Resource Sharing Strategies in Digital Innovation Ecosystems; IEEE Access: Piscataway, NJ, USA, 2024. [Google Scholar]
- Lee, W.; Jang, S.C.S.; Kim, H.S. The effect of digital transformation: Boosting productivity in the restaurant industry. Int. J. Hosp. Manag. 2024, 123, 103896. [Google Scholar] [CrossRef]
- Sun, Y.; He, J.; Xiang, Q.; Zhou, K. Leveraging intergovernmental data sharing for digital transformation in ecological and environmental protection. J. Clean. Prod. 2024, 477, 143780. [Google Scholar] [CrossRef]
- Jaiman, V.; Pernice, L.; Urovi, V. User incentives for blockchain-based data sharing platforms. PLoS ONE 2022, 17, e0266624. [Google Scholar] [CrossRef] [PubMed]
- Tajabadi, M.; Grabenhenrich, L.; Ribeiro, A.; Leyer, M.; Heider, D. Sharing Data With Shared Benefits: Artificial Intelligence Perspective. J. Med. Internet Res. 2023, 25, e47540. [Google Scholar] [CrossRef] [PubMed]
- Shtal, T.V.; Staverska, T.O.; Svitlichna, V.Y.; Kravtsova, S.V.; Kraynyuk, L.N.; Pokolodna, M.M. Digitalization as a tool for ensuring innovative development of restaurant business. Stud. Appl. Econ. 2021, 39. [Google Scholar] [CrossRef]
- Sanders, N.R.; Ganeshan, R. Big Data in Supply Chain Management. Prod. Oper. Manag. 2018, 30, 237–244. [Google Scholar] [CrossRef]
- Ji, G.; Hu, L.; Tan, K.H. A study on decision-making of food supply chain based on big data. J. Syst. Sci. Syst. Eng. 2017, 26, 183–198. [Google Scholar] [CrossRef]
- Viglia, G.; De Canio, F.; Stoppani, A.; Invernizzi, A.C.; Cerutti, S. Adopting revenue management strategies and data sharing to cope with crises. J. Bus. Res. 2021, 137, 336–344. [Google Scholar] [CrossRef]
- Zhu, P.; Miao, C.; Wang, Z.; Li, X. Informational cascade, regulatory focus and purchase intention in online flash shop. Electron. Commer. Res. Appl. 2023, 62, 101343. [Google Scholar] [CrossRef]
- Jonkman, J.; Badraoui, I.; Verduijn, T. Data sharing in food supply chains and the feasibility of cross-chain data platforms for added value. Transp. Res. Procedia 2022, 67, 21–30. [Google Scholar] [CrossRef]
- Wong, I.K.A.; Huang, J.; Lin, Z.; Jiao, H. Smart dining, smart restaurant, and smart service quality (SSQ). Int. J. Contemp. Hosp. Manag. 2022, 34, 2272–2297. [Google Scholar] [CrossRef]
- Bei, H.; Zhang, J.; Yang, T. Development Strategies for Green Methanol in the Shipping Industry with Government Subsidies: An Analysis Based on Evolutionary Game and System Dynamics. J. Clean. Prod. 2025, 207, 145520. [Google Scholar] [CrossRef]
- Garcia-Haro, J.M.; Oña, E.D.; Hernandez-Vicen, J.; Martinez, S.; Balaguer, C. Service robots in catering applications: A review and future challenges. Electronics 2020, 10, 47. [Google Scholar] [CrossRef]
- Tang, X.; Lan, T.; Zhong, H.; Li, D.; Miao, Q. An evolutionary game model for indirect data sharing in manufacturing big data consortium. Expert Syst. Appl. 2024, 255, 124807. [Google Scholar] [CrossRef]
- Li, D.; Mei, X. Evolutionary game analysis of data sharing among large and medium-sized enterprises in the perspective of platform empowerment. Sci. Rep. 2024, 14, 11447. [Google Scholar] [CrossRef]
- Zhang, L.; Lu, Q.; Huang, R.; Chen, S.; Yang, Q.; Gu, J. A Dynamic Incentive Mechanism for Smart Grid Data Sharing Based on Evolutionary Game Theory. Energies 2023, 16, 8125. [Google Scholar] [CrossRef]
- Dong, C.; Liu, J.; Mi, J. How to enhance data sharing in digital government construction: A tripartite stochastic evolutionary game approach. Systems 2023, 11, 212. [Google Scholar] [CrossRef]
- Liu, W.; Long, S.; Wei, S.; Xie, D.; Wang, J.; Liu, X. Smart logistics ecological cooperation with data sharing and platform empowerment: An examination with evolutionary game model. Int. J. Prod. Res. 2022, 60, 4295–4315. [Google Scholar] [CrossRef]
- Fan, Z.; Zhou, Z.; Zhang, W. Game analysis of enterprise data sharing from a supply chain perspective. Heliyon 2024, 10, e25678. [Google Scholar] [CrossRef]
- Van der Burg, S.; Wiseman, L.; Krkeljas, J. Trust in farm data sharing: Reflections on the EU code of conduct for agricultural data sharing. Ethics Inf. Technol. 2021, 23, 185–198. [Google Scholar] [CrossRef]
- Zhao, H.; Yang, J. Evolutionary game analysis of stakeholders’ decision-making behavior in agricultural data supply chain. Front. Phys. 2024, 11, 1321973. [Google Scholar] [CrossRef]
- Liu, W.; Li, Y. Four-party evolutionary game analysis of third-party recycling treatment of livestock and poultry breeding waste. J. Clean. Prod. 2023, 415, 137829. [Google Scholar] [CrossRef]
- Xing, Y.; Yu, G. Beijing Catering Industry Development Report 2023. In Blue Book of Catering Industry: Report on the Development of China’s Catering Industry; Social Sciences Academic Press: Beijing, China, 2024. [Google Scholar]
- Savku, E.; Weber, G.W. Stochastic differential games for optimal investment problems in a Markov regime-switching jump-diffusion market. Ann. Oper. Res. 2022, 312, 1171–1196. [Google Scholar] [CrossRef]
- Standing Committee of the National People’s Congress. Data Security Law of the People’s Republic of China; Promulgated une 10, 2021; Effective 1 September 2021; Standing Committee of the National People’s Congress: Beijing, China, 2021. [Google Scholar]
- Bonnaffé, W.; Sheldon, B.C.; Coulson, T. Neural ordinary differential equations for ecological and evolutionary time-series analysis. Methods Ecol. Evol. 2021, 12, 1301–1315. [Google Scholar] [CrossRef]
- Zhu, P.; Hu, J.; Li, X.; Zhu, Q. Using blockchain technology to enhance the traceability of original achievements. IEEE Trans. Eng. Manag. 2021, 70, 1693–1707. [Google Scholar] [CrossRef]
Disclaimer/Publisher’s Note: The statements, opinions and data contained in all publications are solely those of the individual author(s) and contributor(s) and not of MDPI and/or the editor(s). MDPI and/or the editor(s) disclaim responsibility for any injury to people or property resulting from any ideas, methods, instructions or products referred to in the content. |
© 2025 by the authors. Licensee MDPI, Basel, Switzerland. This article is an open access article distributed under the terms and conditions of the Creative Commons Attribution (CC BY) license (https://creativecommons.org/licenses/by/4.0/).