Article

Study of Ventilation Strategies in a Passenger Aircraft Cabin Using Numerical Simulation

by
S. M. Abdul Khader
1,
John Valerian Corda
2,3,
Kevin Amith Mathias
1,
Gowrava Shenoy
1,
Kamarul Arifin bin Ahmad
4,
Augustine V. Barboza
1,
Sevagur Ganesh Kamath
5 and
Mohammad Zuber
3,*
1
Department of Mechanical and Industrial Engineering, Manipal Institute of Technology, Manipal Academy of Higher Education, Manipal 576104, Karnataka, India
2
Department of Mechanical Engineering, Moodlakatte Institute of Technology, Kundapura 576201, Karnataka, India
3
Department of Aeronautical and Automobile Engineering, Manipal Institute of Technology, Manipal Academy of Higher Education, Manipal 576104, Karnataka, India
4
Department of Aerospace Engineering, Fakulti of Engineering, Universiti Putra Malaysia, Serdang 43300, Malaysia
5
Department of Cardiothoracic and Vascular Surgery, Kasturba Medical College, Manipal Academy of Higher Education, Manipal 576104, Karnataka, India
*
Author to whom correspondence should be addressed.
Computation 2025, 13(1), 1; https://doi.org/10.3390/computation13010001
Submission received: 5 November 2024 / Revised: 10 December 2024 / Accepted: 10 December 2024 / Published: 24 December 2024
(This article belongs to the Special Issue Advances in Computational Methods for Fluid Flow)

Abstract

:
Aircraft cabins have high occupant densities and may introduce the risk of COVID-19 contamination. In this study, a segment of a Boeing 767 aircraft cabin with a mixing type of air distribution system was investigated for COVID-19 deposition. A section of a Boeing 737-300 cabin, featuring four rows with 28 box-shaped mannequins, was used for simulation. Conditioned air entered through ceiling inlets and exited near the floor, simulating a mixed air distribution system. Cough droplets were modeled using the Discrete Phase Model from two locations: the centre seat in the second row and the window seat in the fourth row. These droplets had a mean diameter of 90 µm, an exhalation velocity of 11.5 m/s and a flow rate of 8.5 L/s. A high-quality polyhedral mesh of about 7.5 million elements was created, with a skewness of 0.65 and an orthogonality of 0.3. The SIMPLE algorithm and a second-order upwind finite volume method were used to model airflow and droplet dynamics. It was found that the ceiling accounted for the maximum concentration followed by the seats. The concentration of deposits was almost 50% more when the source was at window as compared to the centre seat. The Covid particles resided for longer duration when the source was at the centre of the cabin than when it was located near the widow.

1. Introduction

More than one billion passengers travel by air annually, and air travel is the most popular mode of transport for humans nowadays [1]. It has in a true sense been responsible for a globalized world. This has not only ushered in more inter-country human travel but has also facilitated the rapid spread of deadly diseases [2]. Contaminant transport includes some of the infectious diseases such as SARS, H1N1, influenza and the COVID-19 pandemic, which infect humans through airborne particles carrying these diseases [3,4,5,6]. It is highly essential to understand the airflow and behaviour of contaminant transport inside an aircraft cabin in order to minimize the effects of airborne virus particulates [7,8]. The droplets that are expelled from passengers’ mouths and noses while coughing, sneezing or talking mainly require close contact so as to transport the droplets in a direct contact spread [9,10,11,12]. Also, the droplets that present on a cabin’s chairs or windows can also be easily transmitted to passengers during contact and termed as indirect spread. The contaminant transport in an aircraft’s cabin have been estimated either using experimental flow visualization studies or numerical simulations [13,14]. Computational fluid dynamics (CFD) is a very useful, cost-effective and reliable approach that can provide high-resolution results for evaluating airflow behaviour in an aircraft cabin [14]. CFD simulations have been used to determine the various aircraft indoor-air circulation parameters such as performance of the ventilation system, human influences on the conditioning of the indoor air and the thermal plume of a mannequin [15,16,17,18]. The airflow in cabin ventilation works at an elevated velocity, entering through the overhead region and returning through the floor, resulting in air mixture through the cabin’s volume. Such a type of ventilation system can potentially increase the spread of infectious diseases through the cabin [19]. Some CFD studies that have predicted airflow patterns and contaminant transport through sources in a cabin have testified that the flow in an aircraft or bus cabin is quite complex [20]. The weak longitudinal flow plays a significant role in the spread of contaminants in a cabin. The cross-infections inside aircraft cabins have been attributed to the indoor cabin environment [21]. The spread of contaminants released from single sources or from passengers’ mouths in a small section of a seven-row aircraft cabin was investigated using CFD. It was observed that the contaminant source entrapped in the vortex sheet had a higher particle mass concentration and a longer particle residence time [22].
The spread of COVID-19 and its deposition intensity at different seating positions has not been evaluated in any earlier studies. Thus, in this study, the spread of cough droplets due to local airflow was investigated in a medium-sized aircraft cabin (Boeing 737) using CFD. Contaminants ejected by coughing were released from a suspected COVID passenger. The simulation was carried out for a passenger sitting at two different locations (centre seat and window seat), using the discrete particle method (DPM) in ANSYS Fluent software.

2. Methodology

2.1. CFD Theory

In the present study, the airflow inside the aircraft cabin was evaluated using incompressible Navier–Stokes equations with an ANSYS Fluent V 2020. Fluent solver was used to solve the appropriate conservation equations for mass, momentum, turbulence variables and expiratory droplet movement. In aircraft cabins, turbulent features can be effectively predicted using the Renormalization group (RNG) k-epsilon model, and it is better than the standard k-epsilon model of airflow [21,23,24]. Hence, the present simulation study adopted the RNG k-epsilon model to evaluate the turbulence behaviour in an aircraft cabin. The Lagrangian particle-tracking methodology was adopted in this study. The present study also employed the Boussinesq assumption to account for the buoyancy effect. For the (RNG) k-ε models, it was necessary to use the wall function to solve the fluid velocity in the viscous sublayer near the wall.
The behaviour of cough droplets induced from the passenger can be investigated using the discrete phase model in ANSYS Fluent. There is a one-way coupling between the air flow and cough droplet transport, with the flow affecting the particle transport, while the particle concentration is too dilute to affect the flow. The cough droplet trajectory can be easily predicted by integration through force balance on these droplets. Furthermore, the balancing of the forces of the droplet will be equal to the inertia of droplet, considering all the forces which affect the droplet [24].

2.2. CFD Modelling and Analysis

The present study emphasised the distribution and transmission of cough droplets in an economy-class aircraft cabin. A section of the aircraft cabin model was generated based on a typical medium-sized commercial airliner (Boeing 737-300) [25]. The cabin model section consisted of four rows, and each row had seven seats that were fully occupied, as shown in Figure 1. The maximum width of the cabin was 4.72 m, the maximum height was 2.10 m, and the aisle width was 0.48 m. The passengers in the cabin were portrayed by 28 box-shaped mannequins, and the total surface area of a mannequin was about 1.8 m2 [26]. The mixing type of air distribution system was considered in this study. Conditioned air at a high velocity was supplied through the two ceiling inlets, and two outlets were provided to extract air at floor level near the side walls.
The inlet-supplied air was a mixture of outside air and recirculated air, and it was assumed to be 10 L/s per person [27].
The transmission of cough droplets that were exhaled from the passenger’s mouth was replicated on a small circular area on the passenger’s seat. The mannequin model was not used in this study. The properties and characteristics of the cough droplets are shown in Table 1 [23]. The discrete-particle model approach was adopted to model the turbulent dispersion of the droplets. This approach helped in understanding and predicting the behaviour of these droplets. The trajectory equations of these individual droplets were integrated using fluid velocity along the droplet’s path. The contaminant’s source for the release of the cough droplets was considered at two different locations, (i) second-row centre seat and (ii) fourth-row window seat, to evaluate the droplet distribution on various zones of the aircraft cabin.
In this study, ANSYS Fluent Meshing was used to generate polyhedral mesh for the CFD simulation. The grid independence tests were carried out for the present model at a specified mass-flow inlet boundary condition. Changes in velocity were monitored for the various grid sizes of a plane. The grid-independence test was performed for grid numbers of 2.6 million, 7.5 million, and 11.7 million. The air velocity profiles were checked along horizontal lines and vertical lines at the cross section. The results with 7.5 million cells were nearly the same as those with 11.7 million cells and were close to the literature data. The mesh sizes for the passengers and seats were about 25 mm each, and were about 40 mm for the rest of the space. The size change was controlled to be less than 20% to reduce numerical diffusion. The quality mesh was generated in the domain with a skewness of 0.65 and an orthogonality mesh index of 0.3. The maximum grid size in the space was around 40 mm, the minimum grid size was 3 mm, and the total grid size was roughly 7.5 million. Therefore, in this study, roughly 7.5 million was selected for further investigations.
ANSYS Fluent solved the algebraic equations by integrating all the mesh elements, as these equations are highly nonlinear and iteration is essential to arrive at a converged solution. In this study, the SIMPLE algorithm was used to couple the pressure and velocity with a suitable and segregated steady-state solver [19]. The partial differential equations were discretized into algebraic equations by using the finite volume method with a second-order upwind scheme. The variables solved were air velocity (all components), turbulent kinetic energy, turbulent dissipation rate, particle concentration, particle velocity and diameter.

3. Results and Discussion

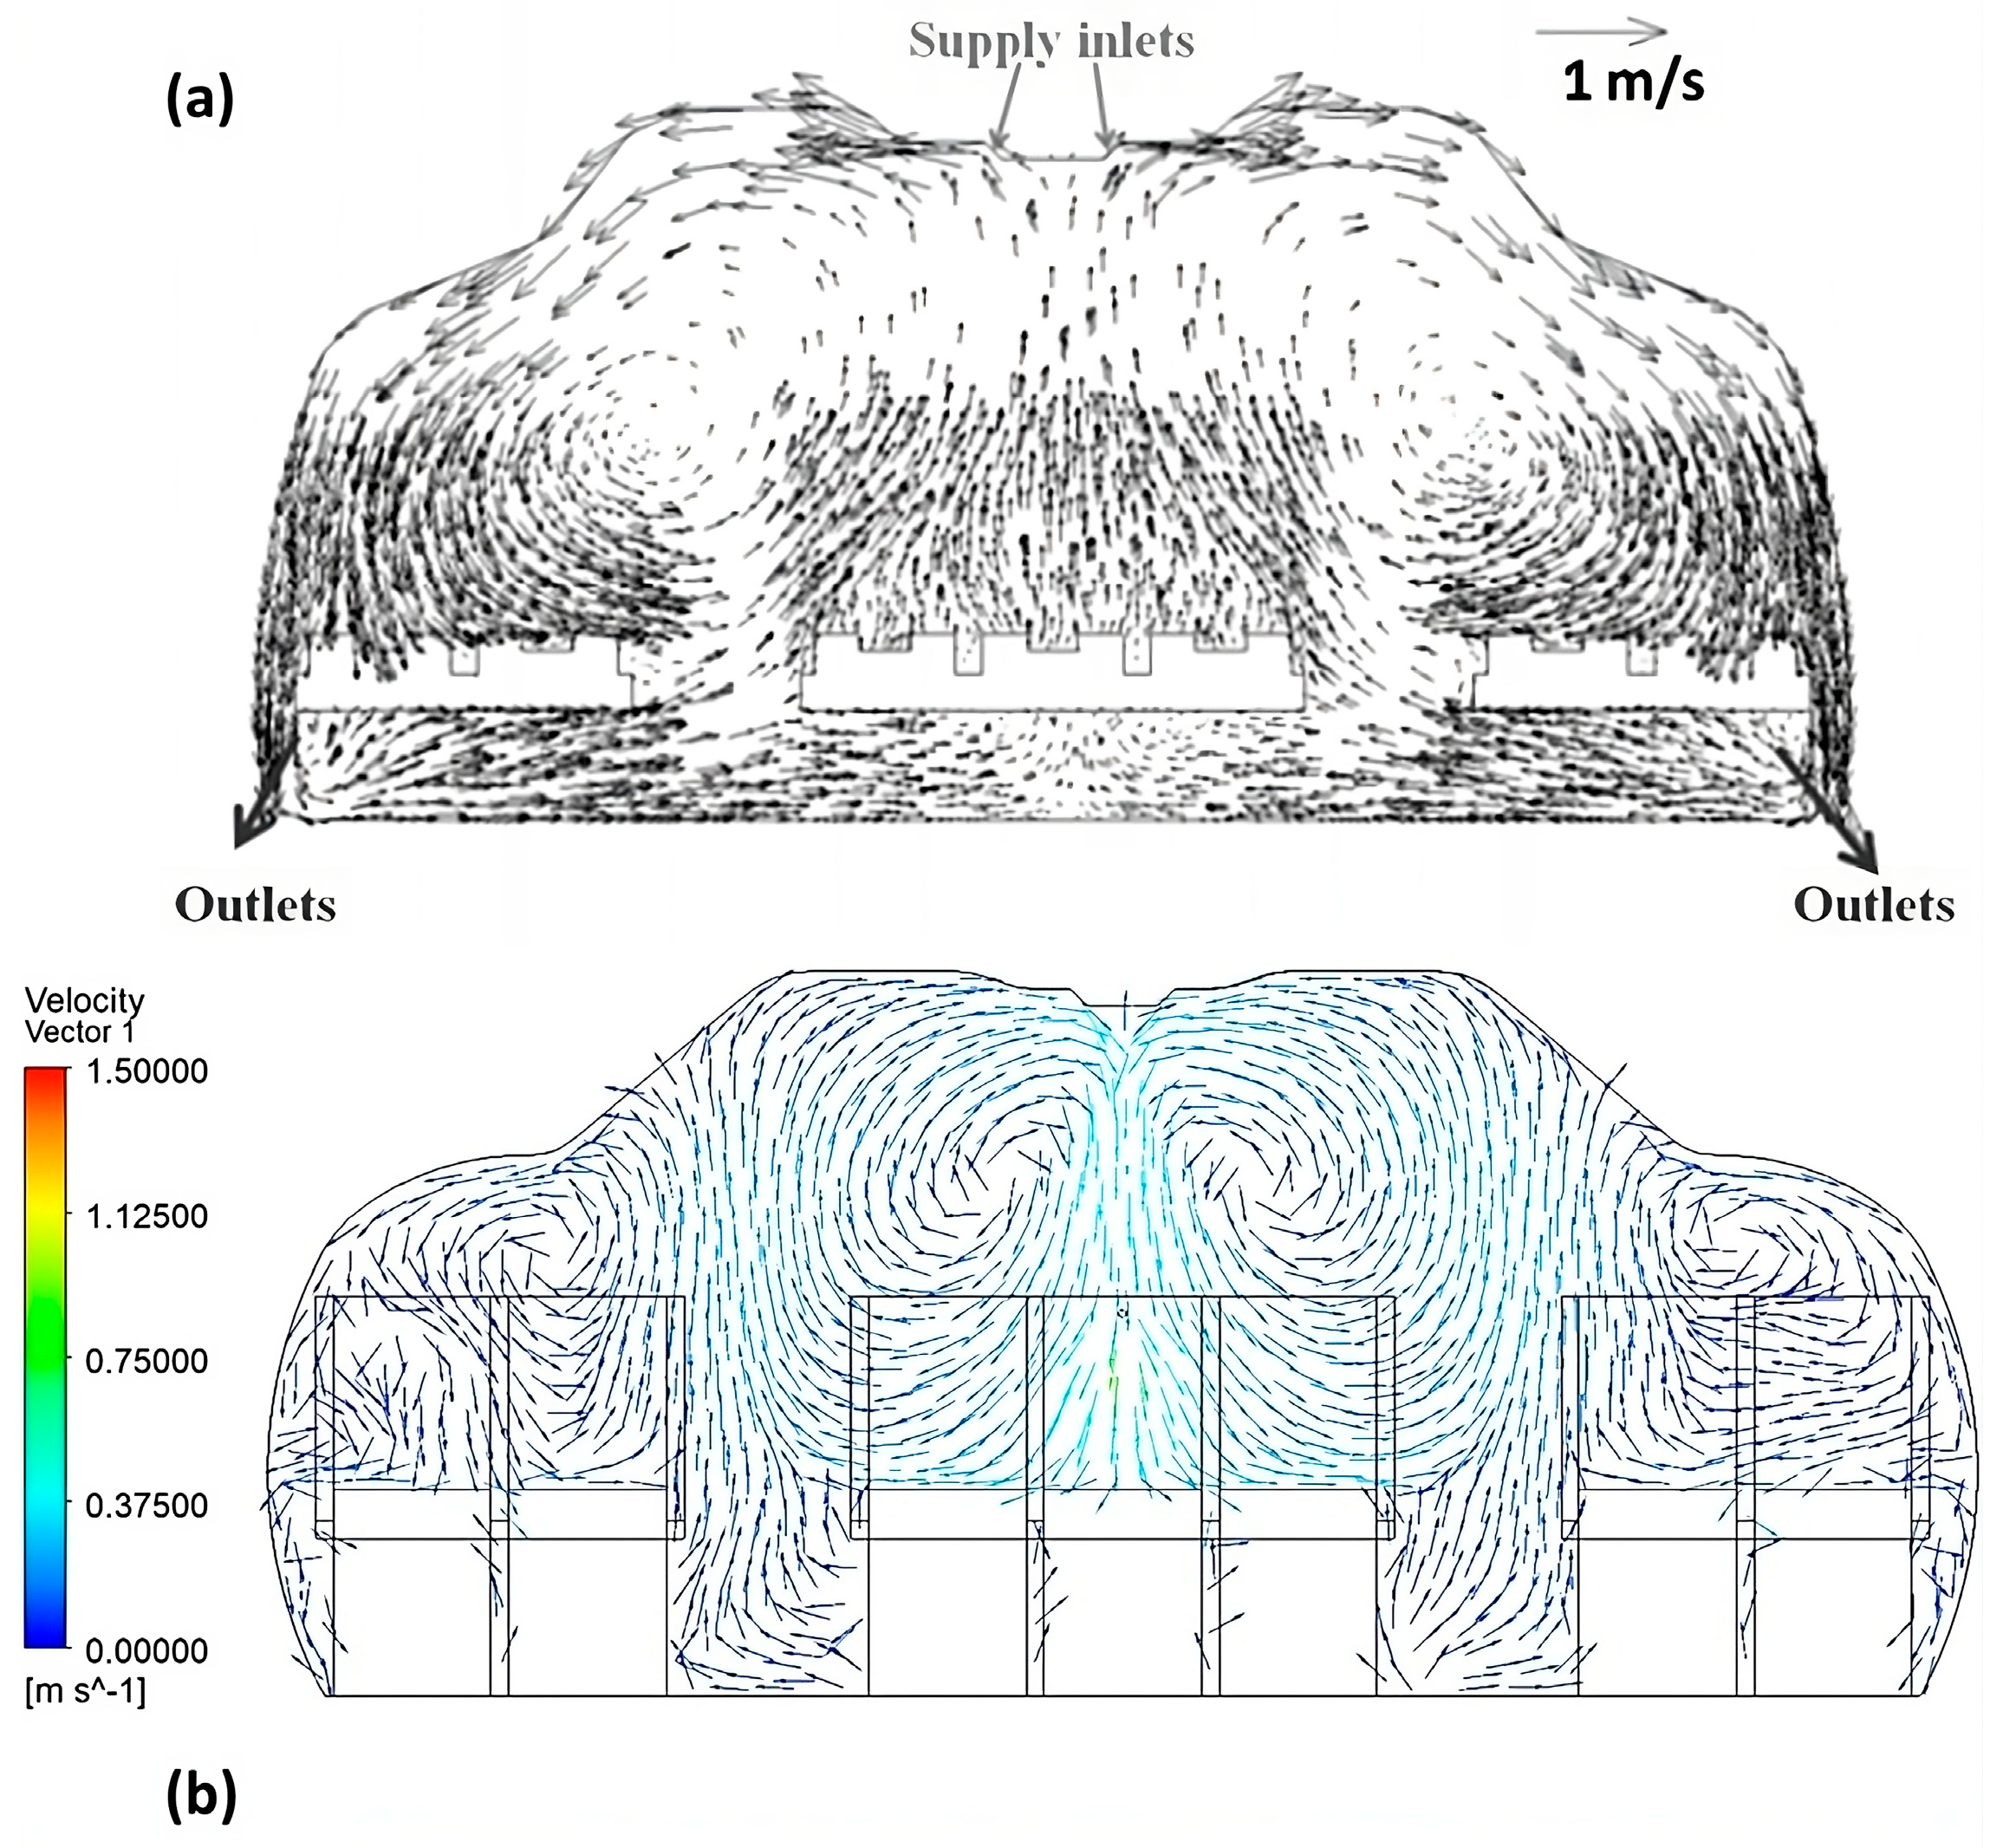
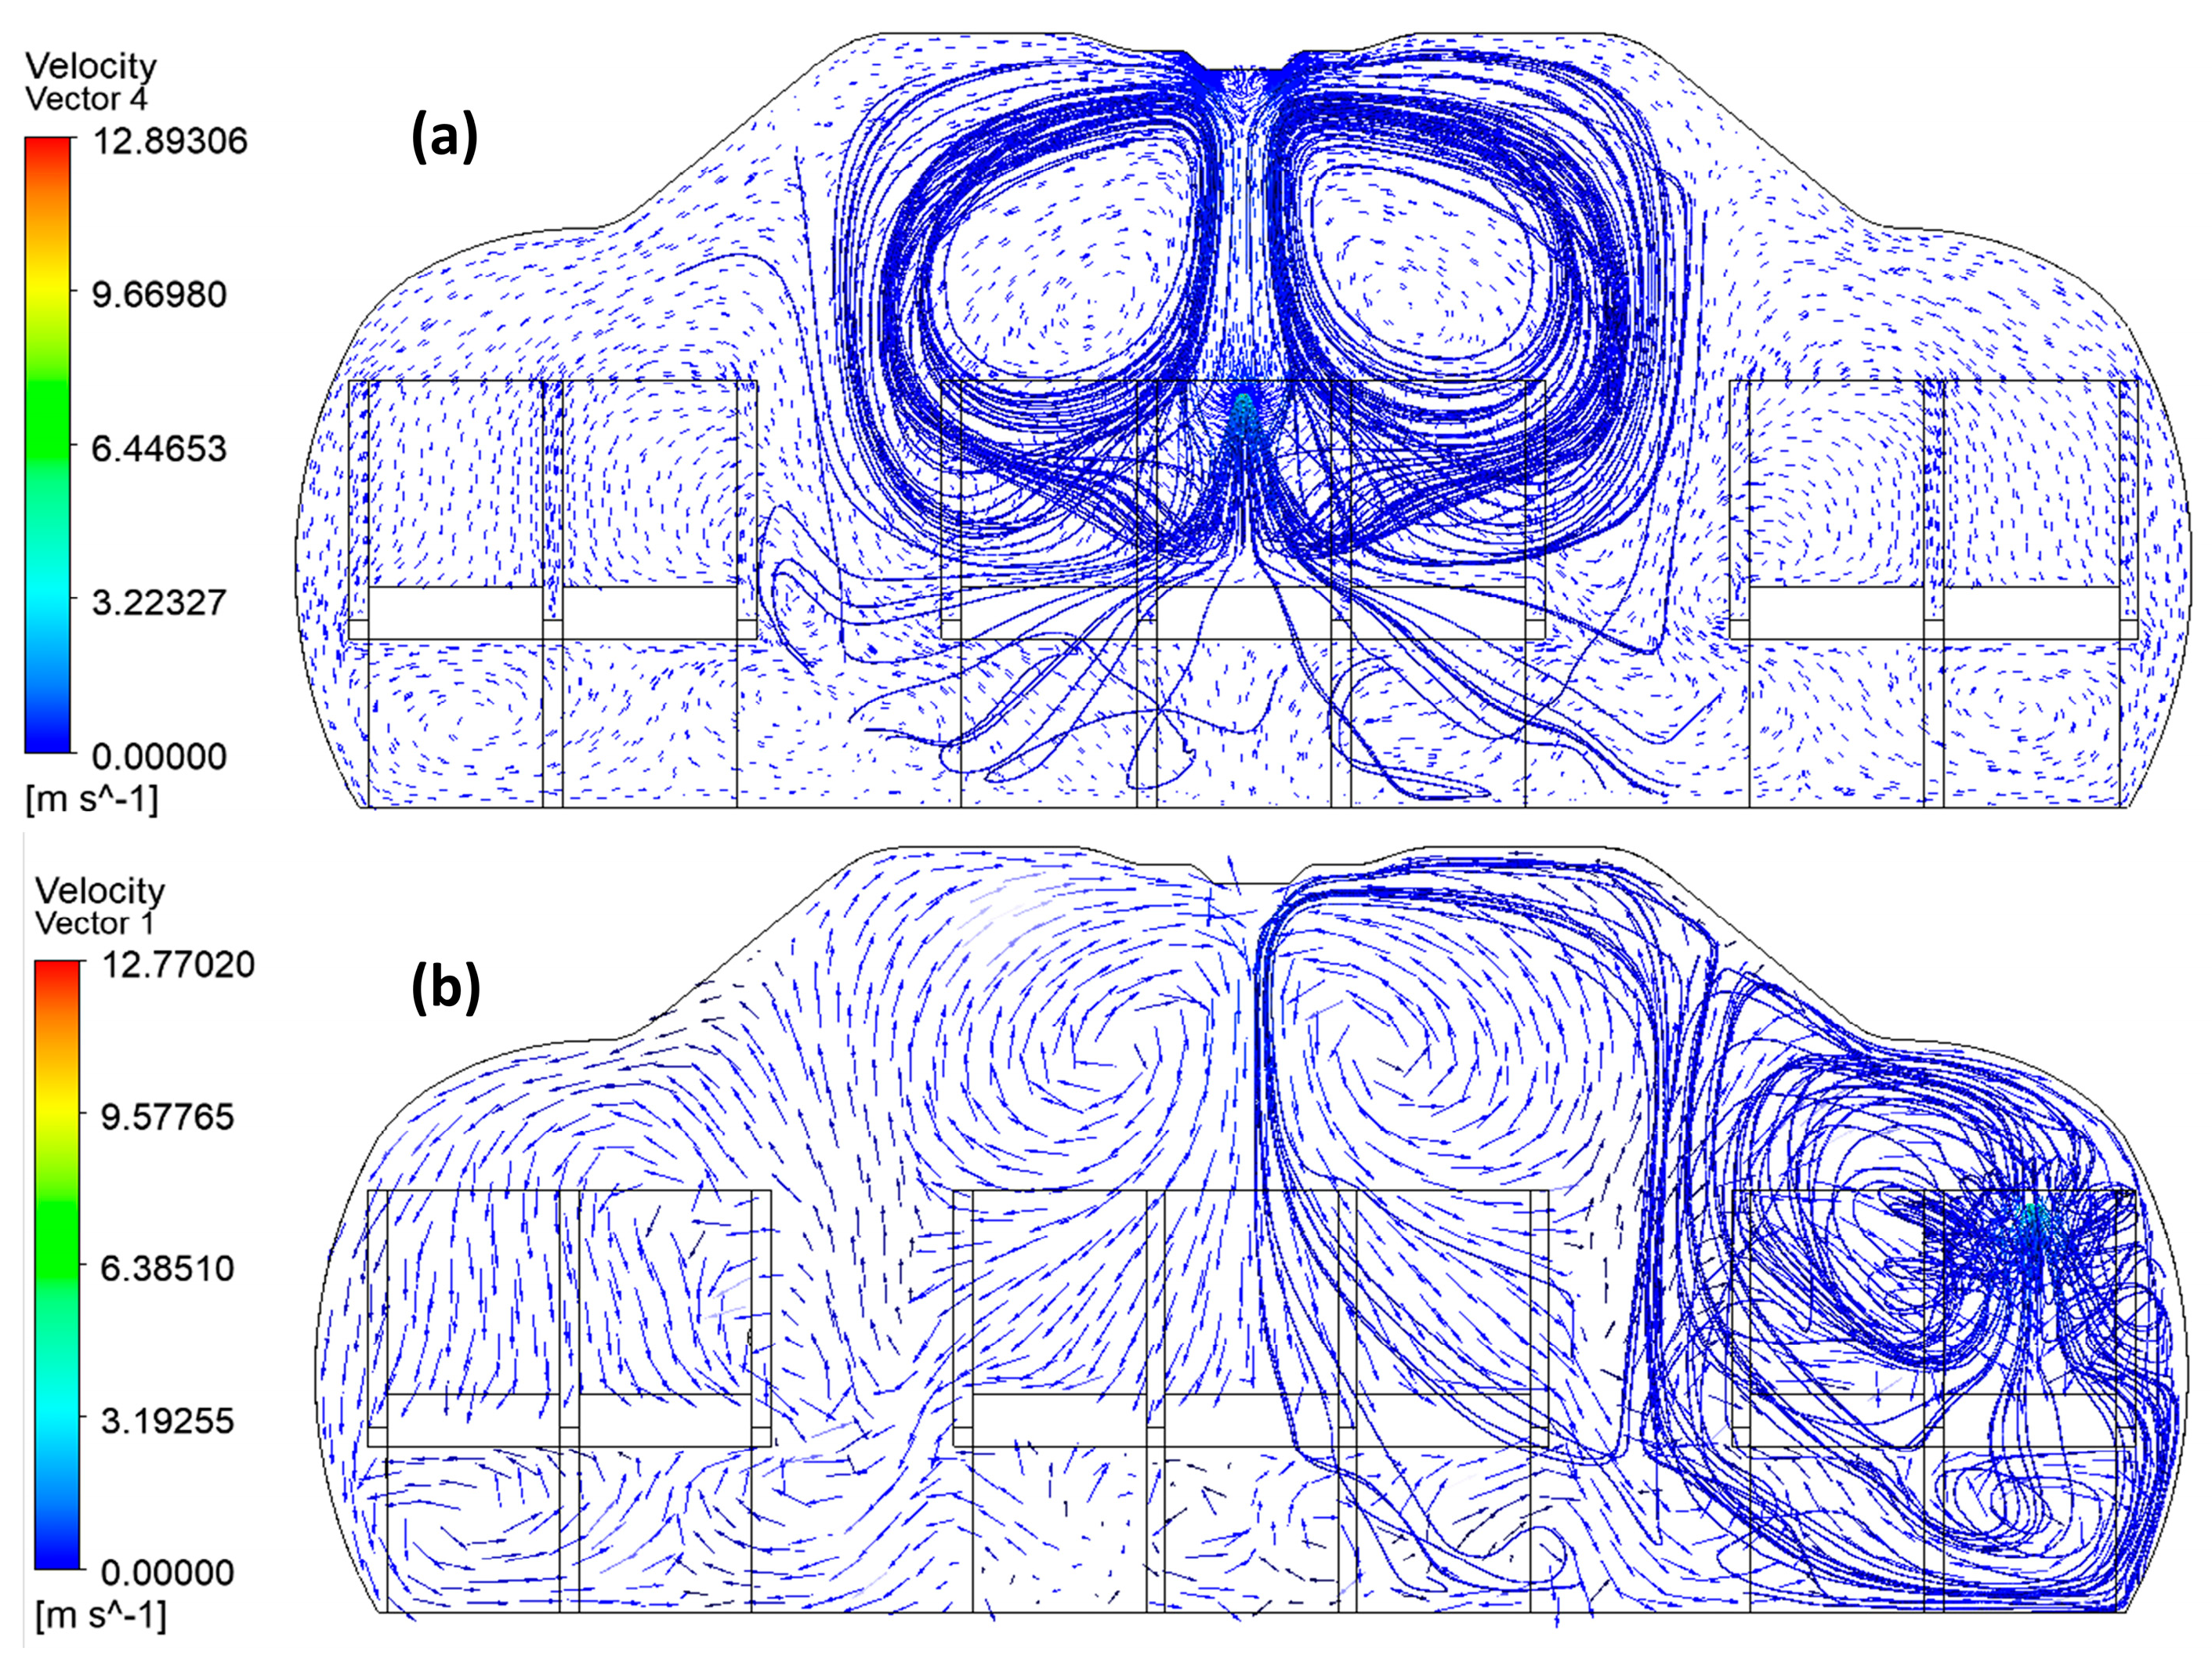
The present study investigated the behaviour of airflow, cough droplets and their transmission in a section of a Boeing 767-300 aircraft cabin. The COVID-19 particles were released as cough droplets from two different locations: (a) a second-row centre seat and (b) a fourth-row window seat. The air distribution inside the aircraft cabin is depicted as vector plots in Figure 2. This distribution pattern is typical of the mixed ventilation system adopted in most studies [15,28]. This study qualitatively and quantitatively compared the CFD results with that of the literature data to evaluate the CFD performance. The air enters the aircraft cabin from the ceiling through supply inlets and is extracted from the outlets located on the bottom walls of the cabin close to the floor. A distinguished pattern of flow is observed, with high recirculatory flow regions in the central dome and on the corners. Identical flow patterns have been reported in the literature [2,13]. This pattern is useful for providing comfortable flow to the passengers and aids in heat convection [16].
It is difficult to determine the risk of an infectious disease experimentally in the limited space of an aircraft cabin. Studies have proven that during flights longer than 8 h, symptom-free passengers seated in an aircraft cabin are at greater risk of contracting a disease, and those seated within two rows of a contagious source are particularly affected [7,29,30]. Although cabin air changes frequently and the usage of HEPA filtration technique for recirculated air limits the spread of contagion [3], these factors cannot prevent an infected passenger from contacting a neighboring passenger. In order to understand the Covid droplets’ spread in the aircraft cabin, two separate locations of cough sources were considered in this study: (a) a second-row centre seat and (b) a fourth-row window seat. The cough droplets released from the mouth of an infected individual were modelled as a small circular source, and their deposition on various surfaces of the aircraft cabin were investigated. The ventilation system is a crucial determinant in mitigating the spread of infection [31]. In a previous study, it was shown that the associated spread of tuberculosis is almost zero for passengers seated 15 seats away from the infectious source [21]. The recirculating airflow patterns observed in the mixed ventilation system used in this study can carry the contaminants ejected from the patient mouth during coughing.
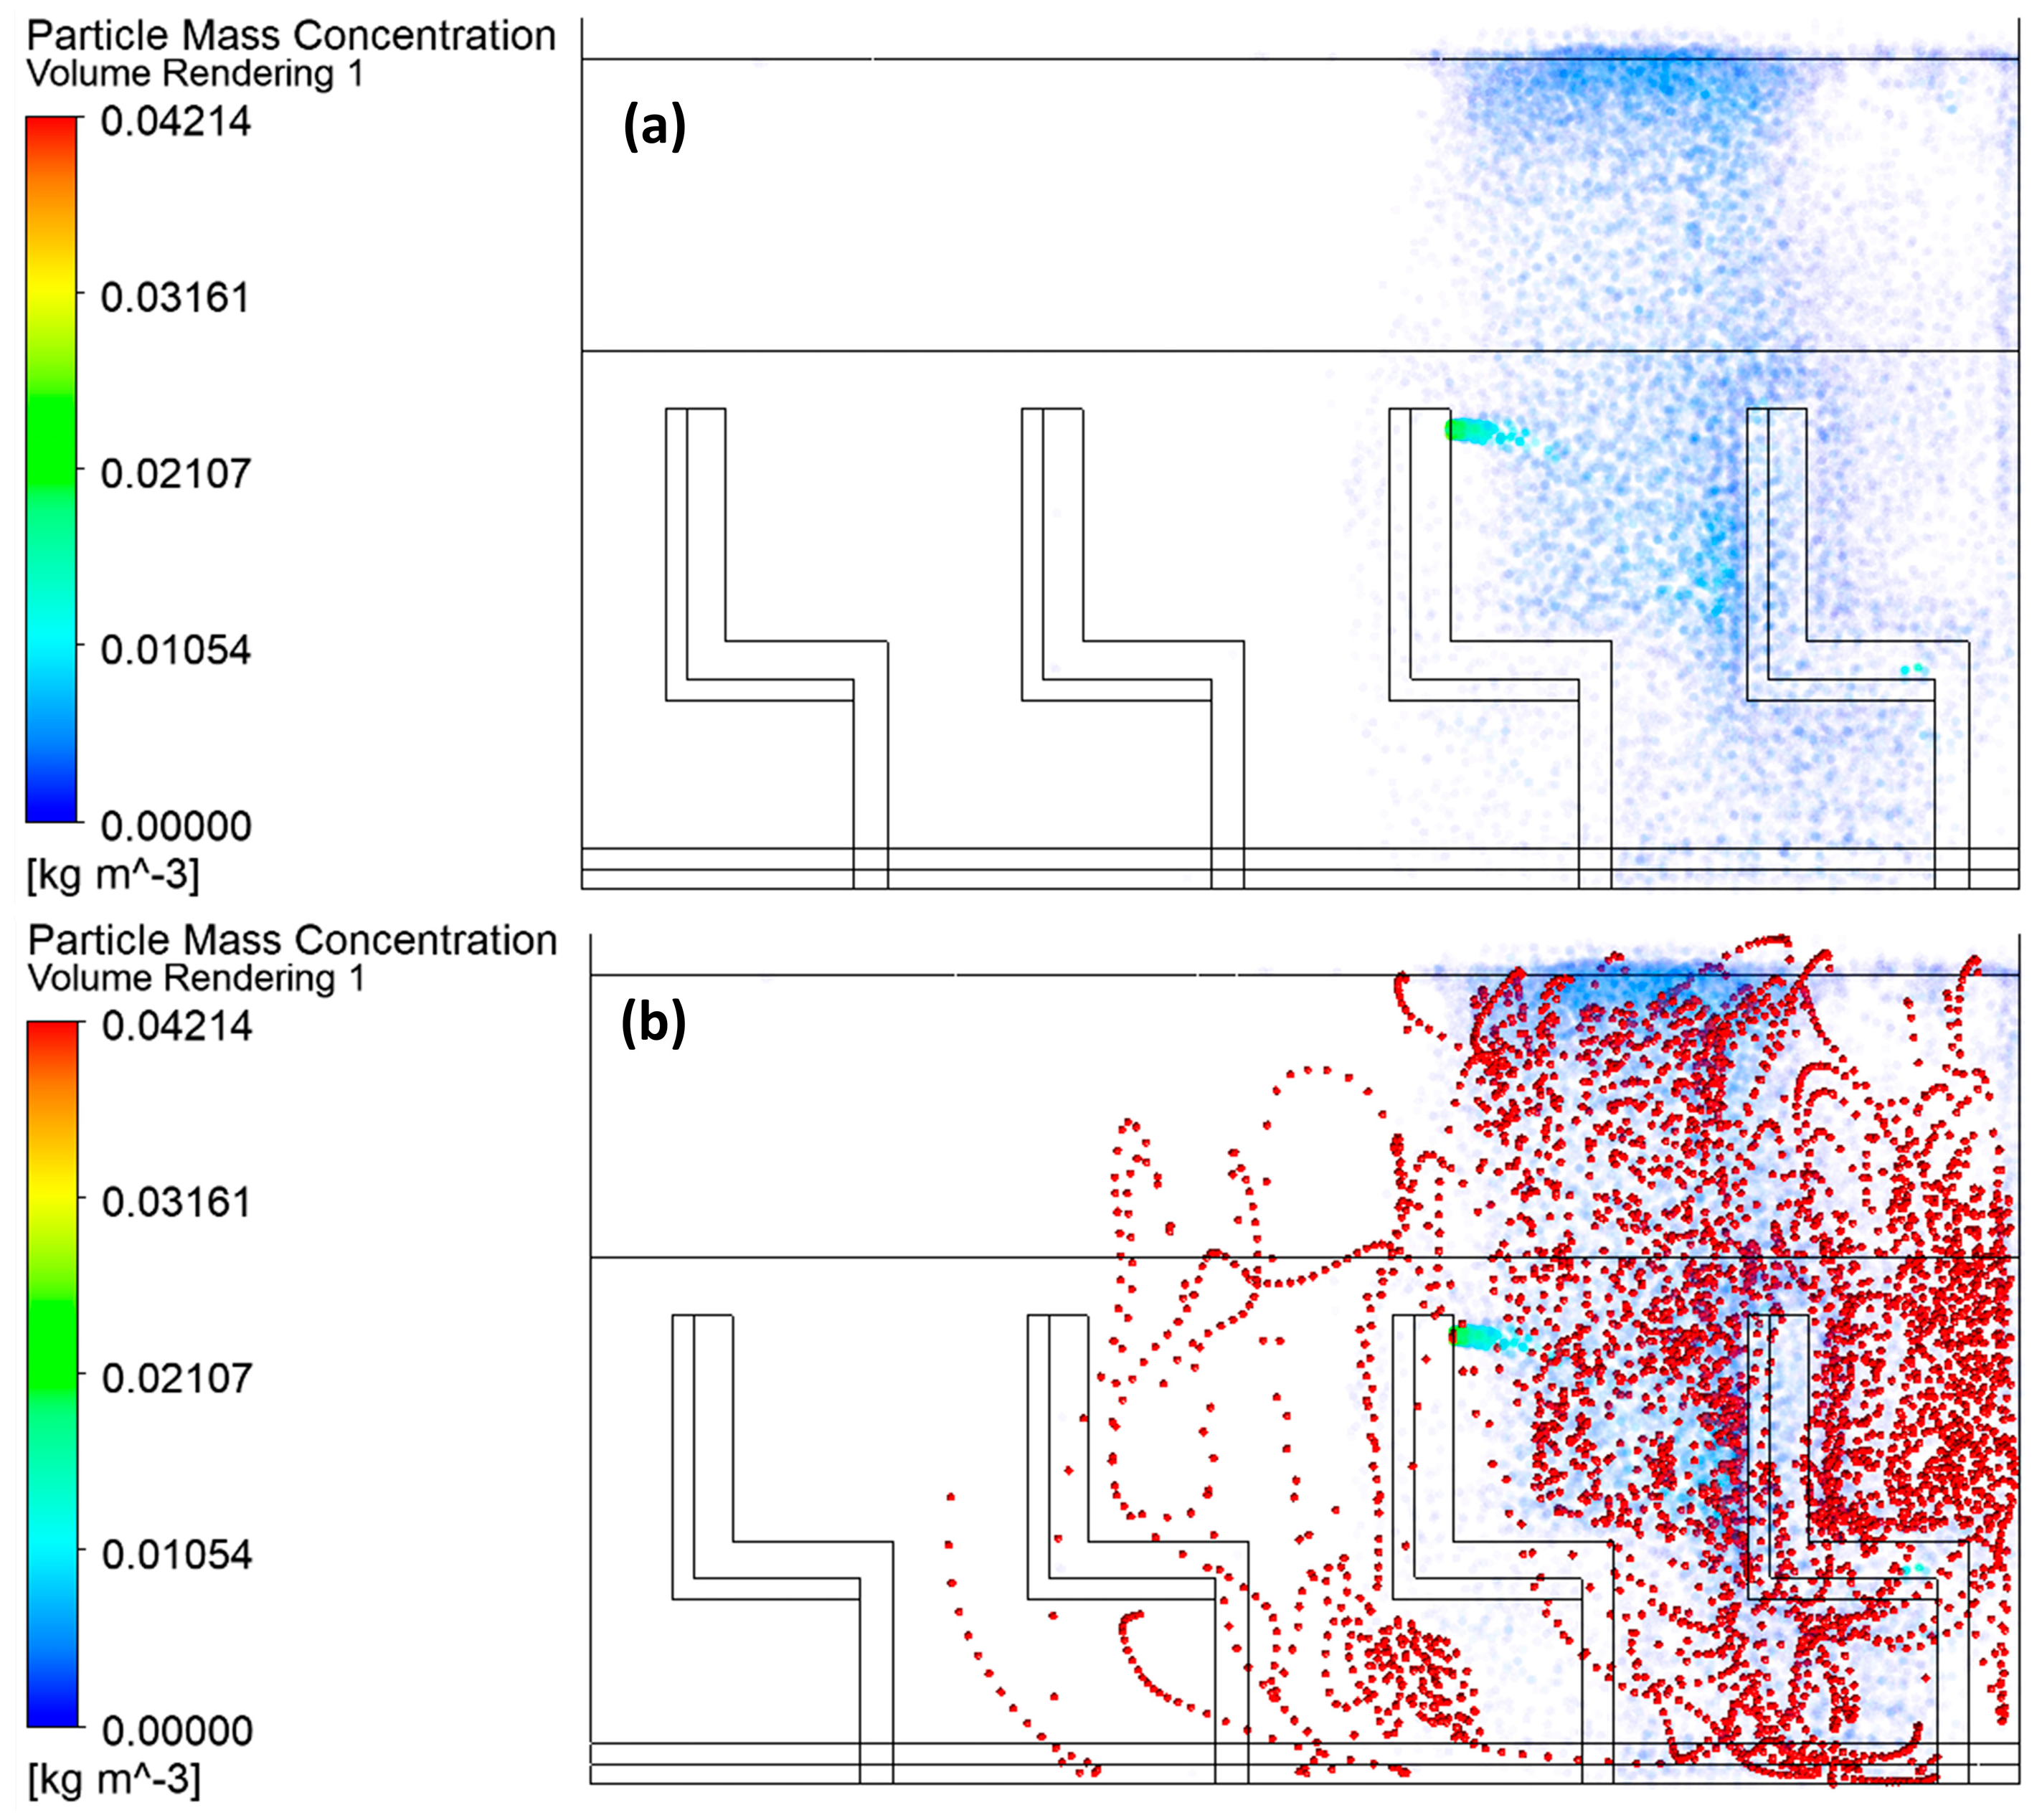
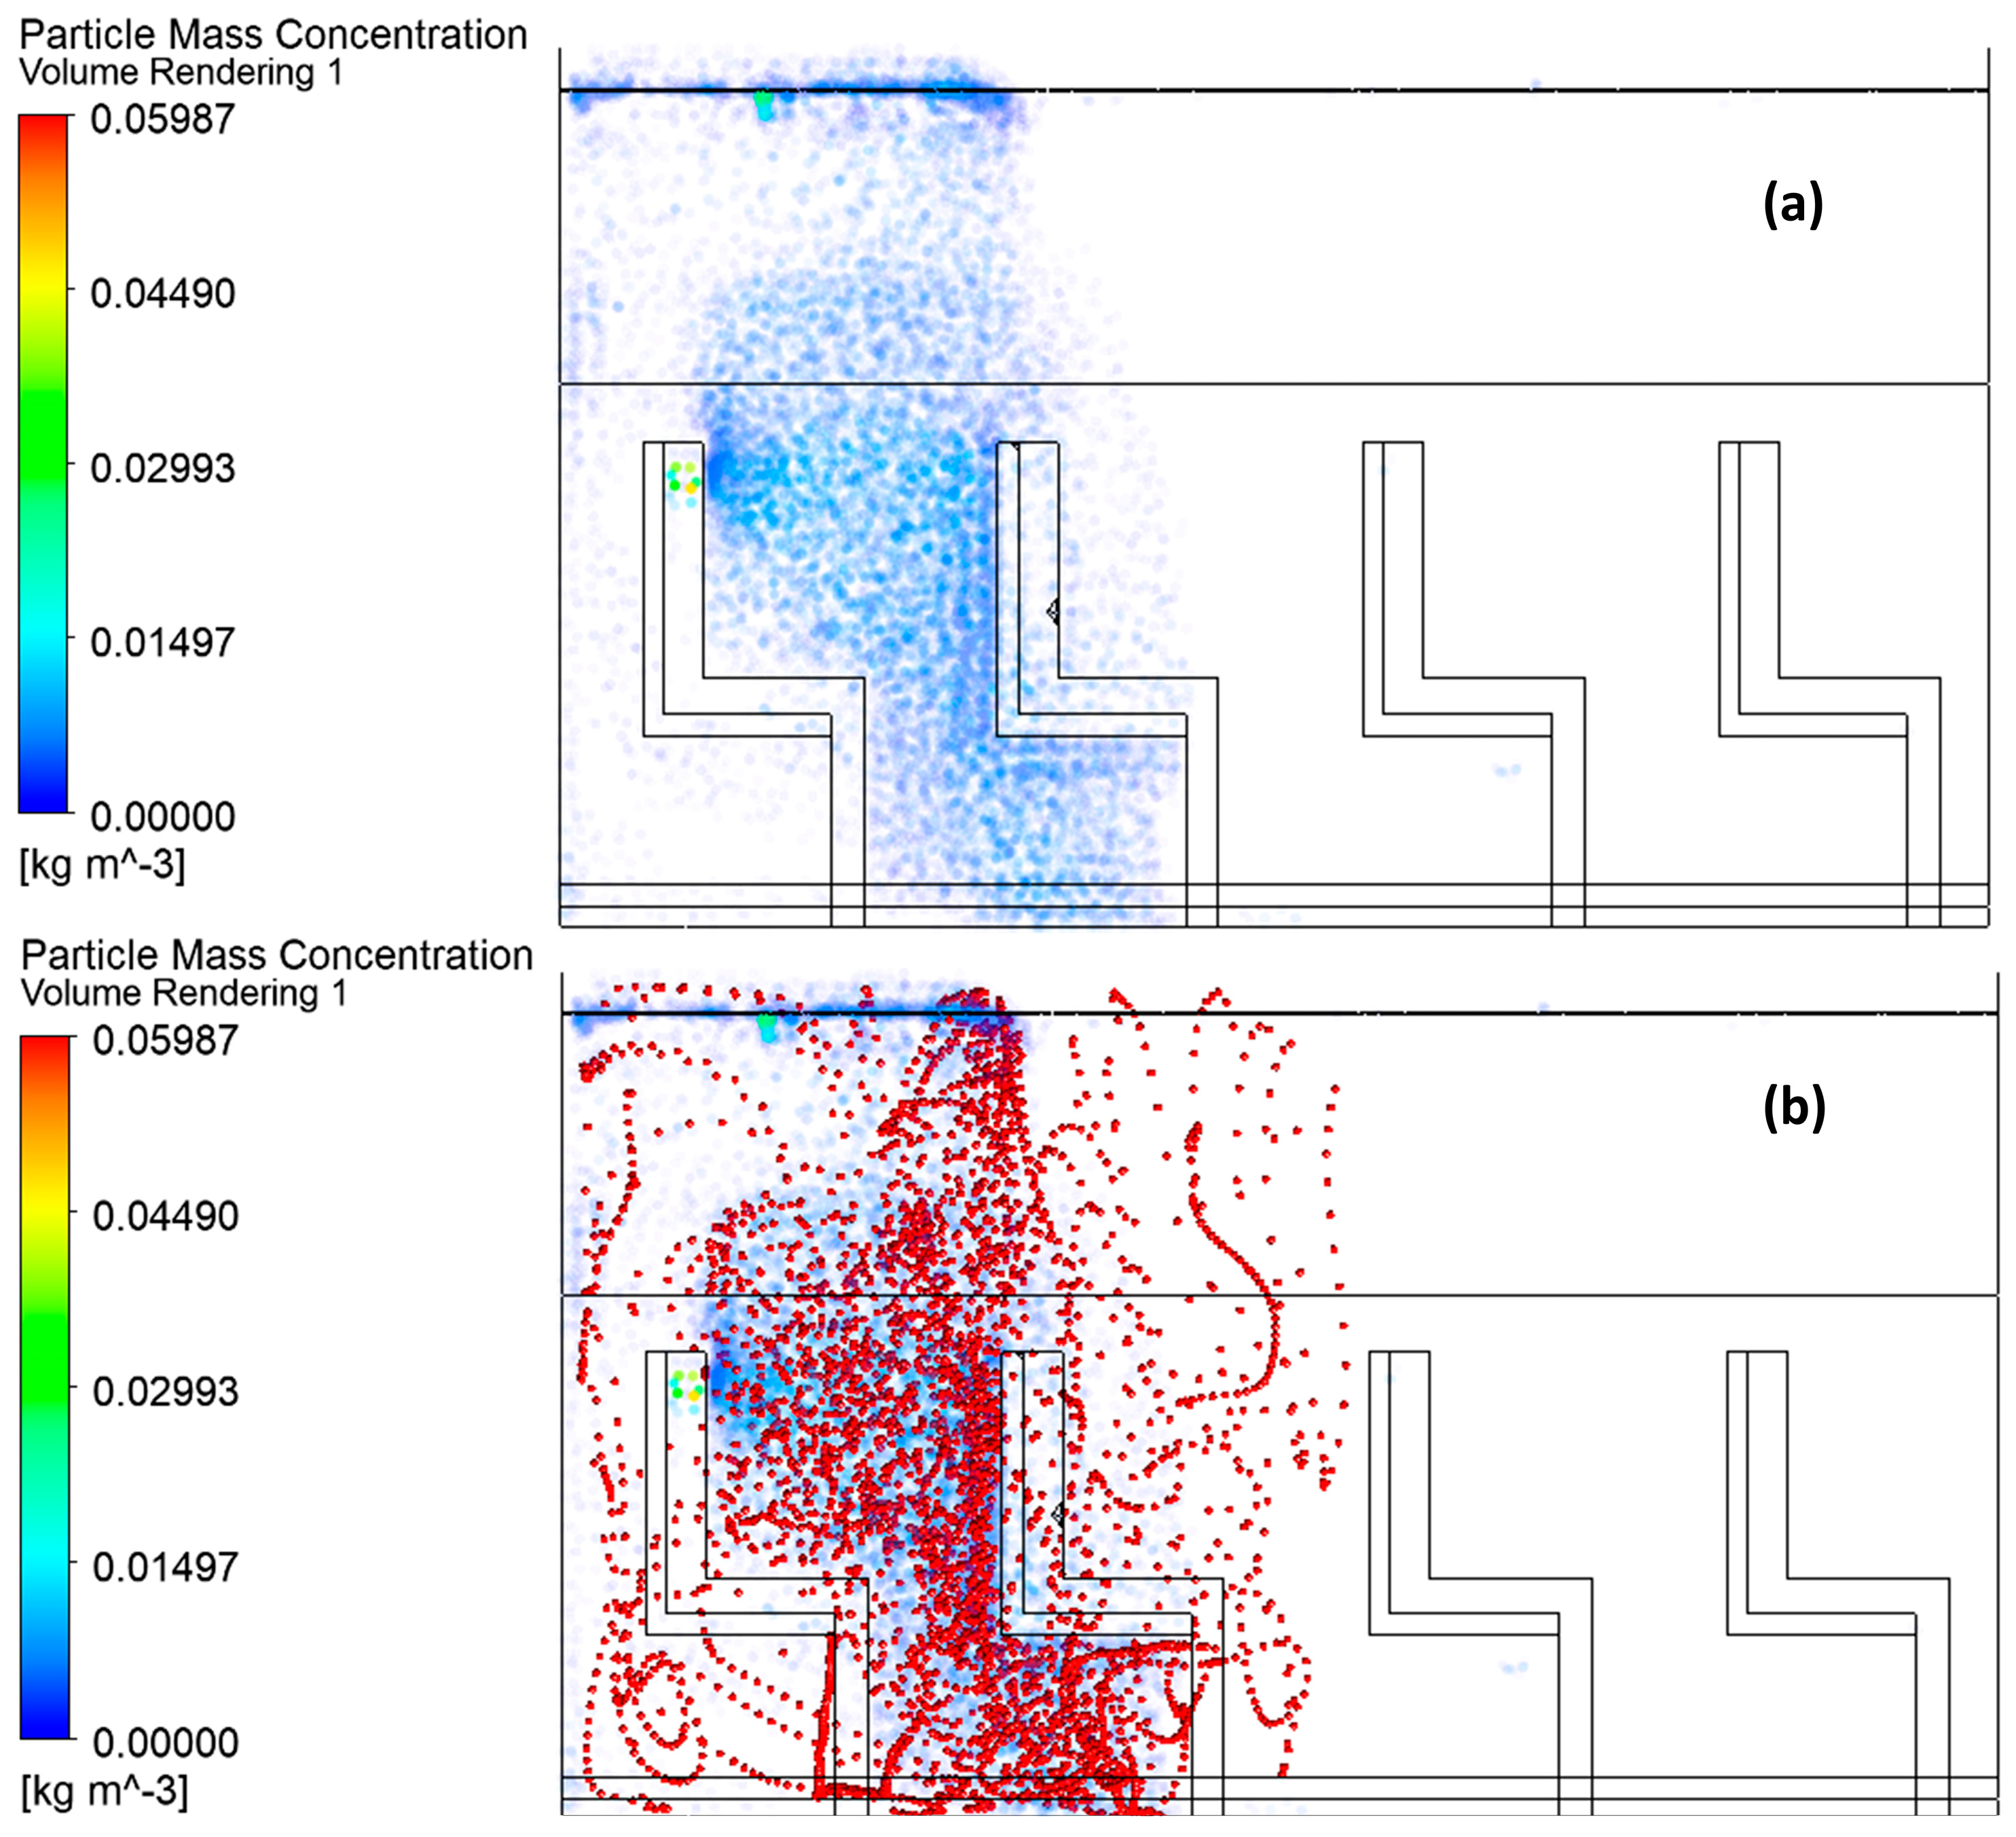
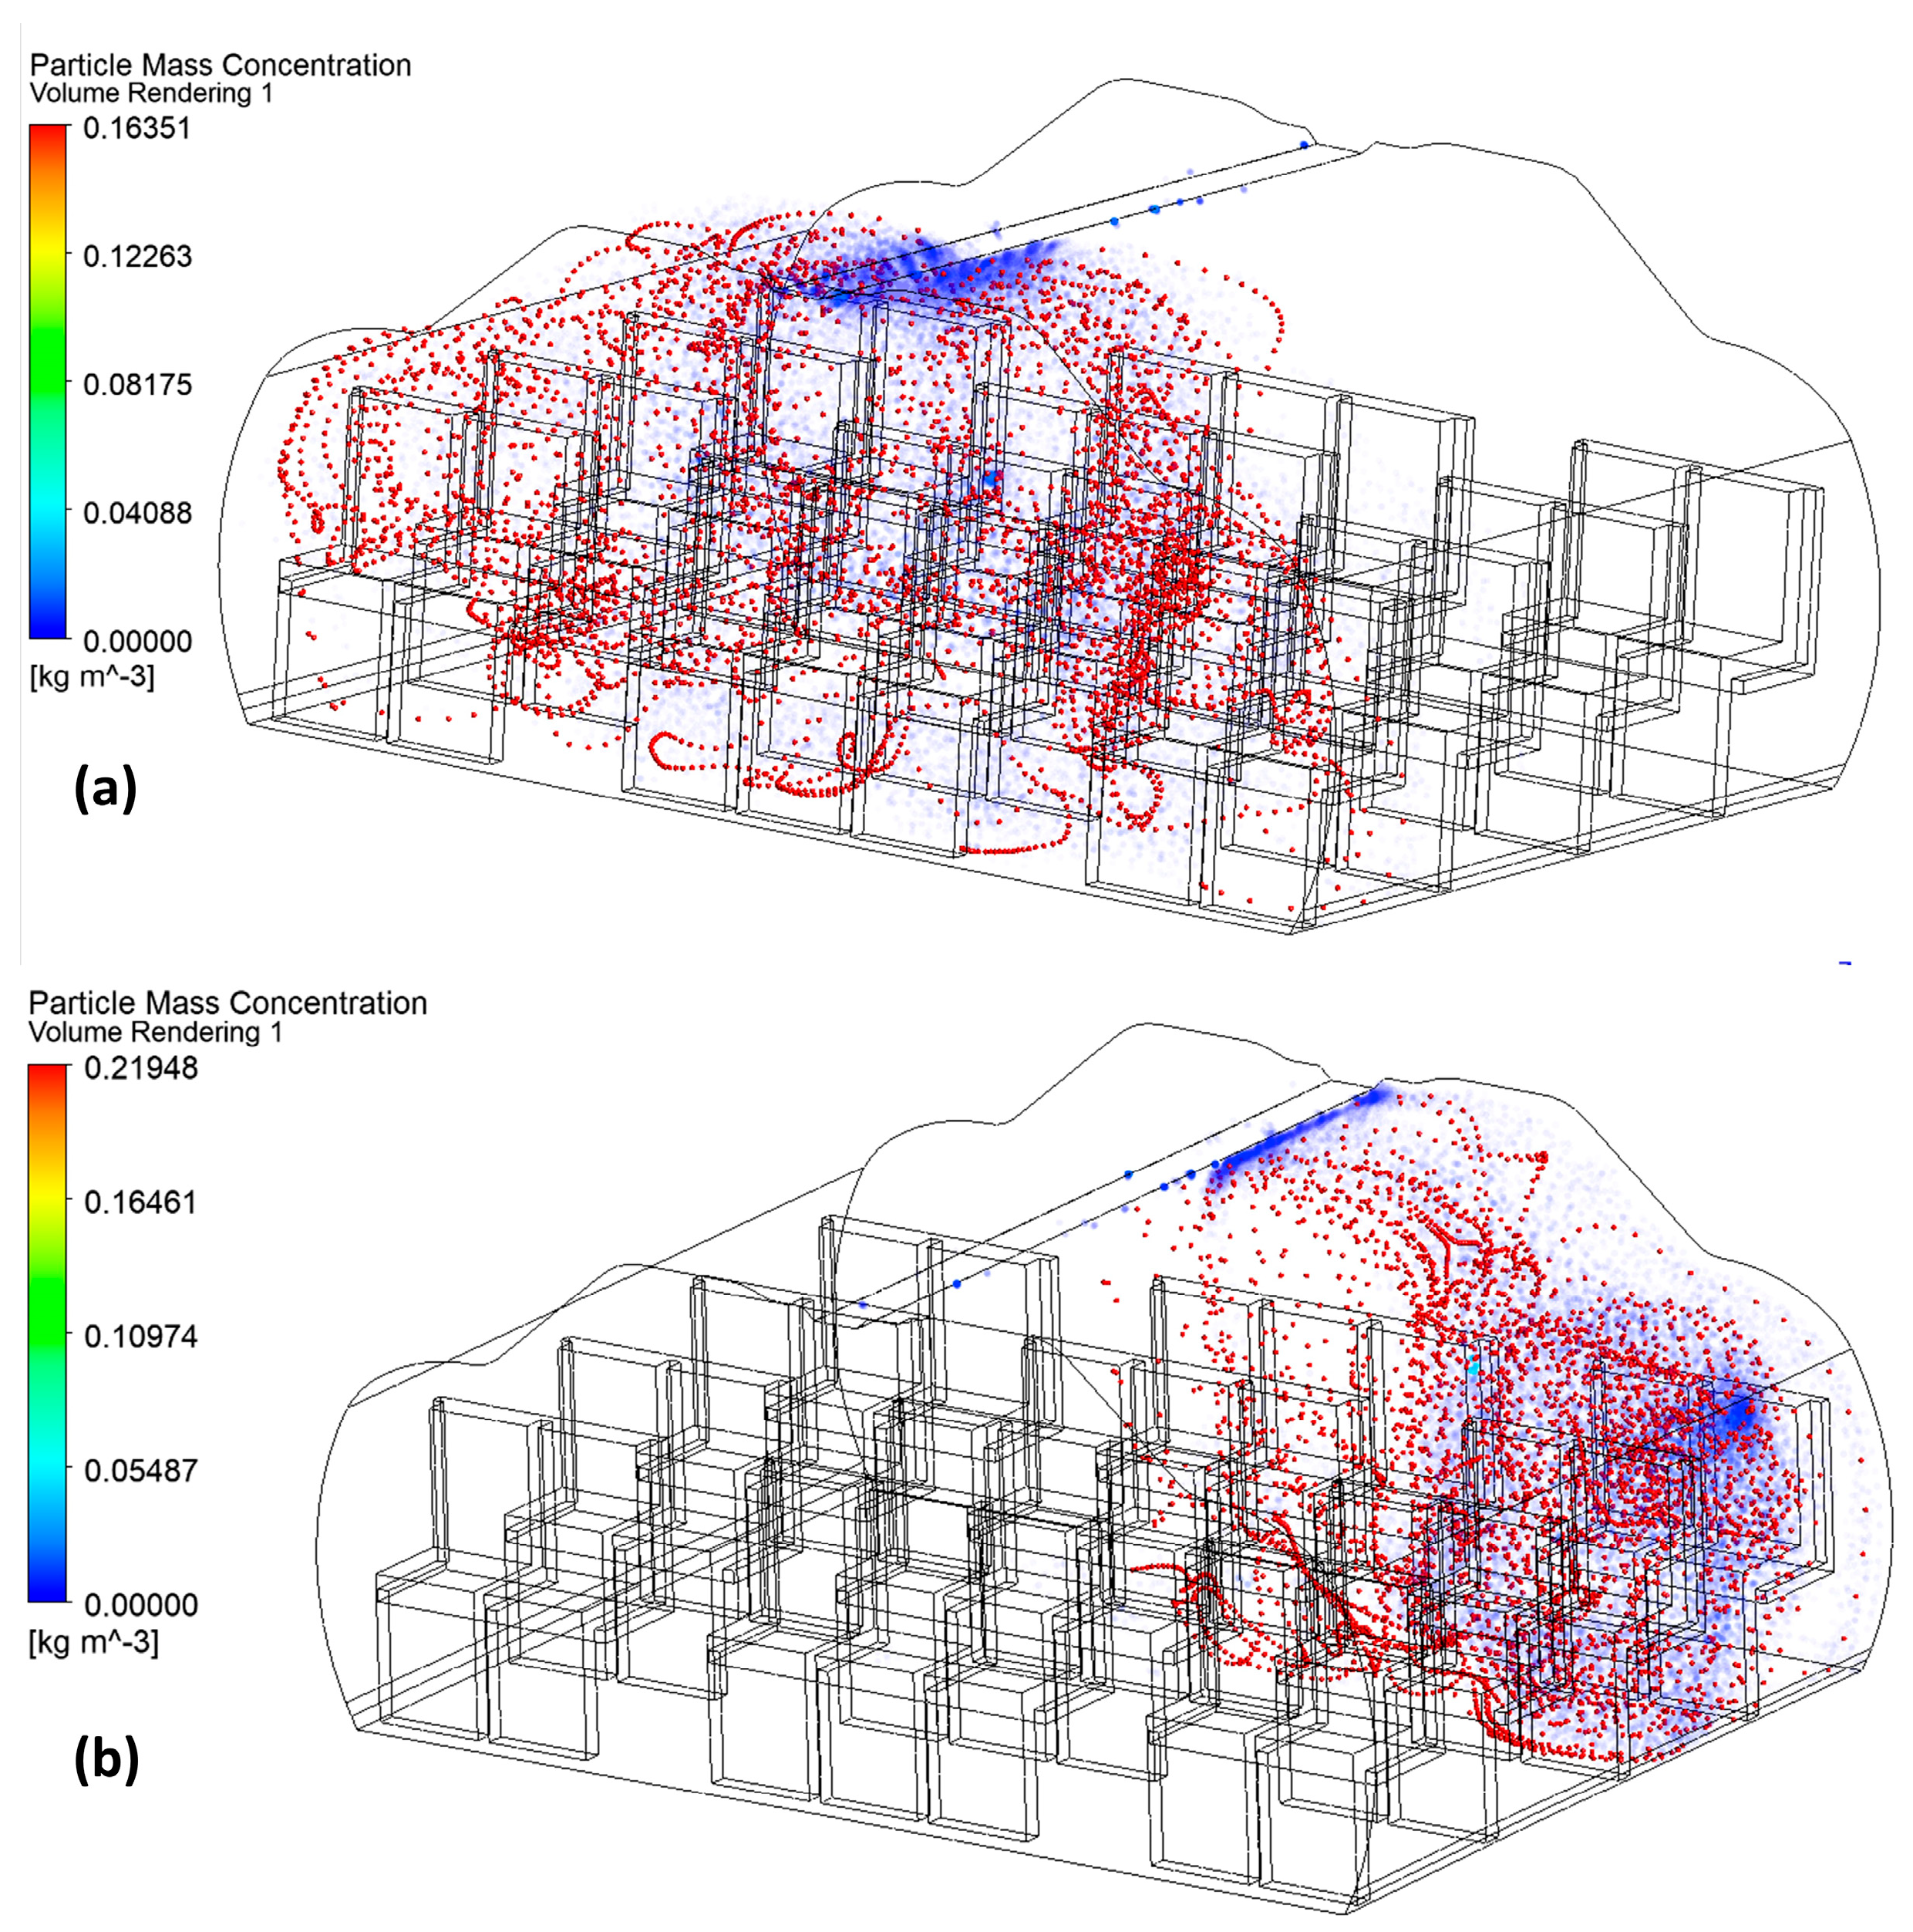
In this study, a comparison of various seating locations and their effects on contaminant spread were evaluated. Accordingly, Figure 3 and Figure 4 show the flow patterns associated with the cough droplets from the passenger/source placed at the second row (centre seat) and fourth row (window seat), respectively. The droplets indicated by the red colour are superimposed on the particle concentration for mapping the spread to the deposition regions. The cough droplets from the passenger’s mouth are picked up by the cabin’s main flow and transported throughout the cabin.
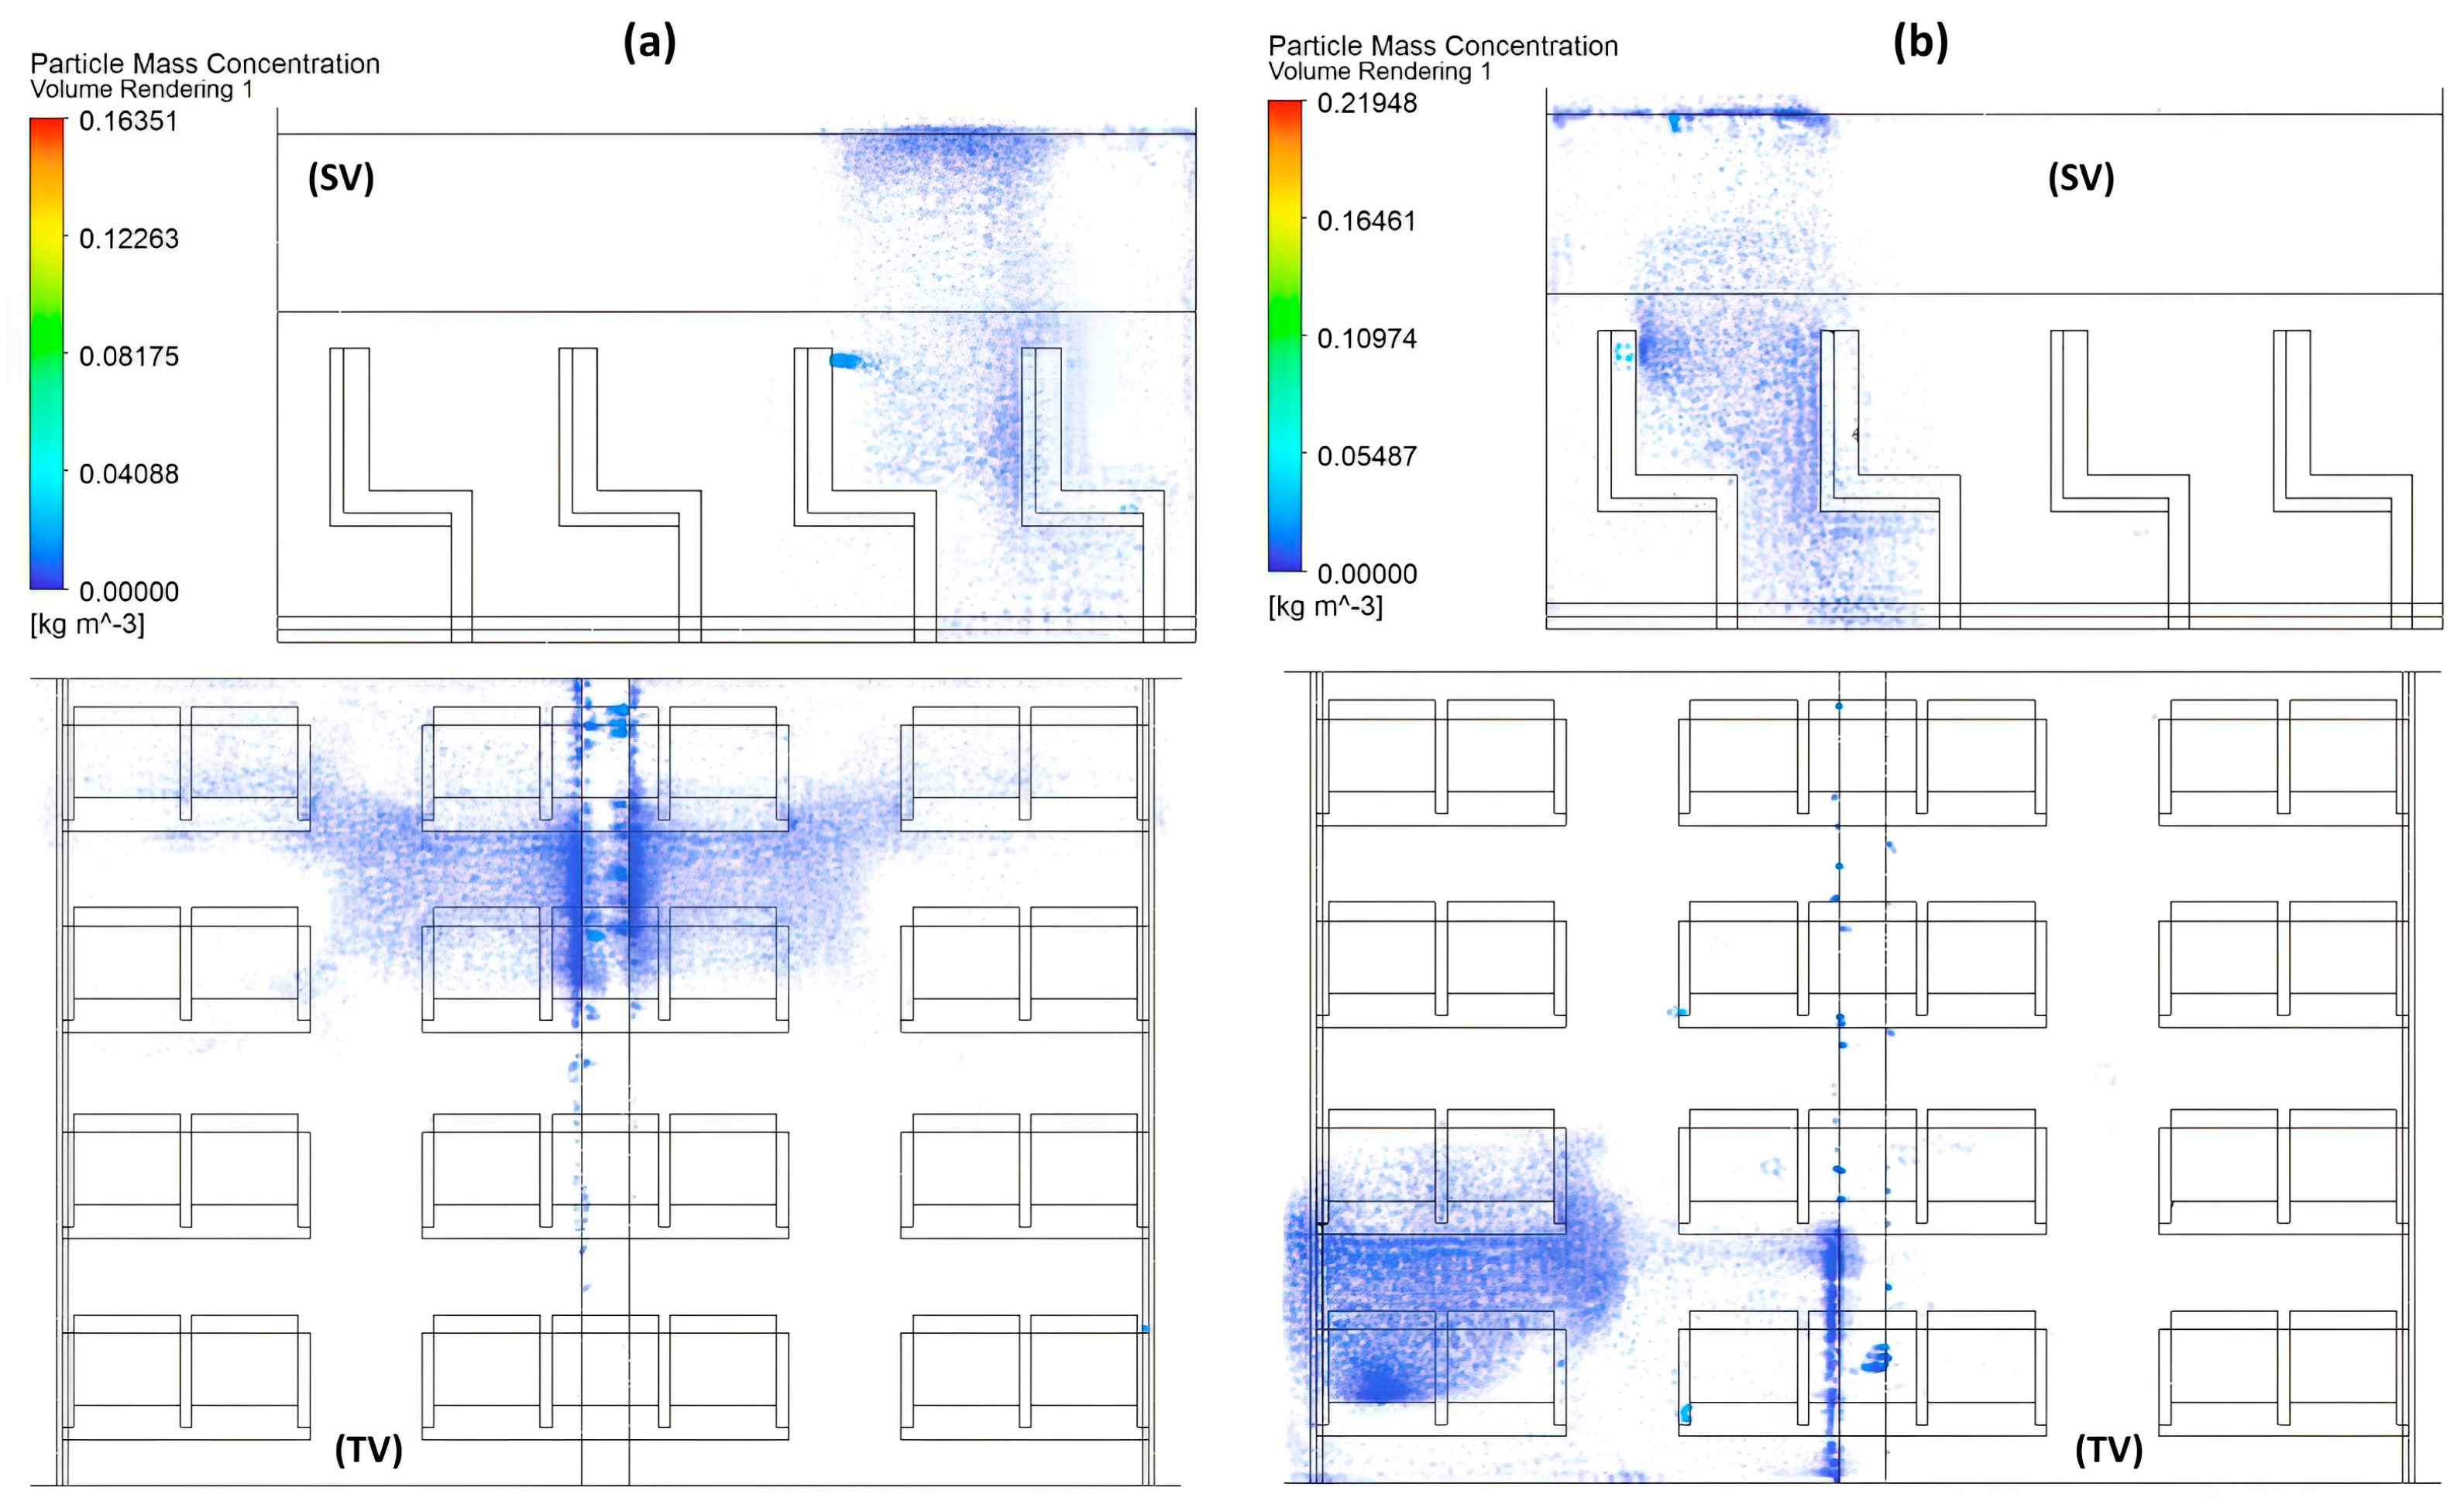
The effect of location on the contaminant source’s spread of the droplets was analyzed by comparing the differences in the droplet dispersion. As can be observed from Figure 3a and Figure 4a, the ceilings are major deposition regions. In general, however, the spread area is mostly limited to the row in front of the source and, to some extent, the row behind the Covid patient (Figure 3b and Figure 4b). A small portion of the droplets are also deposited on the front seats and on the cabin floor. The rest of the droplets are entrained in the recirculating airflow and eventually deposited on the other passengers, the seats and the cabin walls. Figure 5a,b shows the comparison of the particle concentration distribution at the different zones of the aircraft cabin. When the source is in the second-row centre seat (Figure 5a), it has a less intense deposition on the ceiling as compared to the window seat location (Figure 5b). However, the particle deposition on the floor along the aisle is almost the same for both sources, as the particles are less influenced by air recirculation in the lower parts of the cabin.
Figure 6 shows that the Covid particle spread does not cover the entire aircraft space and is restricted to only a few rows near the carrying passenger. It can also be clearly observed that the entire front portion of the aircraft cabin is full of cough droplet concentration when the Covid passenger is seated in the centre (Figure 6a), as compared to when the droplet spread is concentrated toward the window (Figure 6b). The passenger source seated in the centre seat has a greater chance of spreading the infection to a larger region as compared to the one seated near to the window. This is because the exhaust vents are located just below the window, which helps restrict the spread region to a small area. The contaminated air is quickly sucked out with the outlet ducts.
The interaction of the Covid particles (streamlines) with the mainstream airflow (vectors) for both the case of the centre seat and the window seat can be seen observed in Figure 7. The streamlines of the Covid particles ejected from the central seat become entrapped in the mainstream vortex and are circulated in its area of influence [29]. However, the Covid particles released from the window seat are limited to the spread region near the window, and the vortex is not as intense as in the case of the centre seat passenger.
It is useful to determine the deposition regions and estimate the concentration of the Covid particles. Figure 8 shows the cough droplet deposits on ceiling, floor, windows and seats from the two different contaminant sources considered in this study. The ceiling is the major region of deposition. This is because the airflow dynamics associated with the mixed ventilation system result in the stagnation regions in the ceiling. These stagnation points are fundamentally the regions of major depositions [31,32]. In the present study, it was observed that the ceiling accounted for highest zones of deposition, followed by the seats. Some minor deposits were also found on the windows and the floor. Figure 8 shows that the window source of contamination results in a higher deposition of particles in almost all the regions. The concentration of deposits is almost 50% more when the source is at window as compared to the centre seat. This is because of the cabin’s design.
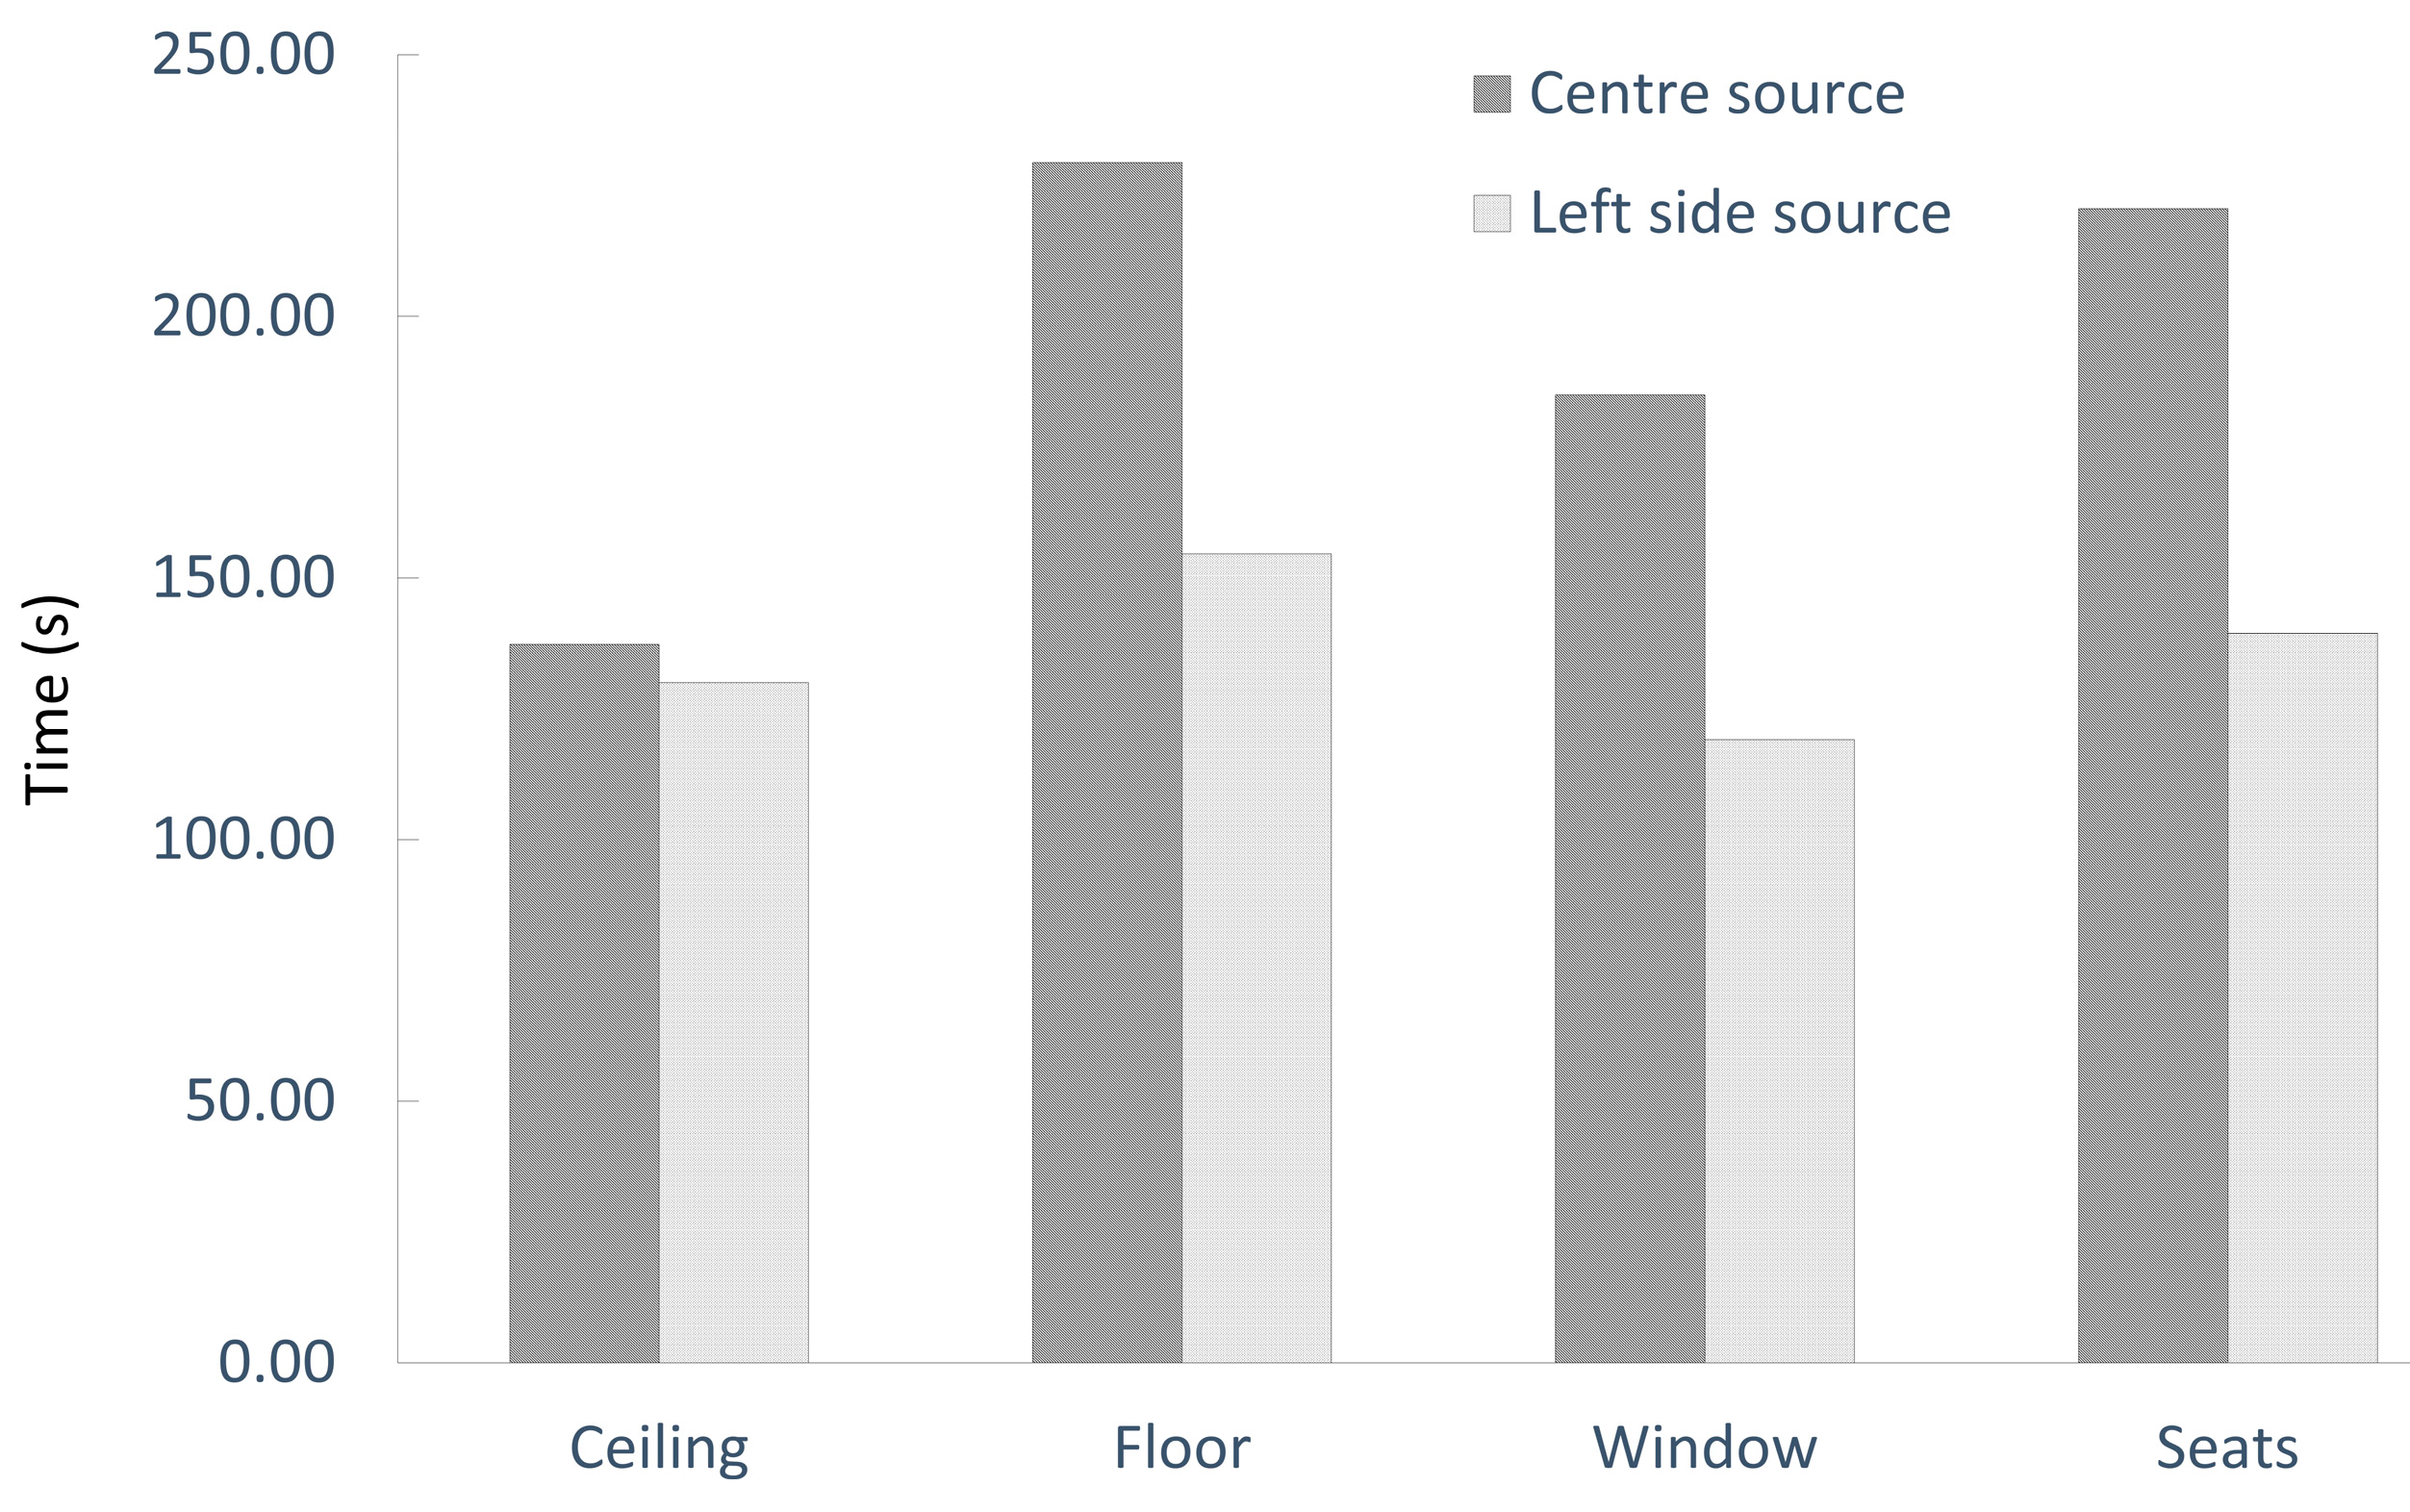
In the case of the window source, the height of the ceiling is much lower than the centre seat. The underlying airstream strikes the ceiling near the window source and deposits the particles on the ceiling just above the window seat. The particles are carried by the mainstream flow and are circulated in the vortex stream, depositing them near the entrance ducts. The centre seat has relatively more room for movement of air, whereas the window seat restricts the movement of air as it encounters the side walls, the lower ceiling height and the front seat, creating a localized circulation. This may be the reason for the increased particle deposits in the seat regions for the window source as compared to the centre source. The particle residence-time data depicted in Figure 9 shows that the particles take longer to deposit or exit the cabin when the source is at the centre of the aircraft [22,23]. The particle residence time describes the time duration of the cough droplets residing on the surface of the aircraft cabin. In general, the average time that the Covid particles remain inside the cabin without being deposited or escaping is about 4 min. Recirculation airflow through the inlet on the ceiling has more time duration at the centre zone of the aircraft cabin in contrast to the window zone [24,25]. Perhaps due to this reason, the centre source’s cough droplets are found to have higher particle residence time as compared to the window source. Thus, it is more advantageous to keep the patient near the window because the residence time of the Covid particles is much shorter. However, the particle residence time is shorter in the case of the window source, and the particle concentration is higher as compared to the centre source. This could be overcome by increasing the exhaust rate, which may help reduce the particle deposition and the region of spread, thus contaminating only a few passengers.

4. Conclusions

The complex geometry and airflow characteristics within aircraft cabins pose a challenge for accurately simulating and validating numerical CFD computations. The present study quantitatively evaluated the impact of the mixed ventilation system, particle transport method, turbulence model, and boundary conditions applied to a CFD simulation of the airflow and contaminant source fields in an aircraft cabin that uses a mixed ventilation system. The study compared the location of the Covid source near the window and at the centre on the distribution and deposition patterns inside an aircraft cabin. A distinct spread pattern was observed for both the centre seat and the window seat, which was largely influenced by the pattern of the mainstream flow and cabin design.
The measured particle concentration varied with the locations of the Covid source and the other seats. The current mixed ventilation is not sufficient for retaining the released particles in the half of the cabin where the particle sources are located. It was found that the ceiling accounted for the highest zones of particle concentration deposition, followed by the seats. Some minor deposits were also found on the windows and the floor. In the current seating arrangement of the aircraft cabin, the particle concentration in the respiratory zone of the window seat was the lowest, while the concentration was higher near the middle and aisle seats. Furthermore, the concentration of these particle deposits was almost 50% more when the source was at window, as compared to the centre seat source. The average time that the Covid particles remained inside the cabin without being deposited or escaping was about 4 min.
In the present study, the released Covid particles were transported across at least two rows of seats in the longitudinal direction. The particle concentration decreased with distance from the particle’s release source. A better and more accurate understanding of the transport range of particles in the longitudinal direction requires a longer cabin mockup supported by experimental testing. Also, it should be emphasized that keeping the middle seat vacant has pros and cons in terms of Covid particle exposure. If the Covid source seated in the middle coughs, these Covid particles, together with those from any of the adjacent passengers, result in a particle concentration in the ceiling zone, resulting in twice the concentration of a single-source release as when the middle seat is left vacant. Therefore, the wearing of face masks by middle-seat passengers should be more strictly enforced during pandemics.

Author Contributions

Conceptualization, S.M.A.K., S.G.K. and M.Z.; methodology, J.V.C. and G.S.; software, S.M.A.K. and K.A.M.; validation, J.V.C. and M.Z.; supervision: A.V.B. and K.A.b.A.; simulations: G.S. and J.V.C.; writing and editing: K.A.M. and K.A.b.A. All authors have read and agreed to the published version of the manuscript.

Funding

This research received no external funding.

Data Availability Statement

The data presented in this study are available on request from the corresponding author. The data are not publicly available due to restrictions.

Acknowledgments

The authors would like to thank the Department of Mechanical and Industrial Engineering, the Manipal Institute of Technology, Manipal Academy, Manipal, India, and the Department of Aerospace Engineering, Universiti Putra Malaysia, Malaysia, for the computing resources provided to carry out this work.

Conflicts of Interest

The authors declare no conflicts of interest.

Nomenclature

CFDComputational Fluid Dynamics
COVIDCoronavirus Disease
DPMDiscrete Phase Modeling
H1N1Hemagglutinin Type 1 and Neuraminidase Type 1
HEPAHigh-Efficiency Particulate Air
RNGRenormalization Group
SARSSevere Acute Respiratory Syndrome
SIMPLESemi-Implicit Method for Pressure-Linked Equations

References

  1. Arblaster, M. The Air Traffic Management Industry. In Air Traffic Management; Elsevier: Amsterdam, The Netherlands, 2018; pp. 1–8. [Google Scholar]
  2. Dechow, M.; Sohn, H.; Steinhanses, J. Concentrations of Selected Contaminants in Cabin Air of Airbus Aircrafts. Chemosphere 1997, 35, 21–31. [Google Scholar] [CrossRef] [PubMed]
  3. The Airliner Cabin Environment and the Health of Passengers and Crew; National Academies Press: Washington, DC, USA, 2002; ISBN 978-0-309-08289-1.
  4. Zubair, M.; Ahmad, K.A.; Riazuddin, V.N. A Review on the Impact of Aircraft Cabin Air Quality and Cabin Pressure on Human Wellbeing. Appl. Mech. Mater. 2014, 629, 388–394. [Google Scholar] [CrossRef]
  5. Moreno, T.; Gibbons, W. Aerosol Transmission of Human Pathogens: From Miasmata to Modern Viral Pandemics and Their Preservation Potential in the Anthropocene Record. Geosci. Front. 2022, 13, 101282. [Google Scholar] [CrossRef] [PubMed]
  6. Bale, R.; Li, C.; Fukudome, H.; Yumino, S.; Iida, A.; Tsubokura, M. Characterizing Infection Risk in a Restaurant Environment Due to Airborne Diseases Using Discrete Droplet Dispersion Simulations. Heliyon 2023, 9, e20540. [Google Scholar] [CrossRef]
  7. Olsen, S.J.; Chang, H.-L.; Cheung, T.Y.-Y.; Tang, A.F.-Y.; Fisk, T.L.; Ooi, S.P.-L.; Kuo, H.-W.; Jiang, D.D.-S.; Chen, K.-T.; Lando, J.; et al. Transmission of the Severe Acute Respiratory Syndrome on Aircraft. N. Engl. J. Med. 2003, 349, 2416–2422. [Google Scholar] [CrossRef]
  8. Motamedi Zoka, H.; Moshfeghi, M.; Bordbar, H.; Mirzaei, P.A.; Sheikhnejad, Y. A CFD Approach for Risk Assessment Based on Airborne Pathogen Transmission. Atmosphere 2021, 12, 986. [Google Scholar] [CrossRef]
  9. Sheikhnejad, Y.; Aghamolaei, R.; Fallahpour, M.; Motamedi, H.; Moshfeghi, M.; Mirzaei, P.A.; Bordbar, H. Airborne and Aerosol Pathogen Transmission Modeling of Respiratory Events in Buildings: An Overview of Computational Fluid Dynamics. Sustain. Cities Soc. 2022, 79, 103704. [Google Scholar] [CrossRef]
  10. Tsang, T.-W.; Mui, K.-W.; Wong, L.-T. Computational Fluid Dynamics (CFD) Studies on Airborne Transmission in Hospitals: A Review on the Research Approaches and the Challenges. J. Build. Eng. 2023, 63, 105533. [Google Scholar] [CrossRef]
  11. Feng, K.; Yanagita, Y.; Miyamura, Y.; Basri, A.A.; Zuber, M.; Rohani, S.; Ahmad, K.A.; Tamagawa, M. CFD Analysis of Indoor Ventilation for Airborne Virus Infection. J. Adv. Res. Numer. Heat. Transf. 2023, 14, 1–16. [Google Scholar] [CrossRef]
  12. Geisler, S.M.; Lausch, K.H.; Hehnen, F.; Schulz, I.; Kertzscher, U.; Kriegel, M.; Paschereit, C.O.; Schimek, S.; Hasirci, Ü.; Brockmann, G.; et al. Comparing Strategies for the Mitigation of SARS-CoV-2 Airborne Infection Risk in Tiered Auditorium Venues. Commun. Eng. 2024, 3, 161. [Google Scholar] [CrossRef]
  13. Sun, Y.; Zhang, Y.; Wang, A.; Topmiller, J.L.; Bennet, J.S. Experimental Characterization of Airflows in Aircraft Cabins, Part 1: Experimental System and Measurement Procedure. In Proceedings of the ASHRAE Transactions; ASHRAE: Peachtree Corners, GA, USA, 2005; Volume 111, pp. 45–52. [Google Scholar]
  14. Yan, W.; Zhang, Y.; Sun, Y.; Li, D. Experimental and CFD Study of Unsteady Airborne Pollutant Transport within an Aircraft Cabin Mock-Up. Build. Environ. 2009, 44, 34–43. [Google Scholar] [CrossRef]
  15. Mangili, A.; Gendreau, M.A. Transmission of Infectious Diseases during Commercial Air Travel. Lancet 2005, 365, 989–996. [Google Scholar] [CrossRef] [PubMed]
  16. Gao, N.; Niu, J. Transient CFD Simulation of the Respiration Process and Inter-Person Exposure Assessment. Build. Environ. 2006, 41, 1214–1222. [Google Scholar] [CrossRef]
  17. Grossi, G.; Arpino, F.; Buonanno, G.; Cortellessa, G.; Moretti, L.; Nagano, H.; Stabile, L. A Eulerian-Lagrangian Approach for the CFD Analysis of Airborne Disease Transmission in a Car Cabin. J. Phys. Conf. Ser. 2022, 2177, 012015. [Google Scholar] [CrossRef]
  18. Vita, G.; Woolf, D.; Avery-Hickmott, T.; Rowsell, R. A CFD-Based Framework to Assess Airborne Infection Risk in Buildings. Build. Environ. 2023, 233, 110099. [Google Scholar] [CrossRef]
  19. Aboosaidi, F.; Warfield, M.J.; Choudhury, D. Computational Fluid Dynamics Applications in Airplane Cabin Ventilation System Design. SAE Technical Paper, 1 September 1991. [Google Scholar]
  20. Yoo, S.-J.; Yamauchi, S.; Park, H.; Ito, K. Computational Fluid and Particle Dynamics Analyses for Prediction of Airborne Infection/Spread Risks in Highway Buses: A Parametric Study. Fluids 2023, 8, 253. [Google Scholar] [CrossRef]
  21. Ko, G.; Thompson, K.M.; Nardell, E.A. Estimation of Tuberculosis Risk on a Commercial Airliner. Risk Anal. 2004, 24, 379–388. [Google Scholar] [CrossRef]
  22. Gupta, J.K.; Lin, C.-H.; Chen, Q. Flow Dynamics and Characterization of a Cough. Indoor Air 2009, 19, 517–525. [Google Scholar] [CrossRef]
  23. Han, Z.Y.; Weng, W.G.; Huang, Q.Y. Characterizations of Particle Size Distribution of the Droplets Exhaled by Sneeze. J. R. Soc. Interface 2013, 10, 20130560. [Google Scholar] [CrossRef]
  24. Ansys, I. ANSYS Fluent Theory Guide, Ansys; Ansys Inc.: Canonsburg, PA, USA, 2012. [Google Scholar]
  25. Singh, A.; Hosni, M.H.; Horstman, R.; Van Gilder, J.; May, R. Numerical Simulation of Airflow in an Aircraft Cabin Section. ASHRAE Trans. 2002, 108, 1005–1013. [Google Scholar]
  26. Mazumdar, S.; Chen, Q. Influence of Cabin Conditions on Placement and Response of Contaminant Detection Sensors in a Commercial Aircraft. J. Environ. Monit. 2008, 10, 71–81. [Google Scholar] [CrossRef] [PubMed]
  27. Khalil, E.E.; Kotb, H. Numerical Simulation of Airflow and Airborne Pathogen Transport in Aircraft Cabins: Dynamic Mesh Analyses. In Proceedings of the AIAA SciTech Forum, Orlando, FL, USA, 6–10 January 2020; pp. 1934–2020. [Google Scholar]
  28. Kühn, M.; Bosbach, J.; Wagner, C. Experimental Parametric Study of Forced and Mixed Convection in a Passenger Aircraft Cabin Mock-Up. Build. Environ. 2009, 44, 961–970. [Google Scholar] [CrossRef]
  29. The Airliner Cabin Environment; National Academies Press: Washington, DC, USA, 1986; ISBN 978-0-309-03690-0.
  30. Tuberculosis and Air Travel Guidelines for Prevention and Control; WHO: Geneva, Switzerland, 2008.
  31. Neu, J.C.; Carpio, A.; Bonilla, L.L. Theory of Surface Deposition from Boundary Layers Containing Condensable Vapour and Particles. J. Fluid. Mech. 2009, 626, 183–210. [Google Scholar] [CrossRef]
  32. Riazuddin, V.N.; Zubair, M.; Ahmadi, M.; Tamagawa, M.; Rashid, N.H.A.; Mazlan, N.; Ahmad, K.A. Computational Fluid Dynamics Study of Airflow and Microparticle Deposition in a Constricted Pharyngeal Section Representing Obstructive Sleep Apnea Disease. J. Med. Imaging Health Inform. 2016, 6, 1507–1512. [Google Scholar] [CrossRef]
Figure 1. 3D CAD model of a section of a Boeing 767-300 cabin.
Computation 13 00001 g001
Figure 2. Airflow distribution for a mixed ventilation system: (a) vector plot from the literature review [15] and (b) vector plot from the current study.
Computation 13 00001 g002
Figure 3. Contaminant transmission with the source at the second-row centre seat: (a) particle concentration plot and (b) cough droplet distribution.
Computation 13 00001 g003
Figure 4. Contaminant transmission with the source at the fourth-row window seat: (a) particle concentration plot and (b) cough droplet distribution.
Computation 13 00001 g004
Figure 5. Comparison of the particle concentration distribution with the source at different locations: (a) second-row centre seat and (b) fourth-row window seat (SV—side view; TV—top view).
Computation 13 00001 g005
Figure 6. Comparison of cough droplet distribution in different zones of the aircraft cabin (isometric view): (a) source—-second-row centre seat and (b) source—fourth-row window seat.
Computation 13 00001 g006
Figure 7. Comparison of the vector plot of the airflow and cough droplet streamlines: (a) source–second-row centre seat and (b) source—fourth-row window seat.
Computation 13 00001 g007
Figure 8. Cough droplet deposits on various surfaces of the aircraft cabin from different contaminant sources.
Computation 13 00001 g008
Figure 9. Cough droplet residence time in various zones of the aircraft cabin from different contaminant sources.
Computation 13 00001 g009
Table 1. Coughed droplets properties and characteristics [23,24].
Characteristics Droplet Properties
Mouth area4 cm2
Flow rate8.5 L/s
Exhalation velocity11.5 m/s
Max droplet diameter100 µm
Min droplet diameter80 µm
Mean droplet diameter90 µm
Droplet density (based on water density)998.2 kg/m3
Disclaimer/Publisher’s Note: The statements, opinions and data contained in all publications are solely those of the individual author(s) and contributor(s) and not of MDPI and/or the editor(s). MDPI and/or the editor(s) disclaim responsibility for any injury to people or property resulting from any ideas, methods, instructions or products referred to in the content.