Abstract
In this research, a streamlined numerical approach designed for the quick estimation of temperature profiles across the finite thickness of a hemispherical dome subjected to aerodynamic heating is introduced. Hemispherical domes, with their advantageous aerodynamic, structural, and optical properties, are frequently utilized in the front sections of objects traveling at supersonic velocities, including missiles or vehicles. The proposed method relies on one-dimensional analyses of fluid dynamics and flow characteristics to approximate the local heat flux across the exterior surface of the dome. By calculating these local heat flux values, it is also possible to predict the temperature variations within the thickness of the dome by employing the finite difference technique, to solve the heat conduction equation in spherical coordinates. This process is iterated over successive time intervals, to simulate the entire flight duration. Unlike traditional Computational Fluid Dynamics (CFD) simulations, the proposed strategy offers the benefits of significantly lower computational time and resource demands. The primary objective of this work is to provide an efficient numerical tool for evaluating aerodynamic heating impact and temperature gradients on hemispherical domes under specific conditions. The effectiveness of the proposed method will be validated by comparing the temperature profiles derived for a standard flight scenario against those obtained from 2-D axisymmetric transient CFD simulations performed using ANSYS-Fluent 2022 R2.
1. Introduction
In this section, the problem of aerodynamic heating will be introduced. The motivation behind focusing on the hemispherical nose shape for the investigation will be explained. In addition, the proposed numerical method will be presented, in terms of its advantageous features compared to existing Computational Fluid Dynamics (CFD) simulations.
1.1. Motivation
The phenomenon known as aerodynamic heating occurs when a body is subjected to high-speed airflows, causing it to heat up due to the conversion of kinetic energy into heat as a result of compression and friction. This heat is then transferred to the body through the boundary layer. This subject has been of significant importance in the design of high-speed vehicles for over 70 years, with studies demonstrating that bodies with blunted nose shapes undergo lower rates of heat transfer compared to those with sharper nose shapes [1,2,3,4,5]. Among these shapes, the hemispherical nose is of particular interest, due to its beneficial properties, in terms of aerodynamics, mechanics, and optics when exposed to high-speed flows. This design is notably utilized in external stores and missiles, serving various functions, such as window, optical path lens, or radome [6,7,8].
In supersonic flight, aerodynamic heating becomes particularly pronounced, especially near the stagnation point, at which heat generation is primarily due to the direct compression of air. Along the sides of the missile or vehicle, viscous forces in the boundary layer are the dominant source of heat generation. This effect is not only a structural concern but also affects the performance of optical systems, as the thermal characteristics of materials, including the optical components and the dome, change during flight. This transient behavior can degrade the optical system’s performance, making precise thermal management crucial [9,10].
The exploration of aerodynamic heating began with experimental and theoretical studies in the 1950s and 60s, later evolving to include numerical simulations with the advent of computation technology, leading to the development of various in-house codes. These codes have incorporated advanced methodologies, such as the axisymmetric analogue, Lees’ formulations, and DeJarnette, and Davis’s approximate techniques for streamline distribution [10,11]. Industry codes like HABP [12], MINIVER [13], AEROHEAT [14], INCHES [15], CBAERO [16], and HATLAP [17] have enhanced the fidelity of calculations for surface streamlines, pressure, and heating formulations, often comparing favorably with more complex simulations, such as viscous shock layer models and comprehensive CFD simulations. Notably, AEROHEAT includes a unique equivalent boundary layer method that involves a direct solution of a boundary layer specific to each streamline [10]. While these in-house codes offer deep insights and precision, their varied methodologies and restricted availability have limited their widespread usage in broader research and industrial contexts [18,19].
Recent advancements in commercial CFD tools have enabled the simulation of aerodynamic heating more accurately with high fidelity. However, most high-speed missiles have a relatively short flight time, and simulating them with conventional CFD tools remains challenging, due to the transient nature of heat transfer [9]. This work introduces a streamlined numerical approach that aims to bridge the gap between accuracy, efficiency, and availability for specific cases and conditions that will be discussed in detail. Unlike prior studies that have focused on either detailed CFD simulations or specific industrial contexts with limited availability, the proposed method utilizes an open source, one-dimensional approach for rapid predictions, tailored for real-time applications in the conceptual design of high-speed missiles. This study stands out by combining the practicality of quick estimations with a level of precision that approaches more elaborate methods, making it a useful tool for preliminary design assessments where resource constraints are significant. The proposed method, akin to other specialized in-house codes, has its set of limitations and advantages, which will be further discussed in this paper.
1.2. Advantages of the Developed Methodology
The primary benefit of this technique lies in its efficiency, offering significant time savings compared to simulations performed by widespread commercial CFD tools. This new approach allows for quick approximations of aerothermal heating and temperature variations across the dome, achieving reasonable accuracy in a fraction of the time required by conventional finite volume- or finite element-based solvers. Employing this numerical tool, particularly during the initial phases of design, enables the prediction of aerodynamic heating effects on hemispherical structures with an acceptable level of accuracy. The adoption of this technique accelerates the evaluation process for such thermal conditions, thereby reducing the interval between successive design modifications. A thorough and stable simulation of a missile’s complete flight, which would conventionally take several days to compute using conventional finite volume- or finite element-based solvers (excluding time spent on pre- and post-processing), could see a dramatic reduction in the required computational time, contingent upon the missile’s total flight duration and the specific flight scenario involved. The current study is focused and specific to hemispherical dome geometry. One of its main advantages, compared to similar algorithms [9,20], can be referred to as the calculation of local heat flux and temperature distribution in a stagnation region and its vicinity by using a specific semi-empirical correlation tailored for hemispheres.
2. Methodology
In this part, the proposed methodology will be detailed alongside the constraints specific to this approach. Following this, the outcomes derived from these computations will be presented, in comparison with the results from standard CFD simulations. For these comparisons, the results from transient finite-volume CFD simulations are employed since experimental results related to aerodynamic heating of finite-thickness hemispheres in the literature are of limited availability. Further sections will investigate the details of the CFD model employed for these comparative analyses. A hypothetical flight scenario is adapted within this study, to evaluate the efficacy of the proposed method developed. The profile of the Mach number applied is described as follows:
where is the freestream Mach number at time t, and t is the time variable in seconds.
Similarly, the altitude change is defined by
where is the altitude at time t.
In order to determine the freestream flow conditions at the flight altitude, Equations (1) and (2) are used together with the 1976 U.S. Standard Atmosphere data [21]. Figure 1 shows the profile of both the Mach number and the altitude as a function of time:
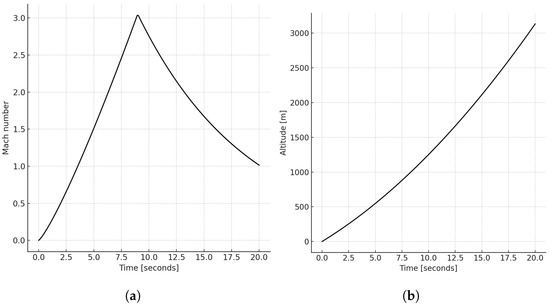
Figure 1.
The Mach number (a) and altitude (b) profiles that summarize the flight scenario.
The proposed methodology’s first step is calculating the local flow and fluid properties at the outer edge of the boundary layer around the hemispherical dome. The second step is calculating the local heat transfer coefficient values by utilizing the flow properties and the correlation proposed by Beckwith and Gallagher [1]. In the third step, using local heat transfer coefficients and flow properties, the heat conduction within the shell of the hemispherical dome is solved by the finite difference method, to obtain the temperature distribution. These steps are repeated in a time-iterative manner, to simulate the full flight. The calculation procedure involves the determination of the heat transfer coefficient at the current time step by using the dome surface temperature distribution obtained from the previous time step and the flow properties calculated at the current time step. This calculation structure is summarized in Figure 2:
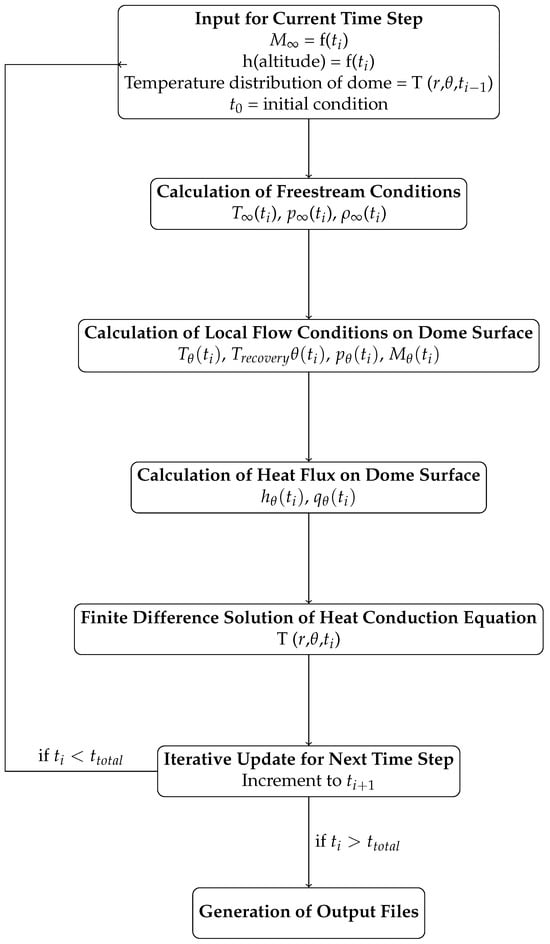
Figure 2.
The diagram shows the step-by-step process, starting with the initial conditions and freestream calculations, followed by the local flow and heat flux computations. It includes the solution of the heat conduction equation and the iterative updates for each time step, ending with the output generation. The iterations cease upon reaching the total flight time ().
2.1. Flow Properties
Throughout the flight of the missile, variations in altitude and velocity require the evaluation of changing flow properties over time. The method introduced calculates these flow properties using isentropic flow relations. For subsonic flow conditions, free stream and stagnation point properties are evaluated, while for the supersonic flow conditions properties behind the shock are also used.
The determination of the local heat transfer coefficient is a critical aspect of the current numerical model, as these coefficients directly influence the prediction of heat flux across the hemispherical dome’s surface. The correlation employed within the scope of this study was proposed by Beckwith and Gallagher [1], and it was modified to account for supersonic flow conditions, based on the derivations outlined by Anderson [22]. The methodology of this study adapts this correlation, to account for the varying Mach numbers, atmospheric conditions, and characteristics specific to hemispherical domes subject to high-speed flows. Additionally, the coefficients are recalculated at each time step, to reflect the dynamic changes in flow conditions during flight. This iterative updating is essential for capturing transient thermal behavior accurately, allowing the model to adapt to the rapid changes in environmental conditions that affect aerodynamic heating. The total temperature, pressure, and, density values are calculated by using isentropic flow relations for subsonic and supersonic conditions. During the iterations flow variables at the edge of the boundary layer are required for heat transfer coefficient calculations. For subsonic flow conditions, the variables at the edge of the boundary layer are calculated by using the freestream flow properties. On the other hand for supersonic flow conditions flow properties outside the boundary layer are calculated by utilizing normal shock relations. The temperature, pressure, density, and Mach number behind the shock wave along the stagnation streamline for supersonic conditions can be expressed as follows, respectively:
where is the temperature immediately after the shock, is the freestream temperature, and is the specific heat ratio,
where is the pressure immediately after the shock, and where is the freestream pressure,
where is the density immediately after the shock, and where is the freestream density,
where is the Mach number immediately after the shock.
Following this initial step, the method proceeds to determine the flow properties, such as the pressure distribution at the hemisphere’s external, the velocity distribution at the edge of the boundary layer, the coefficient of the heat transfer, and the heat flux around the hemisphere’s external surface. The local velocity at the edge of the boundary layer around the hemisphere is calculated by utilizing modified Newtonian theory given by [22], ideal gas law, and isentropic flow relations. The relevant equations are presented as follows:
where is the local pressure at angle , is the stagnation point pressure, is the freestream pressure, and is the angular position from the stagnation point,
where is the local flow velocity at angle , is the specific heat ratio, and is the stagnation point density,
where is the local temperature at angle , is the stagnation temperature, and is the local Mach number at angle .
Using the relation introduced by van Driest [5], the recovery temperature distribution around the outer surface can be expressed as
where is the recovery temperature at angle , and where is the Prandtl number at angle .
The calculation of these properties enables the determination of the local heat transfer coefficient through the employment of the correlation provided by Beckwith and Gallagher [1]. The correlation is used for the calculation of the local heat transfer coefficient distribution in the turbulent boundary layer on the outer surface of the hemispherical dome. This correlation is obtained by applying Reynolds analogy to Falkner’s expression for skin friction on a flat plate and combining this expression with the stagnation point heat transfer relation which is based on dimensionless stagnation point velocity gradient [3,23,24]:
where is the local heat transfer coefficient calculated for the angular position , is the Prandtl number at the wall temperature, is the radius of the sphere, is the dynamic viscosity at wall temperature, and “ref” denotes the reference conditions determined at a reference angular position, specifically at ,
where is the heat flux calculated for the angular position theta , and is the wall temperature at the angular position theta .
The angular position of interest is , and its depiction can be found in Figure 3. It is also important to underline that variations in the direction are disregarded, due to the model’s axisymmetrical nature used in the computations. In addition to the axisymmetry of the geometry, the flow is also assumed to be symmetrical since the dome is expected to reach its highest temperature under symmetrical flow conditions. Under these conditions, a two-dimensional heat conduction equation will be solved, together with one-dimensional flow calculations for determining the temperature distribution within the dome thickness, as illustrated in Figure 3:
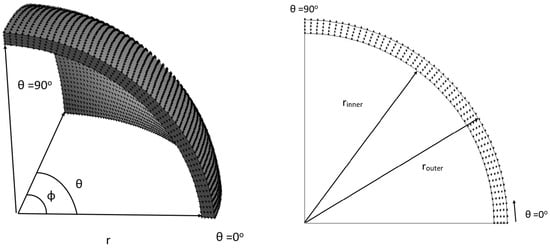
Figure 3.
3D representation of the hemispherical dome (left); 2D representation of the domain of interest (right).
2.2. Governing Equations and Boundary Conditions
The temperature profiles within and on the hemisphere’s surfaces are derived from solving the two-dimensional heat conduction equation in spherical coordinates:
where is the density and is the specific heat at constant pressure of the sphere material, is the temperature within the sphere, is the thermal conductivity of the sphere material, r is the radial, and is the angular coordinate.
Heat exchange with the ambient air occurs at the outer boundary of the sphere’s solid domain. Therefore, the heat flux caused by aerodynamic heating will be applied to the outer surface of the solid domain ():
where is the heat flux at the wall at angle , is the heat transfer coefficient at the wall at angle , is the recovery temperature at angle , is the wall temperature at angle , and is the outer radius of the hemisphere.
The inner boundary () is assumed to be adiabatic:
where is the inner radius of the hemisphere.
Similarly, the symmetry axis () and the shoulder boundary () are assumed to be adiabatic:
2.3. Finite Difference Approach
The finite difference method was selected for its robustness and straightforward implementation in handling the heat conduction equation in spherical coordinates. The proposed method is particularly advantageous in this context, due to its ability to accommodate complex boundary conditions and variable material properties, which are essential in accurately simulating the transient heat response of hemispherical domes under aerodynamic heating. It allows for a clear and intuitive representation of the physical problem, facilitating easier debugging and validation of the numerical model. The proposed method also scales efficiently on modern computational platforms, ensuring that the simulations remain feasible even when extended to three-dimensional scenarios in future work.
In practice, the finite difference method will be employed, with ghost nodes introduced to implement the boundary conditions with second-order spatial precision. The representation of the ghost nodes can be seen in Figure 4.
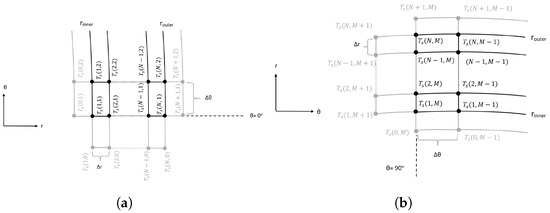
Figure 4.
The visualization of the nodes used in finite-difference solution. The configuration of the points at the (a) symmetry axis boundary, (b) shoulder boundary.
Central differences are utilized for the calculation of second-order spatial derivatives, while the forward difference approximates the time derivative, achieving second-order spatial accuracy and first-order temporal accuracy. For the outer boundary (, ), the equation is discretized as
where N and m are the indices in the radial and angular directions in the numerical grid, respectively. The superscript n stands for the iteration in time.
Finally, the time step is chosen based on the CFL condition, to ensure the stability of the solution:
where is the time step, and are the spatial steps in the radial and angular directions, and is the thermal diffusivity of the sphere material.
2.4. Multidimensional CFD Simulations as the Comparison Case
To evaluate the accuracy of the introduced method, a two-dimensional Unsteady Reynolds-Averaged Navier–Stokes (URANS) simulation was conducted. The simulation’s computational domain included both the dome section and its surrounding flow field. In this Computational Fluid Dynamics (CFD) setup, a finite-thickness cylinder with an identical radius and a length of 3 m was positioned following the hemisphere. The dome itself had a radius of 0.36 m and a thickness of 0.004 m. The flow domain and the missile geometry are presented in Figure 5. To discretize the domain for simulation, a structured mesh composed of 1.2 million elements was employed, as depicted in Figure 6. The turbulence was modeled using the k–– model. A pressure-based, coupled solver was utilized for the simulations. The simulations also accounted for conjugate heat transfer between the dome and the flow, employing second-order schemes for both spatial and temporal discretization. The dome’s wall boundaries were treated with a no-slip condition and were considered perfectly smooth. Within the dome, the buoyancy effects were disregarded, and radiative heat transfer was not accounted for in these simulations.
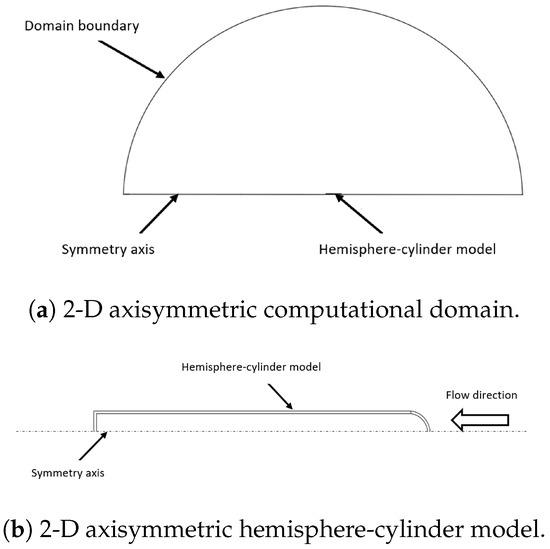
Figure 5.
The computational domain and hemisphere-cylinder model used for CFD simulations.
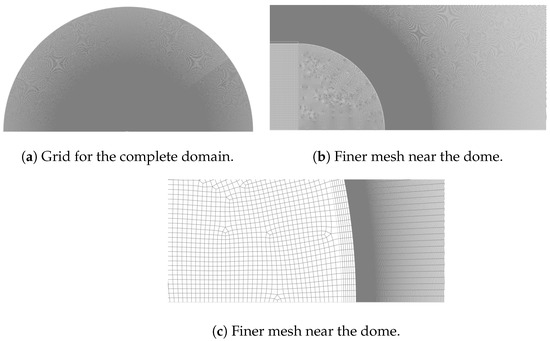
Figure 6.
The mesh used for the CFD analysis.
2.5. Limitations and Assumptions
Employing the specified geometrical details and properties, the proposed methodology enables the calculation of local heat transfer coefficients for hemispherical domes, utilizing established correlation found in the literature. However, the proposed numerical method is based on some assumptions and has its own limitations, which are listed below:
- Air is assumed to be a perfect gas.
- The temperature and pressure change with altitude according to the 1976 U.S. Standard Atmosphere data.
- Shock–boundary layer interactions and flow separation cannot be considered in the calculations.
- The dynamic viscosity of air is assumed to vary with temperature according to Sutherland’s Law.
- Thermal conductivity and the ratio of specific heats of air are assumed to be constant.
- The thermophysical properties of the dome solid material are assumed to be constant.
- The flow is considered to be entirely turbulent in both the CFD simulations and the analytical models.
3. Results and Discussion
The variation of the maximum temperature at the outer surface of the hemisphere over time was plotted for the specified flight scenario, and it can be observed in Figure 7. Comparing the maximum temperature values derived from both the CFD simulations and the developed numerical approach alongside the variation of the recovery temperature reveals that there is a quite reasonable correlation between the outcomes of the proposed method and the CFD simulations throughout the heating phase. This phase was identified as the initial 13 s of flight, during which the recovery temperature exceeded the maximum outer temperature of the dome. However, a discrepancy in the results from the proposed method and the CFD simulations became apparent during the cooling phase, when the recovery temperature fell below the maximum outer temperature of the dome. This suggests that the heat flux estimations made by the numerical approach were slightly lower than those from the CFD simulations, particularly in the cooling phase, when the velocity of the flow is reduced due to deceleration.
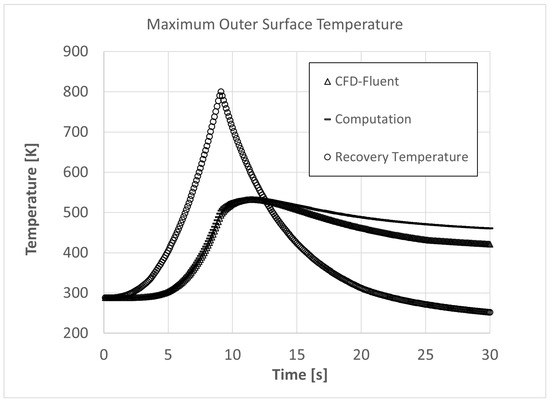
Figure 7.
Time history of the maximum outer surface and recovery temperature during flight.
The subsequent aspect of the comparative analysis focused on the temperature distributions across the outer and inner surfaces of the dome, as showcased in Figure 8. Here, the temperature profiles on the dome’s outer and inner surfaces at 5, 10, 15, and 20 s of the flight are demonstrated. Echoing the trends observed in the maximum temperature graph in Figure 7, the temperature profiles derived from both the numerical and CFD simulations show significant alignment up to the 15 s mark, with discrepancies becoming more evident at 20 s. A notable similarity in these findings is the temperature difference between areas near the stagnation point and the shoulder area () of the dome. The heat flux on the outer boundary was estimated utilizing an adapted correlation from turbulent flat plate flow. This method tended to underestimate temperatures at the stagnation point by up to 15% compared to the results obtained from the CFD simulations. Discrepancies observed near the dome’s shoulder in the numerical findings versus the CFD simulations are also noteworthy. The proposed method tended to overestimate temperature values in this region, as it was based on modified Newtonian theory, which is incapable of capturing flow separation effects. The separation that may occur in regions close to the shoulder cannot be modeled accurately with the current approach. Therefore, the temperature values estimated by the proposed method were higher than the temperature values obtained from CFD simulations.
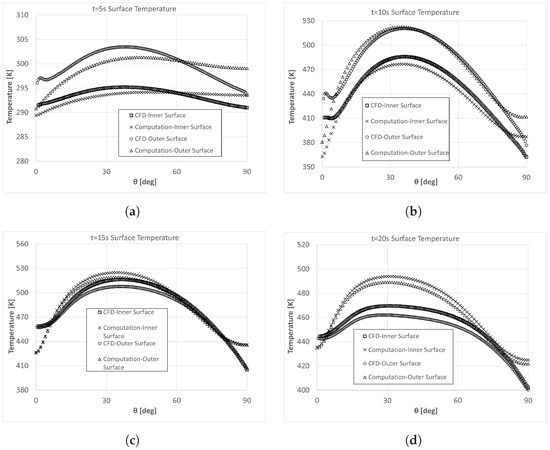
Figure 8.
Inner and outer temperature distributions for (a) 5 (b) 10 (c) 15 (d) 20 s of flight.
In conclusion, the outcomes derived from the numerical approach are in good agreement with those from the CFD simulations, exhibiting a maximal variation of about 15%. This variance is notably evident in the stagnation area and its surroundings for the majority of the flight’s duration. As mentioned earlier, due to the inability of the correlation to capture the separation effects, the differences between temperature distribution near the shoulder were also visible. Moreover, these temperature discrepancies became more pronounced during the cooling phase, when the recovery temperature fell beneath the maximum surface temperature, likely due to the presence of adverse pressure gradient during the reduction of velocity, which caused flow separation. Even though the observed discrepancy may be significant, it is crucial to consider that this level of accuracy is particularly noteworthy, given the substantial reduction in computational resources and time required by the proposed method compared to CFD simulations. In the context of aerothermal analysis, where experimental or simulation methods often struggle to deliver reliable results within reasonable time frames, the proposed numerical approach potentially offers a highly effective and efficient alternative that could be useful during the preliminary design phase.
4. Conclusions
The proposed methodology provided results that were in good agreement with those from CFD simulations, delivering temperature profiles across hemispherical domes with a reasonable degree of accuracy. The efficiency of the proposed methodology is a significant advantage over the traditional CFD simulations. The proposed method requires merely 180 s on a single CPU to model 30 s of flight, compared to the extensive computational demands of conventional CFD, which requires approximately 88,473,600 CPU seconds. This efficiency is achieved without compromising the accuracy to an unacceptable extent, making it highly valuable for preliminary design phases and real-time simulations.
The calculations with the numerical model were conducted on a single CPU. In contrast, the CFD simulations were conducted on a High-Performance Computing (HPC) cluster. This stark difference in computational requirements underscores the practicality and resourcefulness of the proposed method. While the CFD approach potentially offers higher accuracy, the proposed method provides a rapid and reasonably accurate alternative that can significantly accelerate the design and analysis process. Such rapid calculation capabilities prove invaluable during the preliminary design phase of missiles and in identifying critical points. Additionally, this system offers flexibility, potentially incorporating enhancements, such as the transition from laminar to turbulent flow, variations in the angle of attack, and the impact of surface roughness without significantly increasing computational load or altering the fundamental model.
Future Directions for Method Improvement
While the proposed methodology demonstrates significant efficiency and reasonable accuracy, several areas for potential enhancement have been identified. Addressing these limitations in future work could further improve the reliability and applicability of this numerical approach.
The current model assumes fully turbulent flow conditions. However, incorporating a model to simulate the transition from laminar to turbulent flow could enhance accuracy. This addition would allow the model to better capture the thermal and fluid dynamics in a broader range of flight conditions. In addition, the model assumes an axisymmetric flow with a zero angle of attack and sideslip angle. Extending the model to include variations in these angles could provide more comprehensive predictions for different flight scenarios. This enhancement would be particularly useful for simulating real-world scenarios where the missile or vehicle may not always travel perfectly aligned with the flow. Furthermore, improvements in the accuracy and efficiency of the code could be achieved by improving the numerical accuracy by transforming the equations solved [25].
Additionally, the capability of modeling more complex geometries, such as ogive nose and 3D wing profiles, could be explored. These profiles are commonly used in aerospace applications, due to their favorable aerodynamic characteristics. The ogive nose profile is utilized for reducing drag and improving performance in supersonic regimes, whereas the 3D wing profile is investigated mostly for optimizing lift-to-drag ratios and handling characteristics in varying flight conditions [26,27,28]. Extending the model to include these shapes could enhance its applicability to a wider range of aerospace vehicles. Moreover, to handle more complex geometries and model deforming boundaries, methods such as the immersed boundary method [29] or the immersed finite element method [30] could be employed. These methods can be particularly useful for simulating phenomena like ablation, where the outer surface nodes undergo deformation. If needed, CPU parallelization could also be implemented in the code, to address computational needs introduced by modeling complex phenomenon and geometries. Finally, experimental validation with relevant geometry might be added to the numerical model, to benchmark and refine its predictions against real-world data, similar to the study of Duarte et al. [9]. The parametric system identification method, as outlined in the aforementioned study, aims to integrate experimental data into the mathematical framework of aerodynamic heating, to estimate the average heat transfer coefficient. This approach involves adjusting the calculated final temperatures, to align with known experimental temperature data, thereby estimating the heat flux.
Author Contributions
Both authors have contributed equally to the conceptualization, methodology, software, validation, formal analysis, investigation, data curation, original draft preparation, review and editing, and visualization. Supervision is provided exclusively by A.C.G. All authors have read and agreed to the published version of the manuscript.
Funding
The authors declare that this research received no external funding.
Data Availability Statement
The data utilized in this study were specifically created and represented for the purposes of this research. These data are not publicly archived but are available from the corresponding author upon request and permission.
Conflicts of Interest
Author Arif Cem Gözükara was employed by the company Aselsan, Inc., and author Uygar Ateş Ceylan was employed by Atlas Copco Airpower NV. Both authors declare that the research was conducted in the absence of any commercial or financial relationships that could be construed as a potential conflict of interest, and that the content of the article is in agreement with their respective employers.
References
- Beckwith, E.I.; Gallagher, J.J. Heat Transfer and Recovery Temperatures on a Sphere with Laminar, Transitional and Turbulent Boundary Layers, at Mach Numbers of 2.00 and 4.15; Technical Note 4125; NACA (National Advisory Committee for Aeronautics): Langley Field, VA, USA, 1959.
- Chauvin, L.T.; Maloney, J.P. Experimental Convective Heat Transfer to a 4-Inch and 6-Inch Hemisphere at Mach Numbers from 1.62 to 3.04; Research memorandum; NACA (National Advisory Committee for Aeronautics): Langley Field, VA, USA, 1954.
- Reshotko, E.; Cohen, C.B. Heat Transfer at the Forward Stagnation Point of Blunt Bodies; Technical Note 3513; NACA (National Advisory Committee for Aeronautics), Lewis Flight Propulsion Laboratory: Cleveland, OH, USA, 1955.
- Stine, H.A.; Wanlass, K. Theoretical and Experimental Investigation of Aerodynamic-Heating and Isothermal Heat-Transfer Parameters on a Hemispherical Nose with Laminar Boundary Layer at Supersonic Mach Numbers; Technical Note 3344; NACA (National Advisory Committee for Aeronautics), Ames Aeronautical Laboratory: Santa Clara, CA, USA, 1954.
- Van Driest, E.R. The Problem of Aerodynamic Heating. In Aeronautical Engineering Review; Institute of the Aeronautical Sciences: Los Angeles, CA, USA, 1956; pp. 26–41. [Google Scholar]
- Kouroupis, J.B. Flight capabilities of high-speed-missile radome materials. Johns Hopkins APL Tech. Dig. 1992, 13, 3. [Google Scholar]
- Trotta, P. Precision conformal optics technology program. Proc. SPIE-Int. Soc. Opt. Eng. 2001, 4375, 96–107. [Google Scholar]
- Yu, J.; Fan, Z. The correction of dynamic aero-optical aberration of optical dome at different altitudes using wavefront coding. Optik 2022, 252, 168535. [Google Scholar] [CrossRef]
- Duarte, G.F.R.; Silva, M.G.d.; Castro, B.d.M. Aerodynamic Heating of Missile/Rocket—Conceptual Design Phase. In Proceedings of the 20th International Congress of Mechanical Engineering (COBEM 2009), ABCM, Gramado, RS, Brazil, 15–20 November 2009. [Google Scholar]
- Martinelli, S.K.; Braun, R.D. Centerline Heating Methodology for use in Preliminary Design Studies. In Special Problems Report; AE8900 MS Special Problems Report; Guggenheim School of Aerospace Engineering, Georgia Institute of Technology: Atlanta, GA, USA, 2010. [Google Scholar]
- DeJarnette, F.R.; Davis, R.M. A Simplified Method of Calculating Laminar Heat Transfer over Bodies at an Angle of Attack; Technical Report NASA TN-4720; NASA: Washington, DC, USA, 1968.
- Smyth, D.N.; Loo, H.C. Analysis of Static Pressure Data from 1/12-Scale Model of the YF-12A. Volume 3: The MARK IVS Supersonic-Hypersonic Arbitrary Body Program, User’s Manual; Technical Report NASA-CR-151940; NASA: Washington, DC, USA, 1981.
- McDonnell Douglas Corporation. A Miniature Version of the JA70 Aerodynamic Heating Computer Program H800 (MINIVER); Technical Report MDC 60642; McDonnell Douglas Corporation: St. Louis, MO, USA, 1972. [Google Scholar]
- Zoby, E.; Simmonds, A.L. Engineering Flowfield Method with Angle-of-Attack Applications. J. Spacecr. Rocket. 1985, 22, 398–404. [Google Scholar] [CrossRef]
- Riley, C.J.; DeJarnette, F.R.; Zoby, E.V. Surface Pressure and Streamline Effects on Laminar Heating Calculations. J. Spacecr. Rocket. 1990, 27, 9–14. [Google Scholar] [CrossRef]
- Kinney, D.J. Aero-Thermodynamics for Conceptual Design. In Proceedings of the 42nd AIAA Aerospace Sciences Meeting and Exhibit, Reno, NV, USA, 5–8 January 2004. Number AIAA-2004-31-962. [Google Scholar]
- Jain, A.; Hayes, J. Hypersonic Pressure, Skin-Friction, and Heat Transfer Distributions on Space Vehicles: Planar Bodies. AIAA J. 2004, 42, 2060–2068. [Google Scholar] [CrossRef]
- Hollis, B.R.; Horvath, T.J.; Berry, S.A.; Hamilton, H.H.; Thompson, R.A.; Alter, S.J. X-33 Computational Aeroheating Predictions and Comparisons with Experimental Data. In Proceedings of the 33rd AIAA Thermophysics Conference, Norfolk, VA, USA, 28 June–1 July 1999; pp. 99–3559. [Google Scholar]
- Quinn, R.D.; Gong, L. Real-Time Aerodynamic Heating and Surface Temperature Calculations for Hypersonic Flight Simulation; Technical Memorandum NASA TP-2914; NASA (National Aeronautics and Space Administration), Ames Research Center: Edwards, CA, USA, 1990.
- Şimşek, B.; Uslu, S.; Ak, M.A. Validation of Aerodynamic Heating Prediction Tool. Isı Bilim. Tek. Derg. 2020, 40, 53–63. [Google Scholar]
- NOAA-S/T 76-1562; U.S. Standard Atmosphere, 1976. Technical Report. NOAA: Washington, DC, USA; NASA: Washington, DC, USA; USAF: Washington, DC, USA, 1976.
- Anderson, J.D., Jr. Hypersonic And High Temperature Gas Dynamics; AIAA: Reston, VA, USA, 2006. [Google Scholar]
- Falkner, V.M. A New Law for Calculating Drag: The Resistance of a Smooth Flat Plate With Turbulent Boundary Layer. Aircr. Eng. 1943, XV, 65–69. [Google Scholar] [CrossRef]
- Mangler, W. Compressible Boundary Layers on Bodies of Revolution; Technical Report 47; Office of the Publication Board, Department of Commerce: Washington, DC, USA, 1946.
- Temimi, H.; Ben-Romdhane, M.; Baccouch, M.; Musa, M. A two-branched numerical solution of the two-dimensional Bratu’s problem. Appl. Numer. Math. 2020, 153, 202–216. [Google Scholar] [CrossRef]
- Conlan-Smith, C.; Ramos-García, N.; Sigmund, O.; Andreasen, C.S. Aerodynamic Shape Optimization of Aircraft Wings Using Panel Methods. AIAA J. 2020, 58, 3765–3776. [Google Scholar] [CrossRef]
- Javadhpour, S.; Rahmati, B.; Khorasani Nezhad, E.; Maryami, R. Optimization of Radar Cross Section and Drag Coefficient of Ogive Nose Using the NSGA-II Algorithm. J. Radar 2019, 7, 53–63. [Google Scholar]
- Mayo, E.E.; Weisskopf, G.A.; Hutton, C.I. Nose Optimization Study, Part I: Comparative Performance of Tangent Ogive and Conical Noses; Technical Report; Goddard Space Flight Center: Washington, DC, USA, 1965.
- Peskin, C. The immersed boundary method. Acta Numer. 2002, 11, 479–517. [Google Scholar] [CrossRef]
- Zhang, L.; Gay, M. Immersed finite element method for fluid-structure interactions. J. Fluids Struct. 2007, 23, 839–857. [Google Scholar] [CrossRef]
Disclaimer/Publisher’s Note: The statements, opinions and data contained in all publications are solely those of the individual author(s) and contributor(s) and not of MDPI and/or the editor(s). MDPI and/or the editor(s) disclaim responsibility for any injury to people or property resulting from any ideas, methods, instructions or products referred to in the content. |
© 2024 by the authors. Licensee MDPI, Basel, Switzerland. This article is an open access article distributed under the terms and conditions of the Creative Commons Attribution (CC BY) license (https://creativecommons.org/licenses/by/4.0/).