Abstract
This paper proposes a method for determining the optimal parameters for the thermal testing of plant tissues of fruits and vegetables containing surface and subsurface defects in the form of areas of plant tissues with different thermophysical characteristics. Based on well-known mathematical models for objects of predominantly flat, cylindrical and spherical shapes containing flat, spherical and cylindrical regions of defects, numerical solutions of three-dimensional, non-stationary temperature fields were found, making it possible to measure the power and time of the thermal exposure of the sample surface to the radiation from infrared lamps using the finite element method. This made it possible to ensure the reliable detection of a temperature contrast of up to 4 °C between the defect and defect-free regions of the test object using modern thermal imaging cameras. In this case, subsurface defects can be detected at a depth of up to 3 mm from the surface. To determine the parameters of mathematical models of temperature fields, such as thermal conductivity and a coefficient of the thermal diffusivity of plant tissues, a new method of a pulsed heat flux from a flat heater is proposed; this differs in the method of processing experimental data and makes it possible to determine the required characteristics with high accuracy during the active stage of the experiment in a period not exceeding 1–3 min.
1. Introduction
Computer vision systems can effectively detect defects in plant tissue through the analysis of images of fruits and vegetables obtained in the range of 8–13 microns [1]. In this case, the main conditions are significant differences in the thermophysical characteristics (TPCs) of defect and defect-free zones of the test object, as well as the correctly selected operating parameters of the non-contact, non-destructive thermal testing process, which provide the required temperature contrast between the different quality zones of plant tissue [2]. To determine the operating parameters of thermal testing, it is necessary to solve the problem of the mathematical modeling of heat transfer in heterogeneous spherical bodies containing inclusions (defects) with thermal characteristics that differ from the characteristics of the base material. In this regard, the problem of determining the parameters of mathematical models—the coefficient of thermal diffusivity and the thermal conductivity of substances included in the defect and defect-free zones of the test object—arises.
The analysis of literary sources makes it possible to conclude that, in most cases, mathematical models of heat transfer in bodies made of heterogeneous materials are developed for objects in the form of a plate, cylinder or sphere. The formulation of the problem of heat transfer in a heterogeneous material in the form of an unlimited plate is described in [3,4], where the problem of the freezing of wet soil in a thawed state and having a certain specified distribution of temperature and moisture can be considered classical. At the same time, it should be borne in mind that the process of heat transfer in plant tissues of fruits and vegetables differs significantly from similar processes in the soil due to the different shapes of the objects. In [3,5], the coupled problems of stationary thermal conductivity in a non-uniform body consisting of several homogeneous parts, in each of which the thermal conductivity coefficient of the material depends on the temperature distribution in the body, are considered. However, this approach is not applicable when modeling the process of unsteady heat transfer. From this perspective, Reference [6] is of particular interest, as it considers a mathematical model of the temperature field in a multilayer inhomogeneous ball consisting of several layers. Each layer, at each moment of time, is characterized by internal and external radii, temperature, specific heat capacity, density, thermal conductivity, humidity and heat release density. In this study, dependence was proposed for calculating the layer temperature as a function of the Fourier number. The proposed model can be used to calculate the temperature field in objects of plant origin if their shape is close to spherical, such as apples. However, it does not take into account the influence of defects localized in a limited volume of the object. In [7], a mathematical model of a multilayer cylinder of finite dimensions with a defect in the inner layer is considered. The solution can be obtained using a numerical method. At the same time, the proposed mathematical model makes it possible to determine the temperature fields in a multilayer cylinder during its cooling and the presence of defects in the inner layer. The presented model can be used to describe the temperature field in cylindrical objects of plant origin (for example, carrots and onions). In [8], a model of the temperature field in a flat object with cylindrical defects was proposed. In [9], heat transfer in layered rod structures is considered [9]. In [10], based on a statistical model, an artificial neural network model and a finite element model, the temperature fields of flat objects with various inclusions are studied.
In [11,12,13,14], mathematical models of temperature fields of crack-shaped defects are presented. It is noted that the spread of heat in an object leads to the appearance of a complex temperature field distribution on its surface. By formally fixing this and solving the inverse problem of non-stationary thermal conductivity, the approximate position and dimensions of the defect can be found. Thus, the known methods of the analytical modeling of temperature fields in heterogeneous media can be used for certain geometric shapes and inclusions. At the same time, due to the need to calculate three-dimensional temperature fields, the models contain a number of simplifications, which can significantly reduce their accuracy. The most promising seems to be the numerical modeling of the parameters of heterogeneous objects [15], including temperature fields [16], using the finite element method [17]. In [18,19], this modeling method was used for objects containing a solid phase with pores and cracks [20] filled with another substance, which made it possible to calculate changes in temperature, mechanical stress and phase deformation in heterogeneous objects of an arbitrary shape, including nanoobjects. Modeling heat transfer processes in plant tissues is complicated by the need to take into account the diffusion of moisture and its subsequent evaporation. Similar studies were carried out to simulate the processes of drying corn grains [21] and cocoa beans [22], potatoes [23], etc. The mathematical models used to study the drying process make it possible to determine the optimal operating parameters that ensure minimal energy consumption to remove moisture from the product. However, their complexity inevitably entails costs for computing power and time resources to calculate the three-dimensional temperature fields in control objects. When determining the optimal operating parameters of active thermal testing, one should take into account the need to limit the power of thermal exposure in order to ensure the safety of plant tissues. This also makes it possible to heat the plant tissues so that the thermophysical properties can be considered constant. In [24,25], models were developed that make it possible to determine the operating parameters of laser radiation (power, heating spot area, etc.) acting on the surface of a sample according to a non-stationary temperature distribution, providing the necessary temperature contrast between the defect and defect-free zones of the test object, and also the determination of their geometric parameters, calculated using regression models.
Reference [26], focusing on the development of mathematical models in problems of thermal diagnostics, suggests that forecasting the durability of composite structural elements (CSEs) with defects can also be useful in developing algorithms to determine the shelf life of plant products. The task of predicting durability is considered to be calculating the damage parameters of CSEs with diagnosed defects under the influence of external mechanical factors for a given period, as well as calculating the limiting time to failure. The study also contains a mathematical formulation of the geometric inverse problem of thermal conductivity to recognize three-dimensional shapes and types of defects in CSEs and a numerical method for solving it.
In [27,28,29], the process of thermal conductivity in a heterogeneous medium is modeled by a homogeneous matrix with cylindrical inclusions separated by a contact layer. Also, in these papers, a study was carried out of the influence of the thickness and material of the layer on the effective properties of the matrix–layer–inclusion system and temperature profiles were obtained for configurations with different concentrations of inclusions and the surface layer, as well as for the different thermal conductivity coefficients of the components.
To determine the thermophysical characteristics of materials, one can use experimental data on the thermophysical characteristics of plant tissues taken from authoritative scientific publications [30,31], or calculated dependencies [30], including those obtained using machine learning technologies and artificial neural networks (ANNs) [32]. However, it should be borne in mind that thermophysical characteristics may differ depending on the variety, as well as the place of growth. Therefore, the most reliable method for obtaining information about the values of thermophysical properties is still a thermophysical experiment.
Thus, the literature review showed, on the one hand, that existing mathematical models of heat transfer in heterogeneous media, as a rule, do not take into account the finite dimensions of the test object and are designed to determine the presence of inclusions of a certain geometric shape. On the other hand, their numerical implementation requires significant computing resources due to their complexity and, as a rule, their nonlinearity. The objectives of the research described in this paper are to adapt known mathematical models of temperature fields for such objects as fruit trees and vegetable crops containing surface and subsurface defects; to obtain a numerical solution of the presented mathematical models in order to determine the optimal power and time of external thermal exposure, ensuring an acceptable temperature contrast between the defect and defect-free zones; and to develop a method and configure a measuring device for the express goal of determining the thermophysical characteristics of plant tissues of control objects, the values of which are used as parameters of mathematical models.
2. Materials and Methods
2.1. A Mathematical Model of the Temperature Field of a Spherical Object with Defects
When writing mathematical models in the form of boundary value problems of thermal conductivity, which make it possible to calculate the temperature fields of test objects (TO) (or their local areas), the following assumptions were made. Test objects of plant origin, such as apples, potatoes, oranges and lemons, have a spherical shape (Figure 1). The defects they contain, including rot, bruises, hail holes and scabs, are close in shape to the shape of the surface area of the object on which they are located. Let us assume that V1, V2, V3 and V4 are a set of points x, y and z, belonging to healthy 1 (Figure 1) tissues of the test object, and tissues containing defects of flat shape 2 (thickness H), cylindrical shape 3 or spherical shape 4 (radius R), respectively. Defects are located at a distance h from the surface of the object. Similarly, S1, S2, S3 and S4 are a set of points x, y and z belonging to the outer surface of healthy tissues and tissues damaged by defects in the corresponding shape. The initial temperature T0 of plant tissues will be considered constant and uniformly distributed throughout the volume of the test object. When the test object is exposed to a heat flux from a heat source, the change in temperature T on the surface and inside the object does not exceed 3–5 °C. With such a change in the surface temperature of the test object, the thermophysical properties of plant tissues can be considered independent of temperature and constant over time.

Figure 1.
Physical model of spherical objects with defects. A, B, C are the cutting planes for tissues containing defects of flat, cylindrical and spherical shapes respectively.
Taking the temperature field model of a spherical body [33,34] as the basis, we proposed a mathematical model of the temperature field of a spherical body containing all three types of defects under consideration. In the general case, this can be written in the form of a boundary value problem of thermal conductivity [35]:
where λ, c, ρ and a are the thermal conductivity, specific heat capacity, density and thermal diffusivity of plant tissues, respectively; τ is time; n is a single vector normal to the surface S of the corresponding region of the test object; q is specific heat flux density from an external heat source. Since, during the experiment, the test object was exposed to a thermal effect lasting about 20–30 s, for the specified time, in the center of the test object (x = y = z = 0), the temperature changes so insignificantly that we neglected this change. Therefore, at the center of the sample, the boundary conditions specified by Equation (5) can be used. Also, due to the insignificant heating of the test object, we neglected the change in thermophysical properties.
Note that taking into account the insignificant, relative to the initial values, temperature difference in plant tissues during the thermal testing, instead of the boundary condition specified by the Stefan–Boltzmann law, we used the boundary condition of the second kind (3), where is the duration of heat exposure on the test object when diagnosing defects.
When mathematically describing the temperature field of a spherical body with defects 1′, 2′ and 3′, located on its surface, we supplemented boundary Condition (3) with the following equations:
When modeling the temperature field of objects of plant origin that have a spherical shape and contain internal and external defects, it is necessary to know the thermophysical characteristics of the corresponding plant tissues. To study TPCs, the method described below is proposed.
2.2. A Mathematical Model of the Temperature Field in a Flat Sample When Exposed to a Pulsed Heat Source
To determine the TPCs of plant tissues, samples 1–3 were cut out from the spherical body under study (Figure 2a), having the shape of plates with a thickness l. A low-inertia flat heater 4 was placed between samples 2 and 3. The electric heater (Figure 2b) was made of permalloy foil 4, fixed in dielectric holders 6. Slots 7 were made in the foil to ensure the specified electrical resistance of the heater: 1.57 Ohms. The outermost elements of the heater were equipped with electrical contacts 8, to which wires are connected to supply electrical voltage. Since the heater was made of thin foil, the duration of the power pulse supplied to it was 20–30 s; then, during mathematical modeling, we neglected the inertia during heating. The main junction of a differential thermocouple 5 was installed between samples 1 and 2, and an additional junction of the same thermocouple was installed on the lower surface of sample 3.
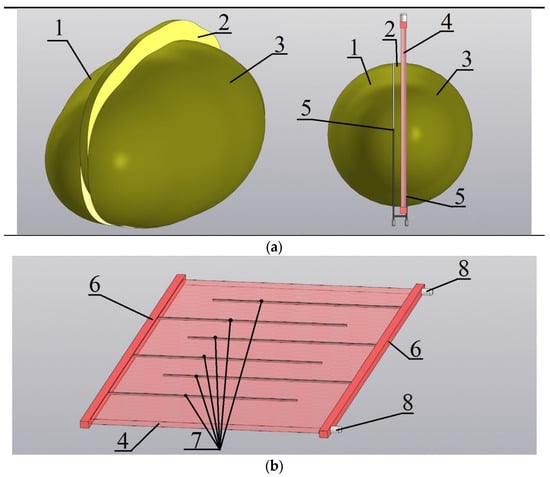
Figure 2.
A physical model of the measuring device (a) and electric heater (b).
When an electric voltage pulse is applied to the heater, the temperature field in sample 2 can be written in the form of a boundary value problem:
where T(x, τ) is temperature of the sample under study in the plane with coordinate x at time τ, counted from the moment the thermal pulse begins to be supplied; T0 is the initial temperature; q is the heat flux supplied to the sample over a period of time ; h(τ), h(τ − τimp) are unit asymmetric step functions specified by the following relations:
τimp is the duration of the thermal pulse when determining TPCs. We neglected the dependence of the desired thermophysical properties on temperature, since the temperature of plant tissues in the area of thermal exposure during the experiment changed by no more than 5 °C.
The solution to the boundary value problem (6)–(9) has the form
where
- is a special function that is an integral of the function
- is Gaussian error function.
For time , the above solution will take the form
where , are dimensionless functions depending on and .
From the analysis of Expression (11), it is clear that, at some point in time, the change in the temperature difference reached its maximum value . And, at the specified point in time, corresponds to a certain value of the dimensionless function .
3. Results
The algorithm used to conduct the experiment and determine the desired TPCs ensures that, during time τimp, a constant power P is supplied to a flat electric heater of area S (), and the change in time corresponding to temperature differences is recorded using a signal from a differential thermocouple. Based on the experimental data obtained, the maximum value of the temperature difference is found and the experiment is completed when the condition is met. The experimental data obtained are used to determine thermal conductivity and thermal diffusivity. To achieve this, for a set of values λx, ax, selected from the ranges amin < ax < amax, λmin < λx < λmax in which the required TPCs may lie, the values of the functional are determined, where Tt(l, τi) is the theoretical temperature calculated at time τi using model (11) for a given TPC; N is the number of temperature values recorded during the experimental measurement of thermophysical properties. For the pair , F min is taken as the desired TPC.
Using the described algorithm, the TPCs of plant tissues of fruits and vegetables were obtained. As an example, Table 1 shows the mathematical expectation M and standard deviation D of the results of five measurements of the TPCs of healthy and disease-affected potato plant tissues. Using the obtained TPC values and the mathematical ones described above, the modeling of temperature fields in spherical objects with defects of various shapes was performed.

Table 1.
TPCs of plant tissues of fruits and vegetables.
As an example, we consider the procedure for validating a mathematical model of heat transfer in an ellipsoid-shaped object (Figure 3a) with the major and minor semi-axes having dimensions of 64–70 mm and 23–65 mm, respectively. The indicated size ranges correspond to the range of average sizes of potato tubers used as seeds for planting. The defect has a spherical shape and is located at a depth h of up to 3 mm below the surface. Defects located at a depth of more than three millimeters cannot be detected by the proposed thermal method. The ratio of the volume of defect V3 to the total volume V0 of the simulated object was in the range of 1–3%, which approximately corresponds to the range of radii of spherical defects of 2.3–10.5 mm in the smallest and largest tubers. Calculations of the temperature field on the surface of the model were carried out at the object’s initial temperature of T0 = 20 °C. On the external surface of the test object, a heat flux q with a specific power of 50–3000 W/m2 was set, acting for a time τm in the range 1–5 s. When choosing the specified ranges of heat flux density and time of thermal exposure for the test object, we were guided by the following considerations. The longer we act on a potato tuber and the greater the heat flux density, the more the tuber heats up. This leads to the thermal destruction of its tissues and reduces its shelf life. The lower the heat flux density on the surface of the tuber and the shorter the period for which heat is applied to the tuber, the less likely it is that a defect will be detected. Taking this into account, it was experimentally found that the choice of the indicated ranges will allow, on the one hand, for a defect to be detected; on the other hand, it will not lead to the potato tissue heating above 5 °C relative to the initial temperature of 20 °C. For given values of τm and q, the temperature field on the surface of the test object was calculated (Figure 3b), and then the absolute value of the maximum temperature difference ∆Tmax in the defect region and in the region of undamaged tissue was calculated. An experiment was conducted in which a real test object, a potato tuber (Figure 3c), was exposed to a heat flux q for time τm and the temperature field was measured using a Fluke Ti32 thermal imager (Figure 3d). Next, ∆Tmax was calculated.
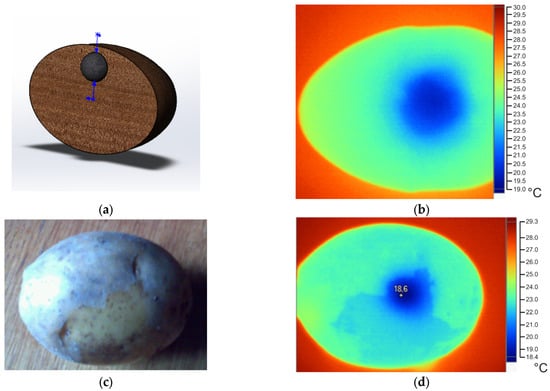
Figure 3.
A 3D model of spherical object with a subsurface spherical defect (a), the temperature field on its surface in the defect area (top view) (b), a real potato tuber with an internal defect (c) and the temperature field on its surface (d).
Figure 4 shows examples of a comparison of theoretical (solid line) and experimental (dotted lines) values of ∆Tmax, calculated for test objects with spherical defects such as dry rot (Figure 4a) and late blight type (Figure 4b), obtained for heat flux q in the range of 50–1500 W/m2 at time τm of the thermal exposure of the object in the range of 1–5 s.
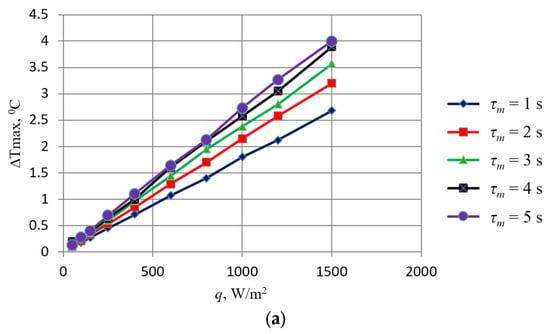
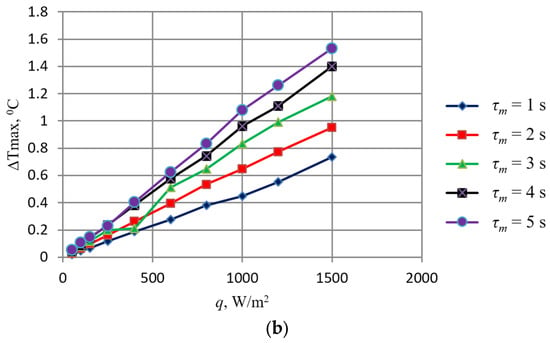
Figure 4.
Dependency graphs |∆Tmax| = f(q) for spherical subsurface: (a) dry rot; (b) late blight defect.
The obtained calculation data make it possible, depending on the sensitivity of the thermal imaging equipment used for thermal inspection, to select the minimum power of thermal exposure and its duration, ensuring defect recognition. For example, as is shown in Figure 4, it is clear that when a defect occurs at a depth of up to 3 mm at q = 300 W/m2 and τ1 = 1 s, a temperature difference ∆Tmax of about 0.5 °C will be observed in the region where the defect occurs, which is sufficient for detection by a thermal imager with a sensitivity of 0.05 °C.
The developed recommendations made it possible to select the optimal parameters of thermal impact on the test object. As an example, Figure 5 shows photographs of defect potatoes obtained in the visible and infrared regions of the radiation spectrum when objects were exposed to a heat flux with a density of 300 W/m2 for a time of 2.4 s.
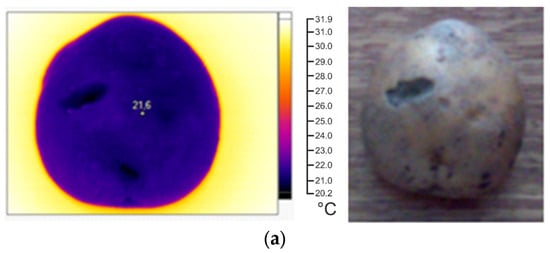
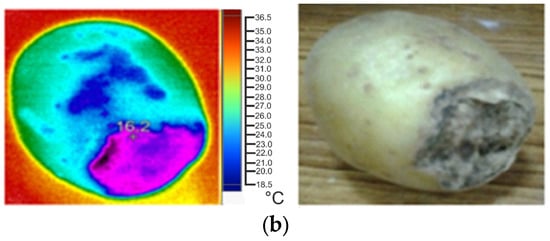
Figure 5.
Photographs of defect-free and defect tissues of potato in the infrared and visible regions of the spectrum: (a) dry rot; (b) late blight.
Figure 5 shows that the temperature in the defect area and in the defect-free area of a potato tuber tissue after thermal exposure differs by 1.4 °C. The temperature field of defect-free potato tissue is uniform. However, a temperature gradient is observed in the defect area. This allows for the use of a thermal imager to detect defects such as dry rot (Figure 5a) or late blight (Figure 5b). This can be achieved as follows. When a potato tuber is heated briefly, for up to 5 s, by an external heat source with a power of up to 1500 W/m2, a temperature contrast in the defect area will be observed on the thermal imaging image, which allows it to be detected.
4. Conclusions
When thermally inspecting defects in objects of plant origin, there are risks of thermal damage to plant tissue due to prolonged or high-intensity thermal exposure. On the other hand, insufficient power of the thermal influence may lead to some defects, especially those located under the surface of test objects, not being detected. Therefore, it is necessary to determine the optimal parameters of thermal exposure, particularly the exposure time and power of radiation sources. To solve the problem, based on well-known mathematical models for objects of predominantly flat, cylindrical and spherical shapes containing flat, spherical and cylindrical areas of defects, numerical solutions of three-dimensional non-stationary temperature fields were obtained, which made it possible to determine, using the finite element method, the power and time of the thermal impact on the surface of the sample due to radiation from infrared lamps. This made it possible to ensure reliable detection by modern thermal imaging cameras of a temperature contrast of up to 4 °C between the defect and defect-free zones of the test object. In this case, subsurface defects can lie at a depth of up to 3 mm from the surface.
To determine the parameters of mathematical models of temperature fields, such as the thermal conductivity and the coefficient of thermal diffusivity of plant tissues, a new method of a pulsed source of heat flow from a flat heater is proposed, which differs in the method of processing experimental data and makes it possible to determine the required characteristics with high accuracy during the active stage of the experiment, in a period not exceeding 1–3 min.
The experiments conducted to test the thermal testing method for detecting damaged plant tissues of a potato tuber showed that when exposed to heat from infrared lamps with a power of up to 1500 W for 3–5 s, surface and subsurface defects are quite distinguishable in infrared images obtained using a Fluke Ti32 thermal imager technical vision systems, which allows for the use of thermal testing to sort potatoes before storing them or before sending them to the consumer.
Author Contributions
P.B., A.D., A.E., S.P. and H.A.Z.: conceptualization, software, data curation, writing—original draft preparation, writing—review and editing, supervision and funding acquisition; P.B., V.Y. and S.B.: validation, formal analysis, investigation, visualization and writing—original draft preparation. All authors have read and agreed to the published version of the manuscript.
Funding
This research was funded by financial support from the Ministry of Science and Higher Education of the Russian Federation within the framework of the project “Development of a robotic complex of ground and air unmanned platforms for use in agricultural technologies” (124062100023-3).
Data Availability Statement
Data are contained within the article.
Conflicts of Interest
The authors declare no conflicts of interest.
References
- Samanian, N.; Mohebbi, M. Thermography a New Approach in Food Science Studies: A Review. MOJ Food Process. Technol. 2016, 2, 110–119. [Google Scholar] [CrossRef]
- Ballester, C.; Jiménez-Bello, M.A.; Castel, J.R.; Intrigliolo, D.S. Usefulness of thermography for plant water stress detection in citrus and persimmon trees. Agric. For. Meteorol. 2013, 168, 120–129. [Google Scholar] [CrossRef]
- Zhao, L.; Gray, D.M.; Male, D.H. Numerical analysis of simultaneous heat and mass transfer during infiltration into frozen ground. J. Hydrol. 1997, 200, 345–363. [Google Scholar] [CrossRef]
- Lykov, A.V. Theory of Thermal Conductivity; Vysshaya Shkola: Moscow, Russia, 1967; p. 600. (In Russian) [Google Scholar]
- Zarubin, V.S.; Rodikov, A.V. Mathematical simulation of the temperature state of an inhomogeneous body. High Temp. 2007, 45, 243–254. [Google Scholar] [CrossRef]
- Kurmachev, Y.U.F. Mathematical Modeling of the Thermal Field of a Multilayer Inhomogeneous Ball in an Unsteady Mode; Science & Education Scientific Edition of Bauman; MSTU: Murfreesboro, TN, USA, 2007; Available online: https://cyberleninka.ru/article/n/matematicheskoe-modelirovanie-teplovogo-polya-mnogosloynogo-neodnorodnogo-shara-pri-nestatsionarnom-rezhime/viewer (accessed on 5 July 2024).
- Sinitsyn, N.N.; Shestakov, I.V. Mathematical modeling of the temperature field of mixer armor taking into account a defect on the inner surface. Cherepovets State Univ. Bull. 2008, 4, 118–120. [Google Scholar]
- Sinitsyn, N.N.; Makonkov, A.V.; Belozor, M.Y. Modeling of a non-stationary temperature field of asphalt pavement with rubber filler. In Modern Materials, Equipment and Technology, Proceedings of the 4th International Scientific and Practical Conference, Kursk, Russia, 25–26 December 2014; University Book Closed Joint Stock Company: Kursk, Russia, 2014; pp. 400–403. [Google Scholar]
- Stankevich, I.V. Mathematical modeling of the temperature state of spatial rod structures made of inhomogeneous materials. Symb. Sci. 2016, 13, 53–57. [Google Scholar]
- Li, J.; Yang, Y.; Liu, M. Research progress in the prediction of heat transfer properties of fabrics based on structural characteristics. Adv. Text. Technol. 2022, 30, 18–25. [Google Scholar] [CrossRef]
- Kotel’nikov, V.V. Mathematical modeling of the process of formation of a temperature field on a defect in the form of a crack in the region of a stress raiser. Occup. Saf. Ind. 2008, 5, 51–58. (In Russian) [Google Scholar]
- Rittel, D. Thermomechanical aspects of dynamic crack initiation. Int. J. Fract. 1999, 99, 201–212. [Google Scholar] [CrossRef]
- Zvyagin, A.V.; Udalov, A.S.; Shamina, A.A. Numerical modeling of heat conduction in bodies with cracks. Acta Astronaut. 2024, 214, 196–201. [Google Scholar] [CrossRef]
- Esfarjani, A.A.; Nazari, M.B.; Bayat, S.H. Dynamic crack propagation in variable stiffness composite laminates under thermal shock. Theor. Appl. Fract. Mech. 2024, 130, 104325. [Google Scholar] [CrossRef]
- Salman, M.; Schmauder, S. Multiscale modeling of shape memory polymers foams nanocomposites. Comput. Mater. Sci. 2024, 232, 112658. [Google Scholar] [CrossRef]
- Jin, L.; Zhang, R.; Du, X. Characterisation of temperature-dependent heat conduction in heterogeneous concrete. Mag. Concr. Res. 2018, 70, 325–339. [Google Scholar] [CrossRef]
- She, Z.; Wang, K.; Li, P. Hybrid Trefftz polygonal elements for heat conduction problems with inclusions/voids. Comput. Math. Appl. 2019, 78, 1978–1992. [Google Scholar] [CrossRef]
- Marin, M.; Hobiny, A.; Abbas, I. The effects of fractional time derivatives in porothermoelastic materials using finite element method. Mathematics 2021, 9, 1606. [Google Scholar] [CrossRef]
- Chen, Y.; Sandhofer, S.N.; Wong, B.M. SHORYUKEN: An open-source software package for calculating nonlocal exchange interactions in nanowires. Comput. Phys. Commun. 2024, 300, 109197. [Google Scholar] [CrossRef]
- Zhou, L.; Zhu, Z.; Que, X. Simulation of non-fourier heat conduction in discontinuous heterogeneous materials based on the peridynamic method. Therm. Sci. 2023, 27, 917–931. [Google Scholar] [CrossRef]
- Wei, S.; Wang, Z.; Wang, F.; Xie, W.; Chen, P.; Yang, D. Simulation and experimental studies of heat and mass transfer in corn kernel during hot air drying. Food Bioprod. Process. 2019, 117, 170–182. [Google Scholar] [CrossRef]
- Hii, C.L.; Law, C.L.; Law, M.C. Simulation of heat and mass transfer of cocoa beans under stepwise drying conditions in a heat pump dryer. Appl. Therm. Eng. 2013, 54, 264–271. [Google Scholar] [CrossRef]
- Heshmati, M.K.; Khiavi, H.D.; Dehghannya, J.; Baghban, H. 3D simulation of momentum, heat and mass transfer in potato cubes during intermittent microwave-convective hot air drying. Heat Mass Transf. 2023, 59, 239–254. [Google Scholar] [CrossRef]
- Divin, A.G.; Karpov, S.V. Using Laser Point Scanning Thermography for Quality Monitoring of Products Made of Composite Materials. Eng. Technol. Syst. 2024, 34, 145–163. [Google Scholar] [CrossRef]
- Divin, A.G.; Ponomarev, S.V. Application of Laser Scannung Thermography and Regression Analysis to Determine Characteristics of Defects in Polymer Composite Materials. Russ. J. Nondestruct. Test. 2024, 60, 40–48. [Google Scholar] [CrossRef]
- Nikolaev, A.A. Mathematical Modeling in Problems of Thermal Diagnostics and Forecasting the Durability of Composite Structural Elements with Defects. Tver: Ph.D. Diss. in Phys. and Math. Sci.: 05.13.18 Mathematical Modeling, Numerical Methods and Software Packages. 2010, p. 148. (In Russian). Available online: https://www.dissercat.com/content/matematicheskoe-modelirovanie-v-zadachakh-teplovoi-diagnostiki-i-prognozirovaniya-dolgovechn (accessed on 5 July 2024).
- Savatorova, V.L.; Talonov, A.V.; Vlasov, A.N. Homogenization of thermoelasticity processes in composite materials with periodic structure of heterogeneities. ZAMM Zeitschrift Angew. Math. Mech. 2013, 93, 575–596. [Google Scholar] [CrossRef]
- Vlasov, A.N.; Savatorova, V.L.; Talonov, A.V. Asymptotic averaging technique for heat conduction problems with phase transitions in layered media. J. Appl. Mech. Tech. Phys. 1995, 36, 773–780. [Google Scholar] [CrossRef]
- Savatorova, V.L.; Talonov, A.V. Heat transfer in a composite material with structural hierarchy. Compos. Mech. Comput. Appl. 2021, 12, 45–59. [Google Scholar] [CrossRef]
- Donsì, G.; Ferrari, G.; Nigro, R. Experimental determination of thermal conductivity of apple and potato at different moisture contents. J. Food Eng. 1996, 30, 263–268. [Google Scholar] [CrossRef]
- Muniandy, A.; Benyathiar, P.; Mishra, D.K.; Ozadali, F. Dynamic thermal properties estimation using sensitivity coefficients for rapid heating process. Foods 2021, 10, 1954. [Google Scholar] [CrossRef] [PubMed]
- Sablani, S.S.; Rahman, M.S. Using neural networks to predict thermal conductivity of food as a function of moisture content, temperature and apparent porosity. Food Res. Int. 2003, 36, 617–623. [Google Scholar] [CrossRef]
- Carslaw, H.S.; Jaeger, J.C. Conduction of Heat in Solids; Clarendon Press: Oxford, UK, 1984; p. 532. [Google Scholar]
- Polyanin, A.D. Handbook of Linear Partial Differential Equations for Engineers and Scientists; Chapman & Hall/CRC: Boca Raton, FL, USA, 2002; p. 735. [Google Scholar] [CrossRef]
- Ponomarev, S.V.; Divin, A.G.; Ponomareva, E.S. Mathematical Models of Temperature Fields of Potato Tubers with Surface and Internal Defects. Adv. Mater. Technol. 2017, 4, 65–75. [Google Scholar] [CrossRef]
Disclaimer/Publisher’s Note: The statements, opinions and data contained in all publications are solely those of the individual author(s) and contributor(s) and not of MDPI and/or the editor(s). MDPI and/or the editor(s) disclaim responsibility for any injury to people or property resulting from any ideas, methods, instructions or products referred to in the content. |
© 2024 by the authors. Licensee MDPI, Basel, Switzerland. This article is an open access article distributed under the terms and conditions of the Creative Commons Attribution (CC BY) license (https://creativecommons.org/licenses/by/4.0/).