Article

Application of Smart Condensed H-Adsorption Nanocomposites in Batteries: Energy Storage Systems and DFT Computations

by
Fatemeh Mollaamin
1,* and
Majid Monajjemi
2
1
Department of Biomedical Engineering, Faculty of Engineering and Architecture, Kastamonu University, Kastamonu 37150, Turkey
2
Department of Chemical Engineering, Central Tehran Branch, Islamic Azad University, Tehran 1496969191, Iran
*
Author to whom correspondence should be addressed.
Computation 2024, 12(12), 234; https://doi.org/10.3390/computation12120234
Submission received: 29 September 2024 / Revised: 23 October 2024 / Accepted: 1 November 2024 / Published: 27 November 2024

Abstract

:
A comprehensive investigation of hydrogen grabbing towards the formation of hetero-clusters of AlGaN–H, Si–AlGaN–H, Ge–AlGaN–H, Pd–AlGaN–H, and Pt–AlGaN–H was carried out using DFT computations at the CAM–B3LYP–D3/6-311+G (d,p) level of theory. The notable fragile signal intensity close to the parallel edge of the nanocluster sample might be owing to silicon or germanium binding-induced non-spherical distribution of Si–AlGaN or Ge–AlGaN hetero-clusters. Based on TDOS, the excessive growth technique of doping silicon, germanium, palladium, or platinum is a potential approach to designing high-efficiency hybrid semipolar gallium nitride devices in a long-wavelength zone. Therefore, it can be considered that palladium or platinum atoms in the functionalized Pd–AlGaN or Pt–AlGaN might have more impressive sensitivity for accepting the electrons in the process of hydrogen adsorption. The advantages of platinum or palladium over aluminum gallium nitride include its higher electron and hole mobility, allowing platinum or palladium doping devices to operate at higher frequencies than silicon or germanium doping devices. In fact, it can be observed that doped hetero-clusters of Pd–AlGaN or Pt–AlGaN might ameliorate the capability of AlGaN in transistor cells for energy storage.

1. Introduction

The nitrides of group III of the periodic table have a low sensitivity to ionizing radiation, which makes them appropriate materials for solar cell arrays for satellites. Therefore, space applications could also benefit, as devices have shown stability in high-radiation environments [1,2].
Ternary “AlGaN” alloys have been recognized as promising materials for realizing deep ultraviolet “DUV” optoelectronic devices with operating wavelengths down to 200 nm [1,2,3]. For the development of high-performance AlGaN-based “DUV” devices, high-conductivity p-type Al-rich AlxGa1−xN (x ≥ 0.4) is essential. Many studies have shown that enhancing p-type conductivity has a significant effect on the improvement of both the electrical and optical properties of AlGaN DUV optoelectronics [4,5,6,7,8].
The influence of two different methods of silicon doping in the AlGaN layer; that is, modulation-doping (MD) and delta-doping (DD), on the optical and electrical performance of deep ultraviolet light-emitting diodes (DUV-LEDs) has been investigated. Both the photoluminescent and electroluminescent intensities in the Si-DD structure are stronger than those obtained using the Si-MD method, while the forward voltage and reverse leakage current are slightly smaller in the DD structure than that in the MD structure [9].
Compared with the MD structure, the DD structure shows higher capacitance–voltage characteristics. This study suggests that the DD method can improve the optical and electrical performance of DUV-LEDs [10,11,12].
In this paper, we propose a feasible ternary semiconductor of aluminum gallium nitride doped with silicon, germanium, palladium, or platinum. We carried out molecular modeling considering the geometrical parameters of doping atoms on the surface of AlGaN based on the absorption status and current charge density of the solar cells. Moreover, the effect of a relative chemical shift between AlGaN and doped hetero-clusters of the transistor cell was also investigated.

2. Materials and Methods

Hydrated nanoclusters of AlGaN–H, Si–AlGaN–H, Ge–AlGaN–H, Pd–AlGaN–H, and Pt–AlGaN–H were modeled in the presence of hybrid alloys of AlGaN, Si–AlGaN, Ge–AlGaN, Pd–AlGaN, and Pt–AlGaN, which can increase the hydrogen storage in semiconductor transistors [13,14]. The Si-, Ge-, Pd-, or Pt-doped AlGaN nanocages were calculated within the framework of first-principles calculations based on density functional theory (DFT) (Figure 1). The rigid potential energy surface using density functional theory [15,16,17,18,19,20,21,22,23,24,25,26,27] was performed using the Gaussian 16 revision C.01 program package [28] and GaussView 6.1 [29]. The coordination input for energy storage on the solar cells was determined by applying 6-311+G (d,p) and EPR–3 basis sets.
Figure 1 shows the process of energy storage on hetero-clusters of AlGaN, Si–AlGaN, Ge–AlGaN, Pd–AlGaN, or Pt–AlGaN, which are varied to maximize the absorption in the active region. Furthermore, we optimized the structural parameters of nanocluster of AlGaN doped with silicon, germanium, palladium, and platinum towards formation of hetero-clusters of Si–AlGaN, Ge–AlGaN, Pd–AlGaN, and Pt–AlGaN for obtaining the highest short-circuit current density.
In this function, we needed to input the index of the atoms in the ring in a clockwise manner, including Al5, Si5, Ge5, Pd5, Pt5, N4, Ga15, N7, Ga6, and N12 (Figure 1a–e). Then, we calculate the total ring area and total ring perimeter for a tailored ring as 9.6981 Å2 and 11.6921 Å2, respectively (Figure 1a–e).
As DFT is used for computational chemistry, the hybrid functional Becke 3-parameter Lee–Yang–Parr (B3LYP) [30] appears to offer the greatest contribution. A new hybrid exchange–correlation functional named the Coulomb-Attenuating Method with B3LYP (CAM-B3LYP) is proposed, which combines the hybrid qualities of B3LYP and the long-range correction [31].
Additionally, in the DFT–D3 method of Grimme et al., the following expression for the van der Waals (vdW) dispersion energy-correction term is used [32]:
E d i s p = 1 2   i = 1 N α t j = 1 N α t L f d , 6   r i j , L C 6 i j r i j , L 6 + f d , 8   r i j , L C 8 i j r i j , L 8
The dispersion coefficients C 6 i j are geometry dependent, as they are adjusted based on the local geometry (coordination number) around atoms i and j. Additionally, Electron Paramagnetic Resonance (EPR) has been performed which is a method for studying materials with unpaired electrons. The basic concepts of EPR are analogous to those of NMR, but the spins excited are those of the electrons instead of the atomic nuclei [33]. Therefore, in our research, the calculations have been performed based on a CAM–B3LYP–D3/EPR–3 level of theory.

3. Results

In this article, the data are evaluated to determine the efficiency of hetero-clusters of AlGaN, Si–AlGaN, Ge–AlGaN, Pd–AlGaN, and Pt–AlGaN for adsorption energy and storage energy in transistors.

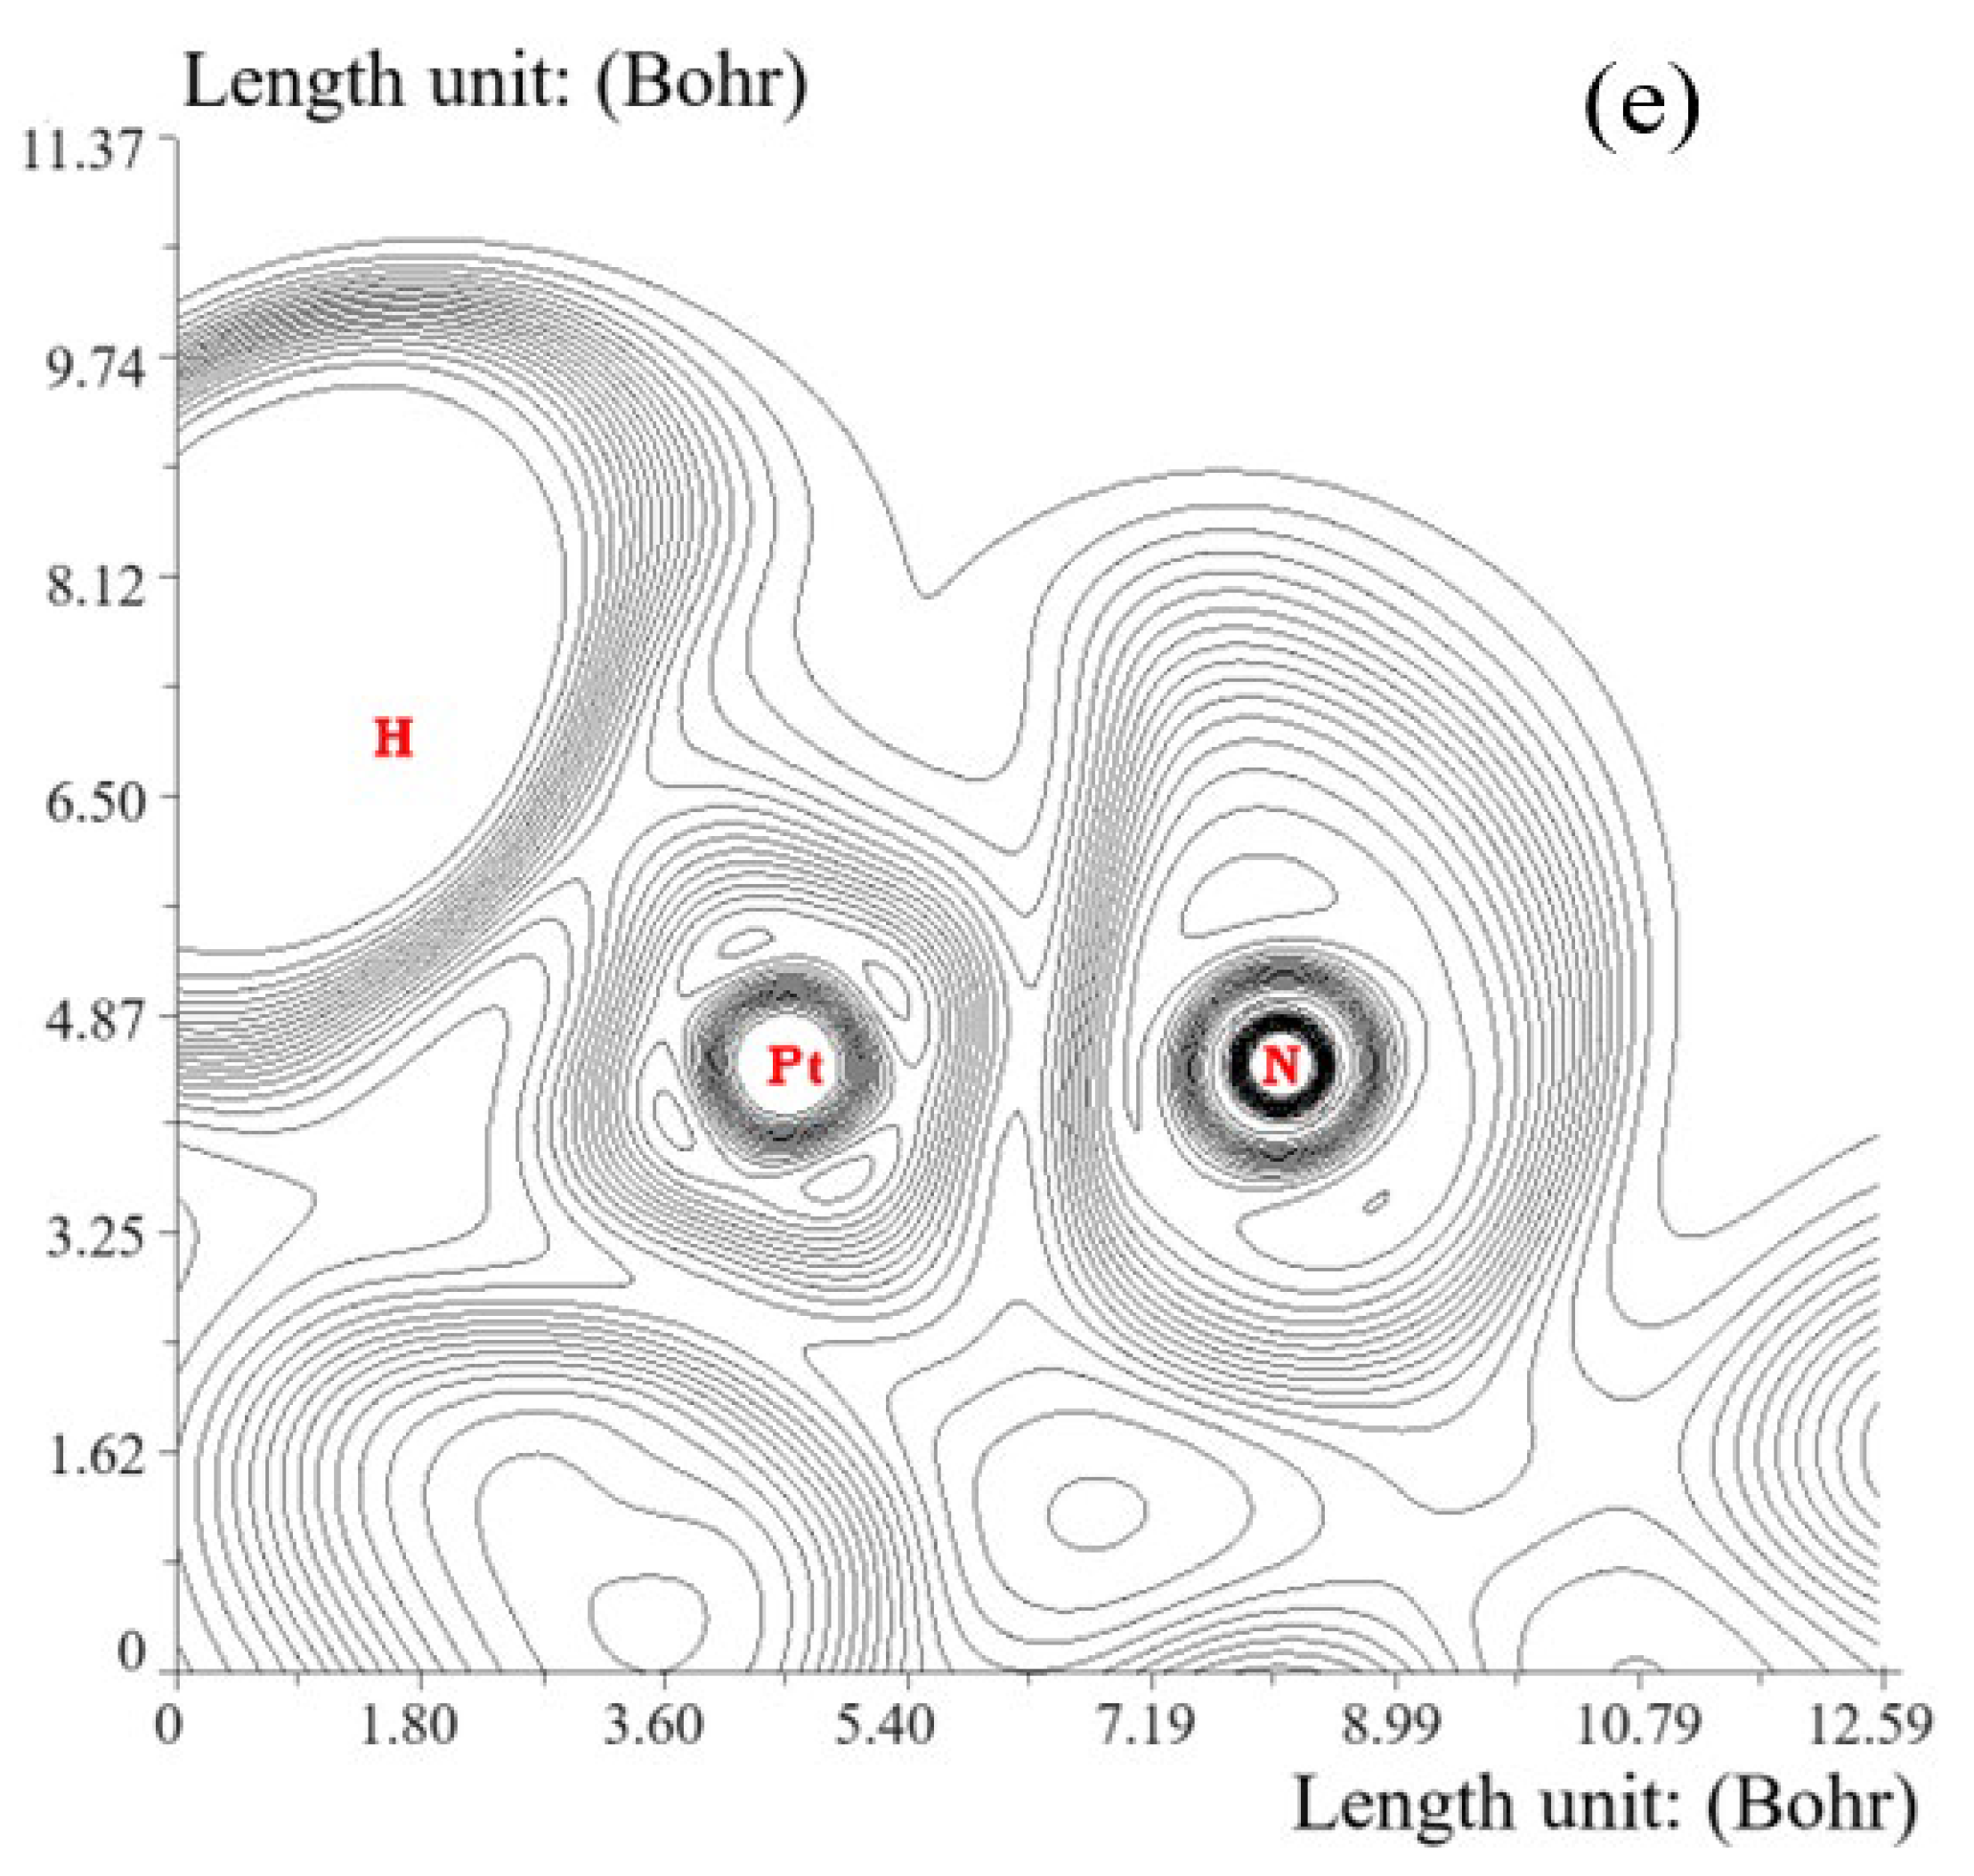
3.1. Elecrton Distribution Analysis

The values of charge density differences (CDDs) are measured by considering isolated atoms or noninteracting ones. The mentioned approximation can be the lightest to use because the superposition value may be received from the primary status of the self-consistency cycle in the code that carries out the density functional theory (Figure 2a–e) [34].
In Figure 2a, the atoms of Al5, H18 accompanying the nitrogen and gallium atoms from AlGaN and AlGaN–H, respectively, show fluctuations of approximately −9 to +3 Bohr. The atoms of Si5, H18 accompanying aluminum, gallium, and nitrogen from Si–AlGaN/Si–AlGaN–H, respectively, exhibit fluctuations around −9 to +3 Bohr (Figure 2b). However, the atoms of Ge5, H18 accompanying aluminum, gallium, and nitrogen from Ge–AlGaN and Ge–AlGaN–H exhibit fluctuations around −9 to +5 Bohr and −9 to +7 Bohr, respectively (Figure 2c). For two nanoclusters of Pd–AlGaN (Figure 2d) and Pt–AlGaN (Figure 2e), we observed fluctuations around −9 to −1 Bohr for aluminum, gallium, and nitrogen and Pd5 or Pt5 and H18 before H-adsorption and between −9 to +6 Bohr after H-adsorption.
To better understand the different adsorption characteristics of AlGaN–H, Si–AlGaN–H, Ge–AlGaN–H, Pd–AlGaN–H, and Pt–AlGaN–H, the total density of states (TDOS) using the Multiwfn program [35] were measured. This parameter can indicate the existence of important chemical interactions, often on the convex side (Figure 3a–e). In isolated systems, the energy levels are discrete, and the concept of density of state (DOS) is supposed to be completely valueless in this situation. Therefore, the original total DOS (TDOS) of isolated system is considered as follows [35]:
T D O S   E = i δ   ( E ϵ i   ) ,
G x = 1 c 2 π e x 2 2 c 2   where   c = F W H M 2 2 l n x
Moreover, the curve map of broadened partial DOS (PDOS) and overlap DOS (OPDOS) are valuable for visualizing orbital composition analysis. The PDOS function of fragment A is defined as follows:
P D O S A   E = i Ξ i , A   F   ( E ϵ i   ) ,
where Ξ i , A is the composition of fragment A in orbital i. The OPDOS between fragment A and B is defined as follows:
O P D O S A , B   E = i X A , B i   F   ( E ϵ i   ) ,
where X A , B i is the composition of the total cross term between fragments A and B in orbital i.
In the TDOS map, each discrete vertical line corresponds to a molecular orbital (MO), and the dashed line highlights the position of HOMO. The curve is the TDOS simulated based on the distribution of MO energy levels. In the negative part, the region around –0.30 a.u. has an obviously larger state density than other regions for AlGaN–H, Si–AlGaN–H, Ge–AlGaN–H, Pd–AlGaN–H, and Pt–AlGaN–H (Figure 3a–e). However, Pd–AlGaN–H (Figure 3e) and Pt–AlGaN–H (Figure 3d) showed larger state densities than Si–AlGaN–H (Figure 3b), Ge–AlGaN–H (Figure 3c), and AlGaN–H (Figure 3a). It is remarkable that the excessive growth technique on doping palladium or platinum as noble transition metals is a potential approach to designing high-efficiency hybrid semipolar gallium nitride devices on palladium or platinum layers in a long-wavelength zone.
Then, we defined N2, Al3, N4, X5 (X = Al, Si, Ge, Pd, Pt), Ga11, N12, and H18—atoms that are close to the hydrogen interactions in AlGaN–H, Si–AlGaN–H, Ge–AlGaN–H, Pd–AlGaN–H, and Pt–AlGaN–H—as fragment 1, and we illustrate the hetero-cluster alloy moieties as fragment 2, including N4, X5, Ga6, N10, N12, Al13, Ga15, and N17 to estimate their PDOS and OPDOS values. Furthermore, the atoms of Ga1, N7, Al8, N9, Al13, N14, N16, and N17 were defined as fragment 3 (Figure 3a–e).
Furthermore, a type of scalar fields called electron localization function (ELF) may demonstrate a broad span of bonding samples. Nevertheless, the distinction between deduced/raised electron delocalization/localization into cyclic π-conjugated sets is encouraging for ELF [36]. The more significant the electron localization is in an area, the more likely the electron movement is restricted within it. Therefore, these electrons might be distinguished from non-localized ones if they are centralized. As Bader investigated, zones with significant electron localization possess extensive magnitudes of Fermi hole integration. But, with a six-dimensional function for the Fermi hole, it is difficult to study directly. Then, Becke and Edgecombe [35] remarked that spherically averaged spin conditional pair probability possesses a direct correlation with the Fermi hole and proposed the parameter of the electron localization function (ELF), which is implemented in the Multiwfn program [35] and popularized for the spin-polarized procedure [37]:
E L F r = 1 1 + D ( r ) / D 0 ( r )
where   D r = 1 2   i η i φ i   ( r ) 2 1 8 ρ α   ( r ) 2 ρ α   ( r ) + ρ β   ( r ) 2 ρ β   ( r )
and   D 0 r = 3 10 6 π 2 2 / 3 ρ α   ( r ) 5 / 3 + ρ β   ( r ) 5 / 3
For a close-shell system, since ρ α = ρ β = 1 / 2 ρ , the D and D0 terms can be simplified as follows:
D r = 1 2   i η i φ i   ( r ) 2 1 8   ρ   ( r ) 2 ρ   ( r )      
and   D 0 r = ( 3 / 10 ) 3 π 2 2 / 3   ρ   ( r ) 5 / 3
Regarding kinetic energy, ELF was rechecked to be more punctual for both Kohn-Sham DFT and post-HF wavefunctions [38]. In fact, the excess kinetic energy density caused by Pauli repulsion was unfolded by D(r) and D0(r), which may be understood as Thomas–Fermi kinetic energy density. Because D0(r) is brought forward by the ELF as the origin, the ELF shows an affiliate localization. The compounds of AlGaN–H, Si–AlGaN–H, Ge–AlGaN–H, Pd–AlGaN–H, and Pt–AlGaN–H can be defined by ELF graphs, exploring the delocalization/localization characterizations of their electrons and chemical bonds (Figure 4a–e).
The counter-map of ELF for AlGaN–H showed the electron delocalization due to labeling atoms of N(4), Al(5), and H(18) (Figure 4a). Then, hydration of Si- and Ge-doped AlGaN indicates a larger isosurface map of electron delocalization due to the labeling of the N(4), Si(5), and H(18) atoms of Si–AlGaN–H (Figure 4b) and the N(4), Ge(5), and H(18) atoms of Ge–AlGaN–H (Figure 4c). A vaster jointed area engaged by an isosurface map for Pd and Pt doping of AlGaN results in the formation of hetero-clusters of Pd–AlGaN–H (Figure 4d) and Pt–AlGaN–H (Figure 4e) after hydrogen adsorption due to the labeling of atoms of N(4), Pd/Pt(5), and H(18), respectively. A narrower connected area occupied by an isosurface map means that electron delocalization is relatively difficult. However, the large counter-maps of ELF for Pt–AlGaN, Pd–AlGaN–H, Si–AlGaN, and Ge–AlGaN confirm that doping of Pd, Pt, Si, and Ge nanoparticles on the surface increases the efficiency of ternary transistor cells of AlGaN for energy storage.

3.2. Charge Transfer, Overlap Integral, and Bond Order Analysis

The changes in the charge density analysis illustrate that In3Ga4N9 showed a Bader charge of −1.272 coulomb, and after doping with silicon, germanium, palladium, and platinum, it exhibited Bader charges of −1.290, −1.285, −1.292, and −1.309 coulomb for Si–AlGaN, Ge–AlGaN, Pd–AlGaN, and Pt–AlGaN, respectively, describing the tensity value of these hetero-clusters for energy storage (Table 1).
Moreover, the intermolecular orbital overlap integral is important in discussions of intermolecular charge transfer, which can be used to calculate HOMO–HOMO and LUMO–LUMO overlap integrals between the hydrogen atom and hybrid hetero-clusters of AlGaN, Si–AlGaN, Ge–AlGaN, Pd–AlGaN, and Pt–AlGaN. The wavefunction level we used is CAM–B3LYP–D3/6-311+G(d, p), corresponding to the HOMO and LUMO, respectively (Table 2).
A strategy for increasing the square of an overlap integral (<S2>) of an electron in AlGaN is proposed via doping of Si, Ge, Pd, or Pt (Table 2) [29]. Therefore, ELUMO (a.u.), ELUMO (a.u.), and the local bandgap energies (∆E/a.u.) and immobile charges induced by polarization discontinuity are simultaneously controlled throughout the structures, and optimized band profiles are eventually achieved for AlGaN–H, Si–AlGaN–H, Ge–AlGaN–H, Pd–AlGaN–H, and Pt–AlGaN–H. <S2> was ameliorated after doping the semiconductor atoms of silicon and germanium and the noble transition metals of palladium and platinum on the ternary AlGaN alloy, which might increase electron charge transfer in superconductor devices. The Mayer bond order [39] is generally determined according to the empirical bond order for a single bond, which is close to 1.0. The Mulliken bond order [40] has a small correlation with the empirical bond order, but it is not appropriate for quantifying bonding strength. Instead, the Mayer bond order always performs better. However, the Mulliken bond order is a good qualitative indicator for the positive amount of bonding and negative amount of antibonding, which are evacuated and localized, respectively [Table 3].
As seen in Table 3, the Laplacian bond order [41] reflects the bond polarity, bond dissociation energy, and bond vibrational frequency. A low value of the Laplacian bond order might demonstrate that it is insensitive to the calculation degree applied for producing electron density. Generally, the Fuzzy bond order value is near the Mayer bond order, especially for low-polar bonds, but it is much more stable with respect to the change in basis-set. Computation of the Fuzzy bond order demands running Becke’s DFT numerical integration, resulting in a larger calculation value compared to the assessment of the Mayer bond order and a more precise result [42].

3.3. Nuclear Magnetic Resonance

Based on the resulting amounts, nuclear magnetic resonance (NMR) spectra of Si–AlGaN, Ge–AlGaN, Pd–AlGaN, and Pt–AlGaN hetero-clusters as potential molecules for energy storage can unravel the efficiency of these complexes in transistors. Based on the DFT calculations, the chemical shielding (CS) tensors in the principal axes system were determined to estimate the isotropic chemical shielding (CSI) and anisotropic chemical shielding (CSA) [43]:
  σ i s o = (   σ 11 +   σ 22 +   σ 33 ) / 3    
  σ a n i s o =   σ 33 (   σ 22 +   σ 11 ) / 2
The NMR data of the isotropic (σiso) and anisotropic shielding tensors (σaniso) for the ternary alloy of AlGaN and doped hetero-clusters of Si–AlGaN, Ge–AlGaN, Pd–AlGaN, and Pt–AlGaN through hydrogen adsorption were computed using the Gaussian 16 revision C.01 program package [28] and are shown in Table 4.
The notably fragile signal intensity close to the parallel edge of the nanocluster sample might be due to the silicon or germanium binding-induced non-spherical distribution of the Si–AlGaN (Figure 5a) or Ge–AlGaN (Figure 5b) hetero-clusters. Figure 5c,d shows the same tendency of shielding for palladium or platinum; however, a considerable deviation exists due to doping atoms of palladium or platinum as electron acceptors on the surface of Pd–AlGaN or Pt–AlGaN hetero-clusters.
The observed increase in the chemical shift anisotropy spans for the nanocages of Si–AlGaN/Si–AlGaN–H (Figure 5a) and Ge–AlGaN/Ge–AlGaN–H (Figure 5b) is near N(10), N(14), and N(17). The yield of electromagnetic shifting can be directed by the mentioned active nitrogen atoms extracted from ternary hybrid hereto-clusters. It was shown that the intensity for energy storage could be enhanced in Pd–AlGaN (Figure 5c) and Pt–AlGaN (Figure 5d) through hydration and formation of Pd–AlGaN–H and Pt–AlGaN–H due to the oscillating of chemical shielding in the N(10), N(14), N(16), and N(17) atoms. Therefore, it can be observed that doped hetero-clusters of Si–AlGaN, Ge–AlGaN, Pd–AlGaN, and Pt–AlGaN might ameliorate the capability of AlGaN in solar cells for energy storage.

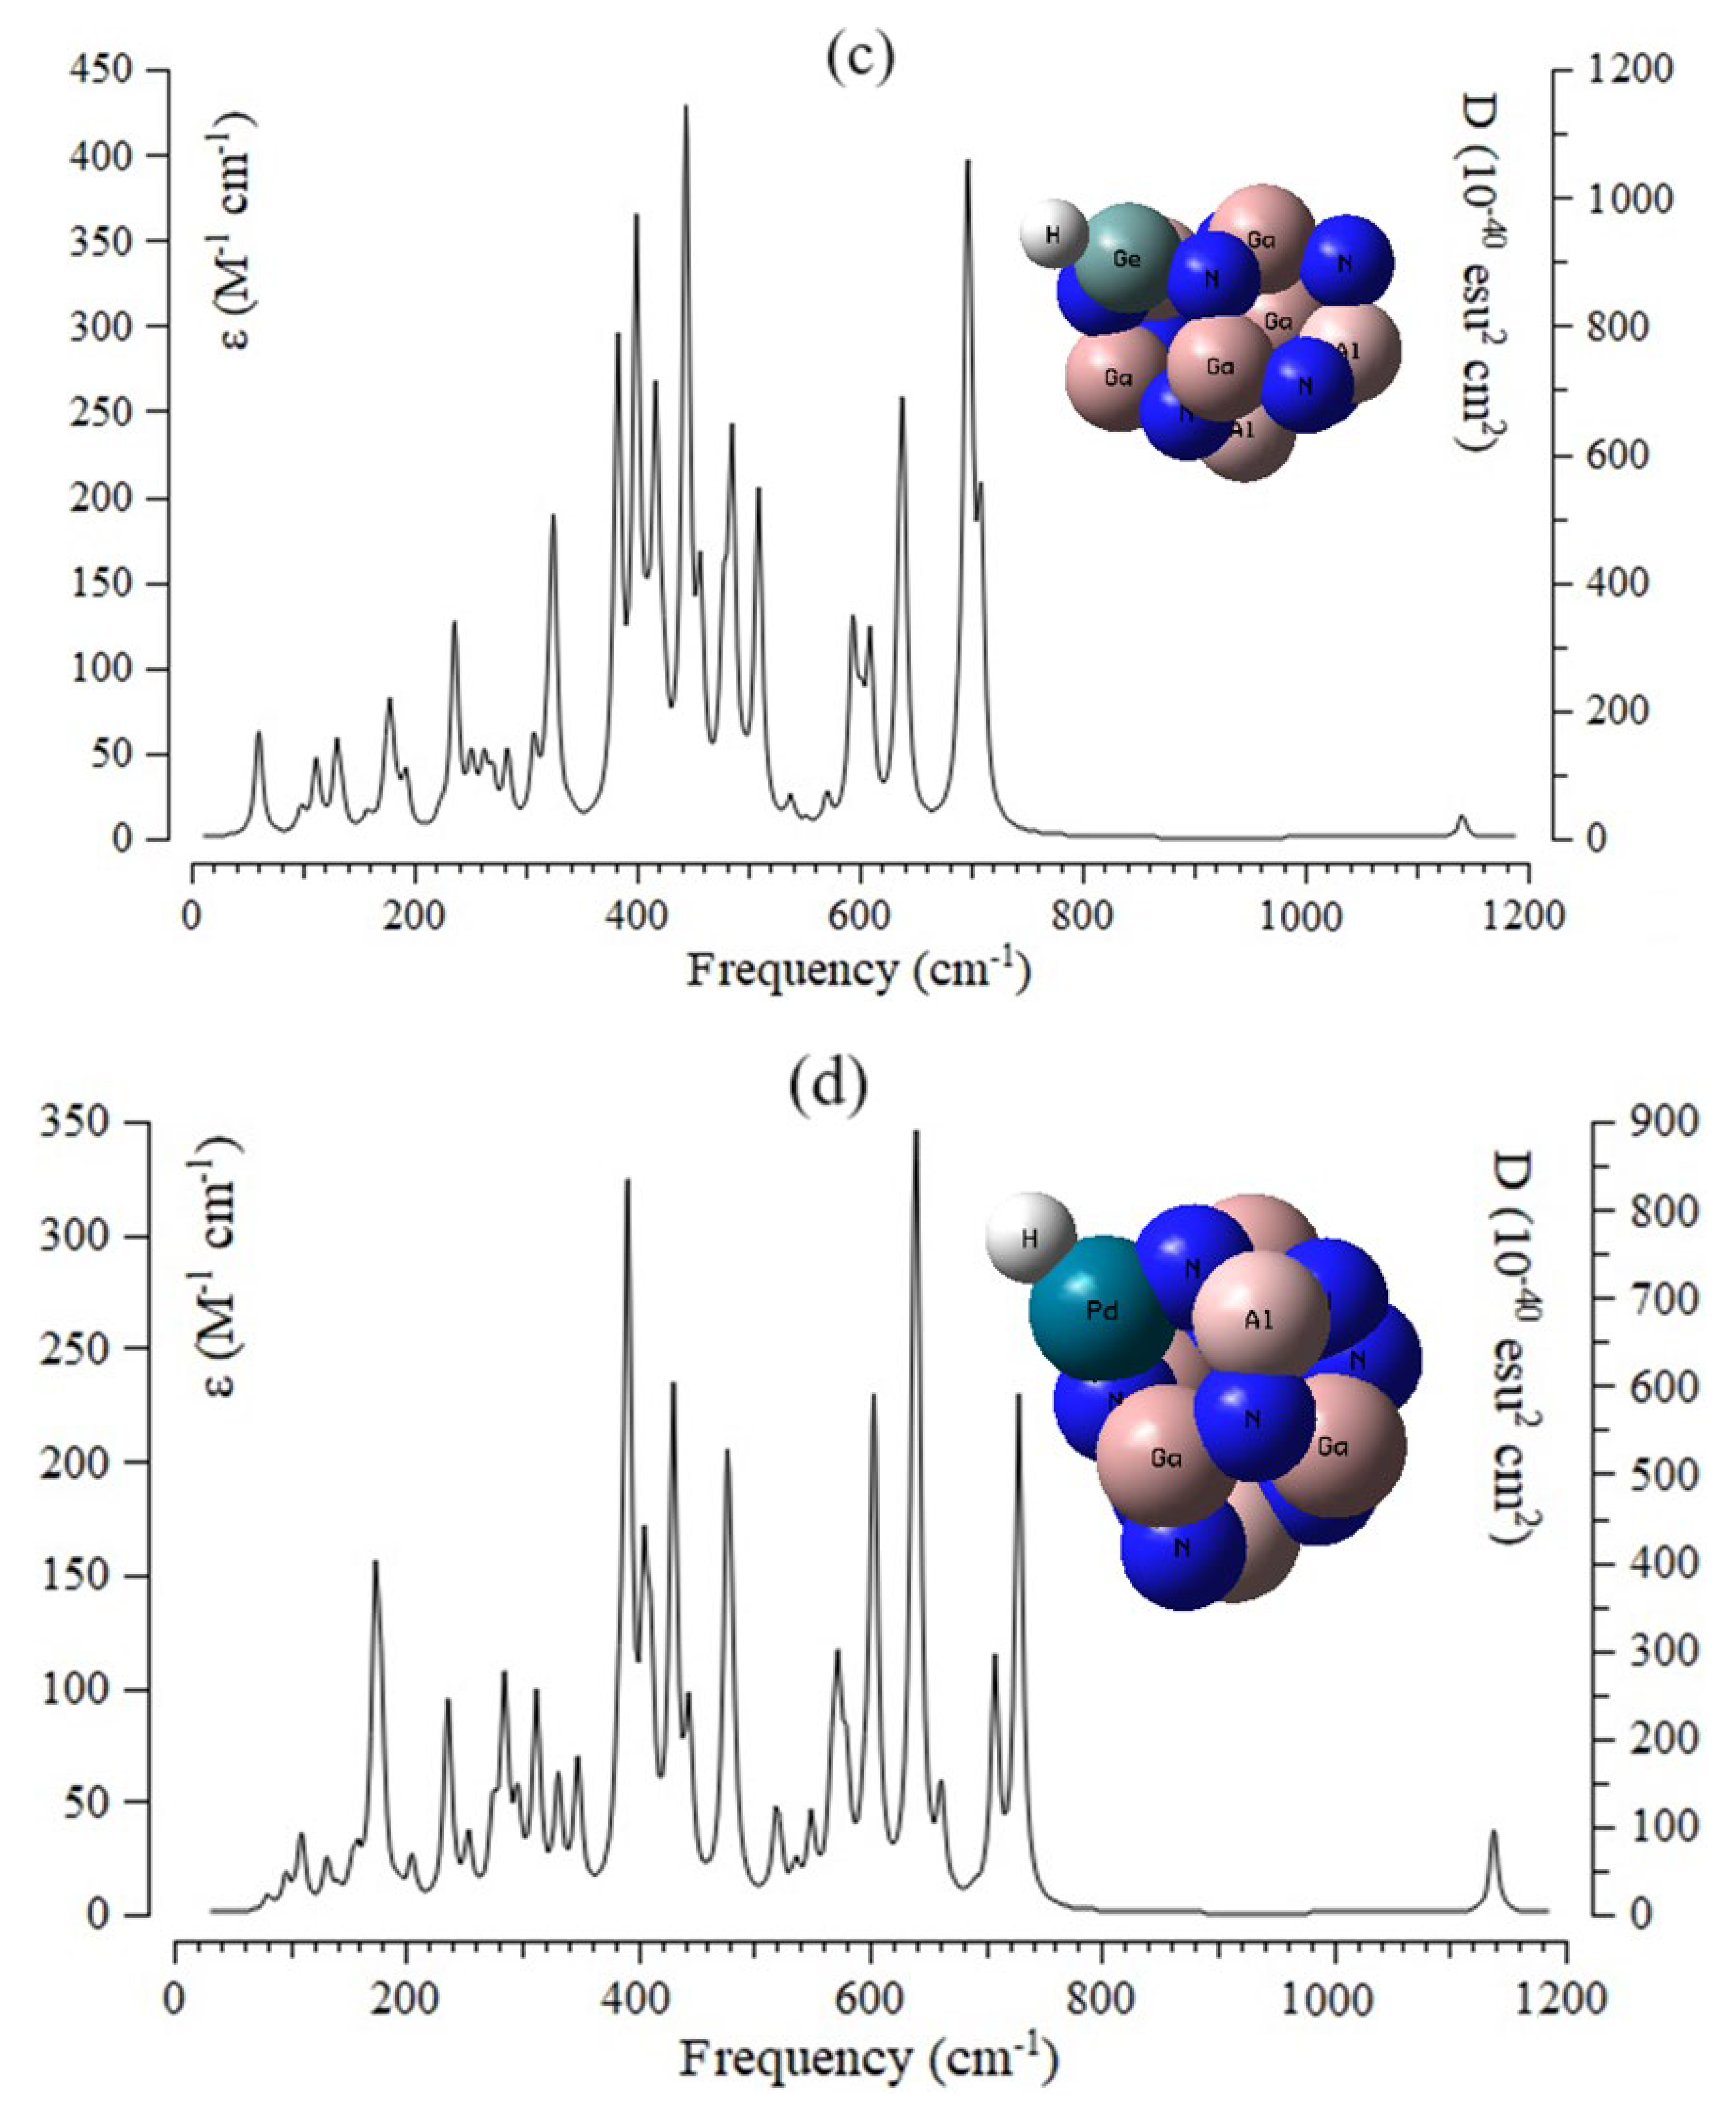
3.4. Insights of Infrared Spectroscopy and Thermochemistry

Infrared spectroscopy (IR) was performed for the ternary nanocage of AlGaN (Figure 6a) and hybrid alloys of Si–AlGaN (Figure 6b), Ge–AlGaN (Figure 6c), Pd–AlGaN (Figure 6d), and Pt–AlGaN (Figure 6e) based on hydrogen adsorption.
Frequency values in the IR curves of between 100 and 1000 cm−1 were obtained for AlGaN–H, with several sharp peaks around 396.73, 705.98, 793.75, and 941.91 cm−1 (Figure 6a). Figure 6b shows a frequency range of between 100 and 800 cm−1 for Si–AlGaN–H, with sharp peaks around 388.35, 403.32, and 606.23 cm−1. Figure 6c shows fluctuations in frequency between 100 and 800 cm−1 for Ge–AlGaN–H, with strong and sharp peaks around 399.71, 444.26, and 696.52 cm−1. The graph of Figure 6d shows the frequency range between 100 and 800 cm−1 for Pd–AlGaN–H, with several sharp peaks around 391.43, 477.43, 641.08, and 728.76 cm−1. Furthermore, the graph in Figure 6e shows the frequency range between 100 and 800 cm−1 for Pt–AlGaN–H, with several sharp peaks around 405.90, 433.01, 646.34, 674.46, and 722.73 cm−1.
The energy storage with the hetero-clusters demonstrates that the frame of the overcoming cluster is related to Pt–AlGaN or Pd–AlGaN in the high-frequency components. This property makes Pt–AlGaN or Pd–AlGaN potentially advantageous for certain high-frequency applications requiring transistor cells for energy storage. The advantages of platinum or palladium over aluminum gallium nitride include its higher electron and hole mobility, allowing platinum or palladium doping devices to operate at higher frequencies than silicon or germanium doping devices. Table 5, based on the thermodynamic specifications, shows that hetero-clusters of AlGaN, Si–AlGaN, Ge–AlGaN, Pd–AlGaN, or Pt–AlGaN might be more efficient structures for energy storage in the transistor cells.
Thermodynamic parameters of hetero-clusters of AlGaN/AlGaN–H, Si–AlGaN/Si–AlGaN–H, Ge–AlGaN/Ge–AlGaN–H, Pd–AlGaN/Pd–AlGaN–H, and Pt–AlGaN/Pt–AlGaN–H were assigned (Table 5). The changes in Gibbs free energy versus dipole moment could detect the maximum efficiency of Pd–AlGaN–H and Pt–AlGaN–H hetero-clusters for energy storage in the transistor cells through G a d s o (Figure 7).
The adsorption efficiency of AlGaN–H, Si–AlGaN–H, Ge–AlGaN–H, Pd–AlGaN–H, and Pt–AlGaN–H based on dipole moment was evaluated based on the G a d s o . The transistor cells formed by AlGaN, Si–AlGaN, Ge–AlGaN, Pd–AlGaN, and Pt–AlGaN feature a hierarchical structure with the electron donor/acceptor layer sandwiched by the anode and cathode, which highlights the importance of controlling the molecular crystal orientation, domain size, and vertical distribution to facilitate charge collection at the electrodes. In this paper, we demonstrated that the ternary semiconductor of aluminum gallium nitride structure can significantly enhance absorption in a broad spectral range of incident light in the presence of silicon, germanium, palladium, or platinum [44,45,46,47,48,49]. A comparison between transistor cells containing 4d and 5d transition metals of Pd and Pt-doped AlGaN, respectively, shows that a transistor containing these elements shows a more enhanced cell performance than cells containing only the bare AlGaN structure. This efficient doping strategy not only bridges the gaps of heteroatom-doped AlGaN-based semiconductor materials but can also provide deep insights into controlling the electrical and optical properties of these doping hybrid nanoclusters.

4. Conclusions

In summary, hydrogen grabbing on the hetero-clusters of AlGaN, Si–AlGaN, Ge–AlGaN, Pd–AlGaN, and Pt–AlGaN as transistor cells was investigated using first-principle calculations. We have provided a ternary semiconductor of an aluminum gallium nitride solar cell doped with silicon, germanium, palladium, or platinum. The geometrical parameters of doping atoms on the surface of AlGaN based on the absorption status and current charge density of the transistor cells were studied. Moreover, the effects of a relative chemical shift between AlGaN and doped hetero-clusters of the transistor cell were also investigated. Thermodynamic parameters were used to construct a detailed molecular model for atom–atom interactions and the distribution of point charges that can be utilized to reproduce the polarity of the solid material and the adsorbing molecules. It was determined that energy storage within hetero-clusters in the frame of the overcoming cluster is related to the high-frequency components of Pd–AlGaN or Pt–AlGaN. This property makes Pd–AlGaN or Pt–AlGaN potentially advantageous for certain high-frequency applications requiring transistor cells for energy storage due to hydrogen adsorption via the formation of AlGaN–H, Si–AlGaN–H, Ge–AlGaN–H, Pd–AlGaN–H, or Pt–AlGaN–H. The advantages of platinum or palladium over aluminum gallium nitride include its higher electron and hole mobility, allowing platinum or palladium doping devices to operate at higher frequencies than silicon or germanium doping devices. Thus, its unique properties should be explored, such as its ability to increase energy storage, which could lead to advancements in transistor cells.

Author Contributions

Conceptualization, F.M.; methodology, F.M. and M.M.; software, F.M. and M.M.; validation, F.M.; formal analysis, F.M. and M.M.; investigation, F.M. and M.M.; resources, M.M.; data curation, F.M. and M.M.; writing—original draft preparation, F.M.; writing—review and editing, M.M.; visualization, F.M. and M.M.; supervision, F.M.; project administration, F.M. All authors have read and agreed to the published version of the manuscript.

Funding

This research received no external funding.

Data Availability Statement

Data are contained within the article.

Conflicts of Interest

The authors declare no conflict of interest.

References

  1. Li, C.; Chen, X.; Wang, Z. Review of the AlGaN/GaN High-Electron-Mobility Transistor-Based Biosensors: Structure, Mechanisms, and Applications. Micromachines 2024, 15, 330. [Google Scholar] [CrossRef] [PubMed]
  2. Bhat, A.M.; Periasamy, C.; Poonia, R.; Varghese, A.; Shaf, N.; Tripathy, S. AlGaN/GaN HEMT Based Ph Detection Using Atomic Layer Deposition of Al2O3 as Sensing Membrane and Passivation. IEEE Trans. Nanotechnol. 2023, 22, 466–472. [Google Scholar] [CrossRef]
  3. Mollaamin, F. Competitive Intracellular Hydrogen-Nanocarrier Among Aluminum, Carbon, or Silicon Implantation: A Novel Technology of Eco-Friendly Energy Storage using Research Density Functional Theory. Russ. J. Phys. Chem. B 2024, 18, 805–820. [Google Scholar] [CrossRef]
  4. Sun, R.; Chen, X.; Liu, C.; Chen, W.; Zhang, B. Degradation mechanism of Schottky P-GaN gate stack in GaN power devices under neutron irradiation. Appl. Phys. Lett. 2021, 119, 133503. [Google Scholar] [CrossRef]
  5. Wang, P.F.; Li, X.; Zhang, E.X.; Jiang, R.; McCurdy, M.W.; Poling, B.S.; Heller, E.R.; Schrimpf, R.D.; Fleetwood, D.M. Worst-Case Bias for High Voltage, Elevated-Temperature Stress of AlGaN/GaN HEMTs. IEEE Trans. Device Mater. Reliab. 2020, 20, 420–428. [Google Scholar] [CrossRef]
  6. Bashirov, R.J.; Ismayilov, N.E.; Huseynov, R.E.; Muradov, N.M. Quality control methods and models of polymer composite materials. Adv. Phys. Res. 2024, 6, 90–99. [Google Scholar] [CrossRef]
  7. Noori, A.F.; Ghaleb, A.M.; Salih, A.I. A theoretical study of the physical properties of hexagonal gallium nitrate using density functional theory. Adv. Phys. Res. 2024, 6, 225–238. [Google Scholar] [CrossRef]
  8. Utamuradova, S.B.; Rakhmanov, D.A.; Tuan, P.L.; Doroshkevich, A.S.; Isayev, R.S.; Abiyev, A.S. Studying the influence of proton irradiation on the distribution profile of Pt and Cr in surface layers n-Si˂Pt˃, n-Si˂Cr˃ using ellipsometric spectroscopy. Adv. Phys. Res. 2024, 6, 83–89. [Google Scholar] [CrossRef]
  9. Zolotarev, K.V.; Mikhailov, A.N.; Nakhod, V.I.; Sanzhakov, M.A.; Tikhonova, E.G.; Mikhailova, M.V. Characterization and in vivo toxicity assay of uncoated silicon nanoparticles. New Mater. Compd. Appl. 2024, 8, 162–170. [Google Scholar] [CrossRef]
  10. Utamuradova, S.B.; Matchonov, H.J.; Khamdamov, Z.J.; Utemuratova, H.Y. X-ray diffraction study of the phase state of silicon single crystals doped with manganese. New Mater. Compd. Appl. 2023, 7, 93–99. [Google Scholar]
  11. Blasco, R.; Ajay, A.; Robin, E.; Bougerol, C.; Lorentz, K.; Alves, L.C.; Mouton, I.; Amichi, L.; Grenier, A.; Monroy, E. Electrical and optical properties of heavily Ge-doped AlGaN. J. Phys. D Appl. Phys. 2019, 52, 125101. [Google Scholar] [CrossRef]
  12. Wang, D.; Liu, X.; Fang, S.; Huang, C.; Kang, Y.; Yu, H.; Liu, Z.; Zhang, H.; Long, R.; Xiong, Y.; et al. Pt/AlGaN Nanoarchitecture: Toward High Responsivity, Self-Powered Ultraviolet-Sensitive Photodetection. Nano Lett. 2021, 21, 120–129. [Google Scholar] [CrossRef]
  13. Abdullayeva, L.K.; Hasanov, M.H. Investigation of the role of metal in non-alloy metal-semiconductor (Si) contact. New Mater. Compd. Appl. 2024, 8, 135–141. [Google Scholar] [CrossRef]
  14. Mollaamin, F.; Shahriari, S.; Monajjemi, M. Influence of Transition Metals for Emergence of Energy Storage in Fuel Cells through Hydrogen Adsorption on the MgAl Surface. Russ. J. Phys. Chem. B 2024, 18, 398–418. [Google Scholar] [CrossRef]
  15. Mollaamin, F.; Monajjemi, M. Nanomaterials for Sustainable Energy in Hydrogen-Fuel Cell: Functionalization and Characterization of Carbon Nano-Semiconductors with Silicon, Germanium, Tin or Lead through Density Functional Theory Study. Russ. J. Phys. Chem. B 2024, 18, 607–623. [Google Scholar] [CrossRef]
  16. Bakhshi, K.; Mollaamin, F.; Monajjemi, M. Exchange and Correlation Effect of Hydrogen Chemisorption on Nano V(100) Surface: A DFT Study by Generalized Gradient Approximation (GGA). J. Comput. Theor. Nanosci. 2011, 8, 763–768. [Google Scholar] [CrossRef]
  17. Hu, J.; Shen, H.; Jiang, M.; Gong, H.; Xiao, H.; Liu, Z.; Sun, G.; Zu, X. A DFT Study of Hydrogen Storage in High-Entropy Alloy TiZrHfScMo. Nanomaterials 2019, 9, 461. [Google Scholar] [CrossRef]
  18. Pius, K.K.; Ongwen, N.O.; Mageto, M.; Odari, V.; Gaitho, F.M. Mechanical Properties of Al–Mg–Si Alloys (6xxx Series): A DFT-Based Study. Alloys 2023, 2, 213–226. [Google Scholar] [CrossRef]
  19. Oreshonkov, A.S. SI: Advances in Density Functional Theory (DFT) Studies of Solids. Materials 2022, 15, 2099. [Google Scholar] [CrossRef]
  20. Fan, X.; Mi, Z.; Yang, L.; Su, H. Application of DFT Simulation to the Investigation of Hydrogen Embrittlement Mechanism and Design of High Strength Low Alloy Steel. Materials 2023, 16, 152. [Google Scholar] [CrossRef]
  21. Cheng, H.-C.; Yu, C.-F. A DFT Characterization of Structural, Mechanical, and Thermodynamic Properties of Ag9In4 Binary Intermetallic Compound. Metals 2022, 12, 1852. [Google Scholar] [CrossRef]
  22. Cruz-Martínez, H.; García-Hilerio, B.; Montejo-Alvaro, F.; Gazga-Villalobos, A.; Rojas-Chávez, H.; Sánchez-Rodríguez, E.P. Density Functional Theory-Based Approaches to Improving Hydrogen Storage in Graphene-Based Materials. Molecules 2024, 29, 436. [Google Scholar] [CrossRef] [PubMed]
  23. Shelyapina, M.G. Hydrogen Diffusion on, into and in Magnesium Probed by DFT: A Review. Hydrogen 2022, 3, 285–302. [Google Scholar] [CrossRef]
  24. Yang, X.; Li, Y.; Liu, Y.; Li, Q.; Yang, T.; Jia, H. Crystal Structure Prediction and Performance Assessment of Hydrogen Storage Materials: Insights from Computational Materials Science. Energies 2024, 17, 3591. [Google Scholar] [CrossRef]
  25. Mollaamin, F.; Monajjemi, M. Adsorption ability of Ga5N10 nanomaterial for removing metal ions contamination from drinking water by DFT. Int. J. Quantum Chem. 2024, 124, e27348. [Google Scholar] [CrossRef]
  26. Mollaamin, F.; Monajjemi, M. Molecular modelling framework of metal-organic clusters for conserving surfaces: Langmuir sorption through the TD-DFT/ONIOM approach. Mol. Simul. 2023, 49, 365–376. [Google Scholar] [CrossRef]
  27. Vosko, S.H.; Wilk, L.; Nusair, M. Accurate spin-dependent electron liquid correlation energies for local spin density calculations: A critical analysis. Can. J. Phys. 1980, 58, 1200–1211, Bibcode:1980CaJPh.58.1200V. [Google Scholar] [CrossRef]
  28. Frisch, M.J.; Trucks, G.W.; Schlegel, H.B.; Scuseria, G.E.; Robb, M.A.; Cheeseman, J.R.; Scalmani, G.; Barone, V.; Petersson, G.A.; Nakatsuji, H.; et al. Gaussian 16, Revision C.01; Gaussian, Inc.: Wallingford, CT, USA, 2016. [Google Scholar]
  29. Dennington, R.; Keith, T.A.; Millam, J.M. GaussView, Version 6.06.16; Semichem Inc.: Shawnee Mission, KS, USA, 2016. [Google Scholar]
  30. Lee, C.; Yang, W.; Parr, R.G. Development of the Colle–Salvetti correlation-energy formula into a functional of the electron density. Phys. Rev. B 1988, 37, 785–789. [Google Scholar] [CrossRef]
  31. Yanai, T.; Tew, D.P.; Handy, N.C. A new hybrid exchange–correlation functional using the Coulomb-attenuating method (CAM-B3LYP). Chem. Phys. Lett. 2004, 393, 51–57. [Google Scholar] [CrossRef]
  32. Grimme, S.; Antony, J.; Ehrlich, S.; Krieg, H. A consistent and accurate ab initio parametrization of density functional dispersion correction (DFT-D) for the 94 elements H-Pu. J. Chem. Phys. 2010, 132, 154104. [Google Scholar] [CrossRef]
  33. Zavoisky, E. Spin-magnetic resonance in paramagnetics. J. Phys. Ussr 1945, 9, 245. [Google Scholar]
  34. Xu, Z.; Qin, C.; Yu, Y.; Jiang, G.; Zhao, L. First-principles study of adsorption, dissociation, and diffusion of hydrogen on α-U (110) surface. AIP Adv. 2024, 14, 055114. [Google Scholar] [CrossRef]
  35. Becke, A.D.; Edgecombe, K.E. A simple measure of electron localization in atomic and molecular systems. J. Chem. Phys. 1990, 9, 5397–5403. [Google Scholar] [CrossRef]
  36. Steinmann, S.N.; Mo, Y.; Corminboeuf, C. How do electron localization functions describe π-electron delocalization? Phys. Chem. Chem. Phys. 2011, 13, 20584–20592. [Google Scholar] [CrossRef]
  37. Tian, L.; Feiwu, C.; Xuebao, W. Meaning and Functional Form of the Electron Localization Function. Acta Phys. Chim. Sin. 2011, 27, 2786–2792. [Google Scholar] [CrossRef]
  38. Kohn, W.; Sham, L.J. Self-Consistent Equations Including Exchange and Correlation Effects. Phys. Rev. 1965, 140, A1133–A1138. [Google Scholar] [CrossRef]
  39. Mayer, I. Improved definition of bond orders for correlated wave functions. Chem. Phys. Lett. 2012, 544, 83–86. [Google Scholar] [CrossRef]
  40. Mollaamin, F.; Monajjemi, M. Trapping of toxic heavy metals from water by GN–nanocage: Application of nanomaterials for contaminant removal technique. J. Mol. Struct. 2024, 1300, 137214. [Google Scholar] [CrossRef]
  41. Lu, T.; Chen, F. Bond Order Analysis Based on the Laplacian of Electron Density in Fuzzy Overlap Space. J. Phys. Chem. A 2013, 117, 3100–3108. [Google Scholar] [CrossRef]
  42. Wang, X.; Zhang, X.; Pedrycz, W.; Yang, S.-H.; Boutat, D. Consensus of T-S Fuzzy Fractional-Order, Singular Perturbation, Multi-Agent Systems. Fractal Fract. 2024, 8, 523. [Google Scholar] [CrossRef]
  43. Anaad, M.A.; Al-Sharuee, I.F. Raman spectroscopy and structural characteristics of fluorescein and coumarin doped silica sol, gel, and aerogel. New Mater. Compd. Appl. 2023, 7, 122–136. [Google Scholar]
  44. Utamuradova, S.B.; Daliev, S.K.; Bokiyev, B.R.; Zarifbaev, J.S. X-ray spectroscopy of silicon doped with germanium atoms. Adv. Phys. Res. 2024, 6, 211–218. [Google Scholar] [CrossRef]
  45. Daliev, K.S.; Utamuradova, S.B.; Khamdamov, J.J.; Bahronkulov, Z.E. Electrophysical properties of silicon doped with lutetium. Adv. Phys. Res. 2024, 6, 42–49. [Google Scholar] [CrossRef]
  46. Mollaamin, F.; Monajjemi, M. Tailoring and functionalizing the graphitic-like GaN and GaP nanostructures as selective sensors for NO, NO2, and NH3 adsorbing: A DFT study. J. Mol. Model. 2023, 29, 170. [Google Scholar] [CrossRef] [PubMed]
  47. Mamadalimov, A.T.; Isaev, M.S.; Karimov, M.K.; Isaev, F.M.; Muminova, Z.A.; Karimova, S.T.; Kayumova, M.R.; Badalova, G.T.; Abdurazzakov, K.T. Study of infrared quenching in silicide-silicon-silicide structures. Adv. Phys. Res. 2024, 6, 50–55. [Google Scholar] [CrossRef]
  48. Utamuradova, S.B.; Daliyev, S.K.; Fayzullayev, K.M.; Rakhmanov, D.A.; Zarifbayev, J.S. Raman spectroscopy of defects in silicon doped with chromium atoms. New Mater. Compd. Appl. 2023, 7, 37–43. [Google Scholar]
  49. Mollaamin, F.; Monajjemi, M. In Silico-DFT Investigation of Nanocluster Alloys of Al-(Mg, Ge, Sn) Coated by Nitrogen Heterocyclic Carbenes as Corrosion Inhibitors. J. Clust. Sci. 2023, 34, 2901–2918. [Google Scholar] [CrossRef]
Figure 1. Characterization of hydrated nanohybrids of (a) AlGaN, (b) Si–AlGaN, (c) Ge–AlGaN, (d) Pd–AlGaN, and (e) Pt–AlGaN in a labeled ring in a clockwise manner.
Computation 12 00234 g001
Figure 2. CDD graphs for hetero-clusters through hydrogen adsorption including (a) AlGaN/AlGaN–H, (b) Si–AlGaN/Si–AlGaN–H, (c) Ge–AlGaN/Ge–AlGaN–H, (d) Pd–AlGaN/Pd–AlGaN–H, and (e) Pt–AlGaN/Pt–AlGaN–H.
Computation 12 00234 g002aComputation 12 00234 g002bComputation 12 00234 g002c
Figure 3. TDOS/PDOS/OPDOS graphs of hetero-clusters including (a) AlGaN–H, (b) Si–AlGaN–H, (c) Ge–AlGaN–H, (d) Pd–AlGaN–H, and (e) Pt–AlGaN–H.
Computation 12 00234 g003aComputation 12 00234 g003bComputation 12 00234 g003c
Figure 4. ELF graphs for hetero-clusters including (a) AlGaN–H, (b) Si–AlGaN–H, (c) Ge–AlGaN–H, (d) Pd–AlGaN–H, and (e) Pt–AlGaN–H.
Computation 12 00234 g004aComputation 12 00234 g004b
Figure 5. NMR spectra for hetero-clusters of (a) Si–AlGaN/Si–AlGaN–H, (b) Ge–AlGaN/Ge–AlGaN–H, (c) Pd–AlGaN/Pd–AlGaN–H, and (d) Pt–AlGaN/Pt–AlGaN–H.
Computation 12 00234 g005aComputation 12 00234 g005b
Figure 6. Frequency (cm−1) changes in the IR spectra for hetero-clusters of (a) AlGaN–H, (b) Si–AlGaN–H, (c) Ge–AlGaN–H, (d) Pd–AlGaN–H, and (e) Pt–AlGaN–H.
Computation 12 00234 g006aComputation 12 00234 g006bComputation 12 00234 g006c
Figure 7. Gibbs free energy (   G f o ) for hetero-clusters of AlGaN–H, Si–AlGaN–H, Ge–AlGaN–H, Pd–AlGaN–H, and Pt–AlGaN–H.
Computation 12 00234 g007
Table 1. Bader charge data (Q/Coulomb) for selected atoms of Si–AlGaN, Si–AlGaN–H, Ge–AlGaN, Ge–AlGaN–H, Pd–AlGaN, Pd–AlGaN–H, Pt–AlGaN, and Pt–AlGaN–H hetero-clusters.
Si–AlGaNSi–AlGaN–HGe–AlGaNGe–AlGaN–H
AtomQAtomQAtomQAtomQ
Ga11.01Ga10.99Ga11.01Ga10.98
N2−1.14N2−1.14N2−1.14N2−1.14
Al31.25Al31.28Al31.24Al31.29
N4−1.10N4−1.07N4−1.09N4−1.08
Si50.75Si50.75Ge50.76Ge50.70
Ga60.97Ga60.96Ga60.97Ga60.98
N7−1.12N7−1.12N7−1.12N7−1.15
Al81.29Al81.28Al81.28Al81.26
N9−1.18N9−1.18N9−1.18N9−1.20
N10−0.79N10−0.77N10−0.80N10−0.77
Ga111.01Ga111.06Ga111.01Ga111.07
N12−1.14N12−1.13N12−1.12N12−1.12
Al131.19Al131.20Al131.19Al131.23
N14−0.77N14−0.83N14−0.77N14−0.78
Ga151.03Ga151.01Ga151.02Ga151.04
N16−0.64N16−0.63N16−0.64N16−0.70
N17−0.61N17−0.63N17−0.61N17−0.63
--H18−0.01--H18−0.04
Pd–AlGaNPd–AlGaN–HPt–AlGaNPt–AlGaN–H
AtomQAtomQAtomQAtomQ
Ga11.02Ga11.01Ga11.03Ga11.01
N2−1.15N2−1.16N2−1.15N2−1.15
Al31.24Al31.29Al31.26Al31.26
N4−0.88N4−0.91N4−0.95N4−1.02
Pd50.33Pd50.20Pt50.41Pt50.29
Ga60.96Ga61.00Ga60.97Ga60.99
N7−1.13N7−1.13N7−1.13N7−1.15
Al81.29Al81.31Al81.31Al81.28
N9−1.19N9−1.20N9−1.19N9−1.21
N10−0.80N10−0.77N10−0.81N10−0.77
Ga111.04Ga111.07Ga111.06Ga111.08
N12−0.93N12−0.92N12−1.01N12−1.00
Al131.20Al131.22Al131.20Al131.25
N14−0.78N14−0.83N14−0.78N14−0.77
Ga151.04Ga151.06Ga151.06Ga151.09
N16−0.64N16−0.63N16−0.64N16−0.63
N17−0.61N17−0.63N17−0.62N17−0.62
--H180.01--H180.04
Table 2. LUMO/HOMO, energy gap (∆E), and overlap integral for AlGaN–H, Si–AlGaN–H, Ge–AlGaN–H, Pd–AlGaN–H, and Pt–AlGaN–H.
Hetero-ClustersELUMO (a.u.)EHOMO (a.u.)∆E = ELUMO − EHOMO (a.u.)<S2>
AlGaN–H−0.1550−0.18460.02961.7500
Si–AlGaN–H−0.1531−0.18330.03022.0022
Ge–AlGaN–H−0.1519−0.18220.03032.6557
Pd–AlGaN–H−0.1499−0.17800.02812.6260
Pt–AlGaN–H−0.1513−0.17910.02782.6349
Table 3. The bond order of Mayer, Wiberg, Mulliken, Laplacian, and Fuzzy from a mixed alpha and beta density matrix for hydrated hetero-clusters of AlGaN–H, Si–AlGaN–H, Ge–AlGaN–H, Pd–AlGaN–H, and Pt–AlGaN–H.
Hetero-ClustersMayerWibergMullikenLaplacianFuzzy
AlGaN–H0.89870.86490.67260.16710.8830
Si–AlGaN–H0.73820.73920.48820.09620.7786
Ge–AlGaN–H0.71610.71730.46370.09090.7942
Pd–AlGaN–H0.71610.71730.46370.09090.7942
Pt–AlGaN–H0.70920.71780.56940.09090.8347
Table 4. NMR shielding tensor data (ppm) for selected atoms of Si–AlGaN, Si–AlGaN–H, Ge–AlGaN, Ge–AlGaN–H, Pd–AlGaN, Pd–AlGaN–H, Pt–AlGaN, and Pt–AlGaN–H hetero-clusters.
Si–AlGaNSi–AlGaN–HGe–AlGaNGe–AlGaN–H
AtomσisoσanisoAtomσisoσanisoAtomσisoσanisoAtomσisoσaniso
Ga112.3019.48Ga18.659.14Ga112.3719.45Ga19.508.11
N2211.71624.20N2139.86203.14N2210.74620.27N287.4193.07
Al311.8823.16Al37.5111.2847Al311.8722.28Al35.738.07
N4308.10275.86N436.99240.33N4319.55305.14N48.23198.17
Si518.2243.62Si56.826.97Ge56.4035.07Ge52.039.00
Ga612.0812.64Ga69.289.11Ga612.1512.79Ga65.236.84
N7228.84504.84N782.75146.76N7228.98505.93N716.94207.20
Al810.7923.46Al88.779.31Al810.9723.11Al87.558.10
N9169.841065.91N933.37201.21N9173.761066.86N9113.20124.00
N104464.288163.38N10842.21996.91N104523.808361.71N10904.781211.65
Ga113.6152.52Ga113.4016.40Ga113.3153.53Ga111.3311.40
N1226.94761.34N1273.4295.97N1224.49753.65N12142.53248.75
Al1325.8486.33Al130.3613.3565Al1326.6988.23Al133.0721.61
N144470.407959.14N14600.52810.90N144555.618140.97N14905.211261.30
Ga152.0049.70Ga156.306.26Ga152.2350.43Ga150.6310.75
N16100.42471.67N16120.60303.16N1682.81452.43N16140.98315.61
N17898.881478.95N17155.89373.89N17887.571455.59N17158.03386.88
---H1819.917.44- -H1820.225.20
Pd–AlGaNPd–AlGaN–HPt–AlGaNPt–AlGaN–H
AtomσisoσanisoAtomσisoσanisoAtomσisoσanisoAtomσisoσaniso
Ga16.3718.00Ga16.089.86Ga16.7716.59Ga19.028.54
N2137.27537.01N2119.65355.55N2118.06425.22N2163.81264.91
Al37.878.40Al34.1610.10Al36.669.20Al36.298.38
N4142.80 640.37N425.36352.27N4235.12569.01N453.69313.02
Pd5425.10289.99Pd5579.57326.71Pt5279.65164.23Pt5297.64187.35
Ga67.5722.45Ga64.559.98Ga67.0618.41Ga67.259.06
N7200.06399.43N7109.93244.32N7174.42304.42N7164.67 247.81
Al814.5622.62Al85.7612.80Al811.8015.94Al87.619.36
N9345.31774.53N921.20 292.11N9280.20547.55N967.07222.59
N103220.836565.74N10834.521372.60N102958.675956.82N101039.101580.11
Ga113.2652.61Ga112.1512.39Ga111.8548.26Ga111.25 16.37
N12153.93438.24N1219.90433.03N12265.17235.40N125.14409.16
Al1331.4141.80Al135.4915.12Al1329.2439.10Al136.2823.95
N142818.526276.45N14753.501263.81N142596.975751.33N141043.191585.44
Ga157.6251.13Ga151.219.46Ga156.7746.72Ga151.6017.01
N16795.612802.93N16154.80274.34N16471.941878.49N16139.56310.20
N17402.923204.08N17194.62396.81N17111.392245.36N17185.56 407.10
---H1823.766.07---H1824.234.77
Table 5. Thermodynamic characteristics of AlGaN/AlGaN–H, Si–AlGaN/Si–AlGaN–H, Ge–AlGaN/Ge–AlGaN–H, Pd–AlGaN/Pd–AlGaN–H, and Pt–AlGaN/Pt–AlGaN–H nanoclusters based on CAM–B3LYP–D3/6-311+G(d, p) calculations.
CompoundDipole Moment
(Debye)
∆Eoads × 10–3
(kcal/mol)
∆Hoads × 10–3
(kcal/mol)
∆Goads × 10–3
(kcal/mol)
EoH–binding
(kcal/mol)
AlGaN4.6672−319.178−319.178−319.219-
AlGaN–H5.5817−319.503−319.502−319.542−325
Si–AlGaN5.8081−320.296−320.295−320.335-
Si–AlGaN–H5.0608−320.656−320.656−320.697−360
Ge–AlGaN5.6442−320.240−320.239−320.279-
Ge–AlGaN–H4.3890−320.608−320.607−320.650−368
Pd–AlGaN5.1550−397.327−397.327−397.368-
Pd–AlGaN–H6.2464−397.686−397.686−397.729−359
Pt–AlGaN5.5186−392.573−392.573−392.614-
Pt–AlGaN–H5.0840−392.956−392.956−392.999−383
Disclaimer/Publisher’s Note: The statements, opinions and data contained in all publications are solely those of the individual author(s) and contributor(s) and not of MDPI and/or the editor(s). MDPI and/or the editor(s) disclaim responsibility for any injury to people or property resulting from any ideas, methods, instructions or products referred to in the content.

