Abstract
The Direct Simulation Monte Carlo (DSMC) method, introduced by Graeme Bird over five decades ago, has become a crucial statistical particle-based technique for simulating low-density gas flows. Its widespread acceptance stems from rigorous validation against experimental data. This study focuses on four validation test cases known for their complex shock–boundary and shock–shock interactions: (a) a flat plate in hypersonic flow, (b) a Mach 20.2 flow over a 70-degree interplanetary probe, (c) a hypersonic flow around a flared cylinder, and (d) a hypersonic flow around a biconic. Part A of this paper covers the first two cases, while Part B will discuss the remaining cases. These scenarios have been extensively used by researchers to validate prominent parallel DSMC solvers, due to the challenging nature of the flow features involved. The validation requires meticulous selection of simulation parameters, including particle count, grid density, and time steps. This work evaluates the SPARTA (Stochastic Parallel Rarefied-gas Time-Accurate Analyzer) kernel’s accuracy against these test cases, highlighting its parallel processing capability via domain decomposition and MPI communication. This method promises substantial improvements in computational efficiency and accuracy for complex hypersonic vehicle simulations.
1. Introduction
Modeling non-equilibrium gas dynamics necessitates accounting for the atomistic and molecular nature of gases, especially under conditions involving finite-rate thermochemical relaxation and chemical reactions. Such scenarios, coupled with low densities, small length-scales, high gradients, or high flow speeds, lead to pronounced thermochemical non-equilibrium in the bulk flow, particularly within boundary layers. Particle simulation methods, notably DSMC, have proven invaluable for understanding and designing hypersonic vehicles. These methods benefit significantly from increasing computational power.
Changes in the state of a dilute gas primarily occur through molecular collisions, making the mean free path the relevant spatial scale and the mean collision time the pertinent temporal scale. Below the temporal scale of , no variations in the gas state are possible; similarly, no changes occur below the spatial scale of . In a dilute gas, there are a vast number of molecules within a given volume, ranging from tens of thousands to trillions. It is not necessary to account for the properties of every individual molecule; instead, their local distribution functions (for velocity, internal energy, chemical species, etc.) are sufficient to describe the non-equilibrium state of the gas accurately. These distribution functions can be created by taking into account only a small portion of the real molecules of the gas. Additionally, in a dilute gas, the pre-collision orientations (the corresponding impact parameters) of colliding molecules are totally random.
The Direct Simulation Monte Carlo (DSMC) method leverages these inherent properties of dilute gases by utilizing simulator particles, which represent a large number of real gas molecules. These simulator particles are moved in time steps of the order of , and collision pairs and their initial/final orientations are stochastically selected within volumes (computational cells) of the order of . These simplifications are based on sound physical principles. Present DSMC methods go further, by employing probabilistic rules to determine local collision rates and outcomes, thus introducing collision models. The DSMC method, introduced by Bird [1], has since seen extensive development, with Bird authoring three seminal books on the subject [2,3,4], and thousands of research papers have documented the method’s development and applications. Over 50 years, DSMC has proved significant in analyzing high Knudsen number flows, ranging from continuum to free-molecular conditions. DSMC simulations emulate the physics described by the Boltzmann equation, and have been shown to converge to its solution with a very large number of particles [3]. For low Knudsen numbers (, the Boltzmann equation, through Chapman–Enskog theory [5], reduces exactly to the Navier–Stokes equations, the governing equations of gas flow in the continuum regime. Consequently, particle-based (DSMC) and continuum (Navier–Stokes) methods provide a consistent modeling capability for gas flows across the entire Knudsen range.
DSMC collision models are highly flexible, allowing them to be formulated to match continuum thermochemical rate data, or directly include quantum chemistry findings. This flexibility provides the ability for DSMC solvers to perform high-fidelity simulations of multispecies gases in strong non-equilibrium conditions. For example, DSMC has been utilized in investigations such as the Columbia Space Shuttle orbiter accident [6], the 2001 Mars Odyssey aerobraking mission [7], and the analysis of post-flight data from the Stardust mission [8,9,10,11]. As computational resources continue to advance, the utility and range of DSMC applications are expanding accordingly.
The long-term objectives in the DSMC field are multifaceted. First, they include the development of large-scale particle simulations that can seamlessly integrate with Computational Fluid Dynamics (CFD) simulations for intricate 3D flows. Achieving this requires advancements in computational efficiency and the eventual creation of hybrid DSMC-CFD capabilities. Second, the field aims to enhance phenomenological (reduced-order) models for engineering design and analysis, providing more efficient and accurate tools for practical applications. Third, incorporating quantum-chemistry collision models directly into particle simulations is crucial for deepening our understanding of hypersonic flows at the most fundamental level. As with any numerical methodology, these advancements must undergo rigorous validation against experimental data. This process is essential not only for verifying the accuracy of the models, but also for guiding the design of new experiments necessary to further scientific progress.
DSMC method has been employed to study various hypersonic experimental test cases performed in ground-based facilities. Historically, creating rarefied hypersonic flows in such settings posed significant technical challenges, resulting in a limited number of datasets for validating DSMC codes. A notable code validation effort focused on hypersonic viscous interactions on slender-body geometries, conducted at the LENS experimental facility. These experiments involved a variety of geometries, including biconics and flared cylinders [12]. A prominent comparison of DSMC simulations with experimental data was provided by Moss and Bird [13], examining a Mach 15.6 flow of nitrogen over a 25/55-degree biconic. Results from two different codes (DS2V and SMILE) were presented, both showing excellent agreement with the experimental measurements. Similarly, another study [14] reported on a Mach 12.4 flow of nitrogen over a flared cylinder, where the flow conditions did not activate the vibrational energy of the nitrogen molecules, and no chemical reactions occurred.
Additionally, the Bow-Shock Ultra-Violet-2 (BSUV-2) flight experiment, conducted in 1991, involved a vehicle with a capped 15-degree cone nose (radius of 10 cm) re-entering Earth’s atmosphere at 5.1 km/s, collecting data at altitudes between 60 and 110 km [14]. During this flight, ultraviolet radiation emission from nitric oxide and vacuum ultraviolet emission from atomic oxygen were recorded by onboard instruments. The chemically reacting flow was simulated using both continuum [15,16,17] and particle methods [18]. Subsequent ultraviolet emissions were calculated with NASA’s non-equilibrium code NEQAIR [19]. Initial DSMC comparisons showed poor agreement at high altitudes, prompting further study of oxygen dissociation and nitric oxide formation in these conditions by incorporating chemistry models into DSMC simulations [18,20]. This refinement led to excellent agreement with radiance data and accurate simulation of spectral features and atomic oxygen emissions. The BSUV-2 experiment underscored the importance of experimental data for advancing thermochemical modeling with DSMC solvers.
A critical issue extensively studied is the communications blackout that occurs during re-entry. This phenomenon is investigated through Radio Attenuation Measurement (RAM) experiments, which involve a series of re-entry flights. The communications blackout is a significant concern for all hypersonic vehicles, as it is caused by plasma formation at very high speeds, which interferes with radio waves transmitted to and from the vehicle. To conduct these experiments, the RAM-C II hypersonic vehicle was developed. This vehicle features a cone with a spherical cap of radius 0.1524 m, a cone angle of 9 degrees, and a total length of 1.3 m. During re-entry, the RAM-C II reached an orbital velocity of 7.8 km/s, with experiments carried out at altitudes between 90 and 60 km. Electron number density in the plasma layer surrounding the vehicle was measured at various locations [21,22]. Additionally, a series of reflectometers measured plasma density along lines perpendicular to the vehicle’s surface at four different locations, and several Langmuir probes assessed the variation in plasma density across the plasma layer at the vehicle’s rear. Boyd [23] conducted DSMC simulations of the RAM-C II vehicle to develop procedures for simulating charged species such as electrons and ions in trace amounts. These DSMC results were compared with experimental measurements, leading to the conclusion that the dissociation chemistry model used needed further investigation. Two models were tested: Total Collision Energy (TCE) and Vibrationally Favored Dissociation (VFD). Both models showed excellent agreement with the available experimental data.
Apart from hypersonic external flows, another significant application of the DSMC method is in the field of microfluidics, where it is particularly valuable for simulating low-speed, rarefied gas flows through micro- and nanochannels. These flows, which occur at low Mach numbers, are characterized by high Knudsen numbers, making continuum assumptions inappropriate and necessitating particle-based methods like DSMC. The works by Varade et al. [24] and Ebrahimi et al. [25] investigate the flow in microchannels with diverging geometries, demonstrating how DSMC can effectively capture the complex flow behavior that arises due to the geometric constraints and the rarefied nature of the gas. The aforementioned works provide detailed analysis of gas flows in both micro- and nanochannels, emphasizing the impact of channel size and shape on flow characteristics. Their results highlight the necessity of DSMC for accurately modeling such flows, which exhibit significant deviations from classical fluid dynamics predictions.
Validation and verification are critical processes in computational fluid dynamics (CFD), particularly when dealing with complex simulations, such as those involving rarefied hypersonic flows. Documenting detailed test cases provides the research community with essential benchmarks that not only ensure reproducibility, but also facilitate further development and comparison of computational tools like SPARTA. This paper addresses this need by presenting a collection of test cases, complete with comprehensive instructions on how to set up and run them, thereby enhancing the relevance and utility of SPARTA within the research community. Guidelines on how to run SPARTA efficiently are given in Section 4 of this work.
The challenge of generating high-quality experimental measurements in the rarefied hypersonic regime persists, posing a substantial obstacle for DSMC solvers improvement. To optimize the use of available experimental resources, DSMC researchers should continue to design experiments that highlight the fundamental characteristics of non-equilibrium flows.
2. The DSMC Methodology
The Direct Simulation Monte Carlo (DSMC) method is a particle-based technique grounded in kinetic theory for simulating rarefied gases. It models gas flow by employing numerous simulator particles, each representing a significant number of real gas particles. In the DSMC method, the time step is carefully selected to be sufficiently small to decouple particle movements from collisions. During a DSMC simulation, the flow domain is divided into computational cells, which serve as geometric boundaries and volumes for sampling macroscopic properties. The DSMC algorithm comprises four primary steps. First, within each time step , all particles move along their trajectories, and interactions with boundaries are calculated. Second, particles are indexed into cells based on their positions. Third, collision pairs are selected, and intermolecular collisions are carried out probabilistically. Finally, macroscopic flow properties, such as velocity and temperature, are determined by sampling the microscopic state of particles in each cell. Figure 1 illustrates the flowchart of the DSMC algorithm.
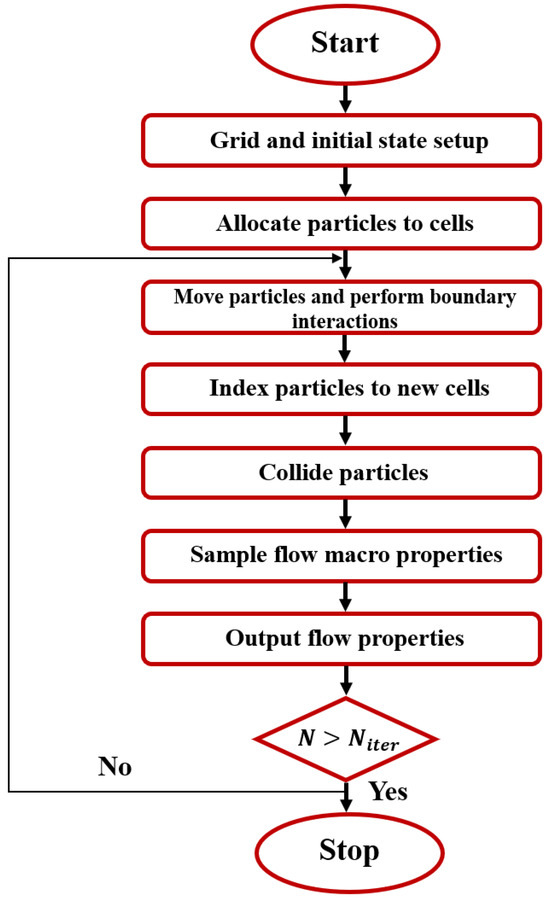
Figure 1.
A typical flowchart of the DSMC algorithm.
The DSMC algorithm exhibits linear scaling with both the number of particles and the total number of time steps required to reach a solution. Consequently, methods that reduce the total number of particles and time steps while preserving accuracy can achieve significant computational efficiencies. Even when computational cells are optimally adapted to the local mean free path, the number of particles per cell can vary with changes in flow density. An ideal simulation should maintain a sufficient number of particles per cell to ensure statistical accuracy, keeping the total number of particles relatively constant throughout the simulation. Several efficient strategies for the DSMC method have been proposed by Kennenber and Boyd [26]. One prominent strategy for reducing the number of simulation time steps and controlling particle numbers is the cell-based time-step approach for steady-state flows. This technique employs a ray-tracing strategy to move particles between cells, with each cell having its own time step adapted to the local mean collision time. Specifically, each cell stores the value , where is a global reference time step. During each global time step , every particle moves for . As observed, using larger time steps results in fewer particles per cell. To address this, a particle weight is assigned to each cell. This technique maintains a constant number of particles during a simulation by cloning or deleting particles, with minor modifications to the DSMC algorithm. In general, particle weighting schemes can accurately control the total number of particles in three-dimensional flows. The process of cloning or deleting particles aims to keep the total particle count constant. However, cloning particles can introduce random walk errors. Additionally, collisions between particles of different weights only conserve mass, momentum, and energy on average, potentially leading to random walk errors [2]. Various strategies have been suggested to mitigate this effect, such as holding cloned particles in buffers instead of immediately injecting them into the simulation. Despite these efforts, an elegant and accurate solution to particle weighting remains elusive.
To minimize the total number of computational cells and, consequently, the total number of particles, LeBeau et al. [27] introduced the virtual sub-cell (VSC) method, and Bird [28] developed the transient adaptive sub-cell method (TASC). Both methods aim to reduce the mean collision separation between selected collision pairs, which are no longer chosen randomly within a computational cell. As a result, the cell size can be increased to some extent, while still maintaining a low mean collision separation. The VSC method performs a nearest-neighbor search to select collision partners, whereas the TASC method subdivides each cell into several sub-cells used only during the collision routine to sort collision pairs, thereby minimizing the mean collision separation. To prevent repeated collisions between the same pair, the last collision partner is tracked, and if selected again, the particle is excluded, and the next nearest particle is chosen instead. Additionally, since the collision rate is computed within each cell (not sub-cell), there is a limit to the cell size increase before the assumption of a constant collision rate within a large cell leads to simulation inaccuracies.
Burt et al. [29] proposed an interpolation scheme for the collision rate within computational cells, in combination with the aforementioned techniques. This scheme allows an increase in cell size while maintaining full accuracy. Bird has also suggested significant algorithmic modifications [4,30] to the DSMC method, with similar goals of reducing time steps and the total number of particles. In these new algorithms, the mean collision separation is minimized, but now each particle stores its own time step. This approach enables the simulation to iterate with small time steps, and particles move only when the global time step matches their individual time steps. Consequently, only a small number of particles move during each global time-step iteration. Detailed information on this method can be found in [31]. The new algorithms resulted in a twofold speedup for Fourier flow simulations compared to the standard DSMC algorithm. Moreover, Ref. [31] revealed that forming nearest-neighbor collision pairs after particles have moved for large time steps is physically inconsistent, and leads to simulation inaccuracies. Further inaccuracies were noted when a constant collision rate was applied to large cells. The new DSMC algorithms show promise, and further analysis should be conducted on hypersonic flows with large density gradients. Additionally, these new algorithms are parallel, though their scalability requires testing [32]. Typically, increasing communication between processors (as with more frequent time steps) and reducing the computational load per partition negatively impacts scalability.
3. Molecular Models
The molecular models in DSMC, also known as collision models, describe the interactions between gas particles. These models fall into two main categories: (i) impulsive models, which use approximations to classical or quantum–mechanical representations of collisions, and (ii) phenomenological models, which utilize local relaxation concepts to calculate energy exchanges [33]. The hard-sphere model [33,34,35], the first model introduced in DSMC, treats molecules as hard spheres that collide when the distance between them decreases to the following:
where and are the diameters of the colliding molecules. This model’s main advantage is that it uses a finite cross-section, defined by
The collision calculation is straightforward, and the scattering of hard-sphere molecules is isotropic in the center-of-mass frame of reference, meaning all directions are equally probable for , where is the magnitude of particle’s velocity. In the hard-sphere model, viscosity and diffusion cross-sections are, respectively, given by
and
The primary characteristics of the hard-sphere model are the finite cross-section, as well as the isotropic scattering in the center-of-mass frame of reference. However, this scattering law is actually unrealistic. A significant problem of the hard-sphere model is the resultant dynamic viscosity. According to [1], a molecular model for rarefied gas flows should reproduce the dynamic viscosity of the real gas and its temperature dependence. The resulting viscosity of the hard-sphere model is proportional to the temperature to the power of 0.5, while real gases have a temperature dependence closer to 0.75. The primary reason for this discrepancy is that the particle cross-section is independent of the relative translational energy:
where is the relative velocity and is the relative mass. The actual cross-section depends on this relative velocity . Due to inertia, the trajectory changes decrease as the relative velocity increases, requiring a variable cross-section to match the 0.75 power characteristic of real gases. This need led to the development of the variable hard-sphere (VHS) model [33,34,35]. In the VHS model, the molecule is modeled as a hard sphere with a diameter that is a function of , using an inverse power law:
where the subscript is used for the reference values; is reference effective diameter at relative speed and is the VHS parameter, which depends on the particle species. The reference values are defined for a given gas by the effective diameter at the defined temperature. The VHS model uses Equation (7) to calculate the deflection angle
where is the distance of the mass centers of the collision partners and is the particle’s diameter, as denoted in Equation (6). VHS model has a temperature dependence of viscosity given as
where is related to the particle’s total number of degrees of freedom.
The Variable Soft-Sphere (VSS) model [4,36] is a recent and popular model used in DSMC simulations. In the VSS model, the deflection angle is modified from the VHS model as follows:
being the VSS scattering parameter. Moreover, the total collision cross-section of the variable soft-sphere model is defined by . This provides the following dynamic viscosity equation for a given VSS gas [2,3]
Similar to the VHS model, viscosity is proportional to , while the parameter is chosen in the same manner as for the VHS model. Regarding the diffusion coefficient for a VSS gas mixture, it is given as [12]
For a simple gas with viscosity and self-diffusion coefficient at the reference temperature the equation for the effective diameters and based on the viscosity and diffusion is [36]
respectively. By equalizing the two diameters, may be determined as
The VSS model reproduces more accurately the diffusion process, compared to the VHS model and is, therefore, preferred for analyzing diffusion phenomena. However, a drawback of the VSS model is that constant values for are valid only within a specific range of temperatures. Both the VHS and VSS models approximate the realistic inverse power law model. In addition to the VHS and VSS models, older molecular models exist, such as the variable- Morse potential, the hybrid Morse potential, and the inverse-power variable- models. Detailed descriptions of these models can be found in [37,38]. Briefly, these older models treat individual collisions as either inelastic with probability , or completely elastic with probability . The constant , is also known as the exchange restriction factor, ranging between 0.1 and 1. At the event of an inelastic collision, the total energy is redistributed between the translational and rotational modes of the particle, based on probabilities derived from the equilibrium distribution [36].
4. The SPARTA Kernel
The SPARTA (Stochastic Parallel Rarefied-gas Time-Accurate Analyzer) solver, developed by M.A. Gallis and S.J. Plimpton at Sandia Laboratories, is an open-source code distributed under the GPL license [32]. Designed for ease of extension, modification, and the addition of new functionalities, the SPARTA kernel can operate on a single processor or on a cluster of processors, using the domain decomposition concept and MPI library. Despite its robustness and flexibility, SPARTA is not intended for novice users. It requires a deep understanding of the DSMC method and a specifically written input script to run simulations. SPARTA executes commands from the input script line by line, necessitating a structured format divided into four parts:
- Initialize.
- Problem settings.
- Simulation settings.
- Simulation.
The third and fourth parts can be repeated until convergence is achieved. This section will describe each part of the input script and highlight some important features of the solver. In the initialization part of the input script, the simulation parameters are defined. These parameters include the simulation units (CGS or SI), the initial seed for the random number generator, and the problem dimensions (2D or 3D).
In the “Problem settings” part of the input script, all parameters needed to start the simulation are specified. Typical parameters include the coordinates of the simulation box, the simulation grid, surfaces within the simulation box, particle species, and the initial particle population. SPARTA utilizes a hierarchical Cartesian grid [Sparta User’s Manual]. This approach treats the entire simulation domain as a single parent grid cell at level 0, which is then subdivided into by by cells at level 1. Each of these cells can either be a child cell (no further division) or a parent cell, further subdivided up to 16 levels in 64-bit architectures. SPARTA employs domain decomposition to enable parallel simulation. Each processor handles a small portion of the entire domain, executes the algorithm routines, and communicates with neighboring processors to exchange particles. All processors have a copy of the parent cells, while each processor maintains its own child cells.
Child cells can be assigned to processors using one of four methods: clump, block, stride, and random. The clump and block methods create geometrically compact assignments, grouping child cells within each processor. The stride and random methods produce dispersed assignments. In the clump method, each processor receives an equal portion of the simulation domain, with cells assigned sequentially. For example, in a domain with 10,000 cells and 100 processors, the first processor handles cells 1 to 100, the second handles cells 101 to 200, and so on. The block method overlays a virtual logical grid of processors onto the simulation domain, assigning each processor a contiguous block of cells. The stride method assigns every cell to the same processor, where P is the number of processors. For example, in a grid of 10,000 cells and 100 processors, the first processor receives cells 1, 101, 201,…, 9001, while the second processor receives cells 2, 102, 202,…, 9002, and so forth. The random method assigns grid cells randomly to processors, resulting in an unequal distribution of grid cells among processors.
The load balancing performed at the beginning of a SPARTA simulation is static, as it is conducted once. During this stage, the aim is to distribute the computational load evenly across processors. Once the grid is created and grid cells are assigned to processors, these cells, along with their particles, are migrated to their respective processors. SPARTA also features a gridcut option, which, if used correctly, can optimize simulation time. Gridcut is applicable to clump assignments only. In domain decomposition, each processor maintains information about the ghost cells of neighboring processors. By using gridcut, the distance at which ghost cell information is stored can be specified. For example, if gridcut is set to −1, each processor will store a copy of all ghost cells used in the simulation, consuming a large amount of memory, especially for large systems. Conversely, if gridcut is set to 0, each processor will store a minimal number of ghost cells, reducing memory usage but increasing the number of messages required to move particles between processors, potentially creating a communication bottleneck. Tests have shown that a gridcut value of three cell diameters balances memory efficiency and communication overhead. In the test cases examined in this work, a gridcut value of three level-2 cell diameters was used to avoid communication bottlenecks.
Next, the script defines the simulation outputs, collision model, chemistry model, dynamic load balancing, boundary conditions, and surface reflection models. This part of the script is crucial for determining the quality and speed of the simulation. Specifically, it defines the simulation time step, the flow-field variables to be computed, surface properties’ computation, sampling intervals, and output intervals. Miscalculations in sampling intervals or frequent output writing can significantly slow down the simulation. SPARTA performs dynamic load balancing by adjusting the assignment of grid cells and their particles to processors, to distribute the computational load evenly. After dynamic load balancing, the cells assigned to each processor may be either clumped or dispersed. SPARTA offers three methods for dynamic balancing: clumped assignments, dispersed assignments, and recursive coordinate bi-sectioning (RCB). In the first method, each grid cell is randomly assigned to a processor, resulting in an uneven distribution of grid cells. In the second method, each processor randomly selects one processor for its first grid cell and assigns subsequent cells to consecutive processors, also leading to uneven distribution. The RCB method assigns compact clumps of grid cells to processors.
To perform dynamic balancing, SPARTA requires two additional arguments: the imbalance factor and the frequency of imbalance checks. The imbalance factor is defined as the maximum number of particles owned by any processor divided by the average number of particles per processor. The frequency specifies how often the imbalance is checked during the simulation. These factors must be chosen carefully, to avoid communication overheads. In the cases discussed, an imbalance factor of 30% and checking the imbalance no more than twice during the simulation proved effective. An exception was the flared cylinder case, which required four imbalance checks due to the large number of time steps, as described in Part B of this work. In all test cases presented in this work, sufficient time was allowed for the number of particles to stabilize before initiating the sampling procedure. This ensures that the simulations reach a steady state, providing accurate and reliable results. In the first test case, the transient period before starting sampling was 8000 timesteps, while in the second case, the transient period was 100,000 timesteps. In the flat-plate test case a total number of 4000 samples were obtained, while in the 70-degree interplanetary probe a total number of 10,000 samples was obtained.
The detailed documentation of the test cases presented in this paper serves a dual purpose: it validates the SPARTA DSMC solver and provides the community with reliable benchmarks for future research. By sharing these cases with comprehensive instructions, the reproducibility of the results is enhanced, contributing at the same time to the collective effort of refining and validating computational tools in the field of hypersonic flow simulations.
5. Simulation Results and Discussion
5.1. Rarefied Hypersonic Flow around a Rectangular Flat Plate
In this initial test case, the rarefied flow around a rectangular flat-plate model within a free-jet expansion wind tunnel is simulated. The geometry and flow conditions are derived from an experiment by Allègre et al. [37]. This experiment is characterized by a global Knudsen number of 0.016, based on a free-stream mean free path computed from free-stream conditions, and a characteristic flat-plate length . The flat plate thickness is 5 mm. The flow begins in a vacuum domain, assuming an inflow of pure nitrogen.
The input parameters defining the nitrogen gas species are as follows: molecular weight , VHS molecular diameter viscosity index , reference temperature , number of rotational degrees of freedom . Simulations include molecule rotational energy-exchange procedures. Nitrogen gas enters the inflow boundary uniformly with a velocity , temperature and number density . The free-stream velocity is parallel to the -axis and the longitudinal surfaces of the flat plate. The wall is modelled as an isothermal wall with temperature . Gas molecule wall reflections are modelled as diffuse, with a velocity obtained from a Maxwellian velocity distribution at the wall temperature.
The computational grid selected for the baseline simulation is a two-dimensional Cartesian grid with rectangular cells of 0.5 mm sides, which is slightly smaller than one-third of the mean free path. The simulation domain is a symmetric rectangular region around the flat plate, with dimensions of 180 mm by 205 mm in the and directions, respectively. The inflow boundary is at the front (left) face of the computational domain, and the outflow boundary is at the right face, with reflective boundaries at the top and bottom faces. The flat-plate wall surface boundary is defined by the open interior region with dimensions 100 mm by 5 mm in the and directions, respectively. The origin of the coordinate system is set at the center of the flat plate’s left face.
All simulations were run on a DELL™ PowerEdge™ R815™ system (Round Rock, TX, USA) with 4 AMD™ Opteron™ 6380 16-core processors (64 cores in total) at 2.5 GHz, and 128 GB RAM. In this test case, the DAC [38] solver and the SPARTA solver are compared. Additionally, various efficiency parameters are compared between the DAC and SPARTA solvers. Data for the DAC solver was obtained from [39], and the flow conditions are summarized in Table 1.

Table 1.
Flow conditions for the flat-plate test case.
In Figure 2, parallel efficiency ( and memory spread are compared between the two solvers, defined, respectively, as
where and are the serial and parallel wall-clock run time, respectively, is the number of processors used, is the total memory used for the serial run and is the total memory of processor number for the parallel run.
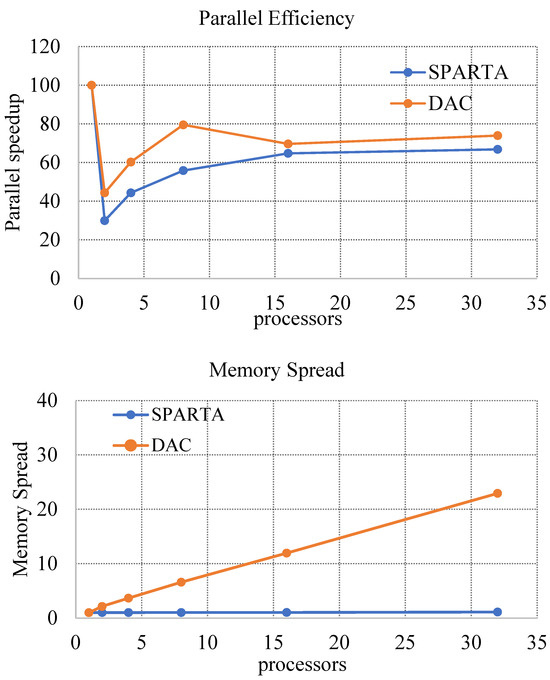
Figure 2.
(Top) parallel efficiency; (Bottom) memory spread (flat-plate test case) [39].
From the line plots in Figure 2, it can be seen that for this test case, DAC exhibits better parallel efficiency than SPARTA; however, it is important to note that the number of particles used was not very large. More specifically, in this test case the simulation was initialized with about ten particles per cell in the freestream and, as simulation progressed, we had about 20–25 in the shock and in the shear layer. In terms of memory spread, SPARTA shows a significantly smaller memory spread, using nearly the same amount of memory for both serial and parallel runs. Each time the number of processors was doubled, SPARTA required only an additional 3 megabytes of memory, except when increasing from 16 to 32 processors; the 32-processor run required 30 megabytes more than the 16-processor run. This memory increase between the 16 and 32 processor runs is not necessarily indicative of a deficiency in the code. The authors believe it is related to the MPI implementation used at the time of the simulation. Although the DAC solver demonstrated better scale-up for this test case, SPARTA required much less memory storage.
Figure 3 and Figure 4 present the flow-field contour results. A qualitative comparison between the current results and the reference ones as presented in [39] indicates good agreement in the simulated flow fields. Additionally, the boundary layer around the flat plate, situated between 0 and 100 mm on the -axis, and the oblique shock, are similarly predicted. Comparable results are also observed for the rotational temperature contours.
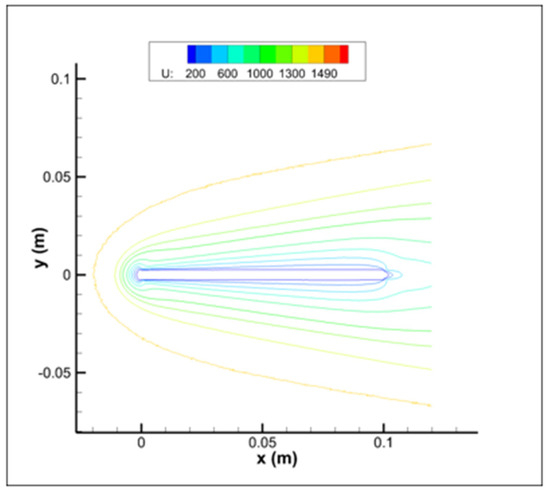
Figure 3.
Velocity contours.
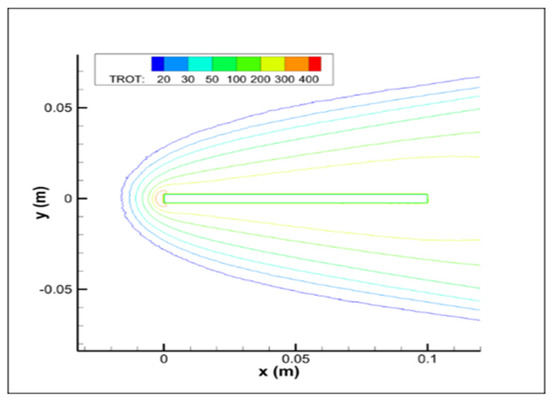
Figure 4.
Rotational temperature contours.
Figure 5 and Figure 6 depict the DAC and SPARTA simulation results for pressure, shear stress, and heat flux, at the plate’s upper surface; experimental results provided in [37] for pressure and heat flux are also comprised. A very good agreement between DAC and SPARTA solvers is observed in the pressure distribution at the upper surface of the plate. It can be also observed that, for the shear stress distribution along the -axis, both codes provide smooth and very similar simulation results. A difference, however, is observed in the heat-flux simulation results, where SPARTA provided a better agreement with the experimental data than the DAC solver.
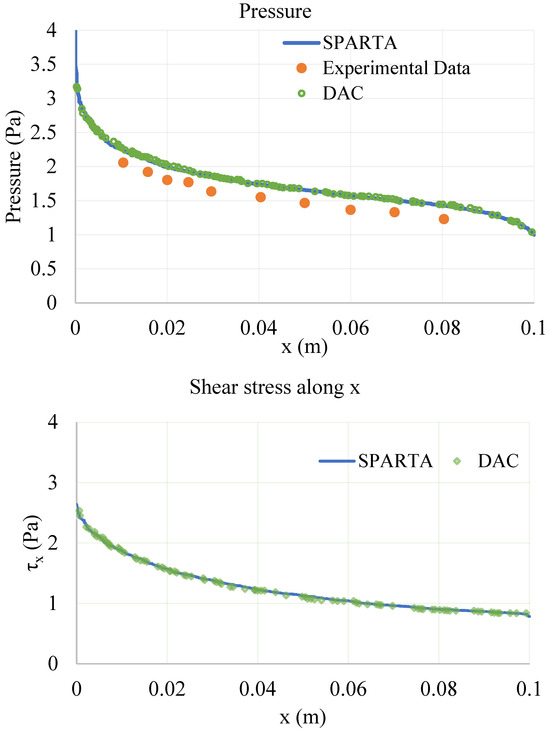
Figure 5.
(Top) pressure distribution at the upper surface; (Bottom) shear stress distribution along -axis. DAC results are obtained from [39].
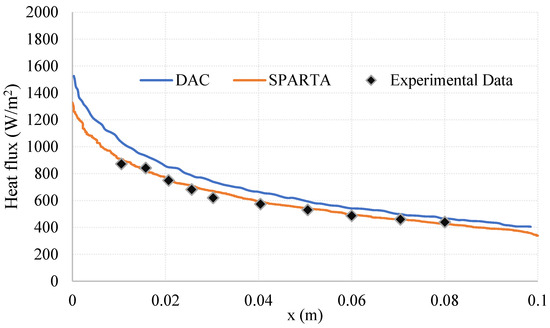
Figure 6.
Upper-surface heat flux. DAC results obtained from [39].
5.2. 70-Degree Interplanetary Probe Case
In this 70-degree probe test case, a geometrical model proposed by the AGARD Group was used. This geometrical model consists of a 70-degree blunt cone mounted on a stick, as depicted in Figure 7. The forebody of the model is identical to the Mars Pathfinder re-entry vehicle. Measurements from the SR3 low-density wind tunnel were obtained from References [40,41], which also included measured values of density flow fields, drag coefficients, and surface heat transfer. Due to the axial symmetry of the geometry at zero degrees angle of attack, the flow was modeled as a 2D axisymmetric one. The domain size for this simulation was set to 150 mm in the horizontal axis and 120 mm in the radial direction. A total number of about 20 million particles were utilized for the first set of flow conditions, while for the second set the number of particles was increased to 62 million. Two different grids were employed for the axisymmetric flow simulation. The first grid was a Cartesian uniform grid with 800 × 800 cells in the axial and radial directions, and a two-level Cartesian grid with an additional refinement of 10 × 10 cells near the cone’s body for the initial set of flow conditions listed in Table 2. For the second set of flow conditions in Table 2, a finer uniform grid of 850 × 850 cells was used. The experimental flow conditions and results are summarized in Table 3 and Table 4, respectively, while the simulation flow-field parameters are detailed in Table 2.
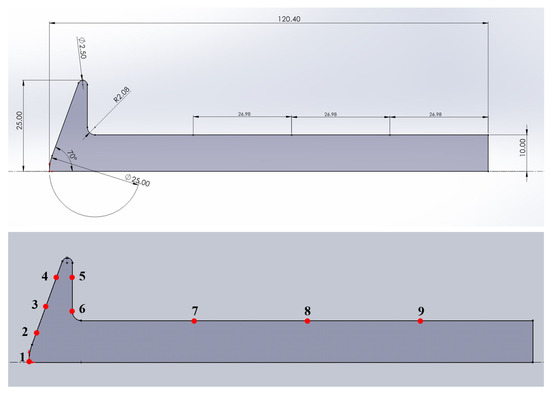
Figure 7.
(Top) the geometry of the planetary probe; (Bottom) the positions of the corresponding thermocouples (1 to 9).

Table 2.
The 70-degree planetary-probe simulation properties.

Table 3.
Test conditions for the SR3 wind tunnel experiment, as obtained from [13].

Table 4.
Experimental heating rates for the “flow conditions 1” subcase, as obtained from [13].
This test case includes three different flow conditions; however, we will focus on the first two conditions detailed in References [40,41], as they are appropriate for DSMC simulations with sufficiently low pressure. Both conditions involve flow separation due to the expanding flow in the rear wake of the blunted cone. Comparisons are made between calculated results and experimental data for heat transfer from the flow to the model’s surface. Table 5 summarizes the heat transfer results on the model’s surface, obtained using the uniform, as well as the refined, grid, for the first set of conditions. Additionally, Figure 8 compares the heat transfer results simulated by SPARTA with the experimental data for the specified flow settings [40].

Table 5.
Comparison of computed heat flux between uniform and refined grid for the “flow conditions 1” subcase.
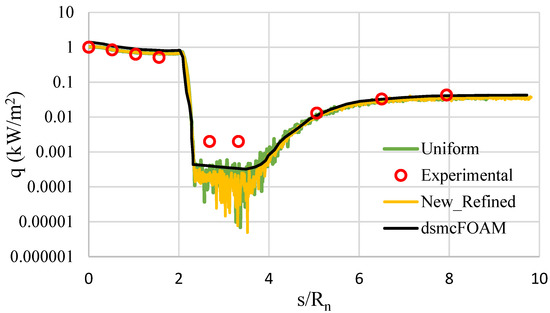
Figure 8.
Surface heat transfer (“flow conditions 1” subcase).
The flow expansion around the cone’s corner results in significant reductions in surface quantities compared to their values on the fore-cone. The heating rate along the base plane is two orders of magnitude lower than the one at the forebody stagnation point. Term , representing the cumulative distance from the stagnation point, was computed in order to plot the results. There is a very good agreement between the experimental measurements and calculated heat transfer at the stagnation point. Table 6 presents both experimental and calculated heat-transfer results for the uniform and refined grids. Figure 9 provides a close-up view of the refined grid at the base of the fore-cone.

Table 6.
Comparison between experimental results and those obtained from two different grids (70-degree planetary probe case; “flow conditions 1” subcase).
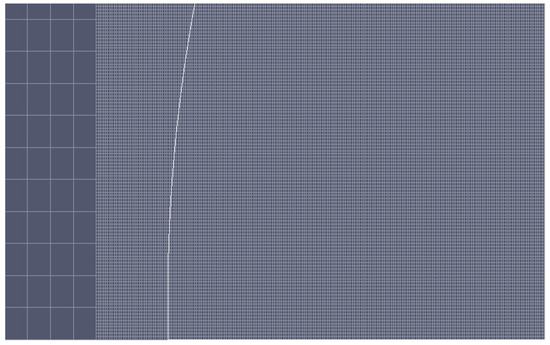
Figure 9.
Fore-cone computational grid (zoom-in view).
The results in Table 6 show that the uniform mesh yields slightly better results than the refined mesh. This discrepancy may be due to an insufficient number of particles, which, when refining each coarse grid cell into 10 × 10 level-2 cells in the fore-cone area (where flow gradients are steep), causes fluctuations in the sampling of flow properties. Conversely, in the area around the back of the cone, where flow gradients are less pronounced, the refined grid produces better results. As shown in Table 6, the heat transfer measurements at positions 5 and 6 were not accurate, due to the flow’s rarefaction. This is why the heat transfer at these positions is characterized as [42].
Regarding the flow-field structure, the velocity magnitude contours (Figure 10) show the development of a subsonic layer in the forebody as the flow approaches the body surface at the aft corner. A recirculation area forms at the back of the cone, as indicated by the stream lines (Figure 11). Figure 12 depicts the rotational and total temperature of the flow field. For the first subcase, the number-density contours (Figure 13) show that the density near the wake corner is about 20% higher than the freestream density, whereas in the second subcase, it is about 25% higher. The number density near the stagnation point increases by approximately four times, a common characteristic for hypersonic flows around cold blunt surfaces. This is evident from the number-density contours (Figure 13), where the number density gradually increases with the flow approaching the fore-cone, indicating that the shock has a diffuse nature, typical of highly rarefied flows. A comparison of surface heat flux with the experimental data for the flow condition 2 is shown in Figure 14 and Table 7.
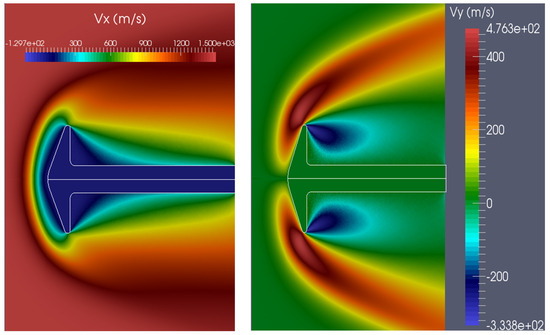
Figure 10.
(Left) axial velocity component; (Right) radial velocity component (“flow conditions 1” subcase).
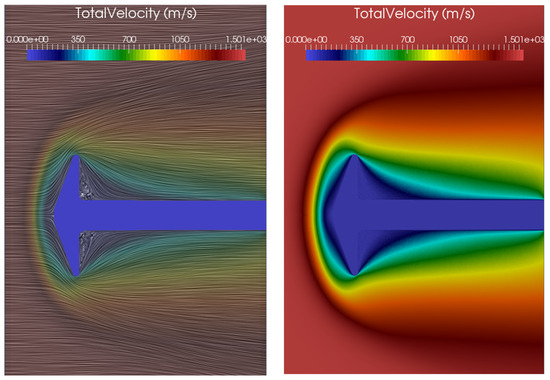
Figure 11.
(Left) flow-field streamlines; (Right) velocity magnitude contours (“flow conditions 1” subcase).
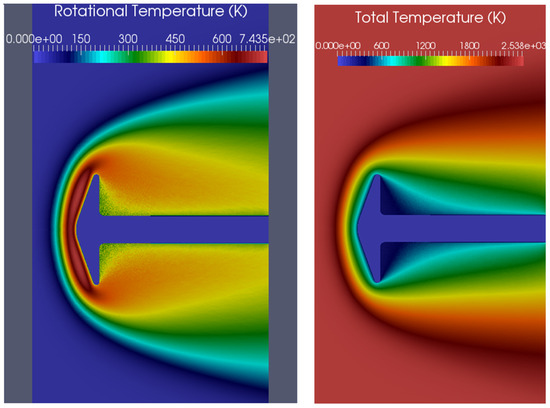
Figure 12.
(Left) rotational temperature contours; (Right) total temperature contours (“flow conditions 1” subcase).
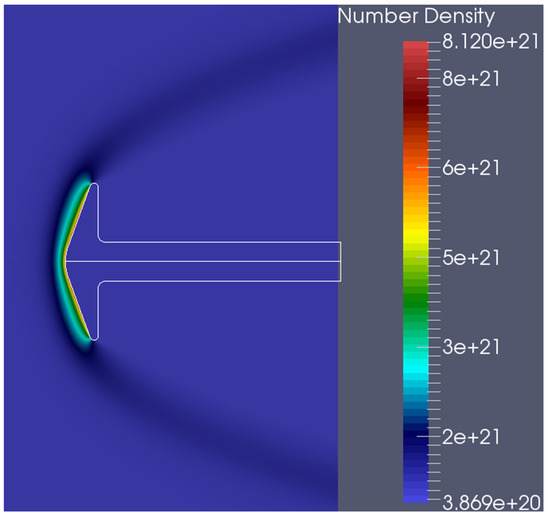
Figure 13.
Number-density distribution (“flow conditions 1” subcase).
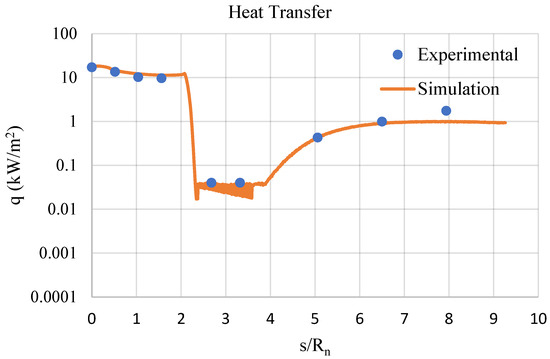
Figure 14.
Surface heat transfer (“flow conditions 2” subcase).

Table 7.
Comparison between experimental results and those obtained from the Uniform grid (“flow conditions 2” subcase).
For subcase 2, Figure 15 contains the axial- and radial-velocity components. In the first subcase, where the flow is more rarefied, the vortex is not well resolved. In contrast, in the second subcase, the vortex is larger and more clearly resolved, due to the lower rarefaction of the flow, as seen in the velocity magnitude plot (Figure 16). The rotational and total temperatures are shown in Figure 17, and Figure 18 presents the number density. In subcase 2, where the flow field is denser, an eightfold increase in density is observed (Figure 18). High temperature effects are present in both subcases, indicating that the nitrogen gas around the cone is in thermal non-equilibrium, and vibrational energy should be considered for more accurate results. Both cases show very good agreement between experimental and computed results. The results of the blunt-cone test case are compared with those presented in [43], where an unstructured grid was used for the dsmcFoam simulations.
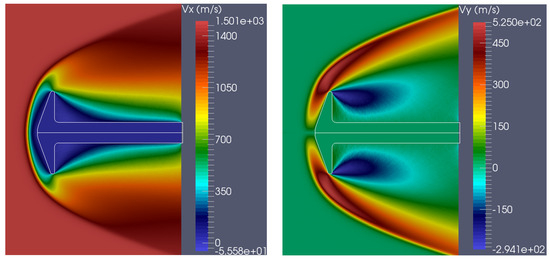
Figure 15.
(Left) axial velocity; (Right) radial velocity (“flow conditions 2” subcase).
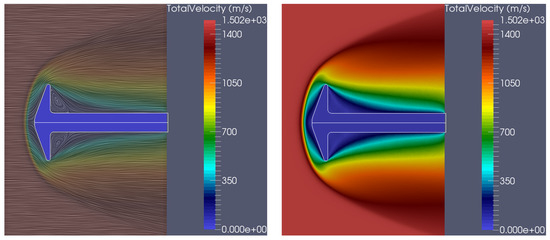
Figure 16.
(Left) flow-field streamlines; (Right) velocity contours (“flow conditions 2” subcase).
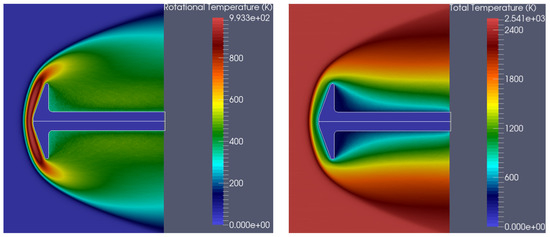
Figure 17.
(Left) rotational temperature; (Right) total temperature (“flow conditions 2” subcase).
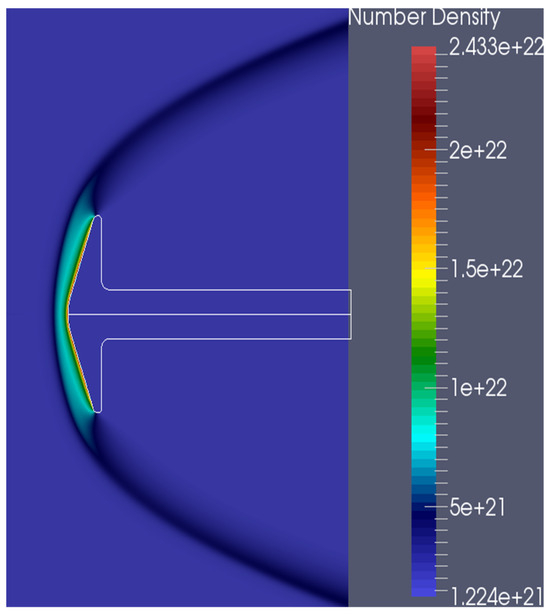
Figure 18.
Number-density contours (“flow conditions 2” subcase).
The blunt cone was also simulated in 3D to assess the capabilities of the corresponding solver for non-zero angles of attack in the 70-degree planetary-probe case. To reduce computational load, half-domain symmetry with appropriate boundary conditions along the plane of symmetry was used. Figure 19 presents the surface heat-flux contours on the 70-degree blunted cone at angles of attack of 0°, 10°, 20°, and 30° for the “flow conditions 1” subcase. Figure 20 shows the heat flux along the surface of the 70-degree blunted cone at the same angles of attack. The DSMC solver SPARTA results exhibit a fair agreement with the experimental data, demonstrating the solver’s capability to accurately simulate heat flux at various angles of attack.
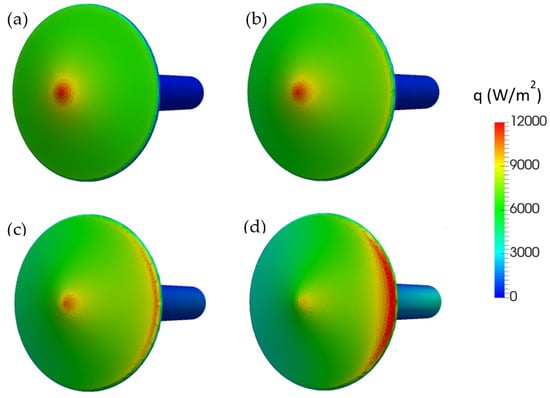
Figure 19.
Three-dimensional contours of the surface heat-flux contours on the 70-degree blunted cone at (a) 0°, (b) 10°, (c) 20°, and (d) 30° angle of attack (“flow conditions 1” subcase).
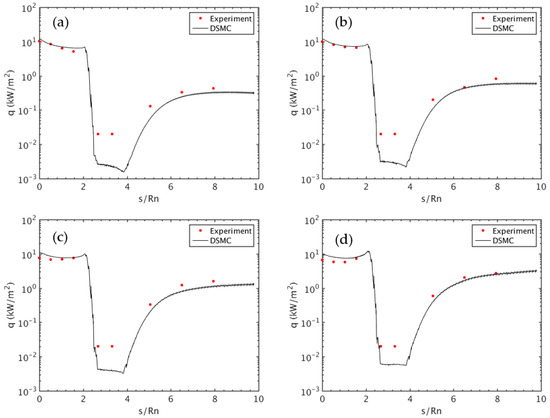
Figure 20.
Line plots of the surface heat flux of the 70-degree interplanetary probe at (a) 0°, (b) 10°, (c) 20°, and (d) 30° angle of attack (“flow conditions 1” subcase).
6. Conclusions
Advancements in simulation capabilities have expanded the application of particle-based methods like Direct Simulation Monte Carlo (DSMC), initially used for hypersonic rarefied gas dynamics and re-entry vehicle simulations. DSMC has since been extended to various flow regimes, including subsonic microflows. Part A of this work examined two different rarefied hypersonic flow cases. In both cases, there was a strong agreement between the computed and experimental results. Furthermore, it was demonstrated that with a high-quality grid, SPARTA can accurately analyze rarefied hypersonic flows.
Regarding the flat-plate simulation, it would be beneficial to investigate SPARTA’s scalability beyond 32 processors and compare it with the corresponding DAC scalability. This comparison was not made in this work, due to limited available information. The results of both solvers were in very good agreement, except for the heat transfer calculation, where SPARTA outperformed DAC. In the 70-degree blunt-cone simulation, the computed results also showed strong agreement with the experimental data. A refined grid was used around the blunt cone, in this case. In the more rarefied of the two examined cases, the vortices at the back of the cone were not well resolved, which is related to the gas rarefaction rather than a grid issue. In the second subcase, where the gas is denser, the two vortices at the back of the cone were clearly observed. The agreement between computed and experimental results was very good in the fore-cone region. However, there was a slight difference at the back of the cone, which, according to Ref. [42], is due to the inability of the sensors utilized in the corresponding experiment to accurately resolve flow data in that area because of gas rarefaction.
While SPARTA is a highly capable DSMC solver, achieving accurate results often hinges on the correct setup of simulations. The complexity of the tool means that discrepancies in expected outcomes are frequently due to user setup errors rather than limitations of the software itself. A solid understanding of the DSMC method, grid adaptation, and grid partitioning techniques is necessary. The detailed validation and verification cases documented in this paper represent a significant contribution to the DSMC community. By providing clear and reproducible test cases, we not only validate the SPARTA solver but also create a valuable resource for future research. Part B of this work will present further testing of the SPARTA kernel, with a focus on hypersonic vehicles.
Author Contributions
Conceptualization, A.K. and I.K.N.; methodology, A.K. and I.K.N.; software, A.K.; validation, A.K. and I.K.N.; resources, A.K.; writing—original draft preparation, A.K.; writing—review and editing, I.K.N.; visualization, A.K.; supervision, I.K.N.; project administration, I.K.N.; funding acquisition, I.K.N. All authors have read and agreed to the published version of the manuscript.
Funding
Part of this work has been co-funded by the European Commission (European Regional Development Fund) and by the Greek State, through the Operational Programme “Competitiveness and Entrepreneurship” (OPCE II 2007–2013), National Strategic Reference Framework—Research funded project: “Development of a spark discharge aerosol nanoparticle generator for gas flow visualization and for fabrication of nanostructured materials for gas sensing applications—DE_SPARK_NANO_GEN”, 11SYN_5_144, in the framework of the Action “COOPERATION 2011”—Partnerships of Production and Research Institutions in Focused Research and Technology Sectors.
Data Availability Statement
The data presented in this study are available on request from the corresponding author.
Acknowledgments
The authors would like to thank Michael A. Gallis (Sandia National Laboratories) for all the thoughtful technical discussions regarding SPARTA solver and for running the 3D simulations of the 70-degree planetary probe.
Conflicts of Interest
The authors declare no conflicts of interest.
References
- Bird, G.A. Approach to translational equilibrium in a rigid sphere gas. Phys. Fluids 1963, 6, 1518–1519. [Google Scholar] [CrossRef]
- Bird, G.A. Molecular Gas Dynamics; Oxford University Press: Oxford, UK, 1976. [Google Scholar]
- Bird, G.A. Molecular Gas Dynamics and the Direct Simulation of Gas Flows; Oxford University Press: Oxford, UK, 1994. [Google Scholar]
- Bird, G.A. The DSMC Method; Version 1.2; CreateSpace Independent Publishing Platform: North Charleston, SC, USA, 2013; ISBN 9781492112907. [Google Scholar]
- Vincenti, W.; Kruger, C. Introduction to Physical Gas Dynamics; Robert E. Kreiger Publishing Company: Malabar, FL, USA, 1965. [Google Scholar]
- Gallis, M.A.; Boyles, K.A.; LeBeau, G.J. DSMC simulations in support of the STS-107 accident investigation. AIP Conf. Proc. 2005, 762, 1211–1216. [Google Scholar]
- Clavis, Z.Q.; Wilmoth, R.G. Plume modeling and application to Mars 2001 Odyssey aerobraking. J. Spacecr. Rocket. 2005, 42, 450–456. [Google Scholar]
- Wilmoth, R.G.; Mitcheltree, R.A.; Moss, J.N. Low-density aerodynamics of the stardust sample return capsule. J. Spacecr. Rocket. 1999, 42, 436–441. [Google Scholar] [CrossRef]
- Zhong, J.; Ozawa, T.; Levin, D.A. Modeling of the stardust reentry ablation flows in the near-continuum flight regime. AIAA J. 2008, 46, 2568–2581. [Google Scholar] [CrossRef]
- Boyd, I.D.; Trumble, K.A.; Wright, M.J. Modeling of the stardust at high altitude, part 1: Flowfield analysis. J. Spacecr. Rocket. 2010, 47, 708–717. [Google Scholar] [CrossRef]
- Boyd, I.D.; Jenniskens, P.M. Modeling of the stardust at high altitude, part 2: Radiation analysis. J. Spacecr. Rocket. 2010, 47, 901–909. [Google Scholar] [CrossRef]
- Holden, M.; Wadhams, T. Code validation study of laminar shock/boundary layer and shock/shock interactions in hypersonic flow. Part A: Experimental measurements. In Proceedings of the 39th Aerospace Sciences Meeting & Exhibit, Reno, NV, USA, 8–12 January 2001. AIAA paper 2001-1031. [Google Scholar]
- Moss, J.; Bird, G. Direct simulation Monte Carlo simulations of hypersonic flows with shock interactions. AIAA J. 2005, 43, 2566–2573. [Google Scholar] [CrossRef]
- Erdman, P.; Zipf, E.; Espy, P.; Howlett, L.; Levin, D.; Collins, R.; Candler, G.V. Measurements of ultraviolet radiation from a 5km/sec bow shock. J. Thermophys. Heat Transf. 1994, 8, 441–446. [Google Scholar] [CrossRef]
- Levin, D.; Candler, G.V.; Collins, R.; Erdman, P.; Zipf, E.; Howlett, L. Examination of ultraviolet theory for bow shock rocket experiments-I. J. Thermophys. Heat Transf. 1994, 8, 447–453. [Google Scholar] [CrossRef]
- Levin, D.; Candler, G.V.; Howlett, C.; Whiting, E. Comparison of theory with atomic oxygen 130.4 nm radiation data from the bow shock ultraviolet 2 rocket flight. J. Thermophys. Heat Transf. 1995, 9, 629. [Google Scholar]
- Candler, G.V.; Boyd, I.D.; Levin, D.A.; Moreau, S.; Erdman, P.W. Continuum and DSMC analysis of bow shock flight experiments. In Proceedings of the 31st Aerospace Sciences Meeting, Reno, NV, USA, 11–14 January 1993. AIAA paper 0275-1993. [Google Scholar]
- Boyd, I.; Bose, D.; Candler, G.V. Monte Carlo modelling of nitric oxide formation based on quasi-classical trajectory calculations. Phys. Fluids 1997, 9, 1162–1170. [Google Scholar] [CrossRef]
- Whiting, E.; Park, C.; Arnold, J.; Paterson, J. NEQAIR96, Nonequilibrium and Equilibrium Radiative Transport and Spectra Program, User’s Manual; NASA Reference Publication 1389; NASA Ames Research Center: Moffett Field, CA, USA, 1996. [Google Scholar]
- Boyd, I.; Candler, G.V.; Levin, D. Dissociation modeling in low density hypersonic flows of air. Phys. Fluids 1995, 7, 1757–1763. [Google Scholar] [CrossRef]
- Grantham, W. Flight Results of a 25,000 Foot Per Second Reentry Experiment Using Microwave Reflectometers to Measure Plasma Electron Density and Standoff Distance; NASA Technical Note D-6062; NASA Langley Research Center: Hampton, VA, USA, 1970. [Google Scholar]
- Linwood-Jones, W., Jr.; Cross, A.E. Electrostatic Probe Measurements of Plasma Parameters for Two Reentry Flight Experiments at 25,000 Feet Per Second; NASA Technical Note D-6617; NASA Langley Research Center: Hampton, VA, USA, 1972. [Google Scholar]
- Boyd, I. Modeling of associative ionization reactions in hypersonic rarefied flows. Phys. Fluids 2007, 19, 096102. [Google Scholar] [CrossRef]
- Varade, V.; Duryodhan, V.S.; Agrawal, A.; Pradeep, A.M.; Ebrahimi, A.; Roohi, E. Low Mach number slip flow through diverging microchannel. Comput. Fluids 2015, 111, 46–61. [Google Scholar] [CrossRef]
- Ebrahimi, A.; Roohi, E. DSMC investigation of rarefied gas flow through diverging micro-and nanochannels. Microfluid. Nanofluidics 2017, 21, 18. [Google Scholar] [CrossRef]
- Kannenberg, K.C.; Boyd, I. Strategies for efficient particle resolution in the direct simulation Monte Carlo method. J. Comput. Phys. 2000, 157, 727–745. [Google Scholar] [CrossRef]
- LeBeau, G.J.; Boyles, K.A.; Lumpkin, F.E., III. Virtual sub-cells for the direct simulation Monte Carlo method. In Proceedings of the 41st Aerospace Meeting and Exhibit, Reno, NV, USA, 6–9 January 2003. AIAA paper 2003-1031. [Google Scholar]
- Bird, G. Visual DSMC program for two-dimensional and axially symmetric flows. In The DS2V Program User’s Guide; GAB Consulting Pty Ltd: Sydney, Australia, 2006. [Google Scholar]
- Burt, J.M.; Josyula, E.; Boyd, I. Novel Cartesian implementation of the direct simulation Monte Carlo method. J. Thermophys. Heat Transf. 2012, 26, 258–270. [Google Scholar] [CrossRef]
- Bird, G. The DS2V/3V program suite for DSMC calculations. AIP Conf. Proc. 2005, 762, 541–546. [Google Scholar]
- Gallis, M.A.; Torczynski, J.; Rader, D.; Bird, G. Convergence behavior of a new DSMC algorithm. J. Comput. Phys. 2009, 228, 4532–4548. [Google Scholar] [CrossRef]
- Gallis, M.A.; Torczynski, J.R.; Plimpton, S.J.; Rader, D.J.; Koehler, T. Direct Simulation Monte Carlo: The Quest for Speed. In Proceedings of the 29th Rarefied Gas Dynamic (RGD) Symposium, Xi’an, China, 13–18 July 2014. [Google Scholar]
- Bird, G.A. Breakdown of translational and rotational equilibrium in gaseous expansion. AIAA J. 1970, 8, 1998–2003. [Google Scholar] [CrossRef]
- Borgnakke, C.; Larsen, P.S. Statistical collision model for Monte-Carlo simulation of polyatomic gas mixture. J. Comput. Phys. 1975, 18, 405–420. [Google Scholar] [CrossRef]
- Larsen, P.S.; Borgnakke, C. Statistical collision model for simulating polyatomic gas with restricted energy exchange. In Proceedings of the 9th Symposium in Rarefied Gas Dynamics, Göttingen, Germany, 15–20 July 1974. [Google Scholar]
- Koura, K.; Matsumoto, H. Variable soft sphere molecular model for air species. Phys. Fluids A: Fluid Dyn. 1992, 4, 1083–1085. [Google Scholar] [CrossRef]
- Allègre, J.; Raffin, M.; Chpoun, A.; Gottesdiener, L. Rarefied Hypersonic Flow over a Flat Plate with Truncated Leading Edge. Prog. Astronaut. Aeronaut. 1992, 160, 285–295. [Google Scholar]
- LeBeau, G.J. A Parallel Implementation of the Direct Simulation Monte Carlo Method. Comput. Methods Appl. Mech. Eng. 1999, 174, 319–337. [Google Scholar] [CrossRef]
- Padilla, J.F. Comparison of DAC and MONACO Codes with Flat Plate Simulation; Technical Report, No. 20100029686; National Aeronautics and Space Administration: Moffett Field, CA, USA, 2010. [Google Scholar]
- Allègre, J.; Bisch, D.; Lengrand, J.C. Experimental Rarefied Heat Transfer at Hypersonic Conditions over a 70-Degree Blunted Cone. J. Spacecr. Rocket. 1997, 34, 724–728. [Google Scholar] [CrossRef]
- Allègre, J.; Bisch, D.; Lengrand, J.C. Experimental Rarefied Density Flowfields at Hypersonic Conditions over a 70-Degree Blunted Cone. J. Spacecr. Rocket. 1997, 34, 714–718. [Google Scholar] [CrossRef]
- Allègre, J.; Bisch, D. Experimental Study of a Blunted Cone at Rarefied Hypersonic Conditions; CNRS Meudon, CNRS Rep. RC, 94–97; CNRS: Paris, France, 1994. [Google Scholar]
- Ahmad, A.O.; Scanlon, T.J.; Reese, J.M. Capturing Shock Waves Using an Open-Source, Direct Simulation Monte Carlo (DSMC) Code. In Proceedings of the 4th European Conference for Aero-Space Sciences, EUCASS, Saint Petersburg, Russia, 4–8 July 2011. [Google Scholar]
Disclaimer/Publisher’s Note: The statements, opinions and data contained in all publications are solely those of the individual author(s) and contributor(s) and not of MDPI and/or the editor(s). MDPI and/or the editor(s) disclaim responsibility for any injury to people or property resulting from any ideas, methods, instructions or products referred to in the content. |
© 2024 by the authors. Licensee MDPI, Basel, Switzerland. This article is an open access article distributed under the terms and conditions of the Creative Commons Attribution (CC BY) license (https://creativecommons.org/licenses/by/4.0/).