

In-Silico Prediction of Mechanical Behaviour of Uniform Gyroid Scaffolds Affected by Its Design Parameters for Bone Tissue Engineering Applications

 , , and
Abstract
:1. Introduction
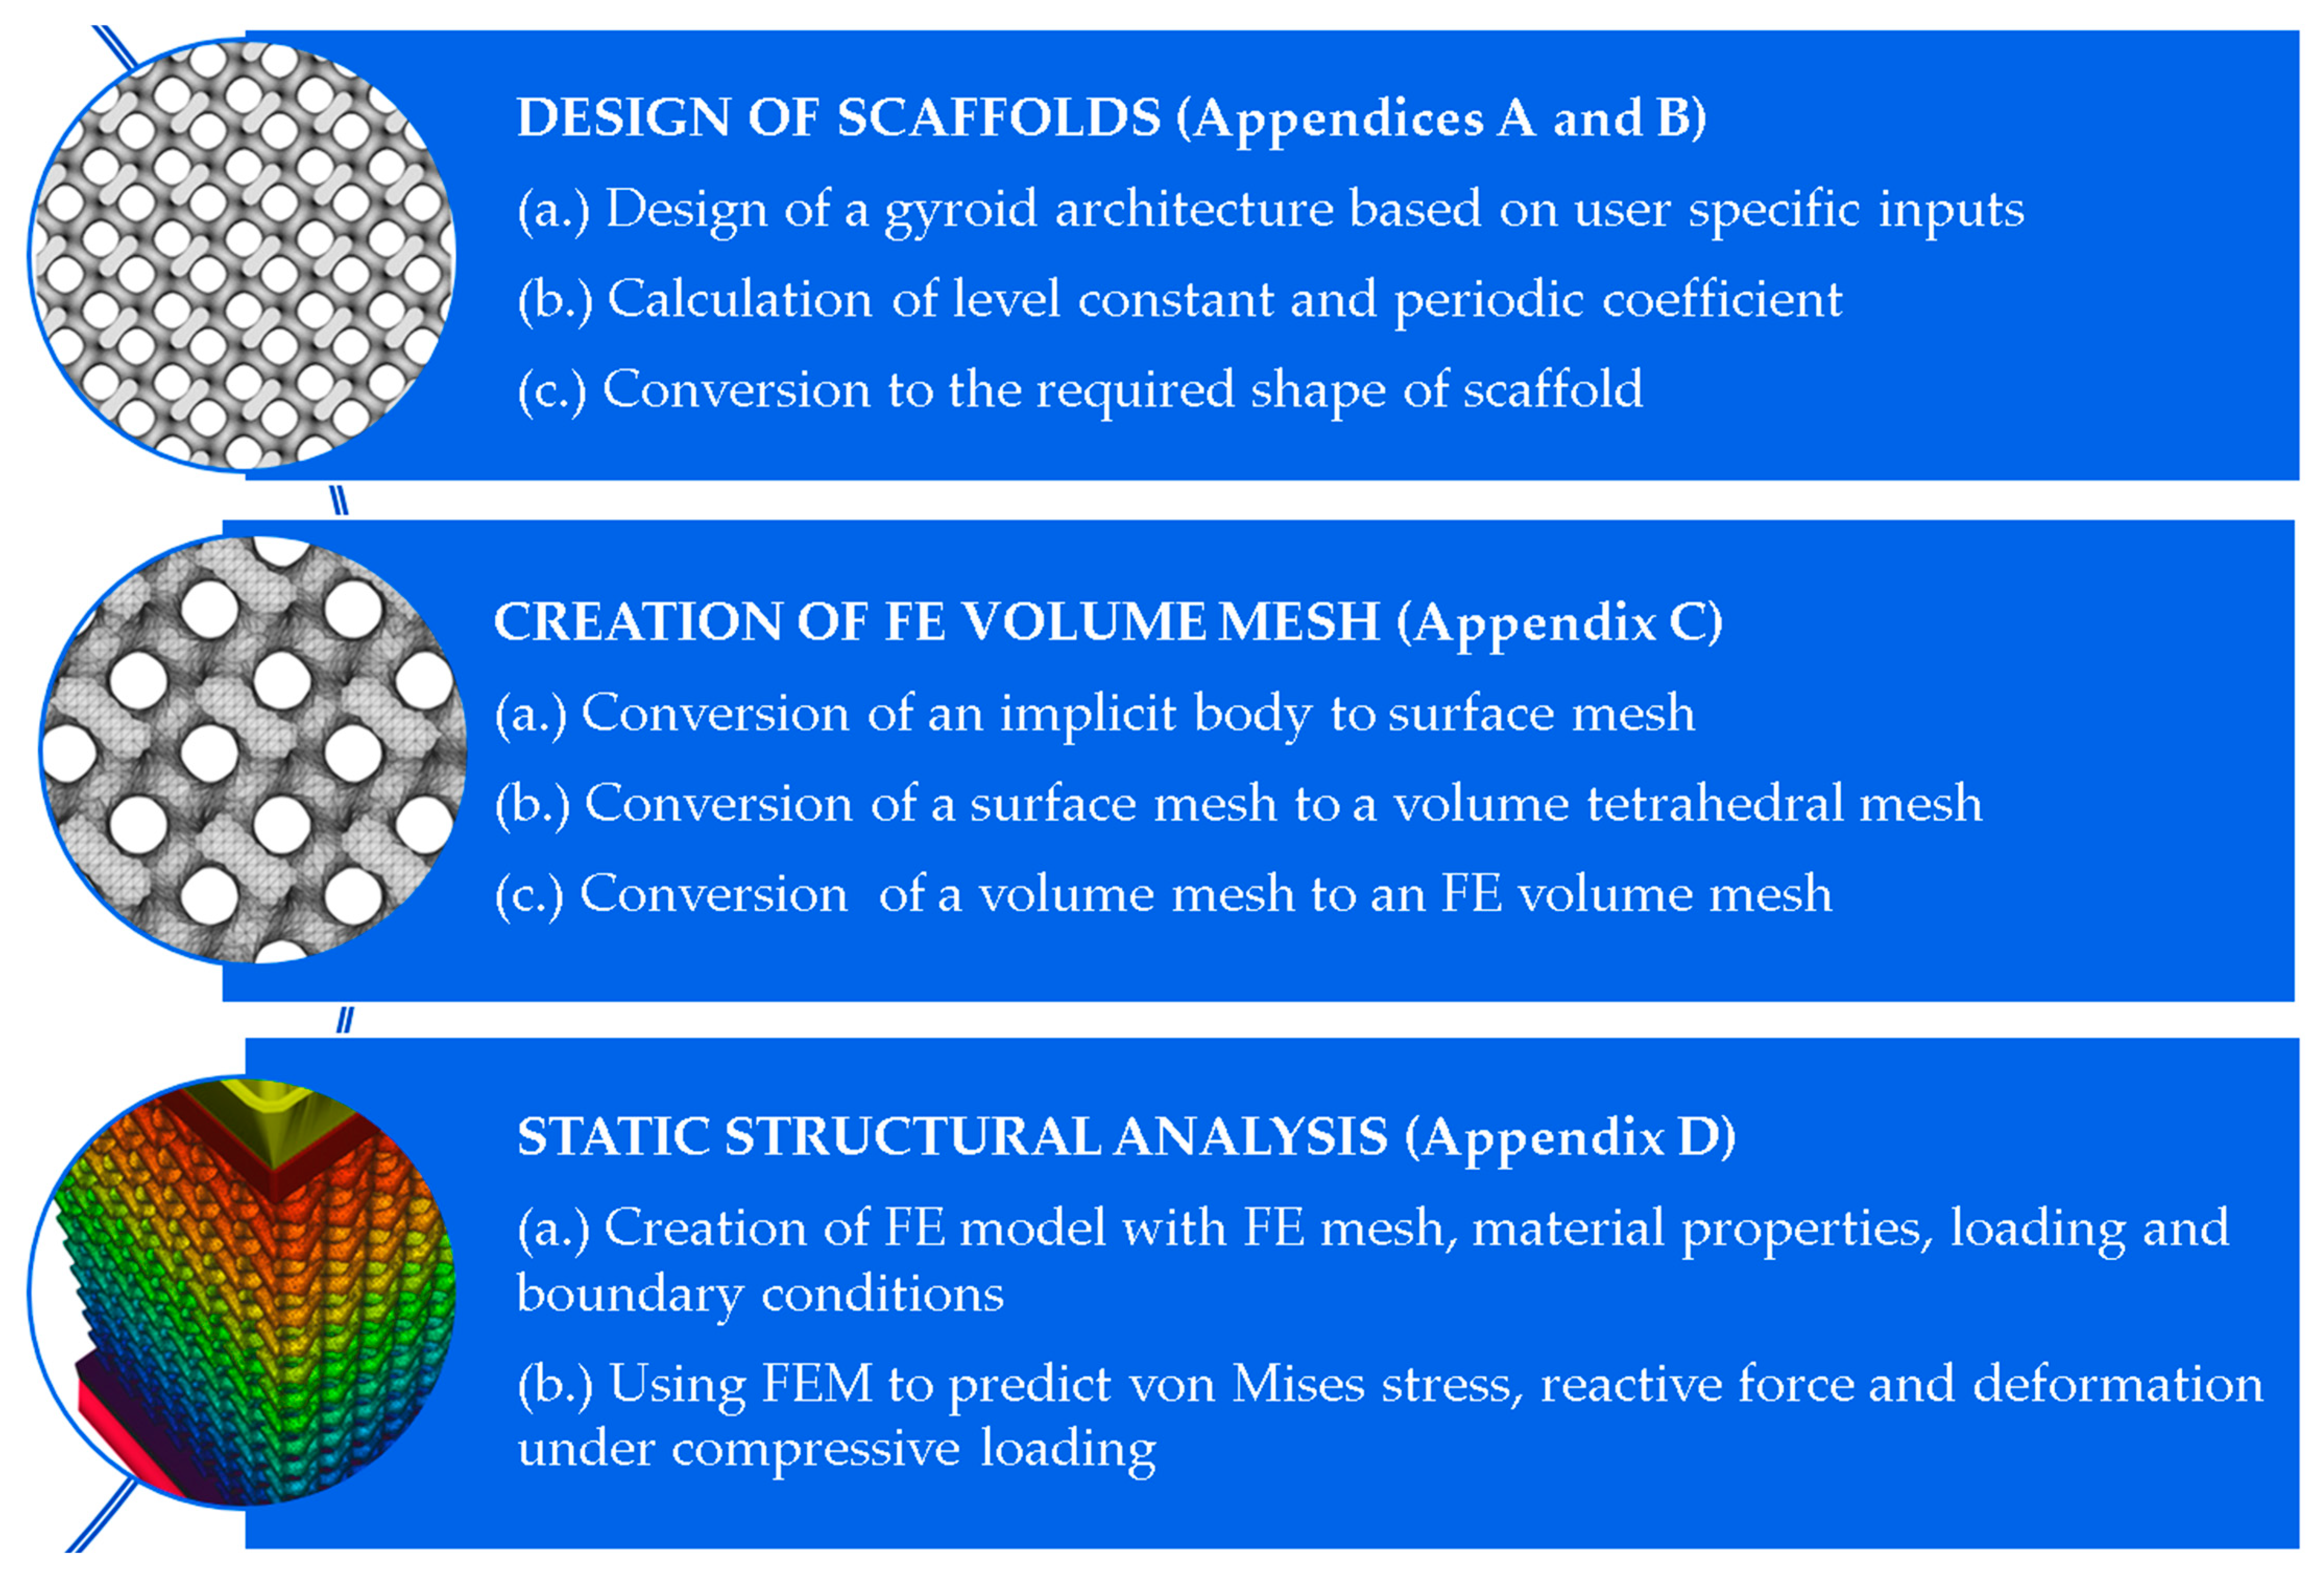
2. Materials and Methods
2.1. Design of Scaffolds
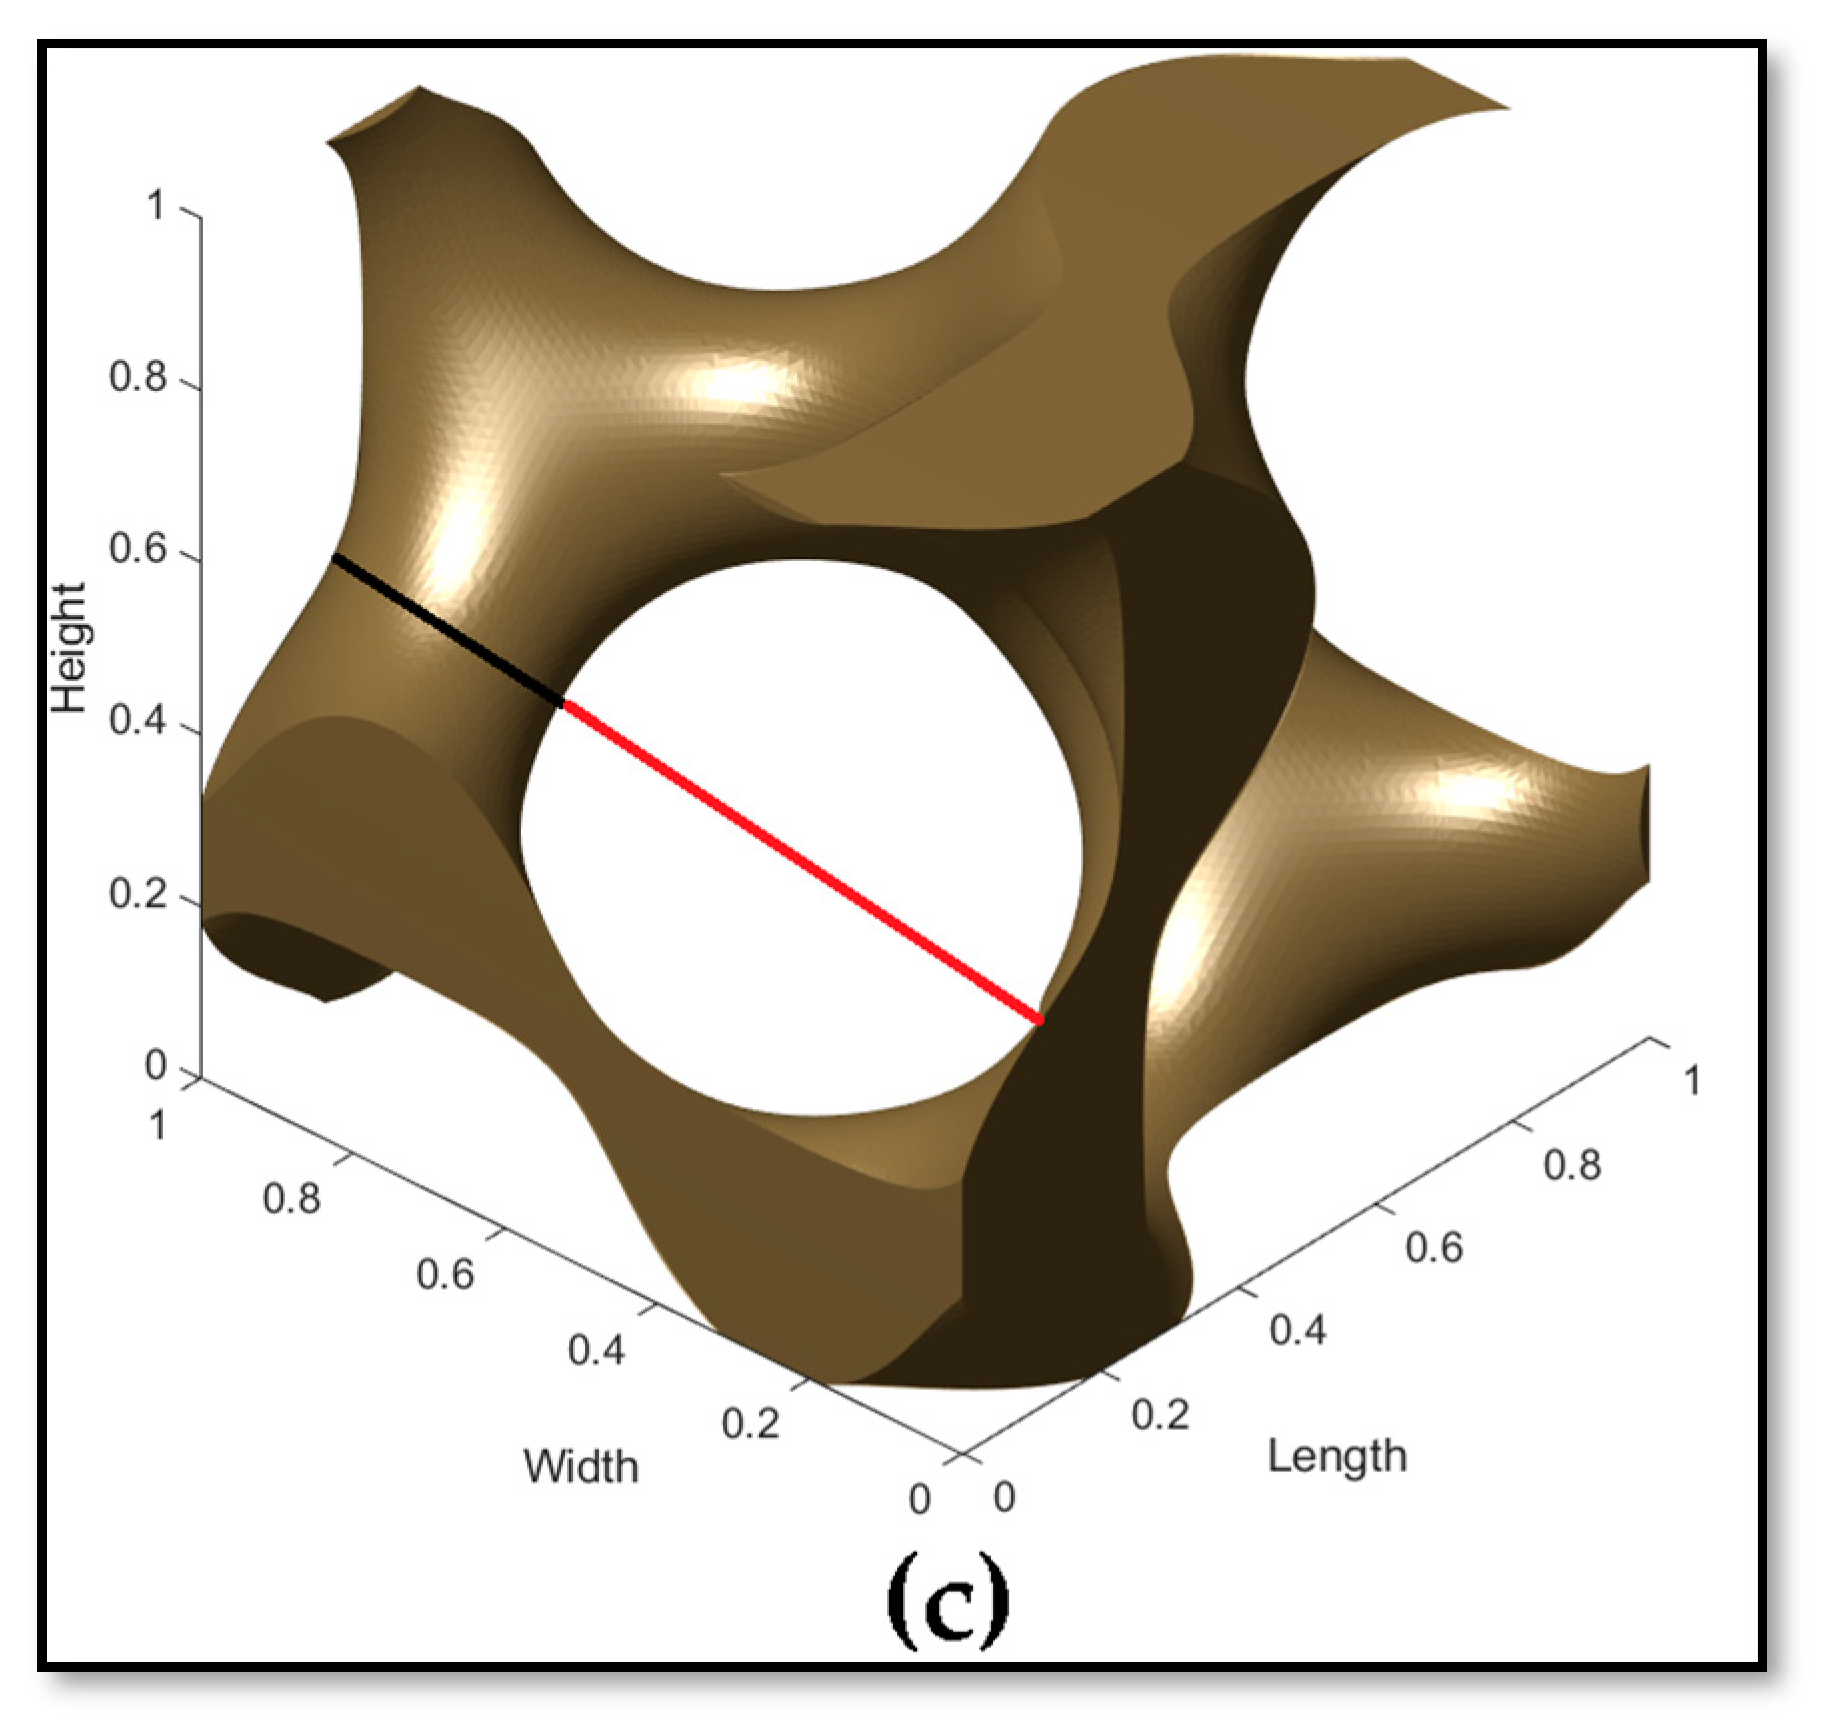
2.1.1. Implicit Description of TPMS
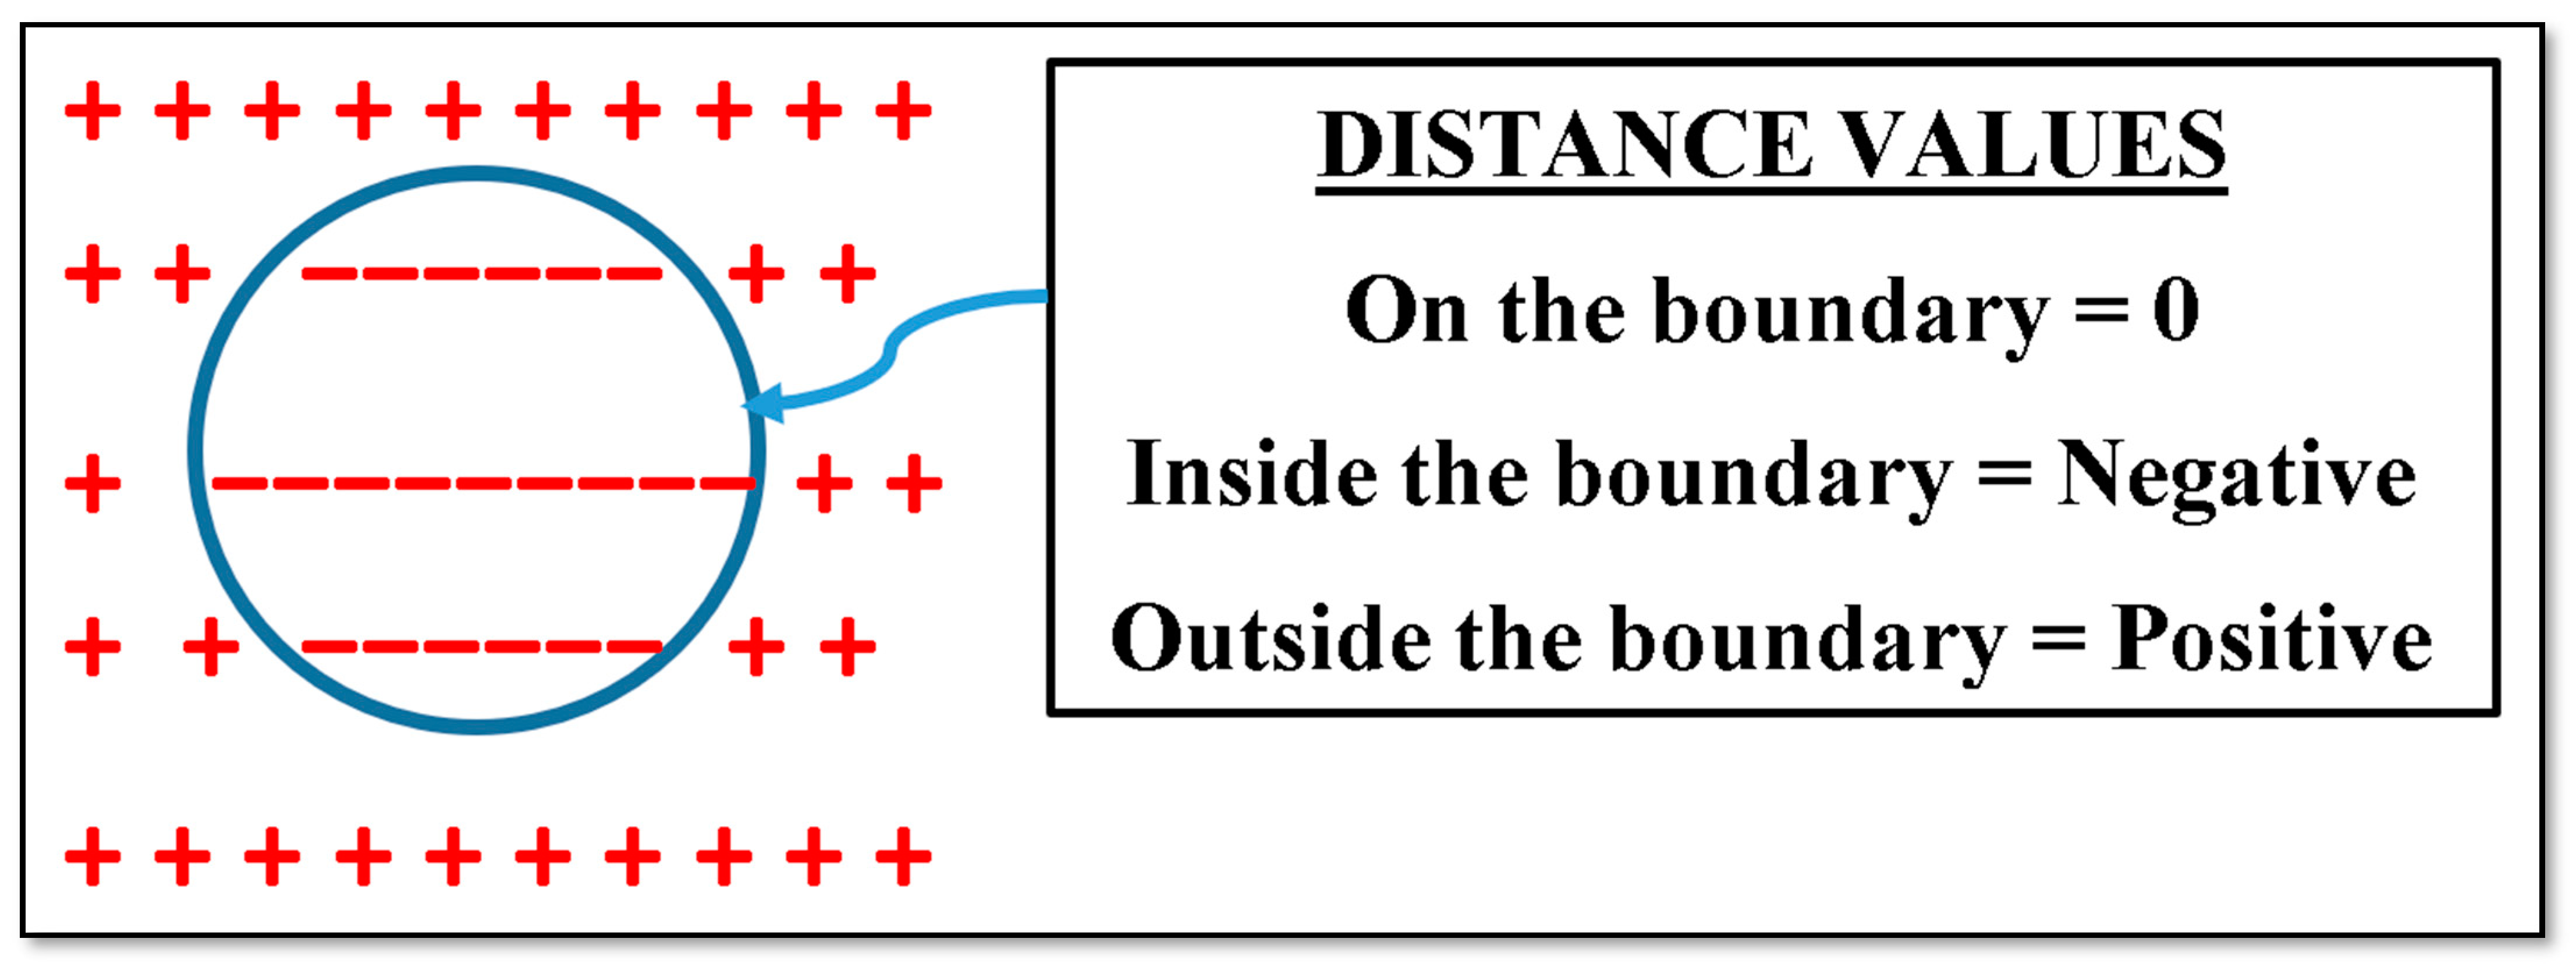
2.1.2. Signed Distance Field
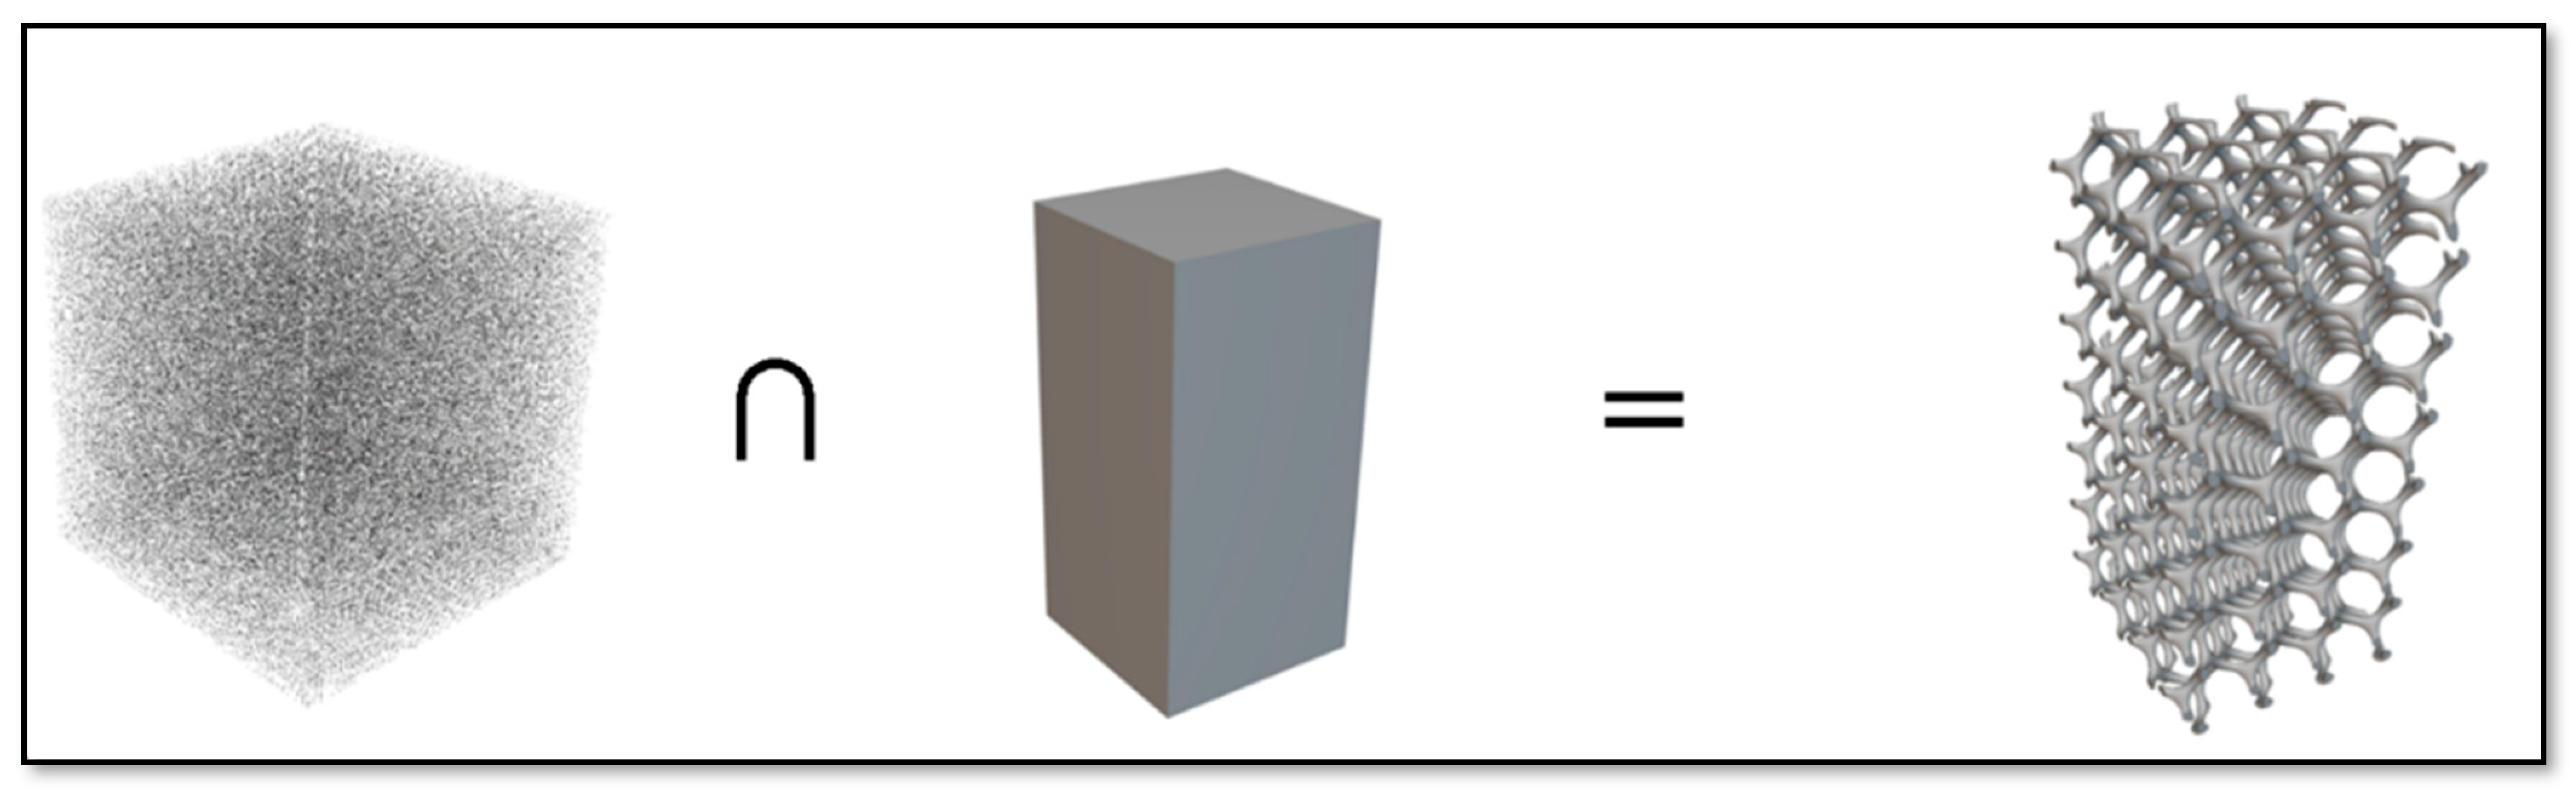
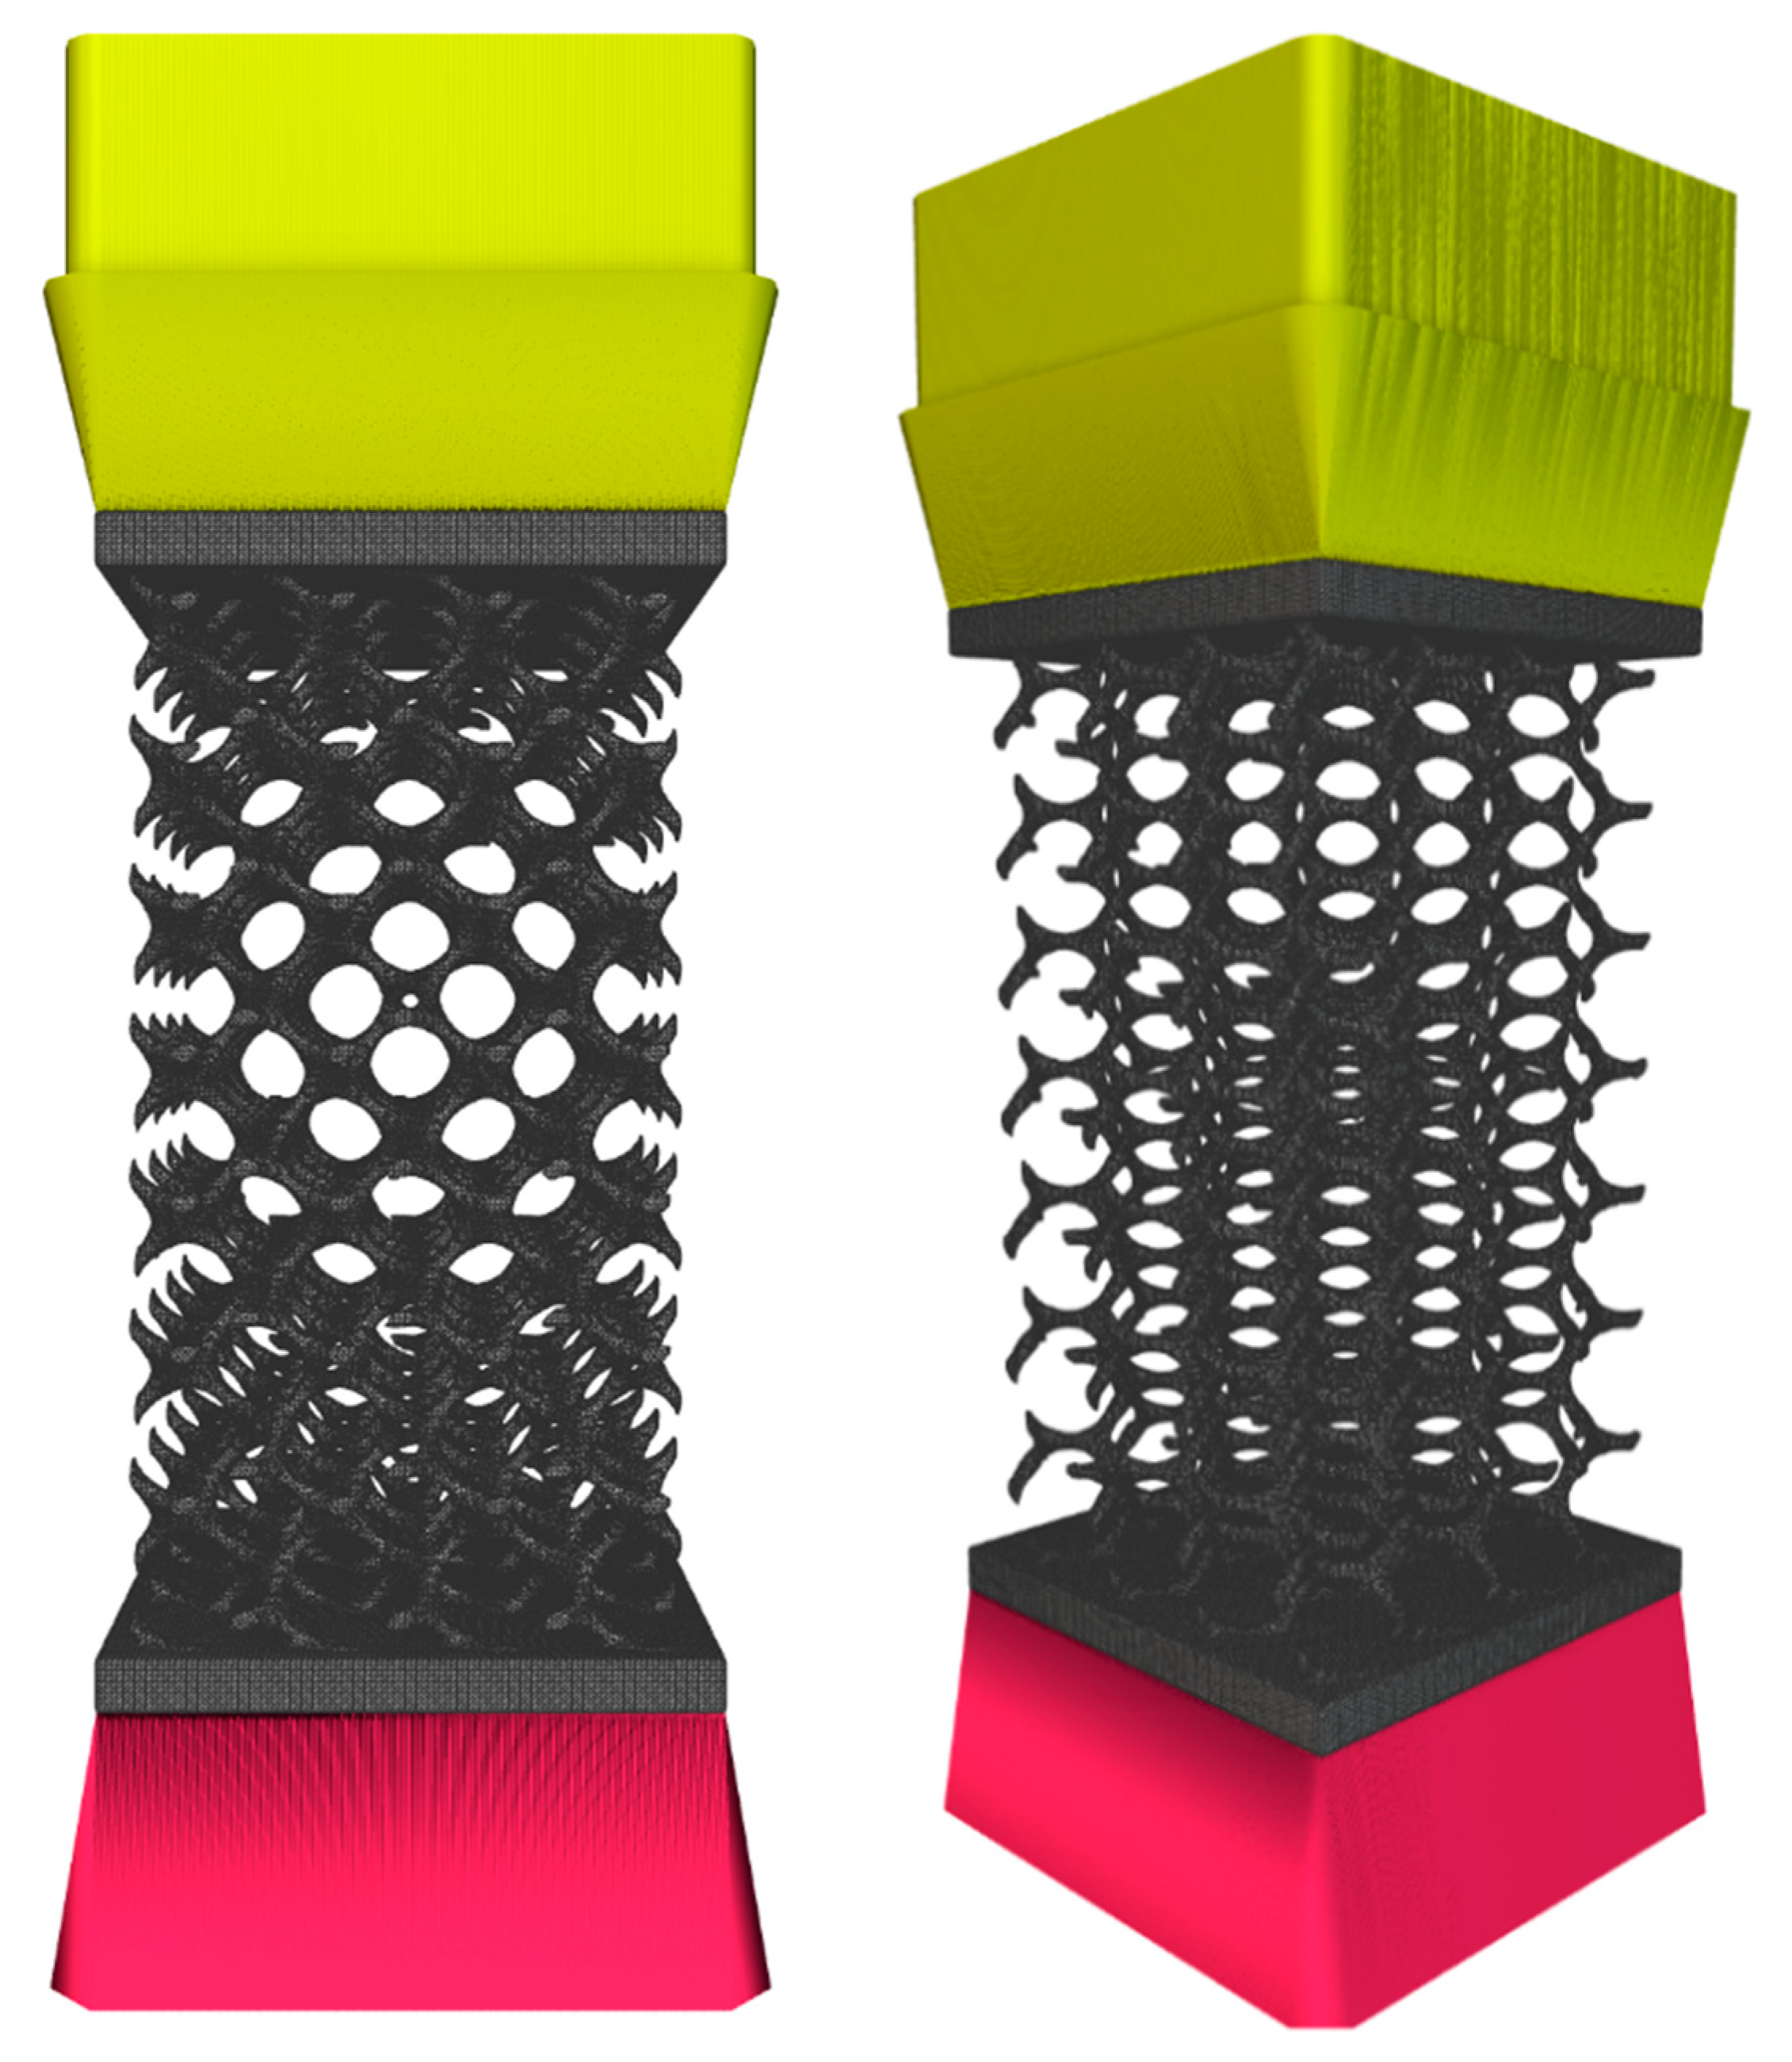
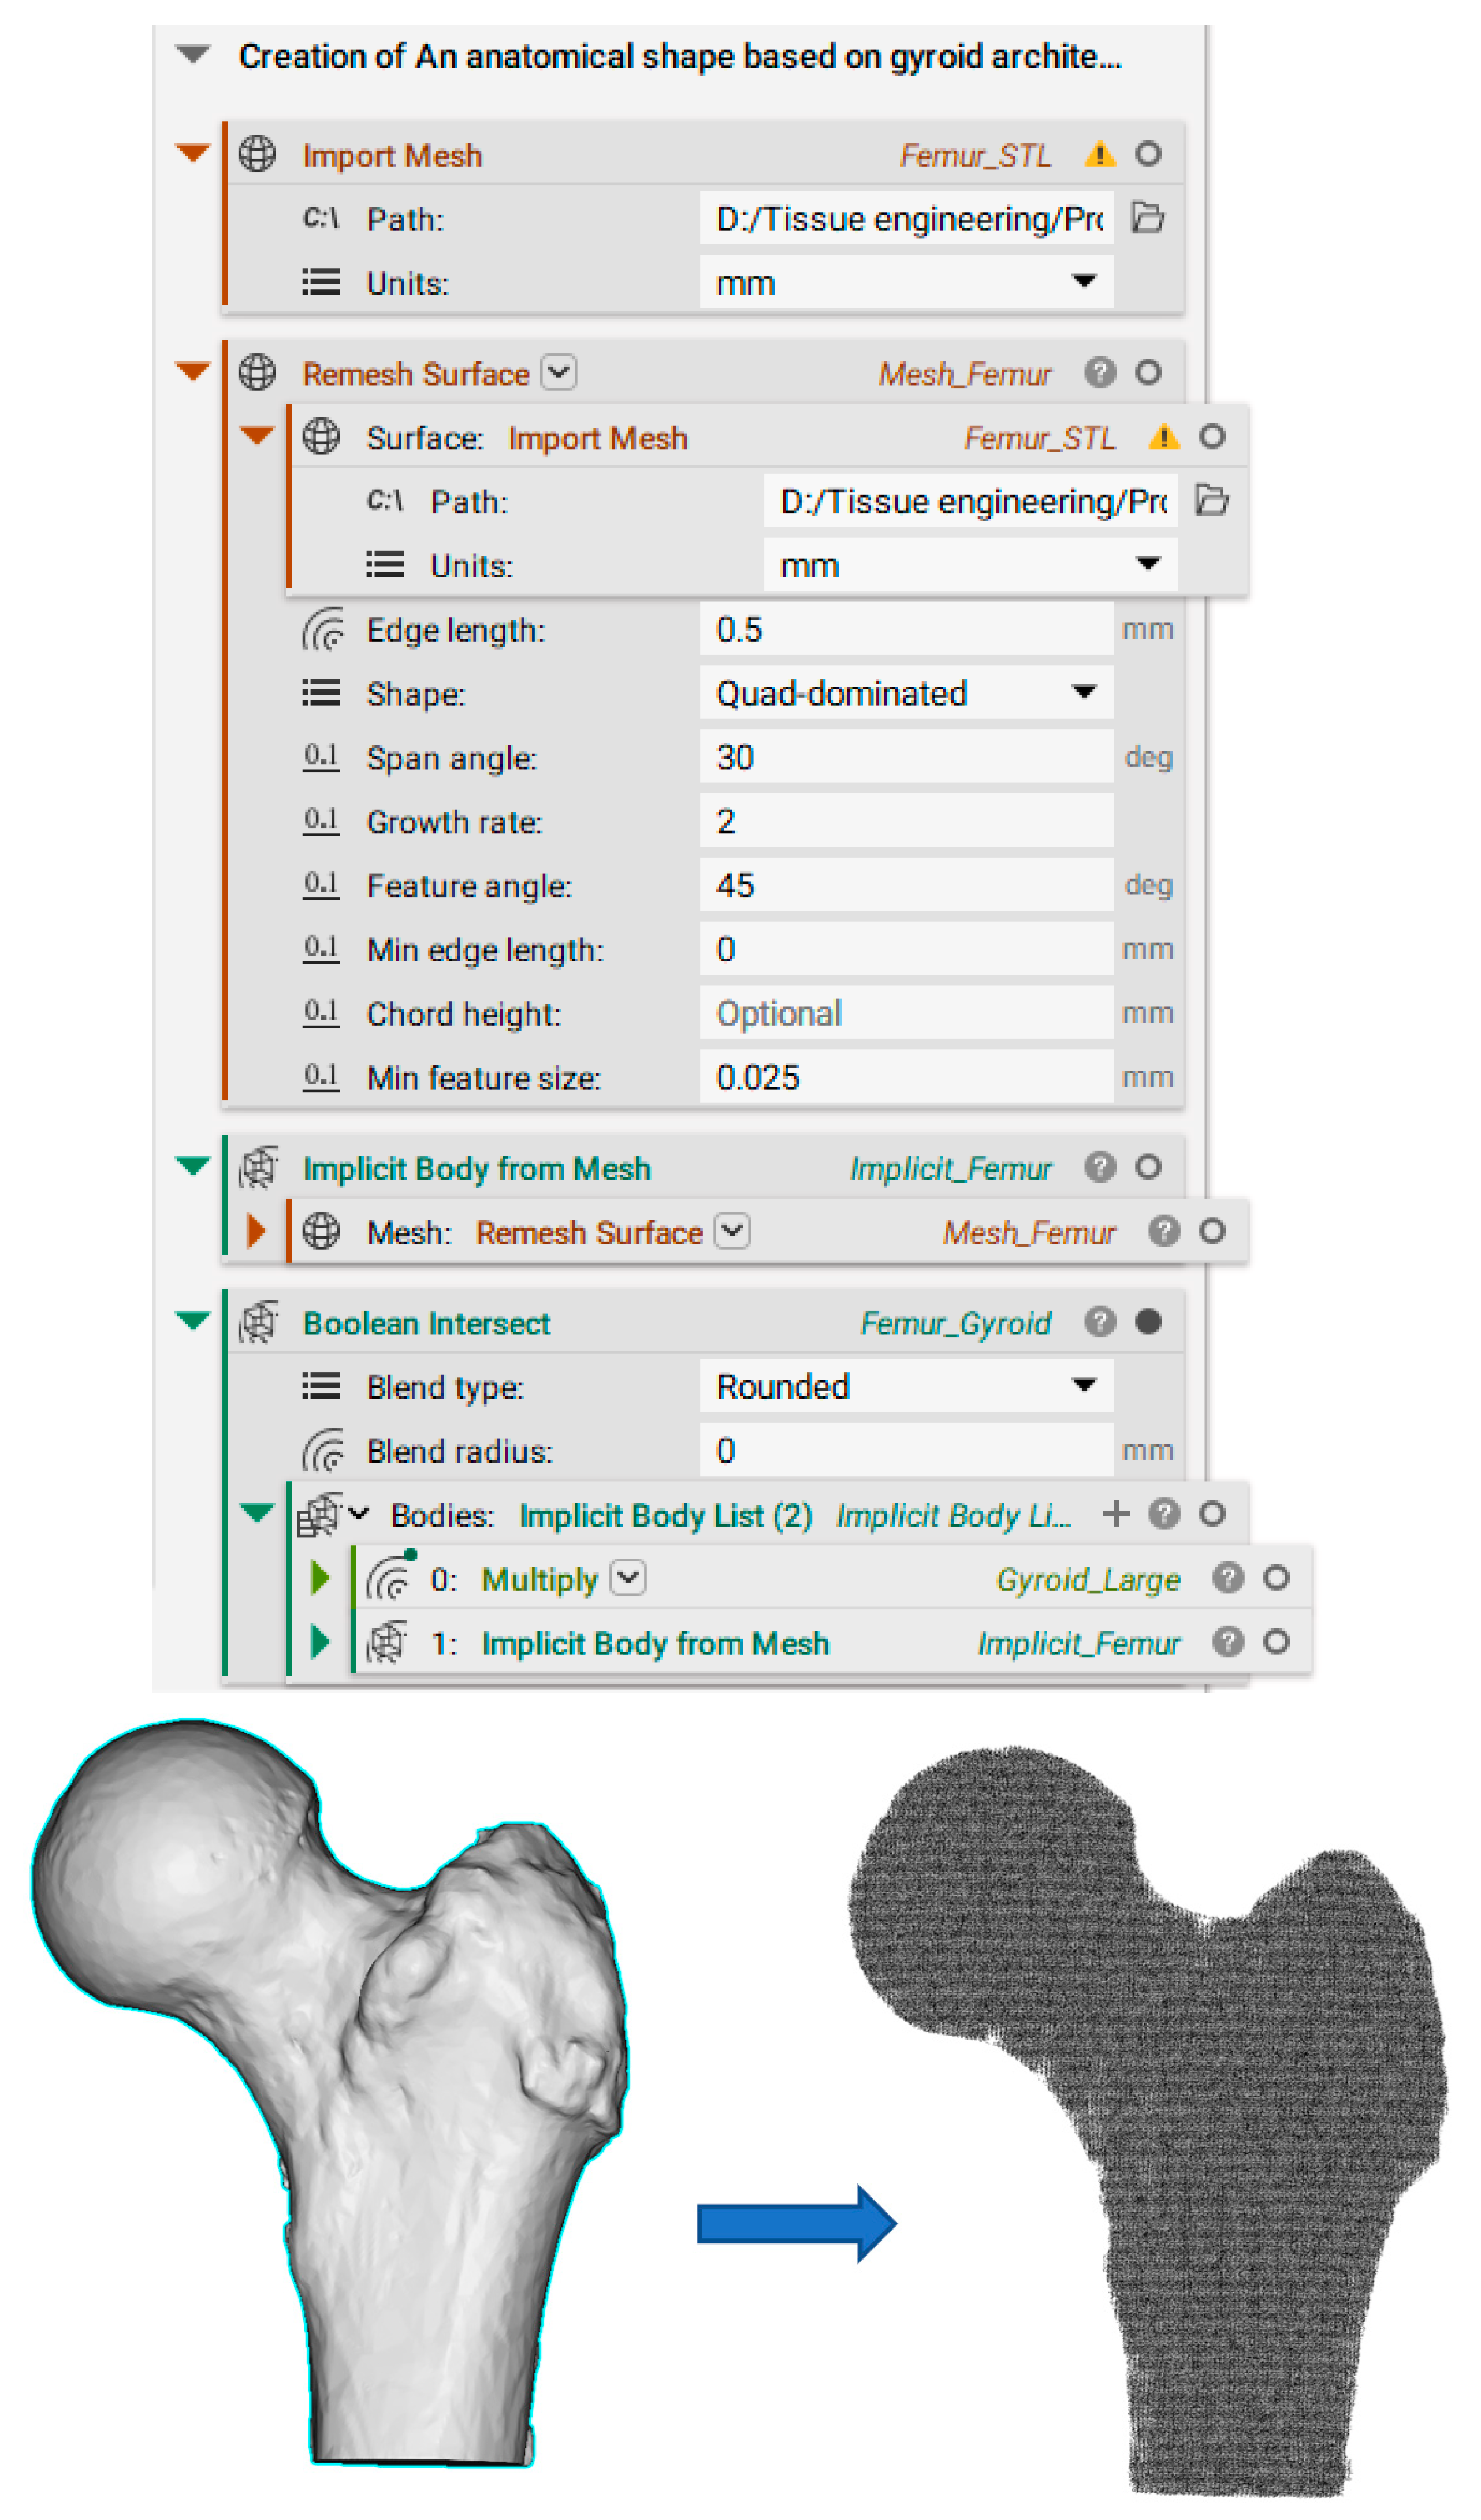
2.1.3. Design of a Scaffold with an External Shape
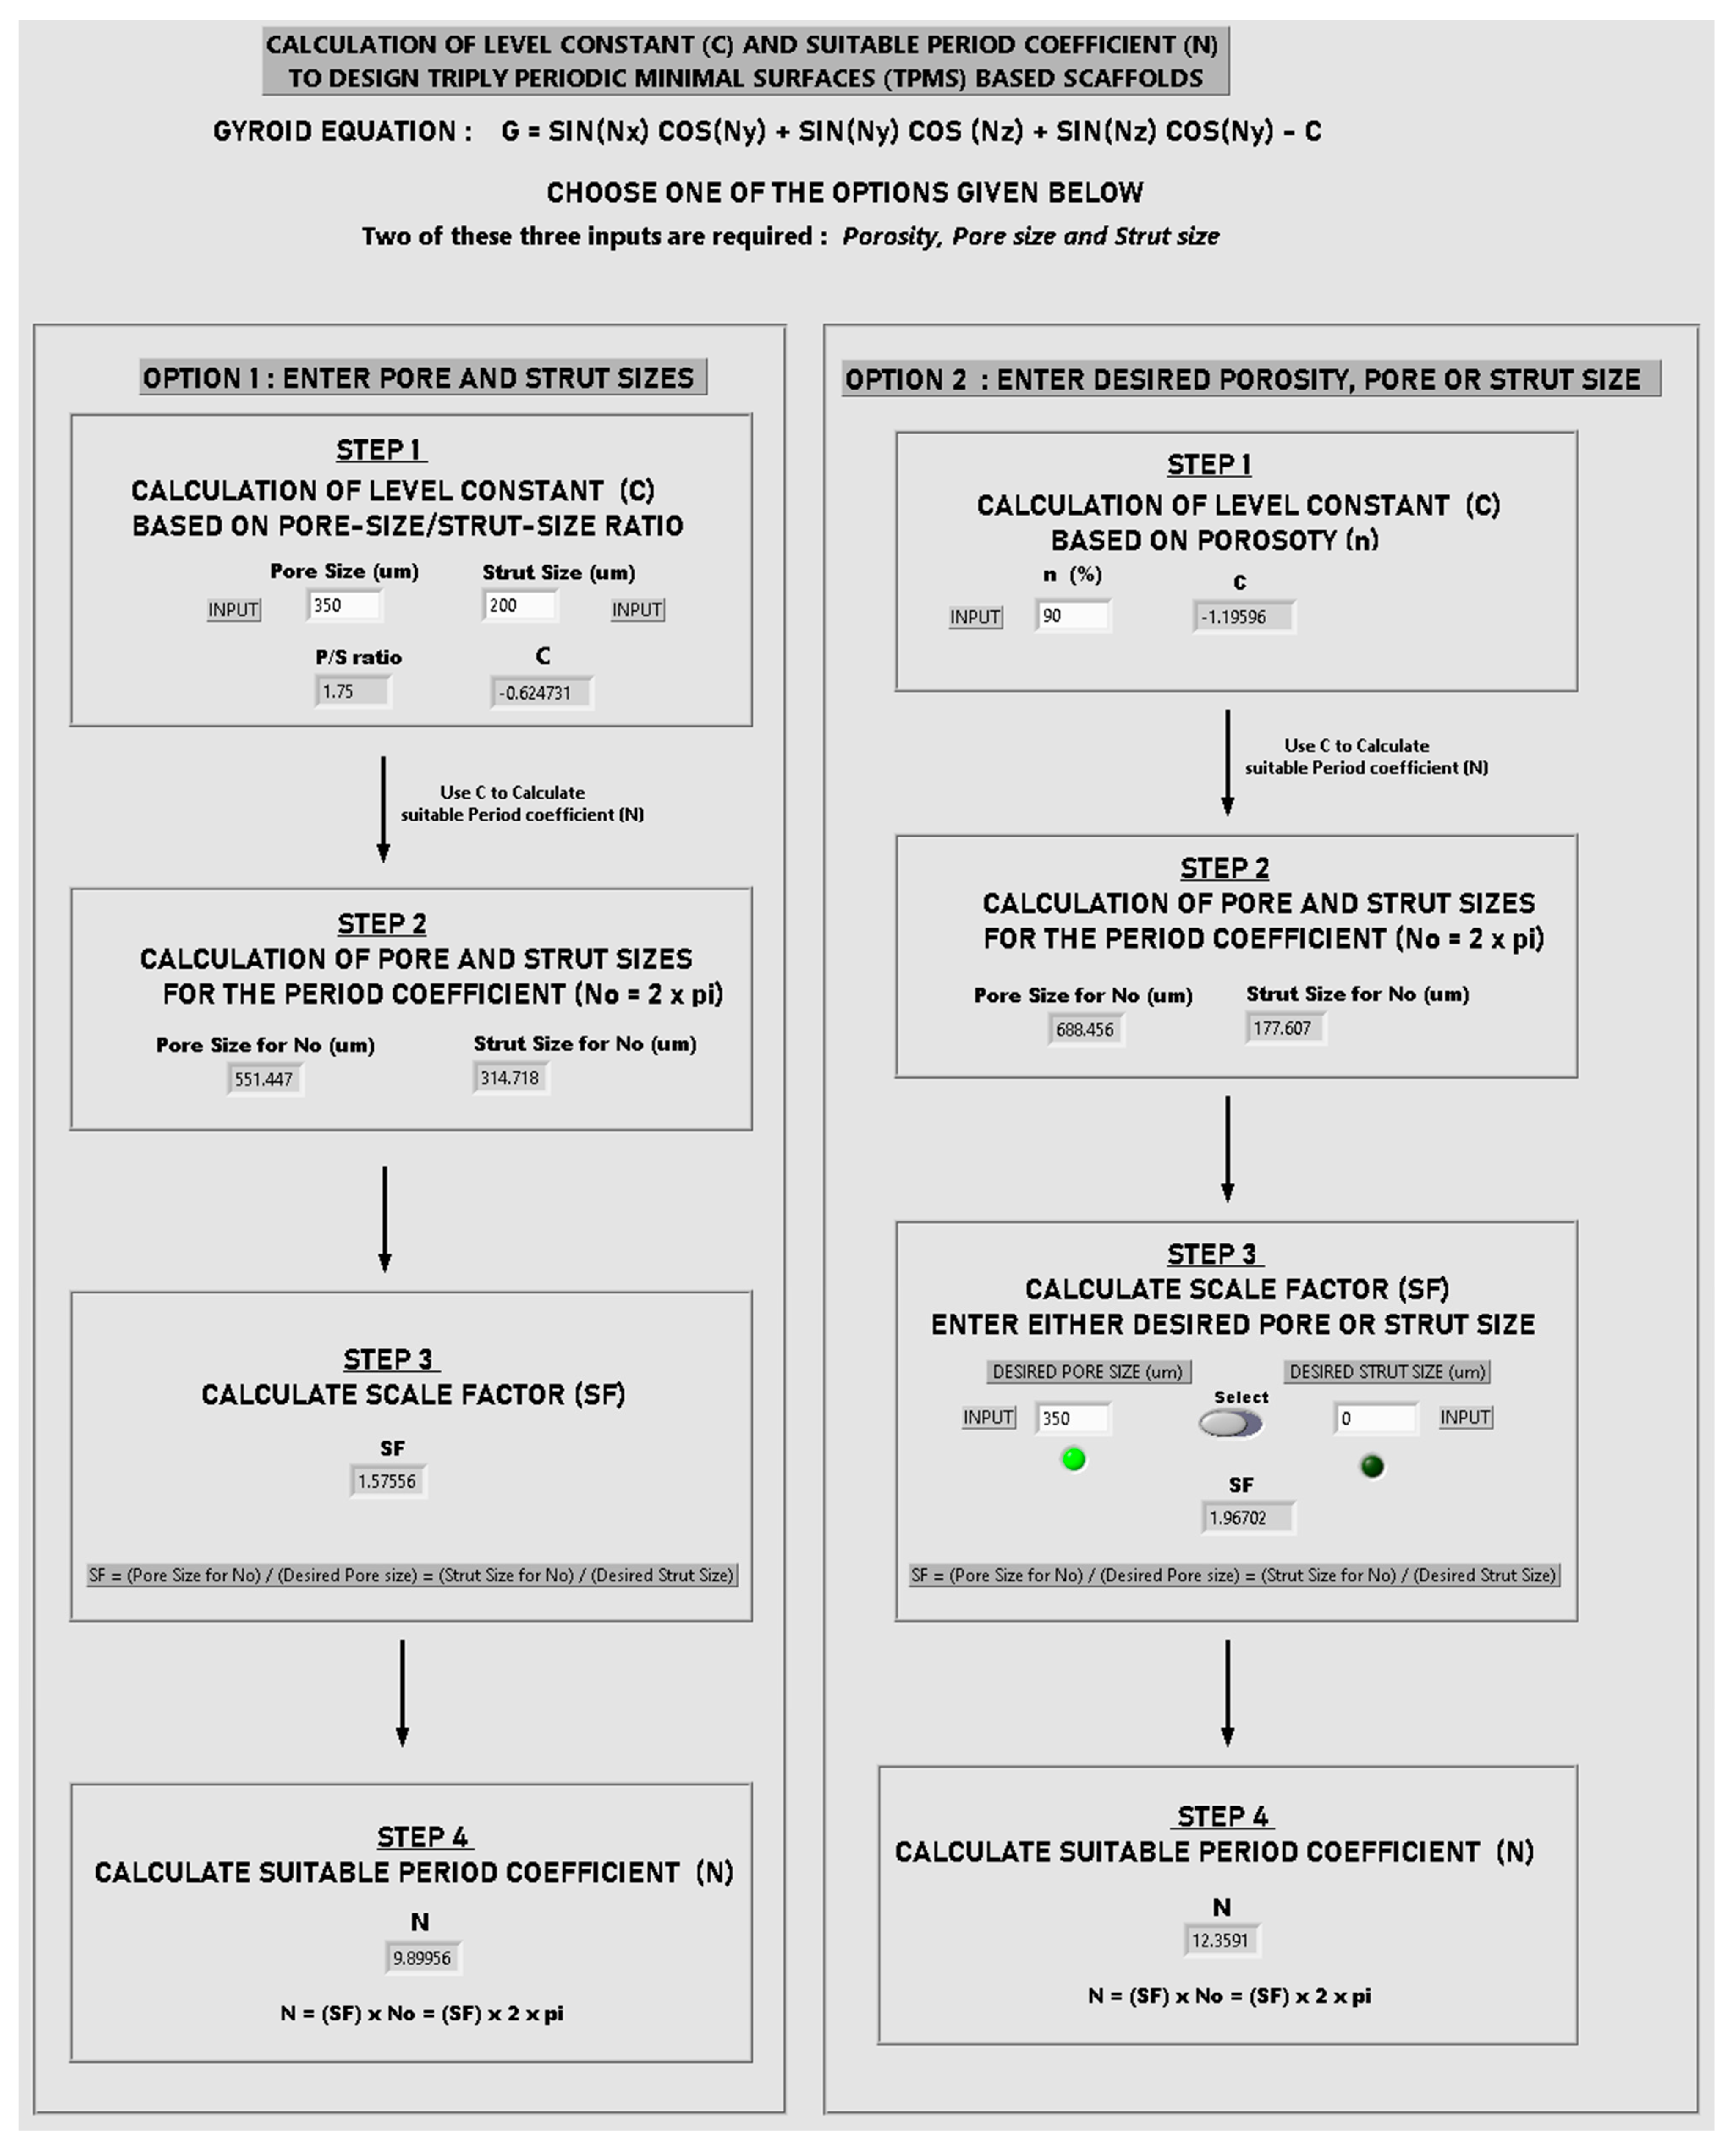
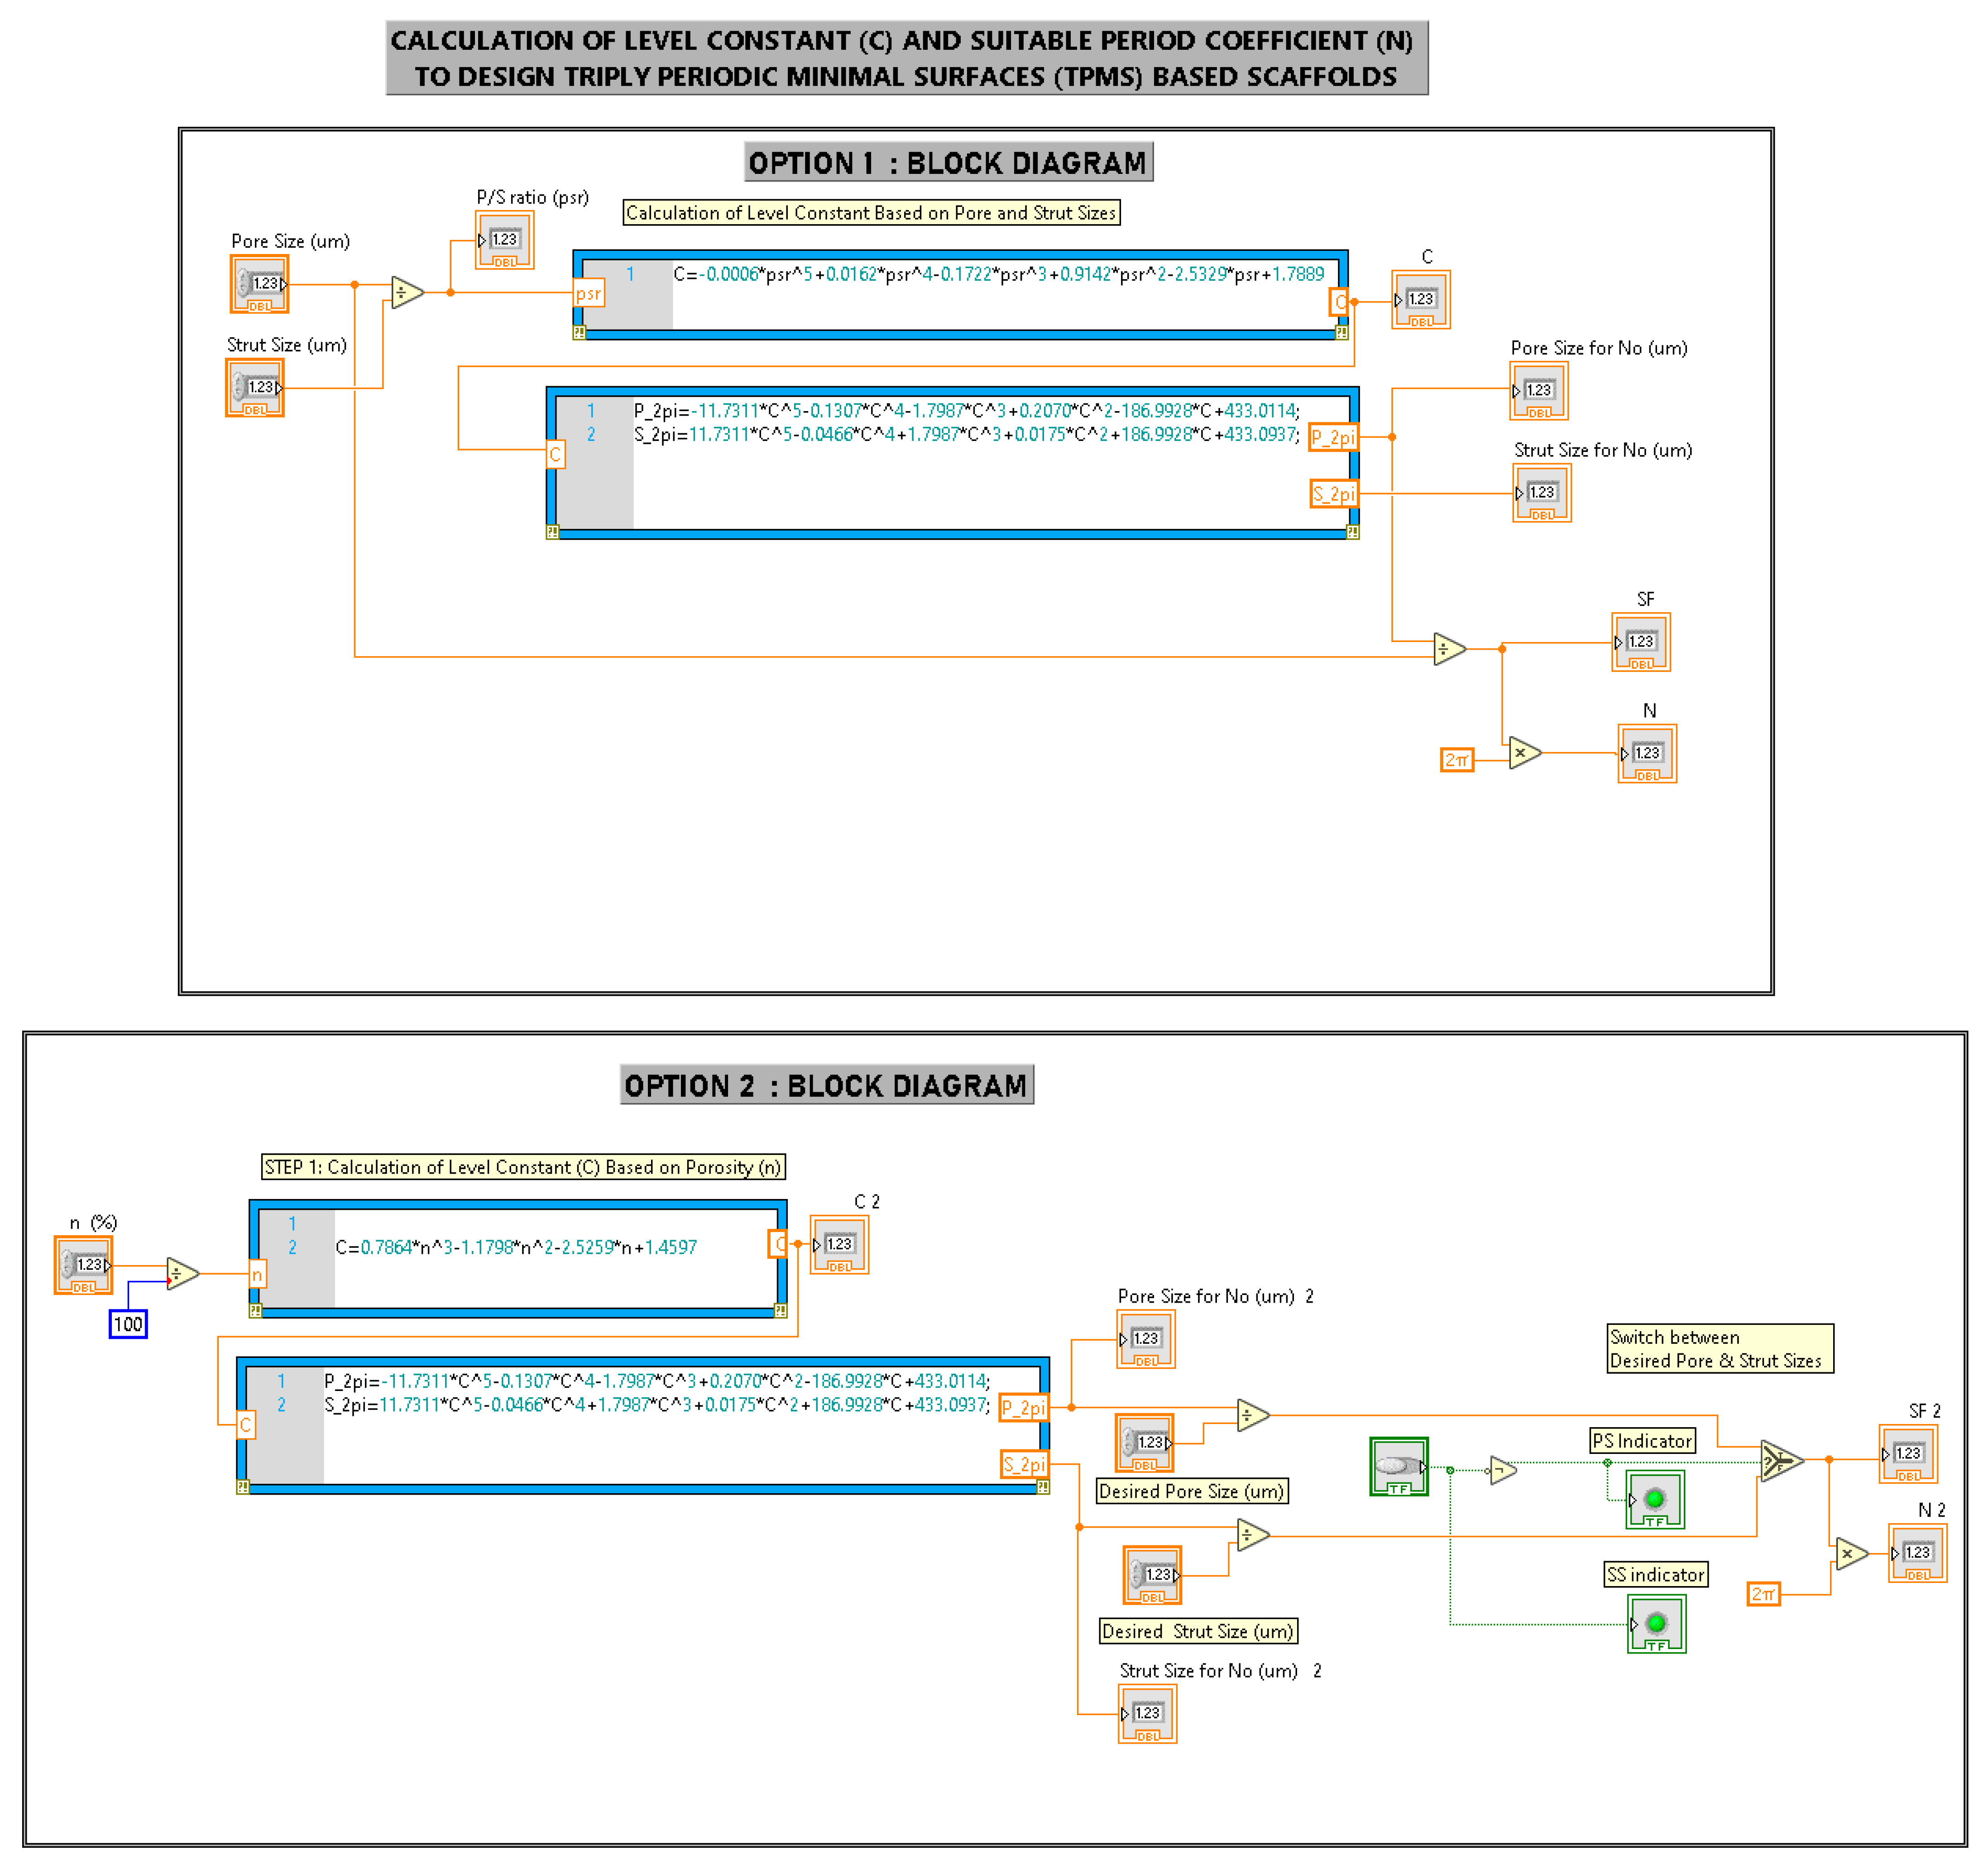
2.1.4. Design of Scaffolds Based on User-Desired Pore Size (PS) and Strut Size (SS)
- (i.)
- Calculate level constant (C) based on PS and SS:
- (ii.)
- Calculate pore size (P2π) and strut size (S2π) for the period coefficient No = 2π:
- (iii.)
- Calculate the scale factor (SF) from either giving the desired pore or strut size;
- (iv.)
- Calculate suitable period coefficient (N).
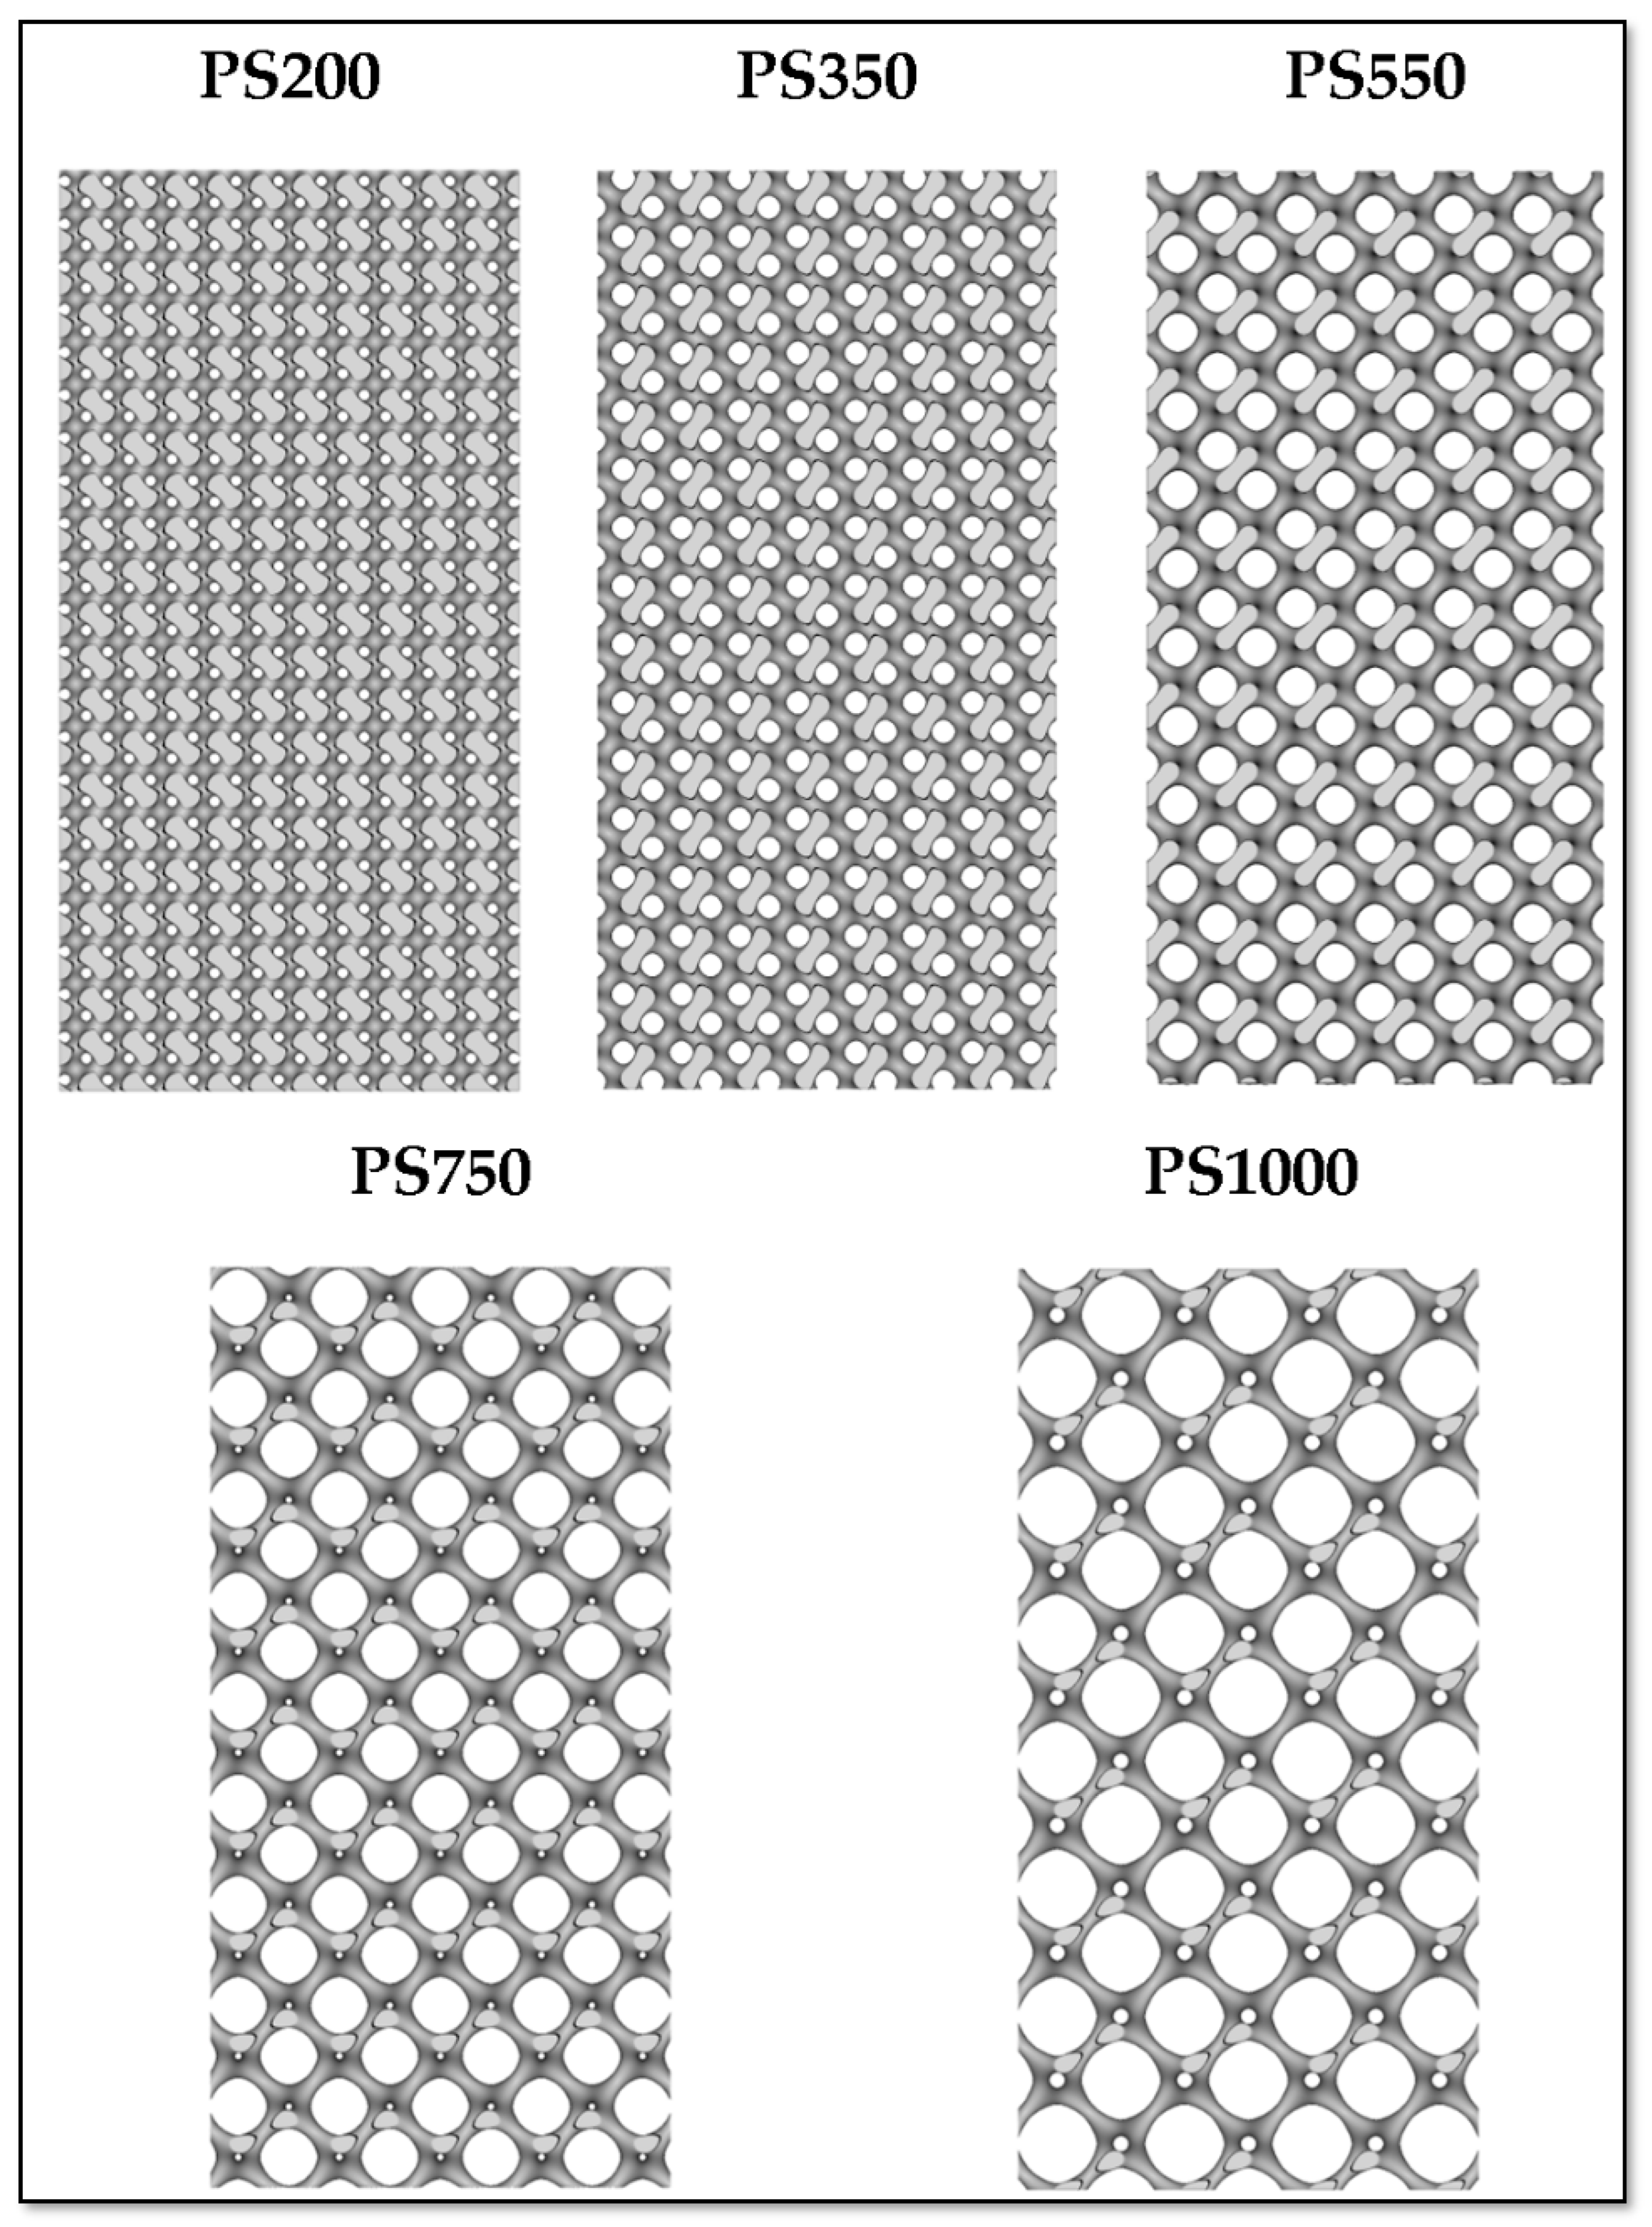
- (i.)
- PS200 (Pore Size 200 µm and Strut Size 200 µm);
- (ii.)
- PS350 (Pore Size 350 µm and Strut Size 200 µm);
- (iii.)
- PS550 (Pore Size 550 µm and Strut Size 200 µm);
- (iv.)
- PS750 (Pore Size 750 µm and Strut Size 200 µm);
- (v.)
- PS1000 (Pore Size 1000 µm and Strut Size 200 µm).
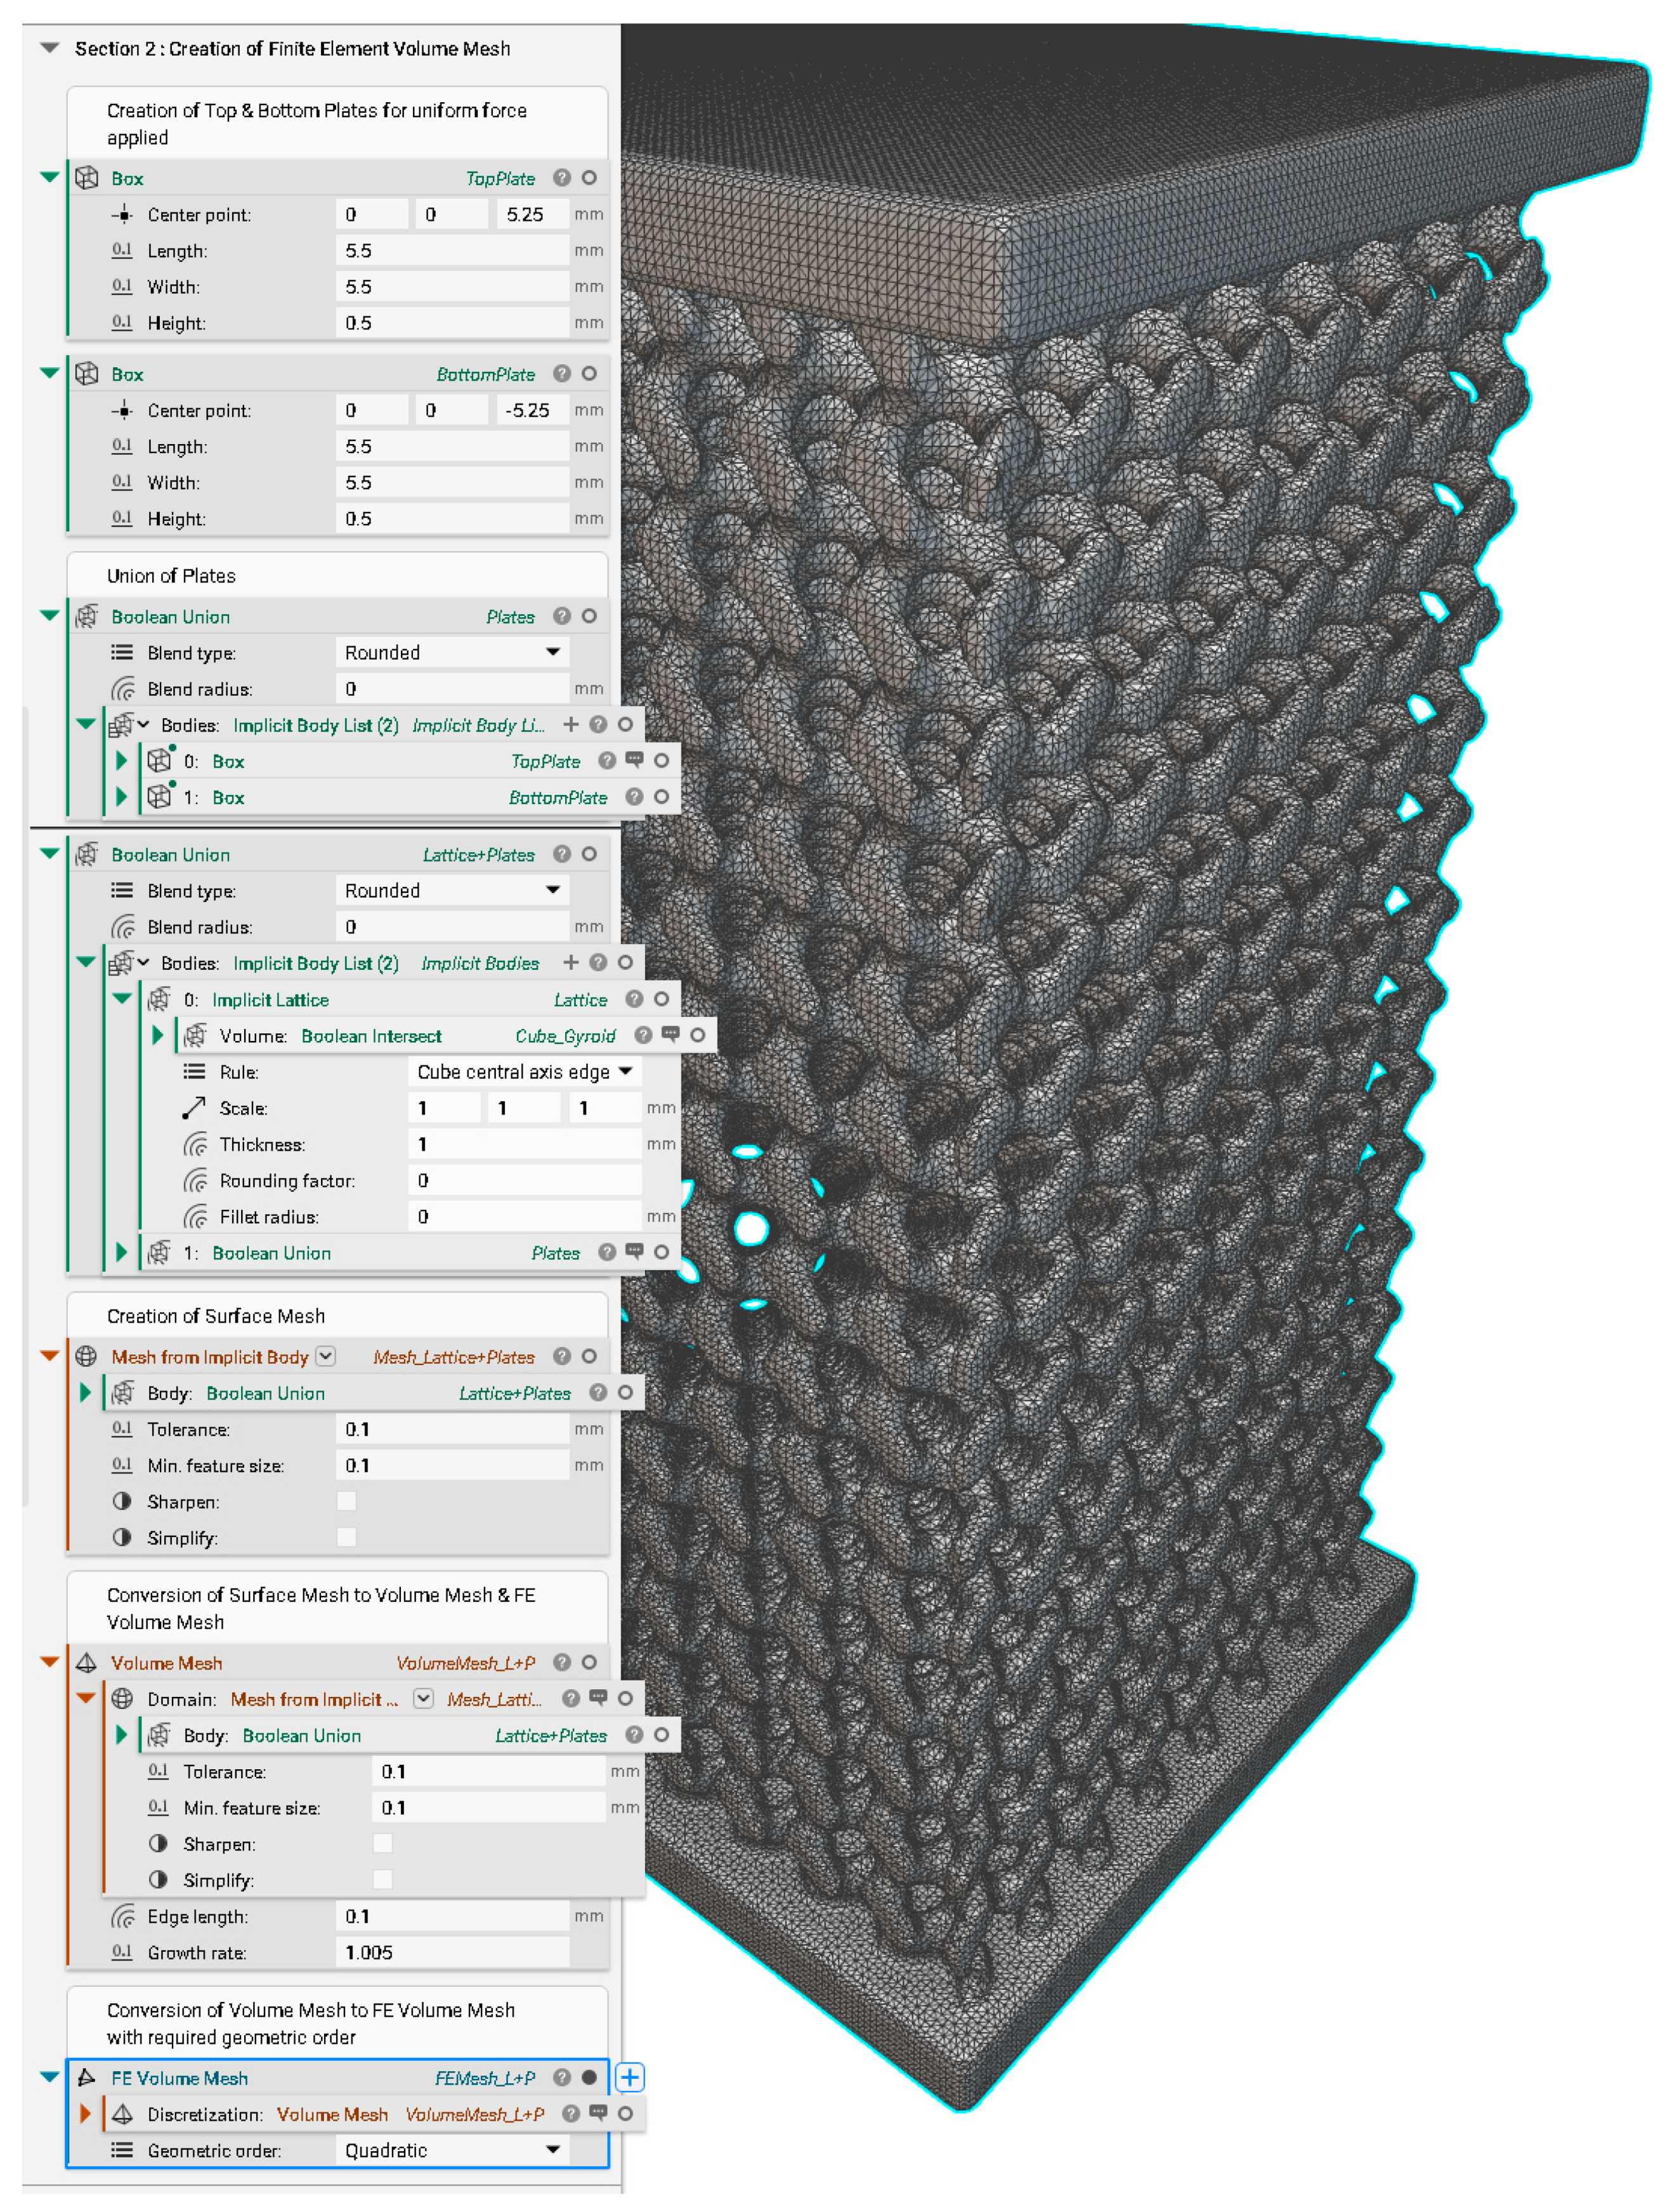
2.2. Creation of FE Volume Meshes
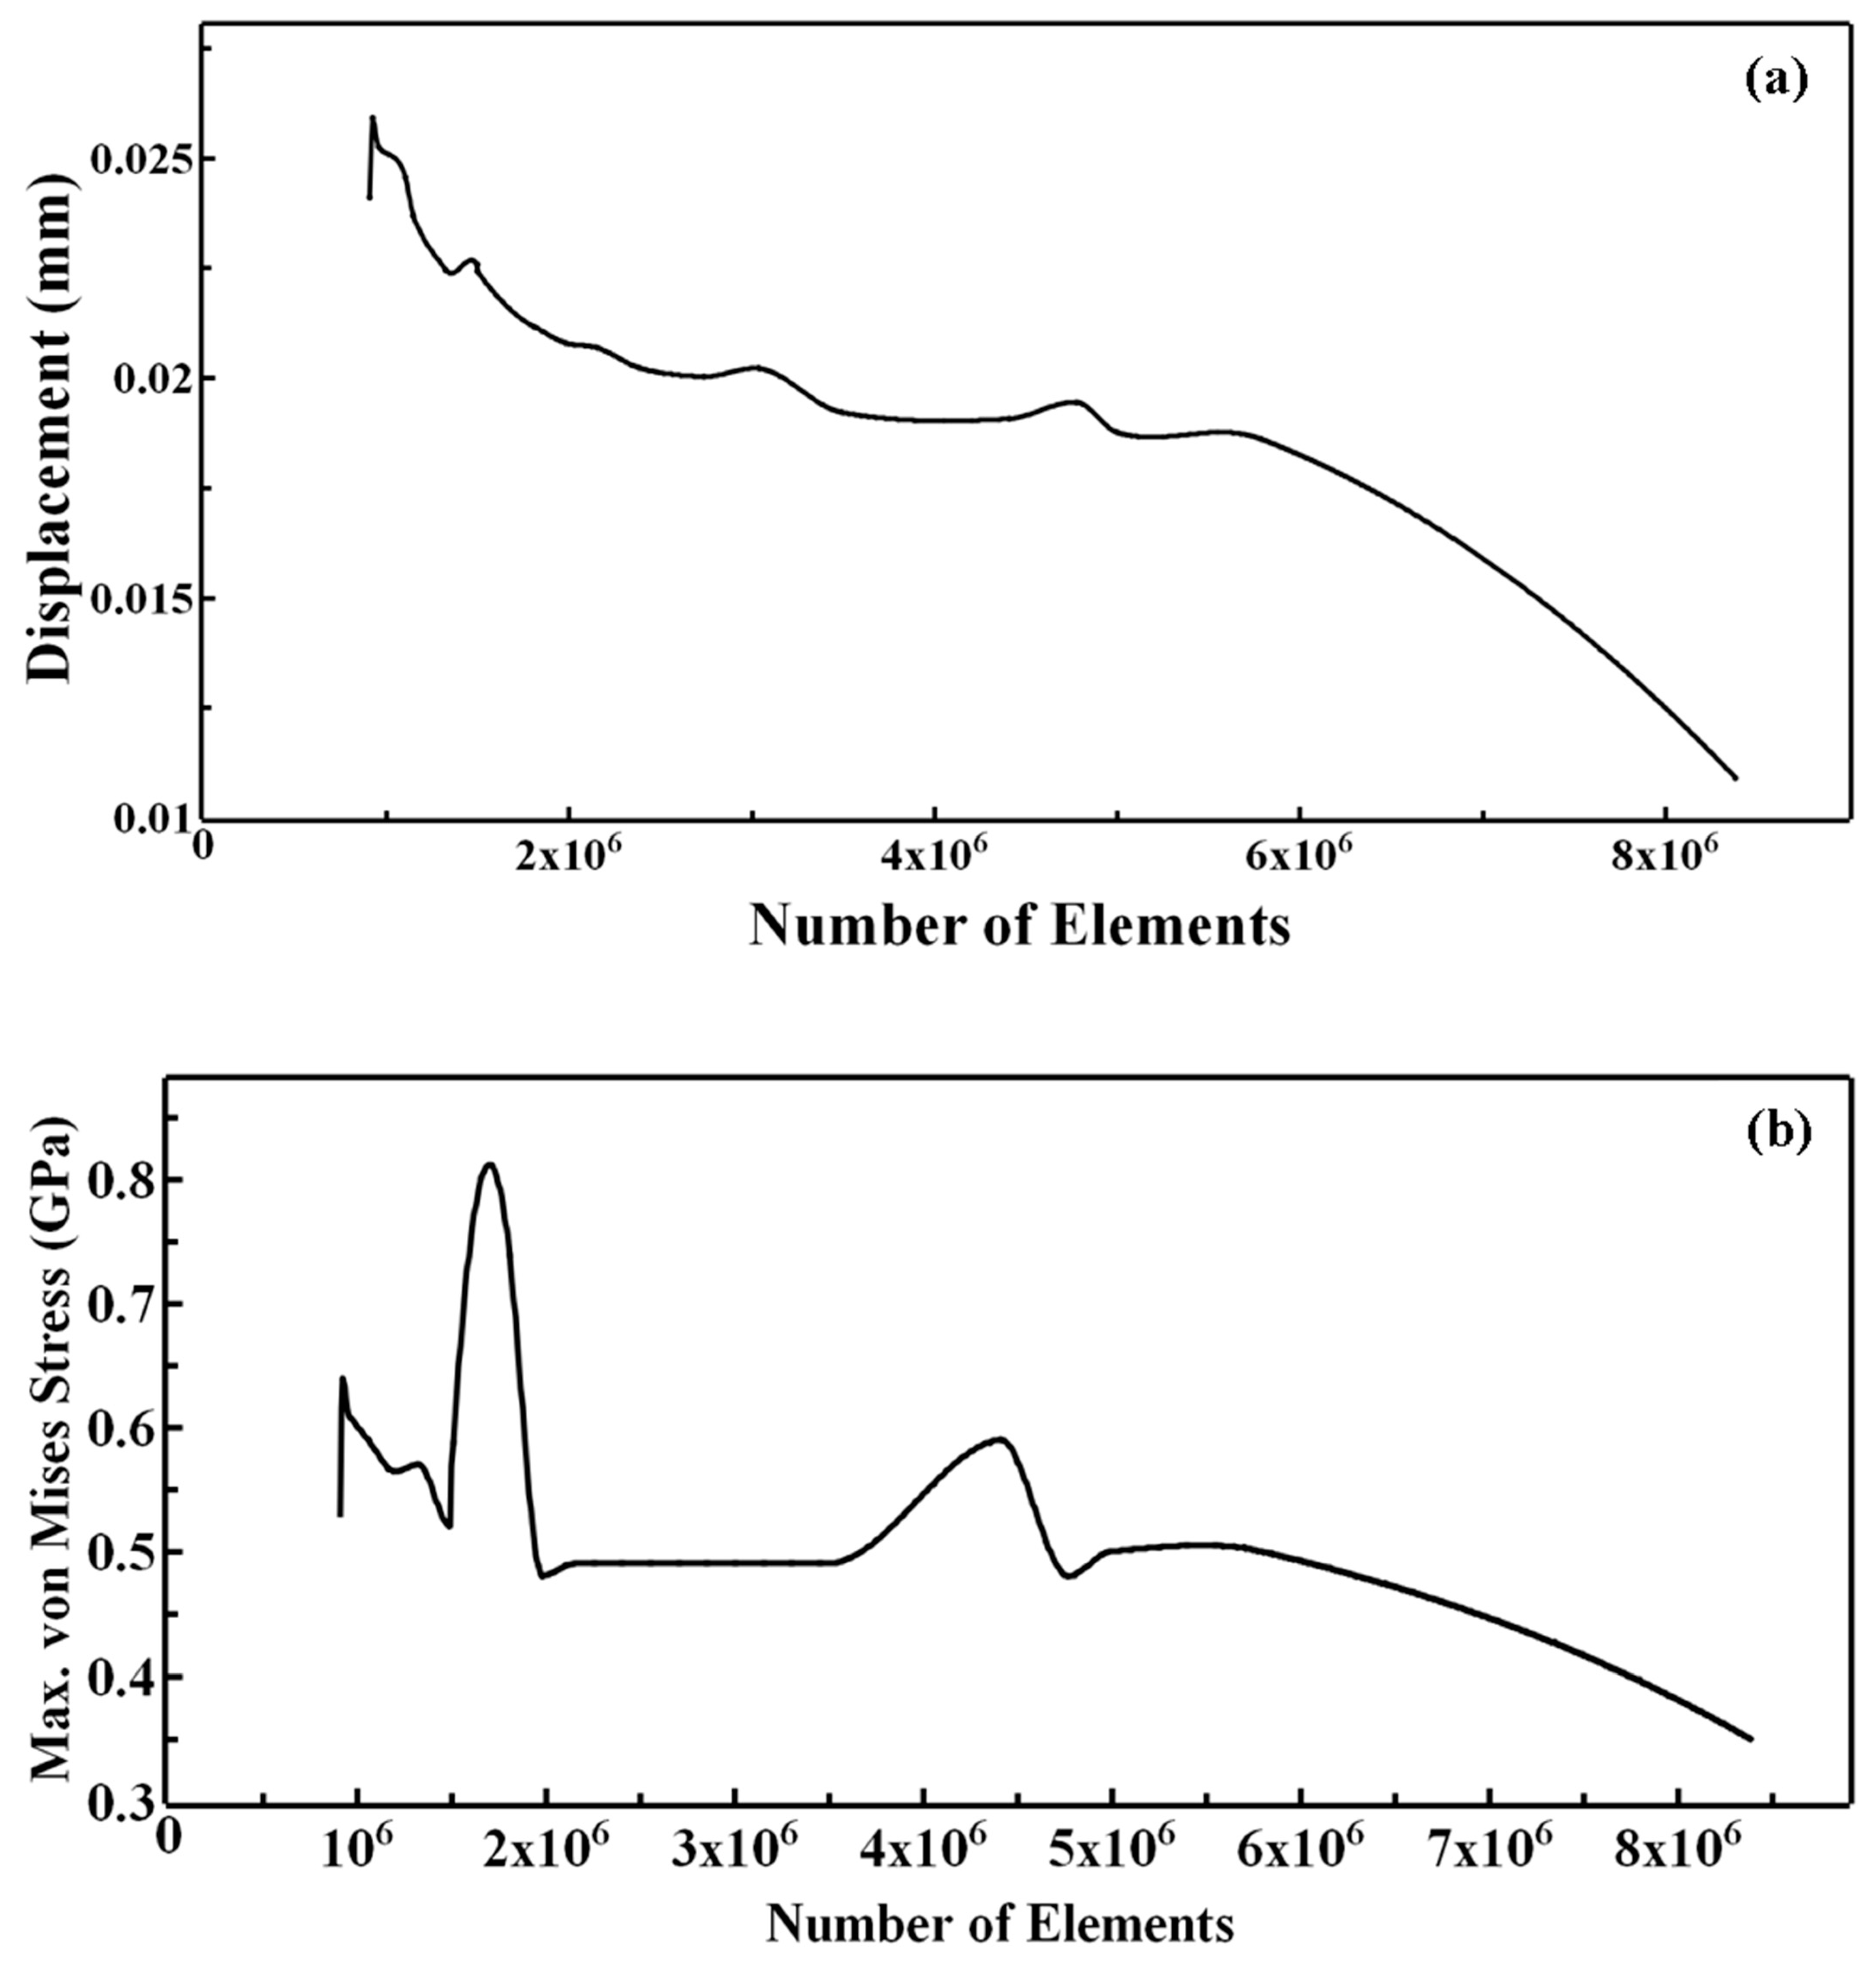
2.2.1. Meshing
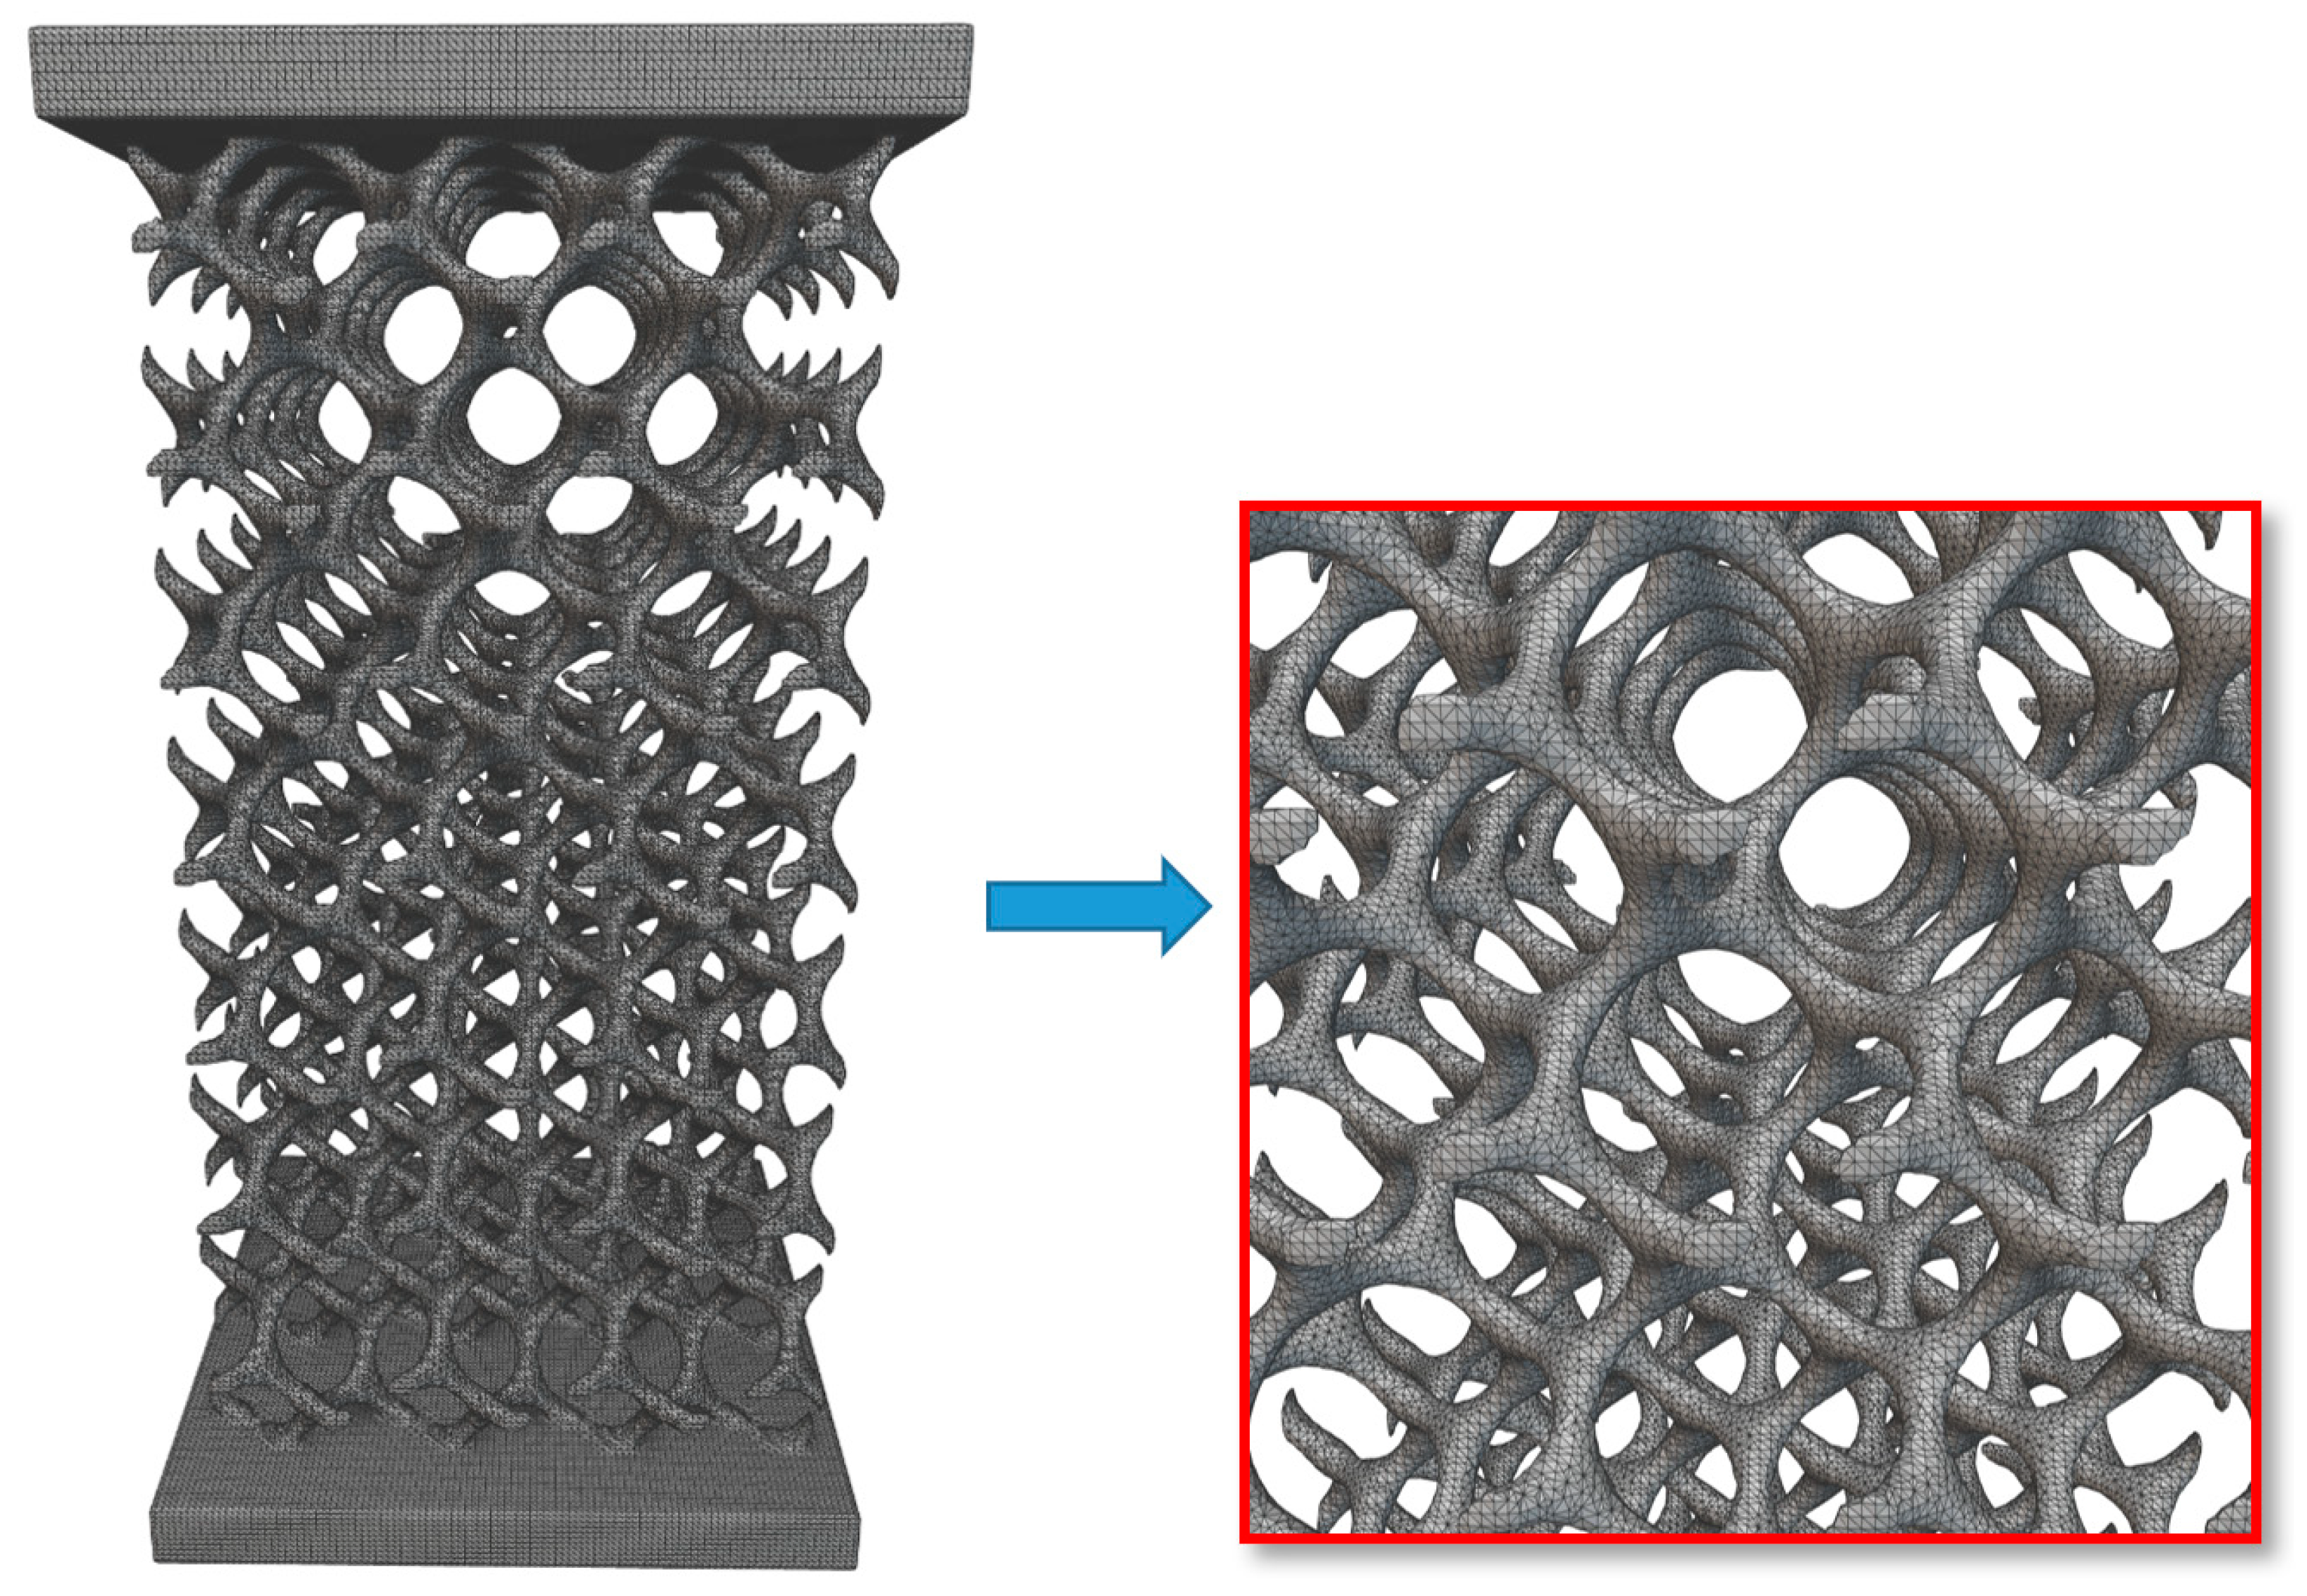
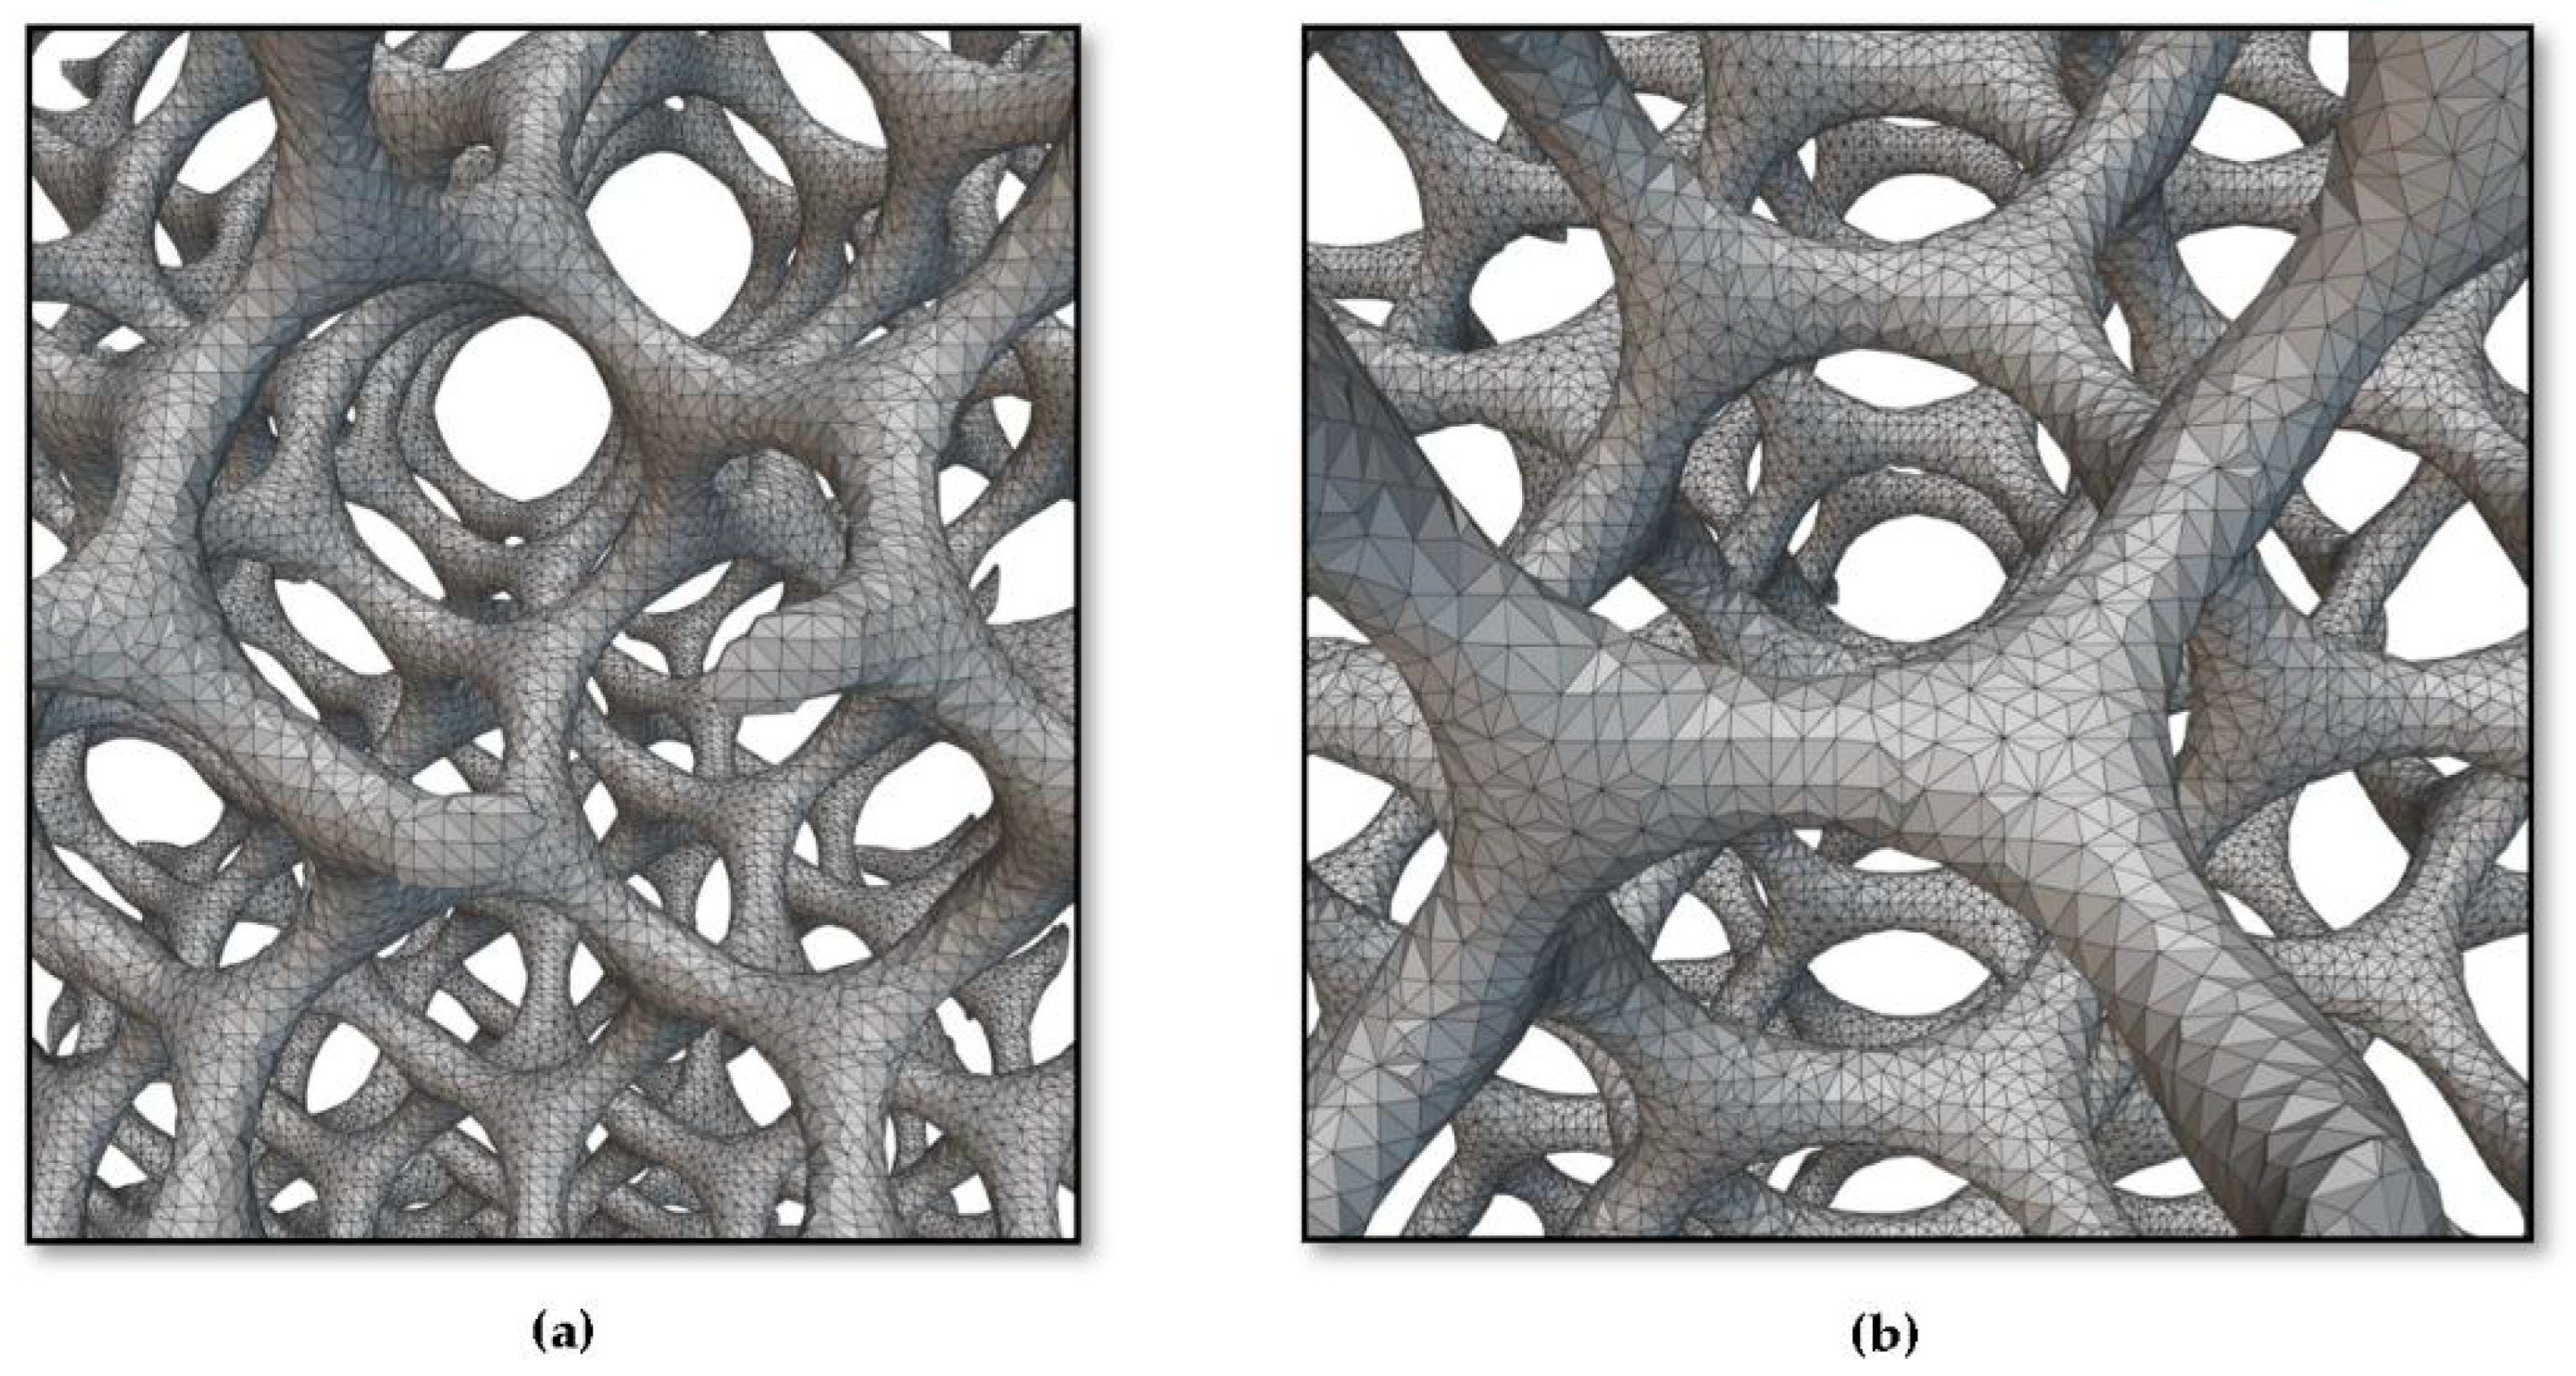
2.2.2. Converting the Implicit Body (Gyroid Lattice) into the Surface Mesh
2.2.3. Converting the Surface Mesh into a Volume Mesh
2.2.4. Converting the Volume Mesh into a FE Volume Mesh
2.3. Simulation
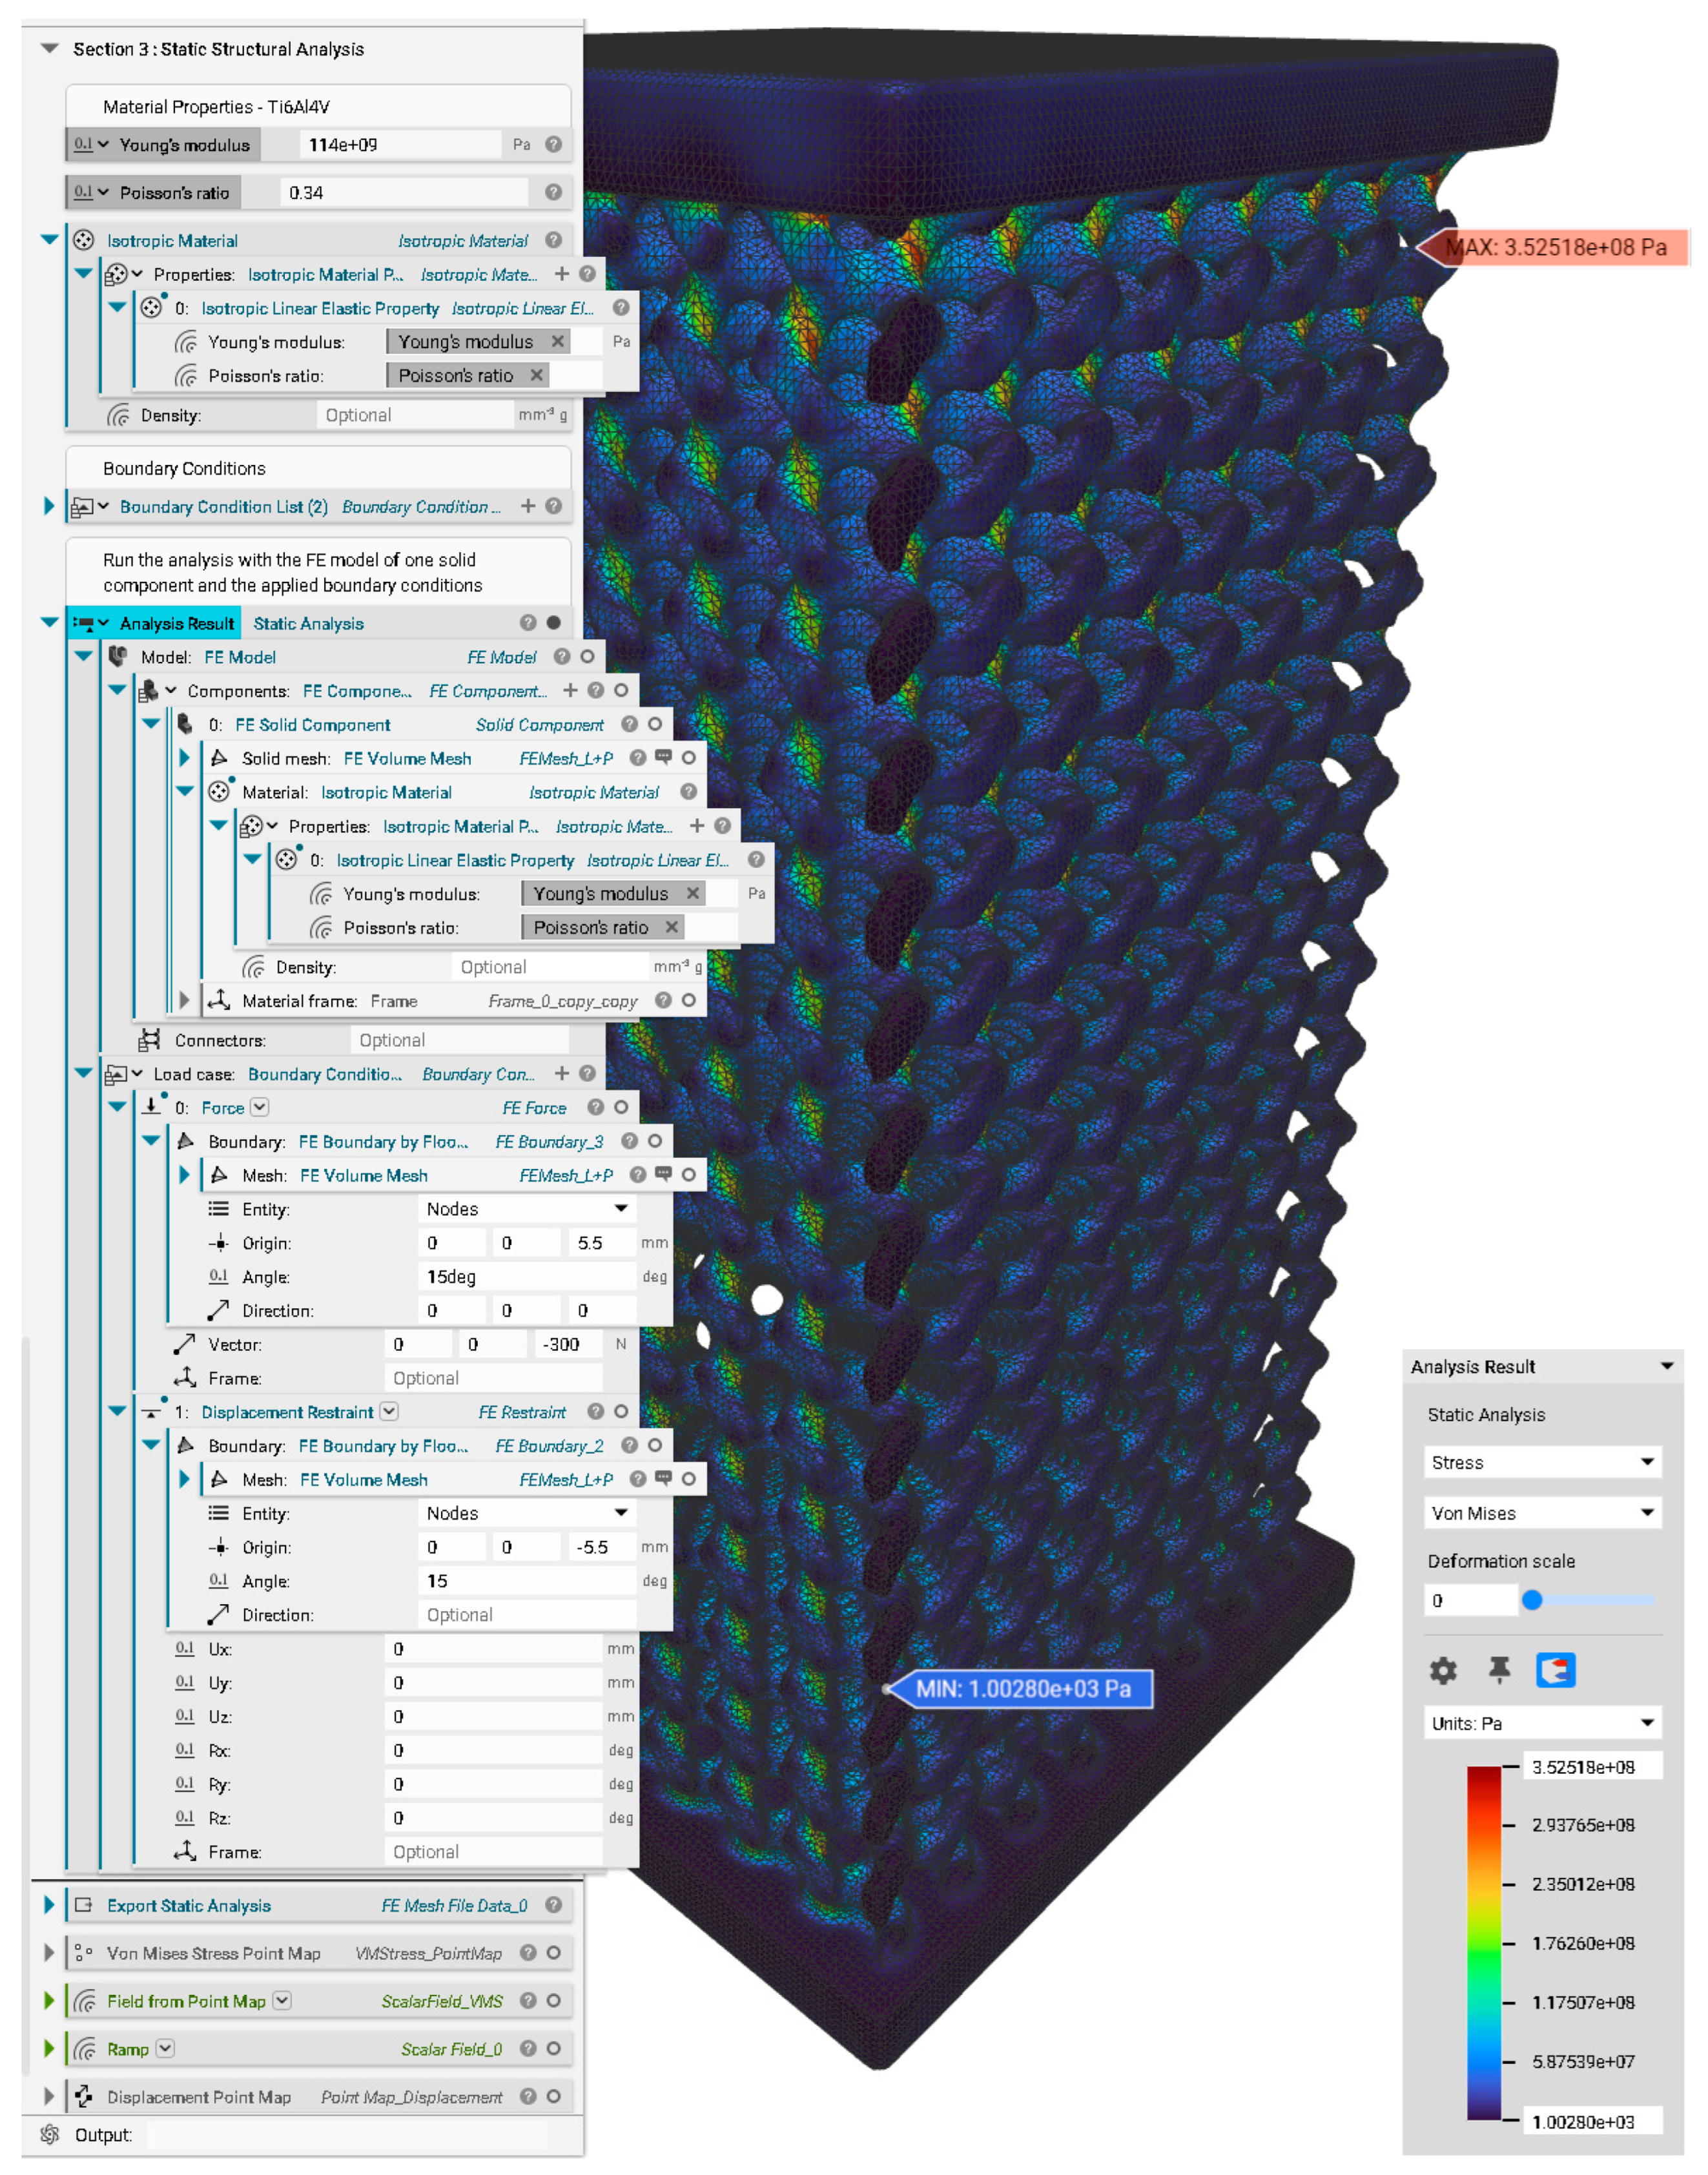
2.3.1. FE Model
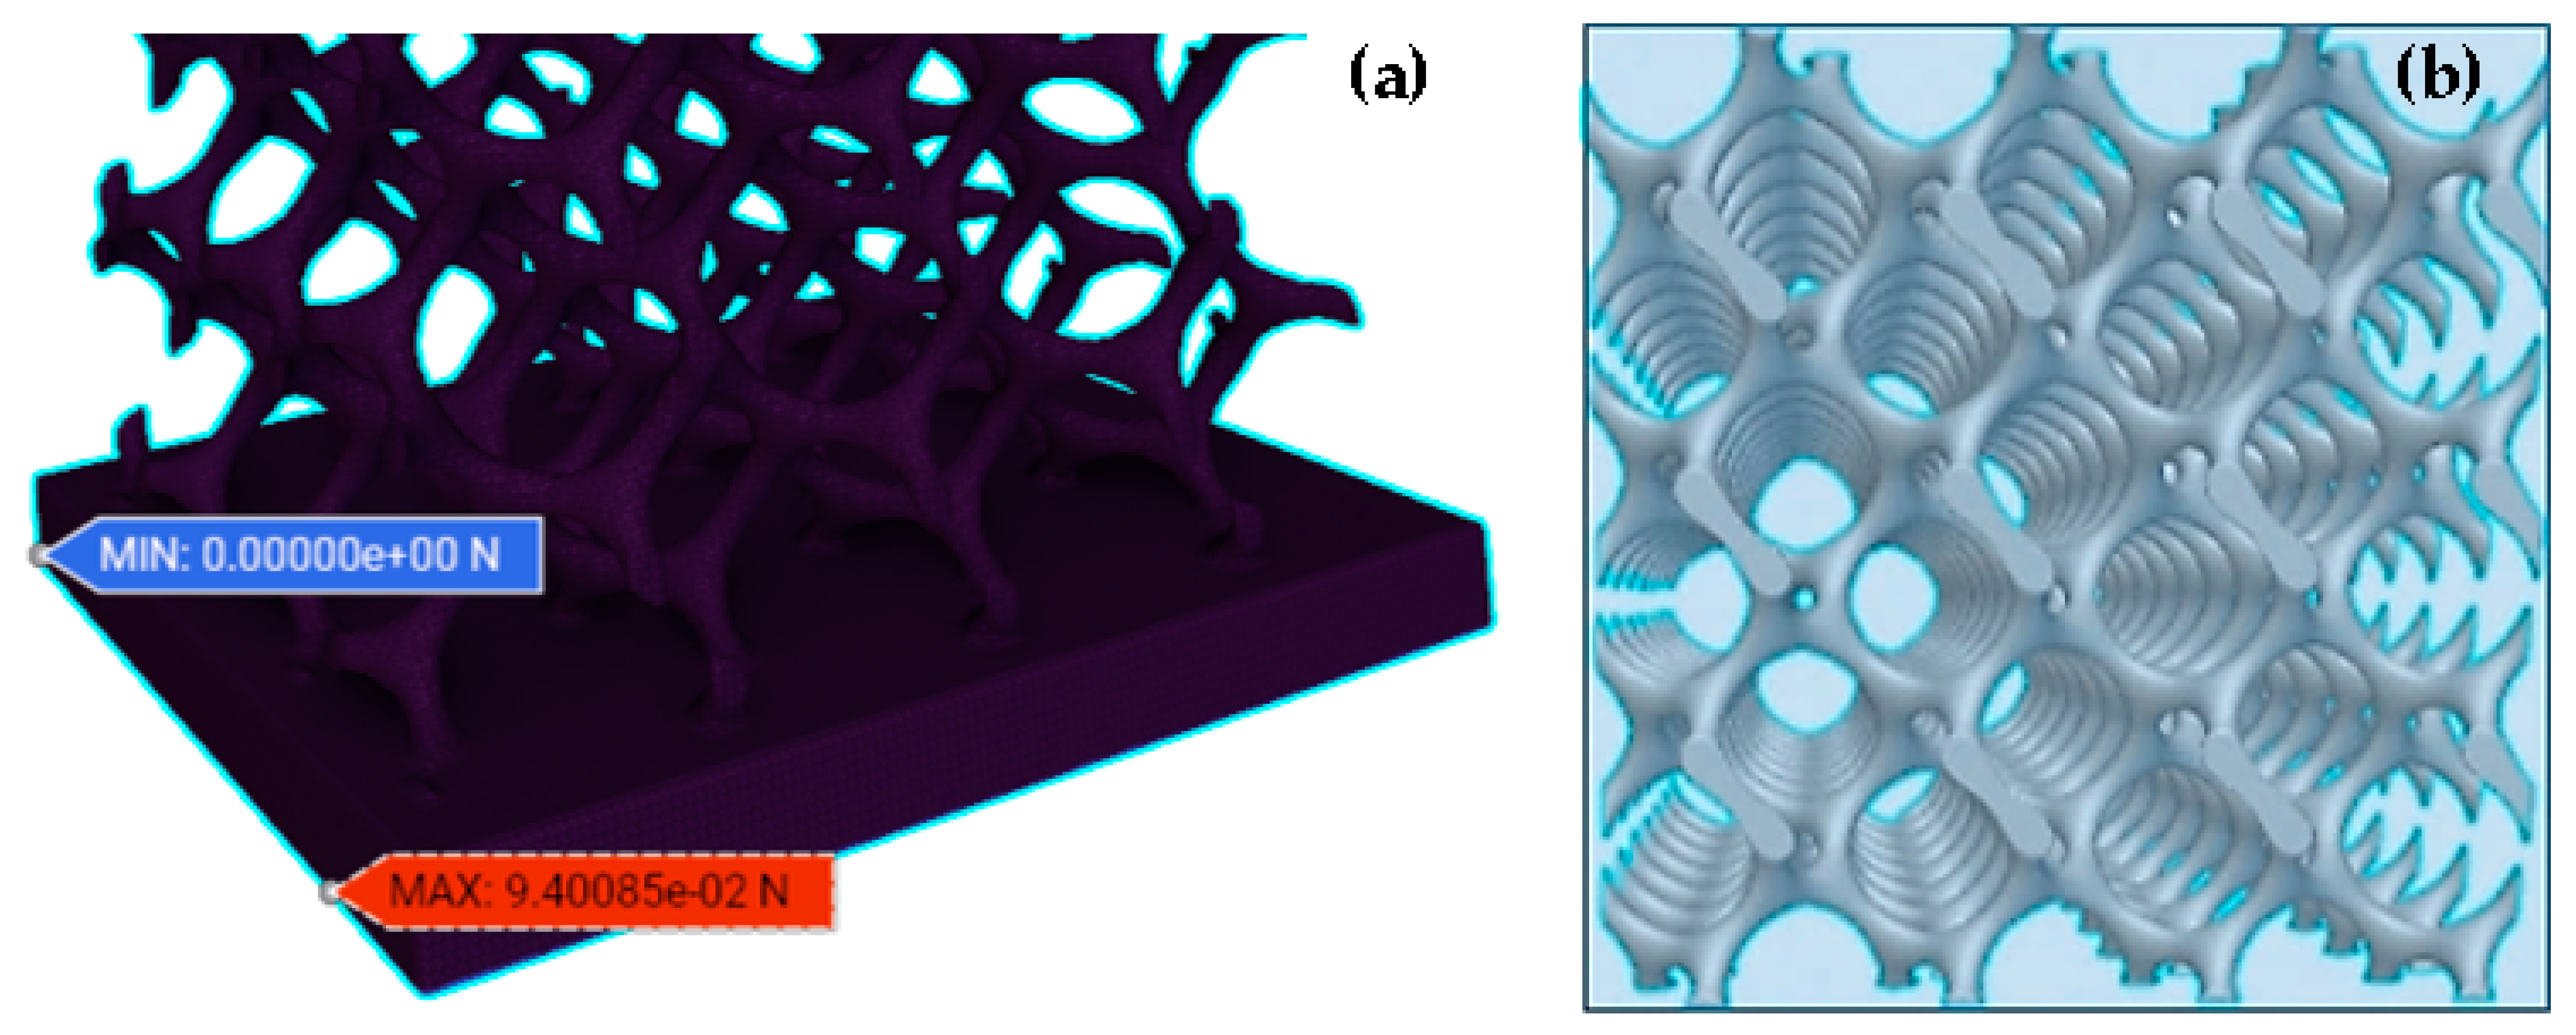
2.3.2. Simulation Method and Static Analysis
3. Results and Discussion
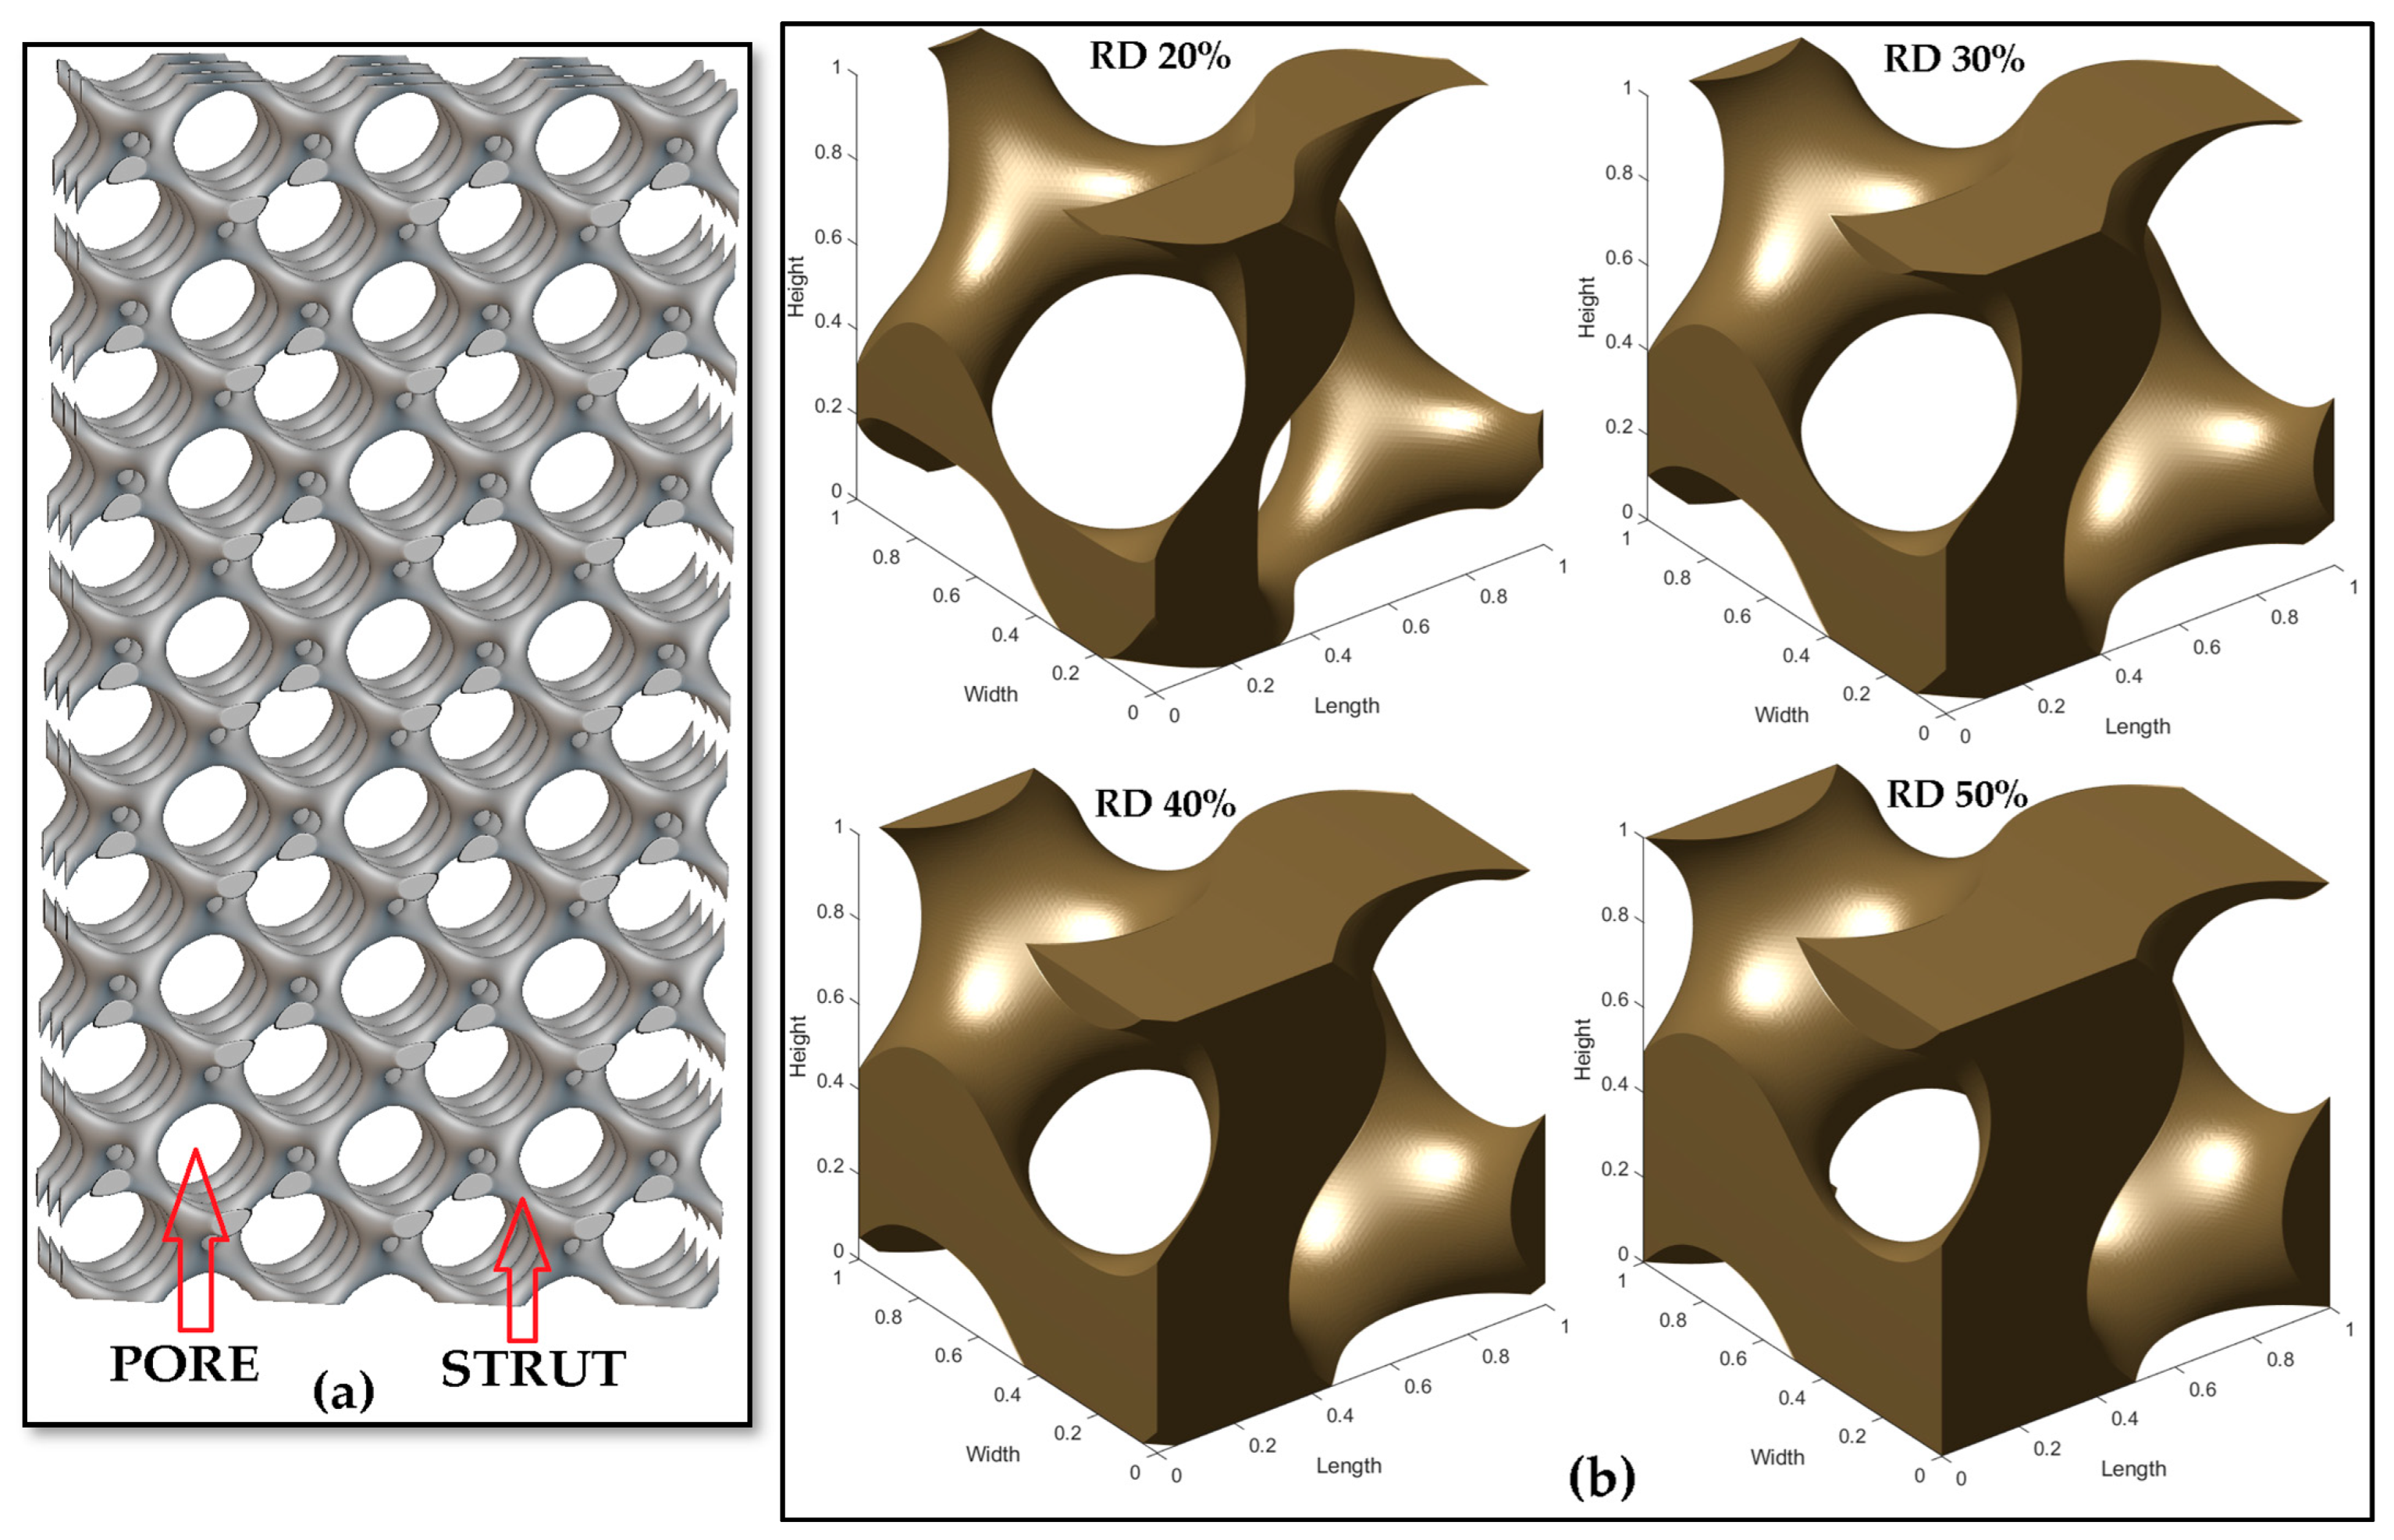
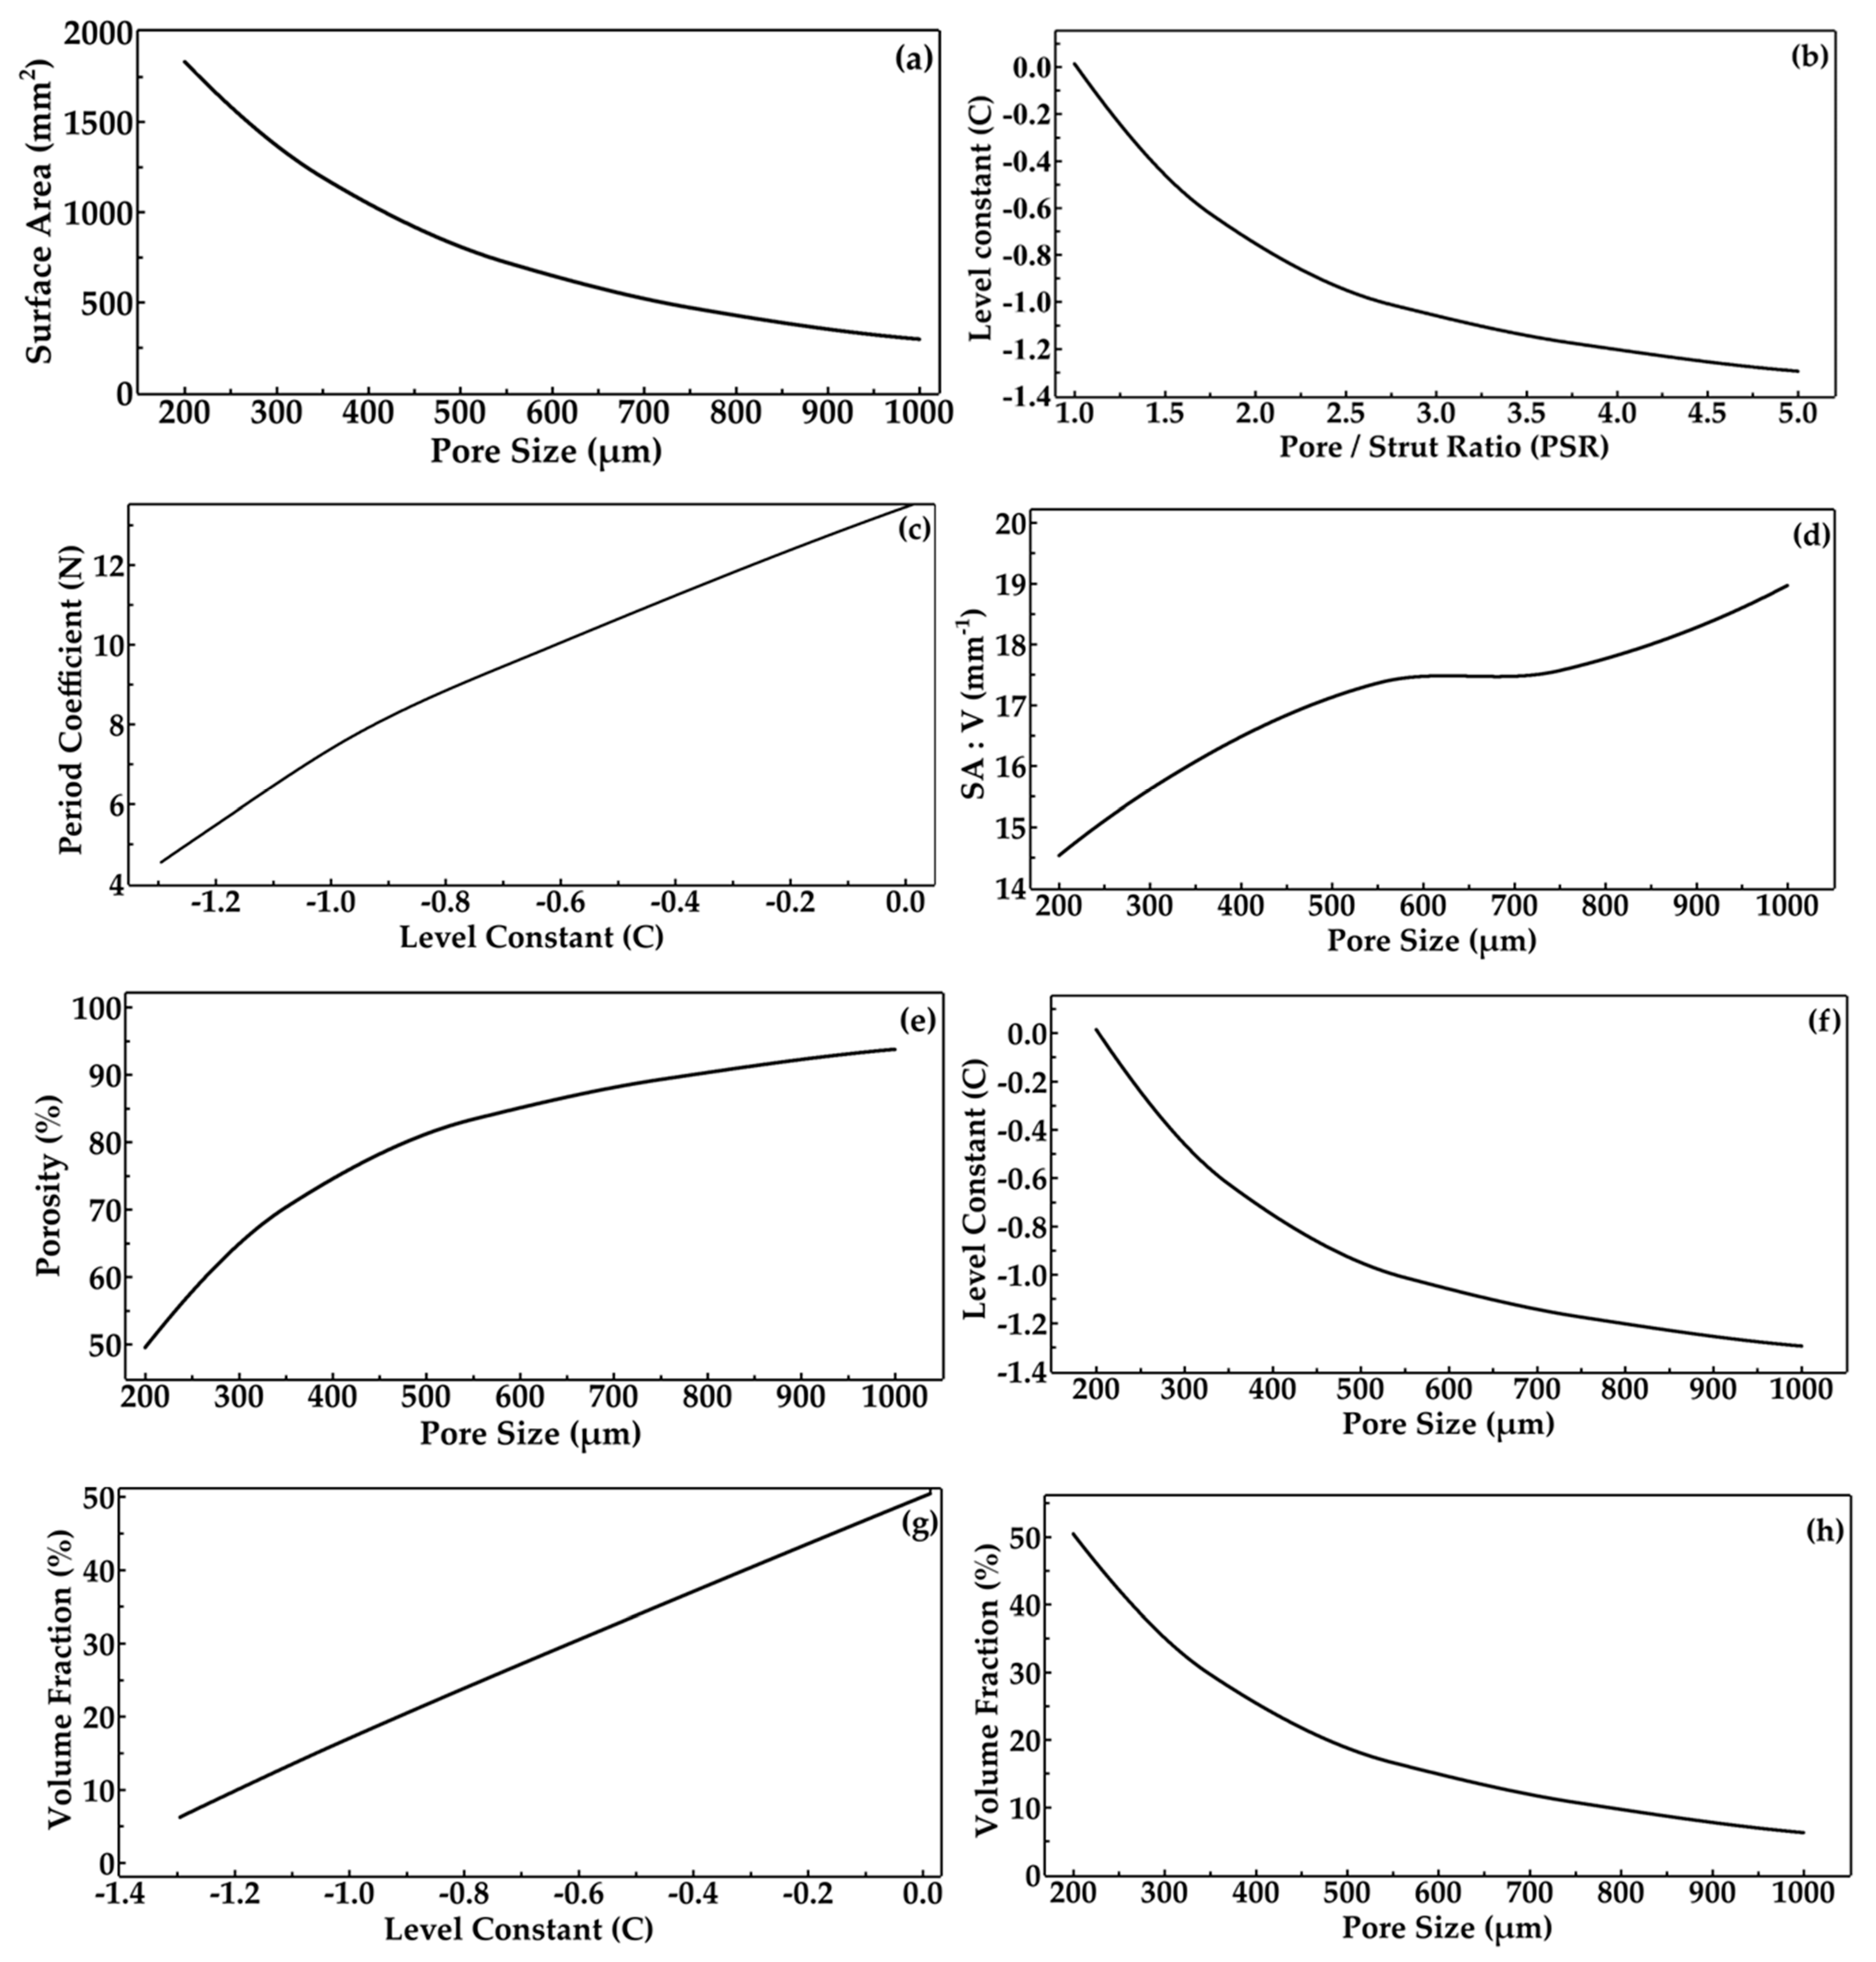
3.1. Design and Morphological Parameters
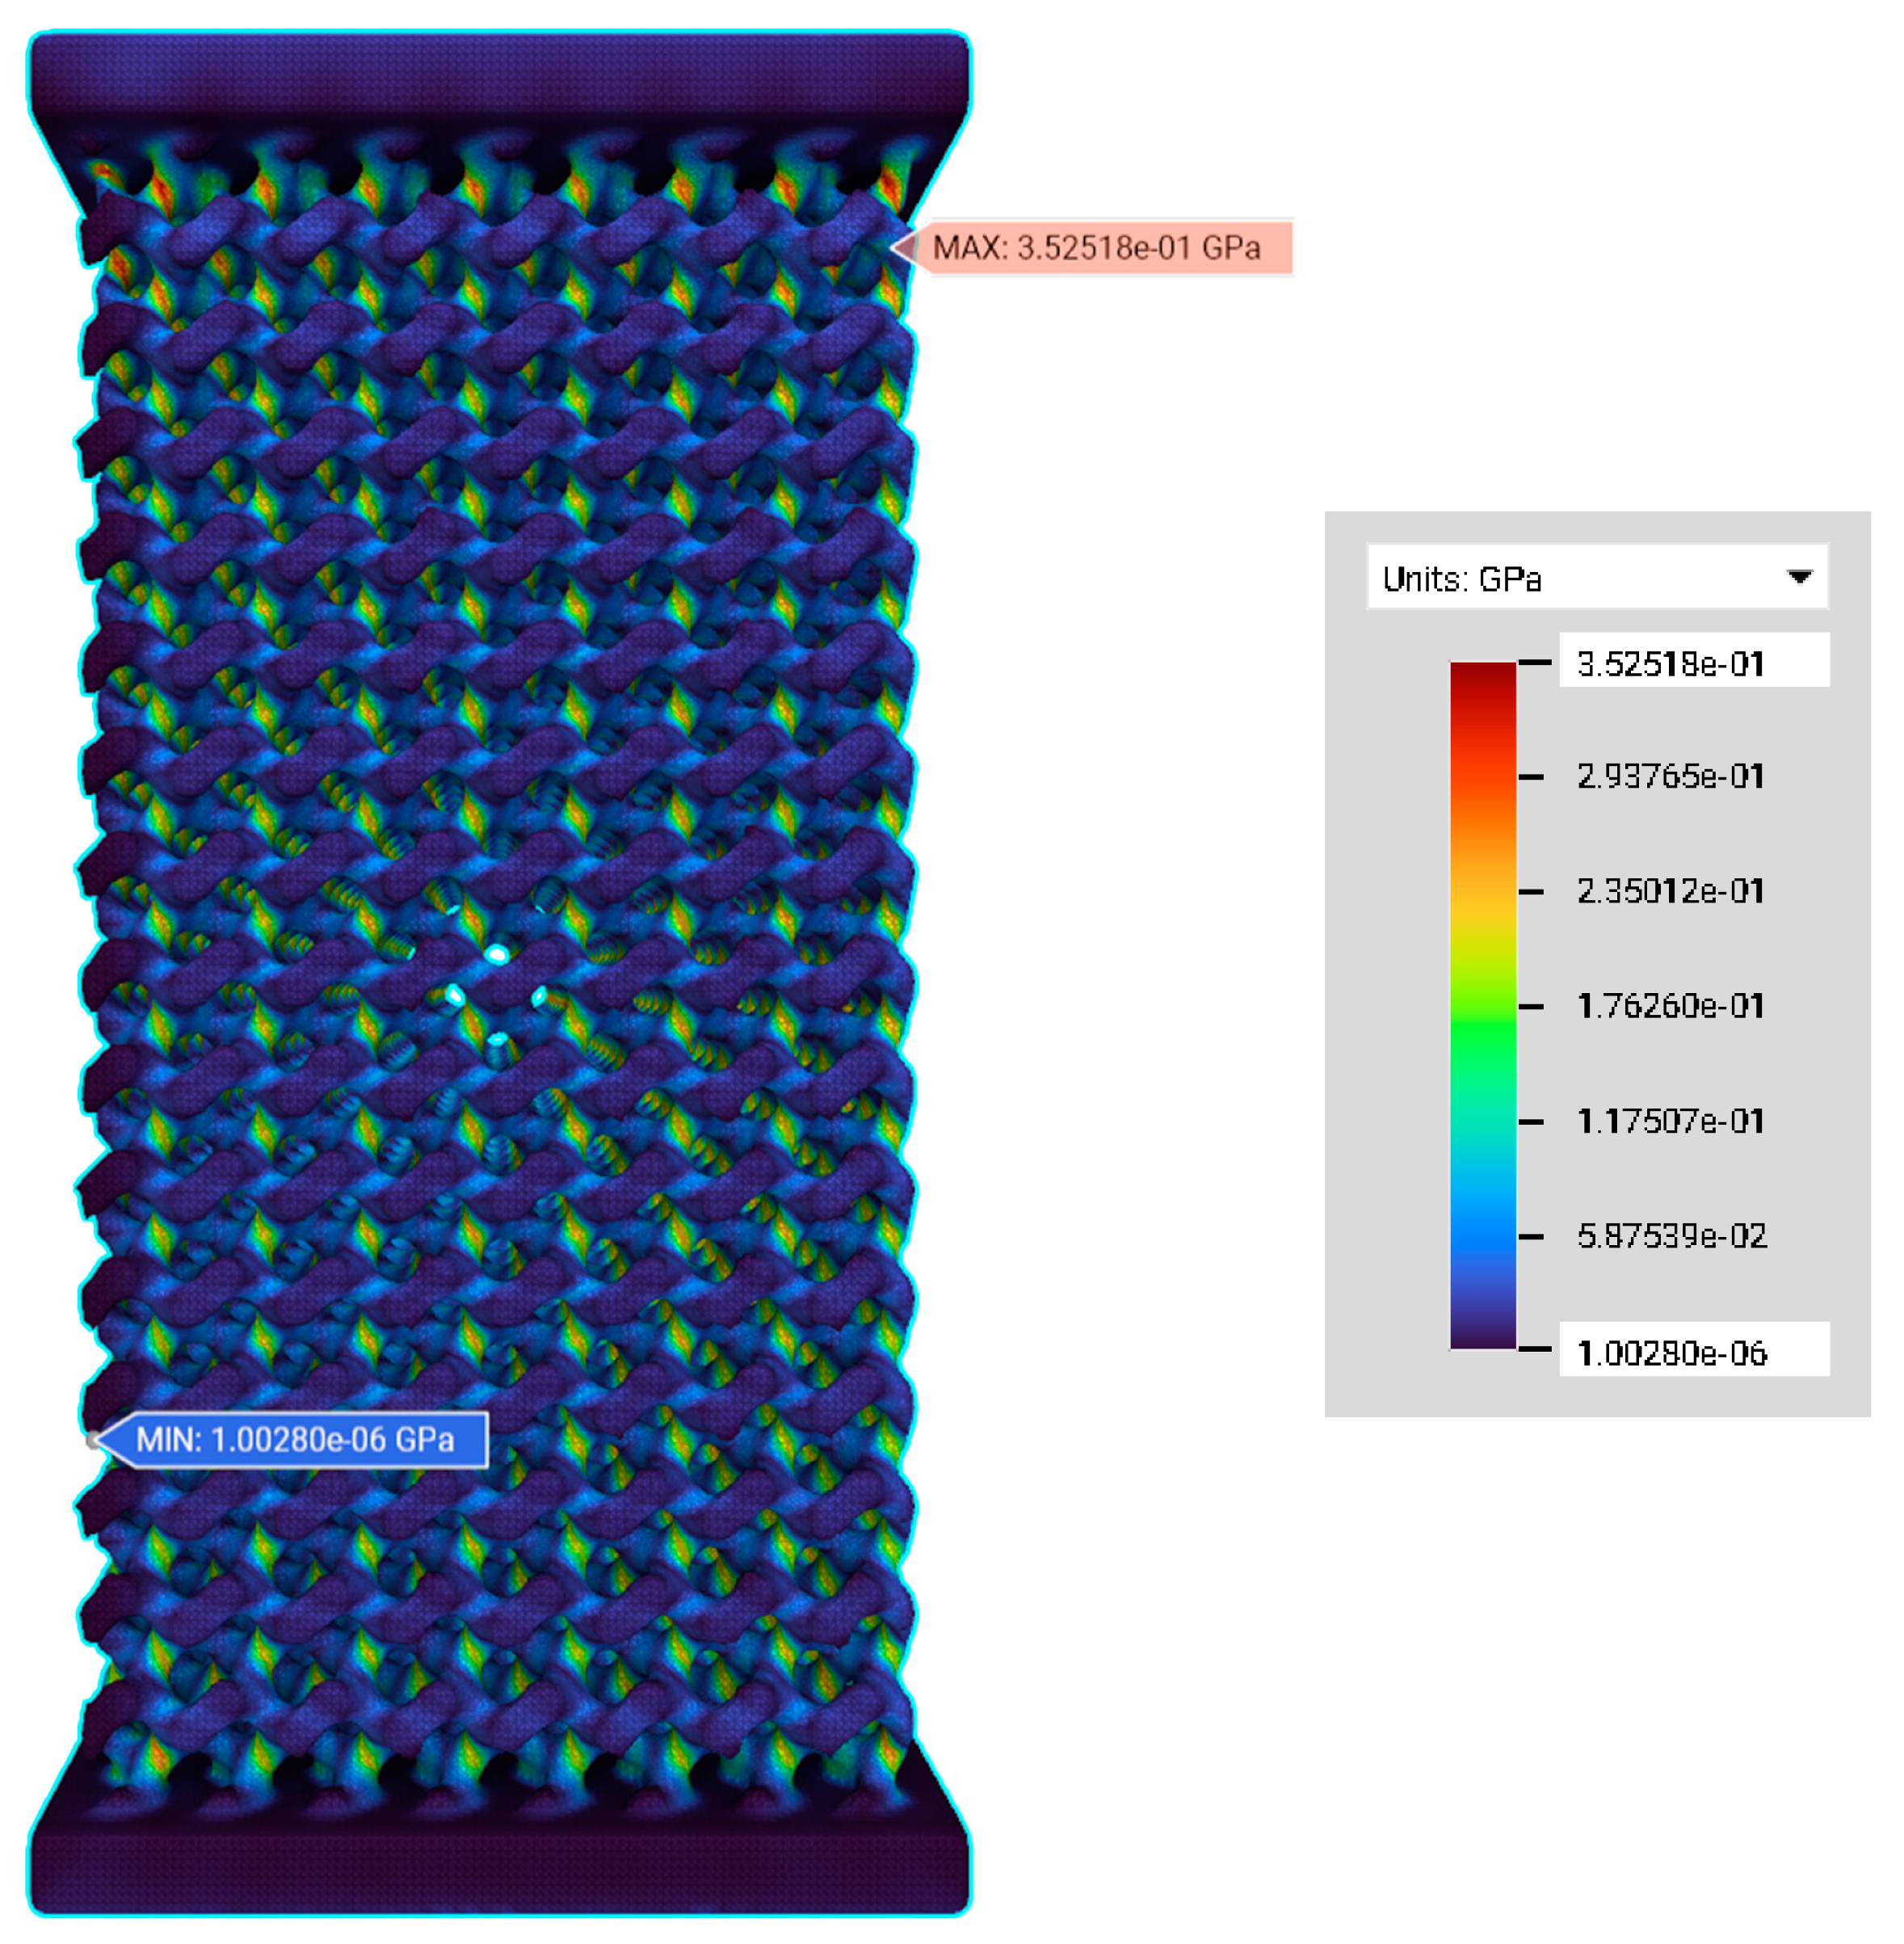
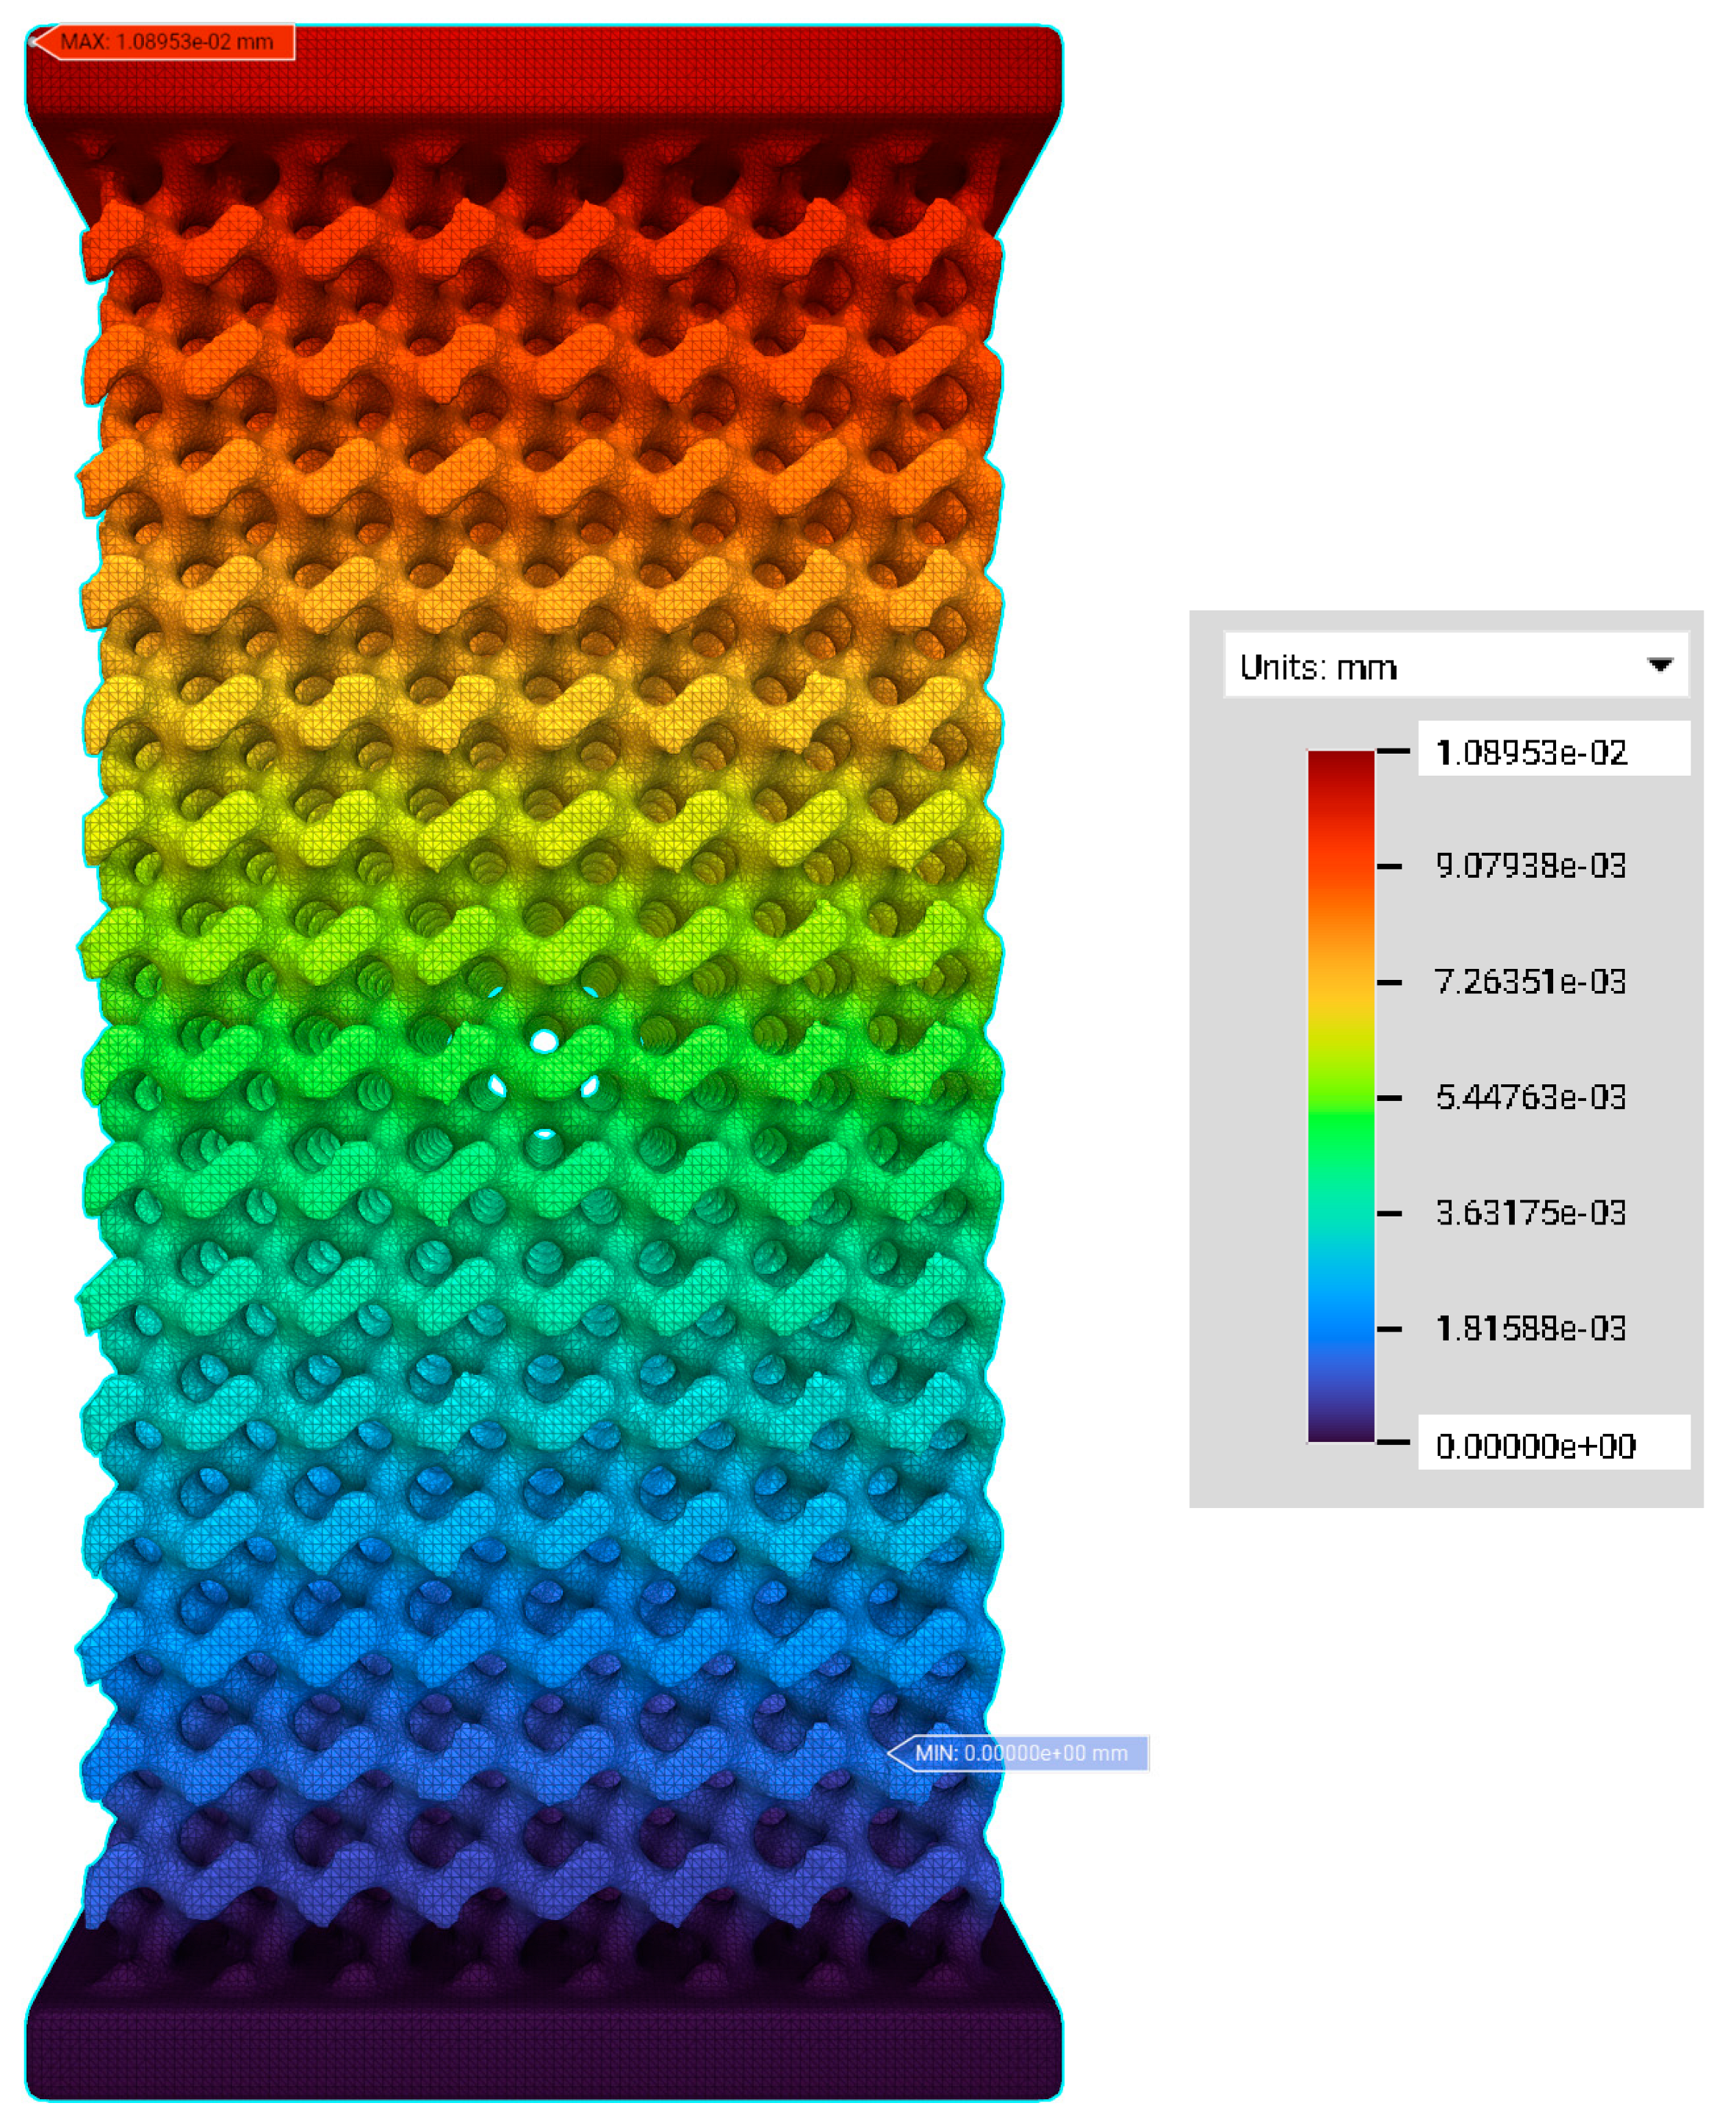
3.2. FE Simulation—Von Mises Stress and Deformation Prediction
3.3. Discussion
3.4. Limitations
4. Conclusions
- (i.)
- The advantage of having TPMS with the SDF method is that the end user can give the desired pore and strut sizes and porosity to achieve the required architecture of scaffolds for effective mechanical and degradation properties.
- (ii.)
- In the design of scaffolds, the level constant plays a vital role in tuning their interconnected architecture by deciding how many parts are to be solid (strut) or void (pores). This level constant influences the morphological parameters such as pore and strut sizes so that the pore–strut ratio decides the level constant variation, whereby a positive value results in more solid regions and a decrease in the level constant results in more solid regions and large pore sizes.
- (iii.)
- The porosity of scaffolds can be controlled by modifying the pore size of the scaffolds, keeping a constant strut size. Thus, these morphological properties affect the architecture of the lattice, which in turn alters the total mechanical properties.
- (iv.)
- The visual stress and deformation distributions are achieved using FE simulations, from which the values of mechanical responses are predicted.
- (v.)
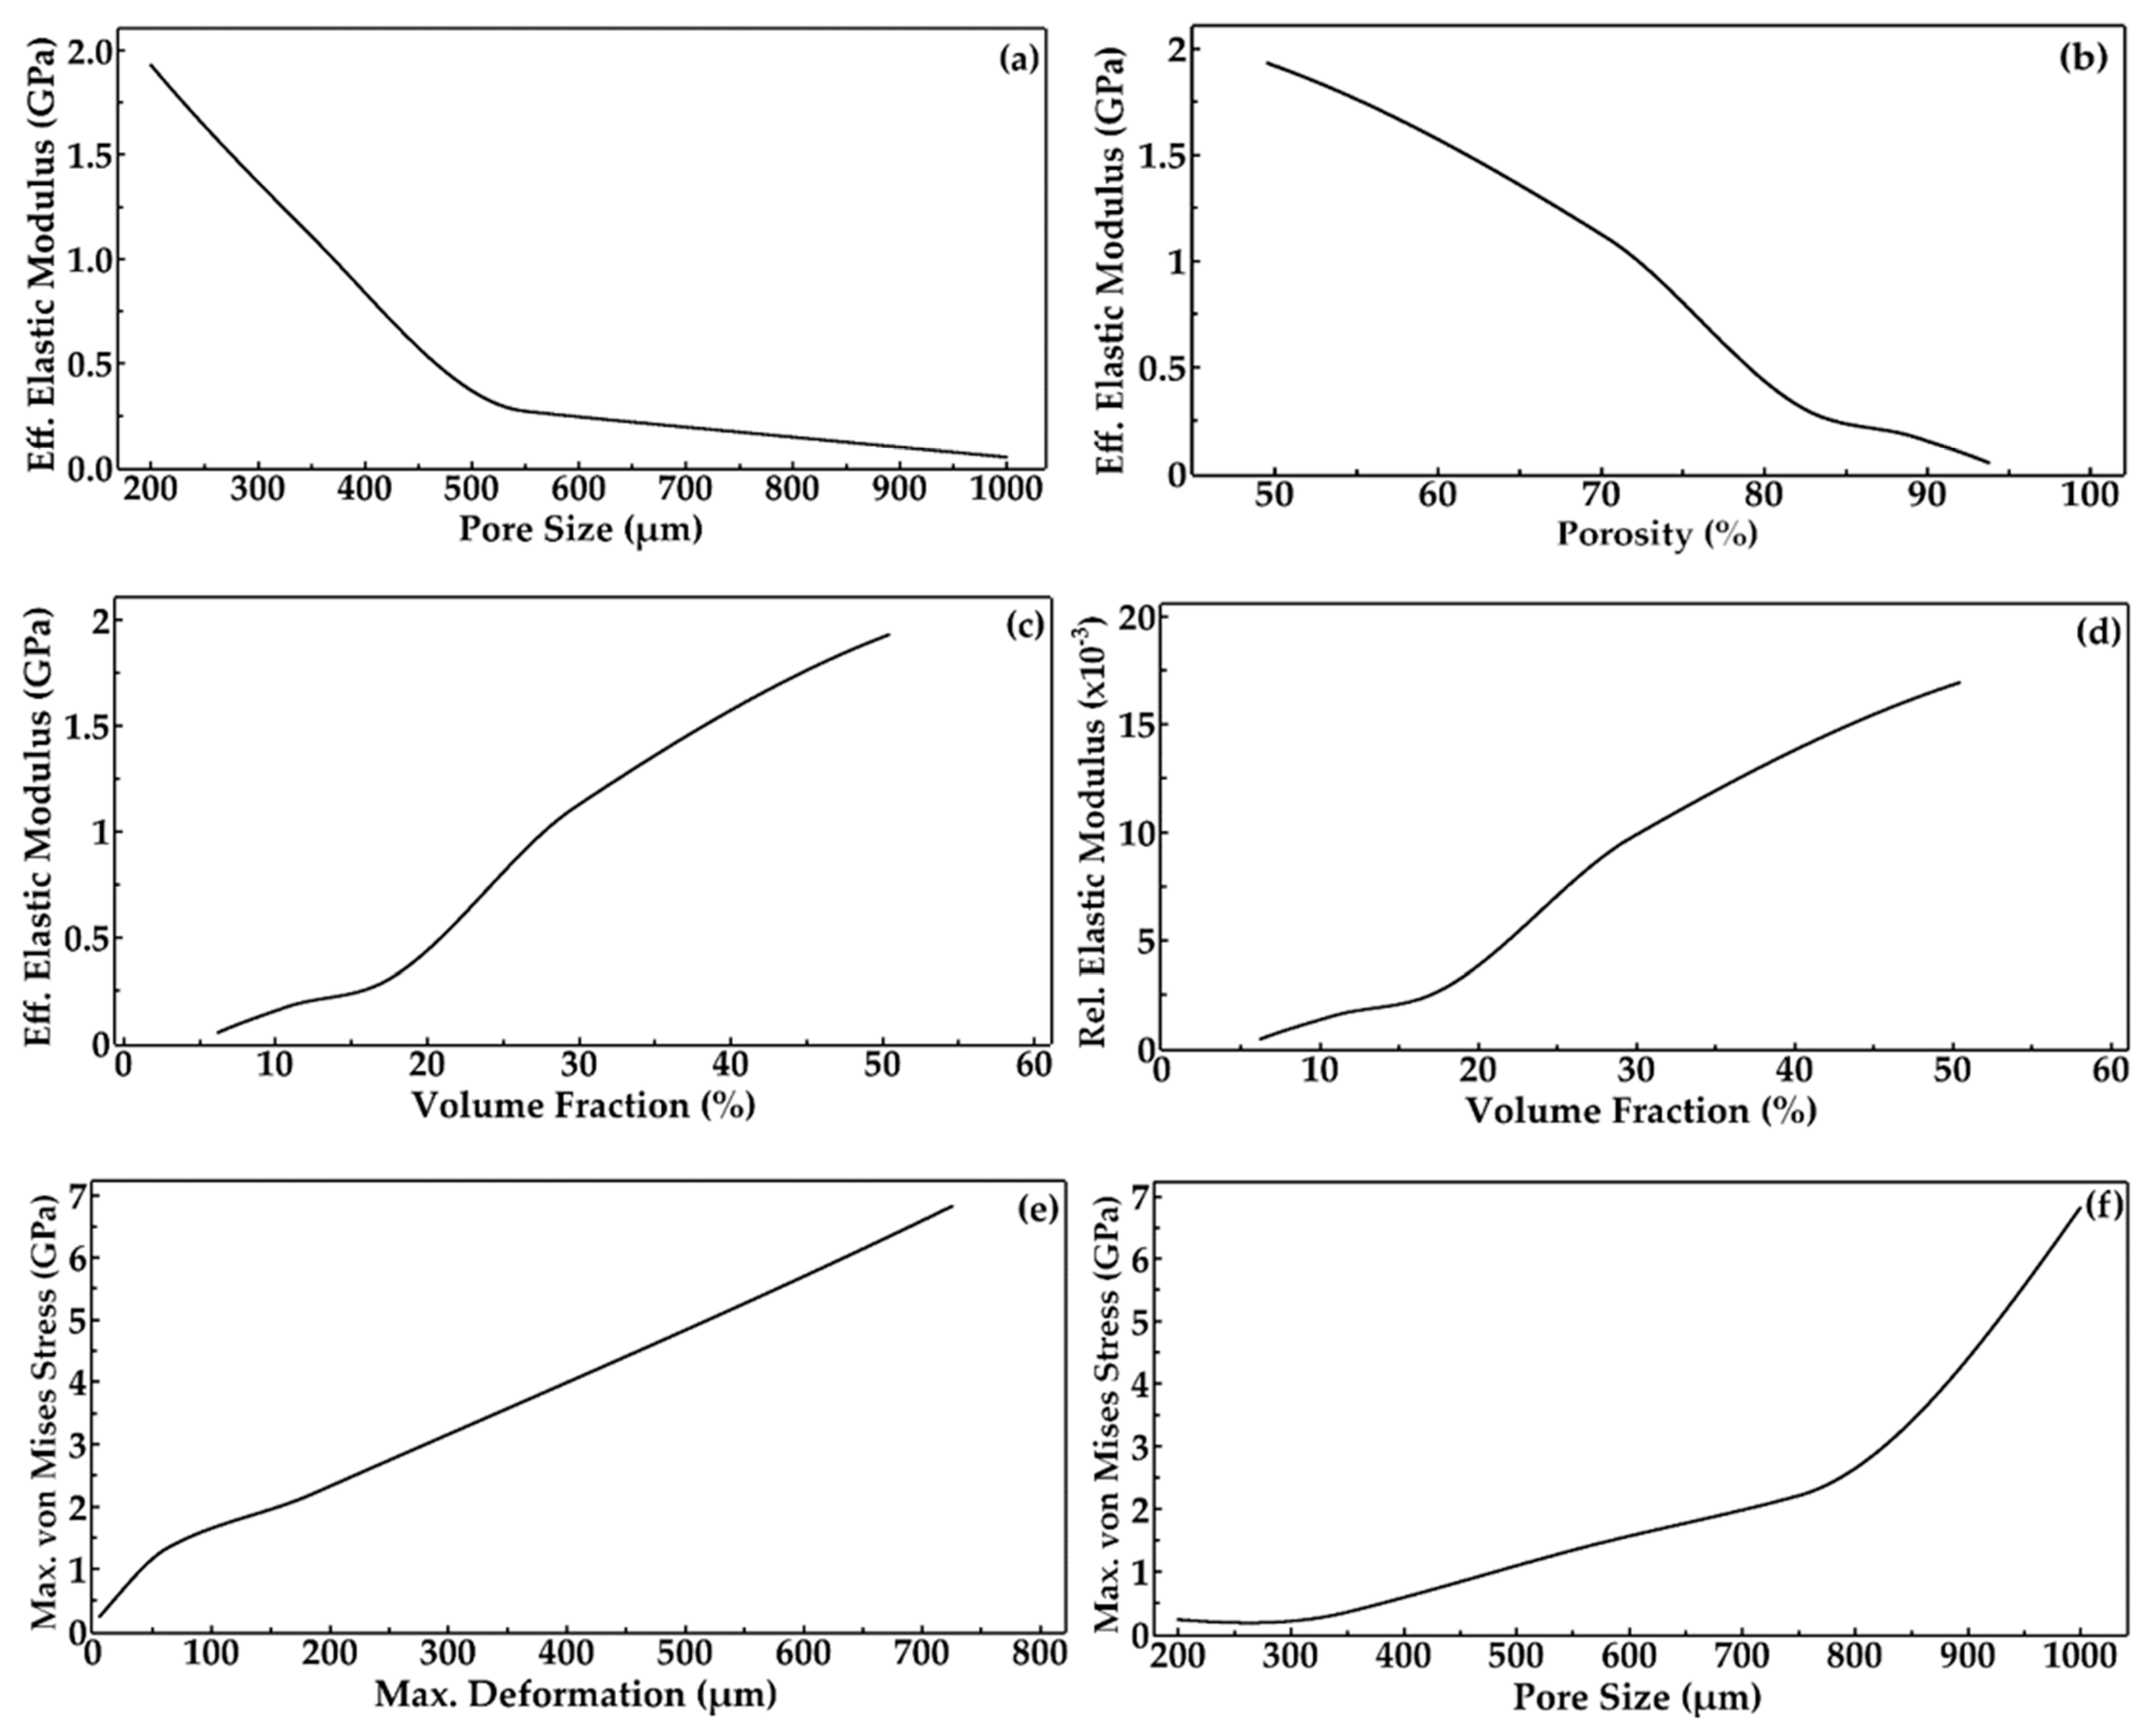
- The maximum von Mises stress and the maximum deformation increase due to decreased volume fraction and increased porosity.
- (vi.)
- The effective elastic modulus of the scaffolds decreases with increased pore size and porosity. It was also predicted that the effective elastic moduli were in the 0.05 to 1.93 GPa range, matching that of trabecular bone.
Supplementary Materials
Author Contributions
Funding
Data Availability Statement
Conflicts of Interest
Appendix A
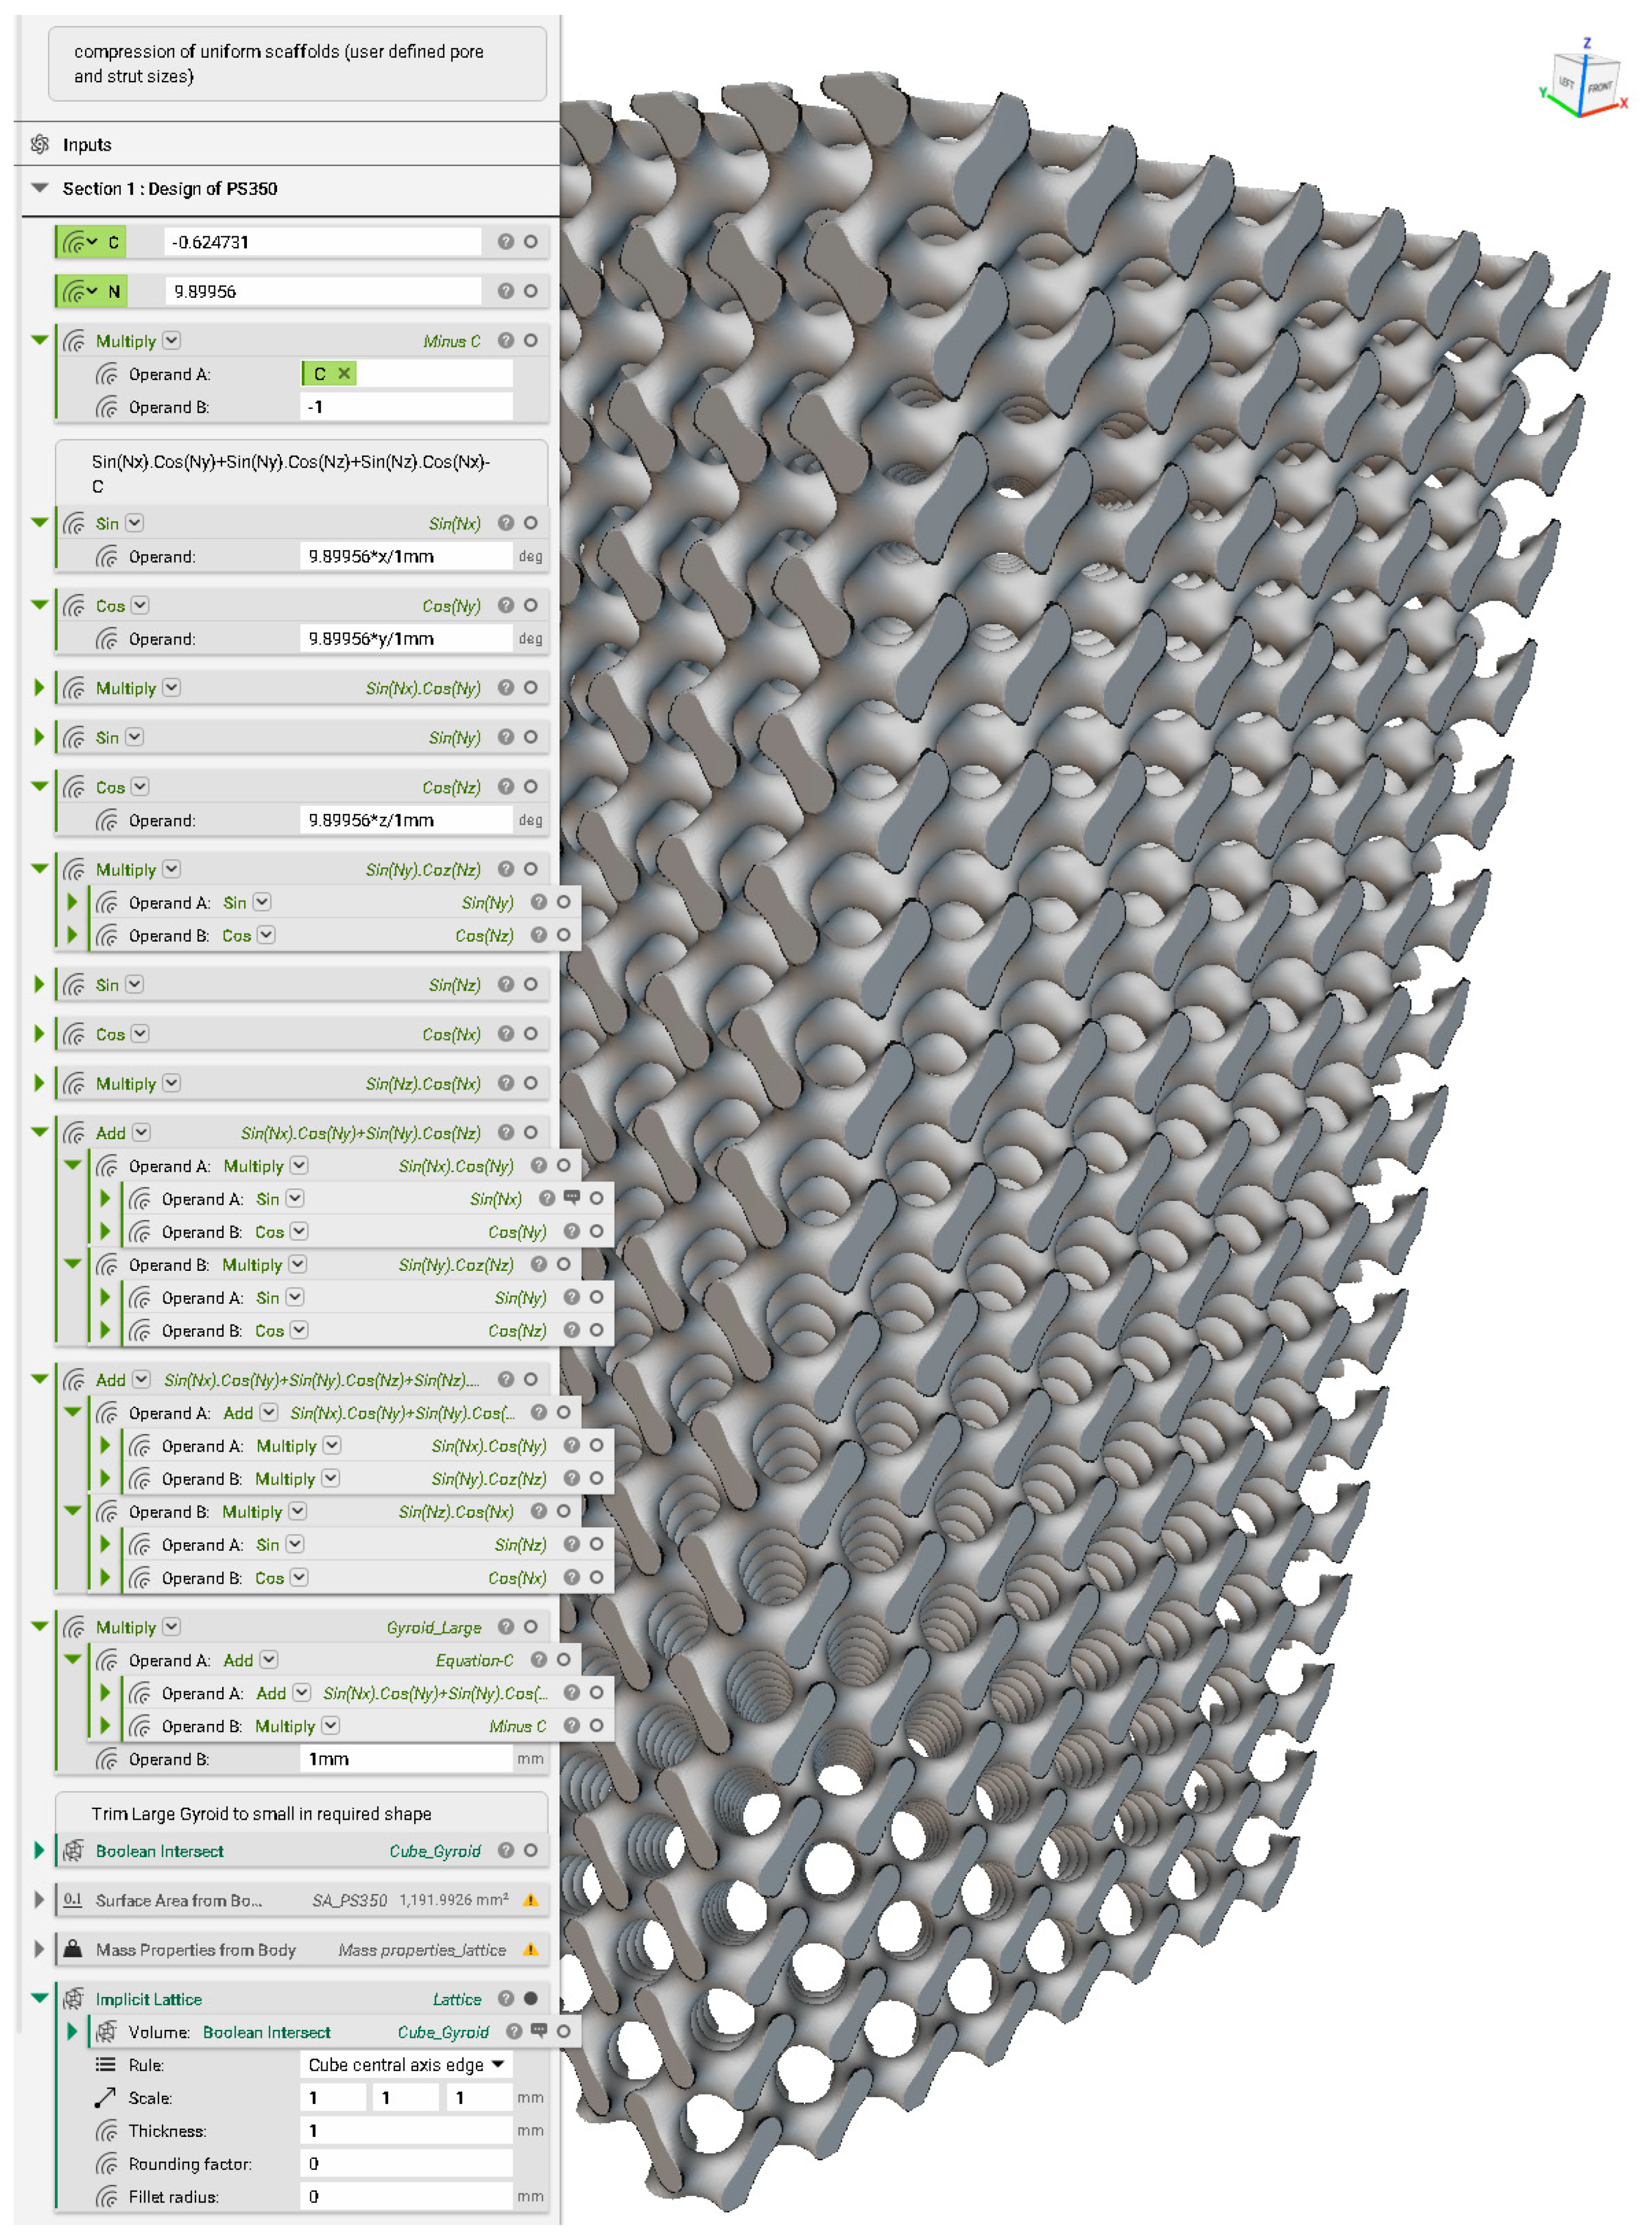
Appendix B. Creation of a Gyroid Scaffold in nTopology Software


Appendix C. Creation of FE Volume Mesh in nTopology

Appendix D. Static Structural Analysis
References
- Shegarfi, H.; Reikeras, O. Review Article: Bone Transplantation and Immune Response. J. Orthop. Surg. 2009, 17, 206–211. [Google Scholar] [CrossRef]
- Musthafa, H.S.N.; Velauthapillai, D.; Rahman, T.; Bjørkum, A.; Mustafa, K.; Walker, J. Design of 3D Porous Bone Scaffolds Architecture Based on Tpms and Signed Distance Field Method. In National Conference for Material Technology; NTNU: Trondheim, Norway, 2020; p. 25. [Google Scholar]
- Amini, A.R.; Laurencin, C.T.; Nukavarapu, S.P. Bone Tissue Engineering: Recent Advances and Challenges. Crit. Rev. Biomed. Eng. 2012, 40, 363–408. [Google Scholar] [CrossRef]
- Kafi, M.A.; Khudishta Aktar, M.; Phanny, Y.; Mitsugu, T. Adhesion, Proliferation and Differentiation of Human Mesenchymal Stem Cell on Chitosan/Collagen Composite Scaffold. J. Mater. Sci. Mater. Med. 2019, 30, 131. [Google Scholar] [CrossRef] [PubMed]
- Bose, S.; Vahabzadeh, S.; Bandyopadhyay, A. Bone Tissue Engineering Using 3D Printing. Mater. Today 2013, 16, 496–504. [Google Scholar] [CrossRef]
- Walker, J.M.; Bodamer, E.; Kleinfehn, A.; Luo, Y.; Becker, M.; Dean, D. Design and Mechanical Characterization of Solid and Highly Porous 3D Printed Poly(Propylene Fumarate) Scaffolds. Prog. Addit. Manuf. 2017, 2, 99–108. [Google Scholar] [CrossRef]
- van Bael, S.; Chai, Y.C.; Truscello, S.; Moesen, M.; Kerckhofs, G.; van Oosterwyck, H.; Kruth, J.P.; Schrooten, J. The Effect of Pore Geometry on the in Vitro Biological Behavior of Human Periosteum-Derived Cells Seeded on Selective Laser-Melted Ti6Al4V Bone Scaffolds. Acta Biomater. 2012, 8, 2824–2834. [Google Scholar] [CrossRef]
- Karageorgiou, V.; Kaplan, D. Porosity of 3D Biomaterial Scaffolds and Osteogenesis. Biomaterials 2005, 26, 5474–5491. [Google Scholar] [CrossRef]
- Murphy, C.M.; O’Brien, F.J. Understanding the Effect of Mean Pore Size on Cell Activity in Collagen-Glycosaminoglycan Scaffolds. Cell Adh. Migr. 2010, 4, 377–381. [Google Scholar] [CrossRef]
- Lu, T.; Li, Y.; Chen, T. Techniques for Fabrication and Construction of Three-Dimensional Scaffolds for Tissue Engineering. Int. J. Nanomed. 2013, 8, 337–350. [Google Scholar] [CrossRef]
- Feng, J.; Fu, J.; Yao, X.; He, Y. Triply Periodic Minimal Surface (TPMS) Porous Structures: From Multi-Scale Design, Precise Additive Manufacturing to Multidisciplinary Applications. Int. J. Extrem. Manuf. 2022, 4, 022001. [Google Scholar] [CrossRef]
- Rajagopalan, S.; Robb, R.A. Cosmology Inspired Design of Biomimetic Tissue Engineering Templates with Gaussian Random Fields. In Medical Image Computing and Computer-Assisted Intervention—MICCAI 2006; Larsen, R., Nielsen, M., Sporring, J., Eds.; Springer: Berlin/Heidelberg, 2006; pp. 544–552. [Google Scholar]
- Al-Ketan, O.; Abu Al-Rub, R.K. Multifunctional Mechanical Metamaterials Based on Triply Periodic Minimal Surface Lattices. Adv. Eng. Mater. 2019, 21, 1900524. [Google Scholar] [CrossRef]
- Yang, Y.; Xu, T.; Bei, H.-P.; Zhang, L.; Tang, C.-Y.; Zhang, M.; Xu, C.; Bian, L.; Yeung, K.W.-K.; Fuh, J.Y.H.; et al. Gaussian Curvature–Driven Direction of Cell Fate toward Osteogenesis with Triply Periodic Minimal Surface Scaffolds. Proc. Natl. Acad. Sci. USA 2022, 119, e2206684119. [Google Scholar] [CrossRef] [PubMed]
- Li, Y.; Li, J.; Jiang, S.; Zhong, C.; Zhao, C.; Jiao, Y.; Shen, J.; Chen, H.; Ye, M.; Zhou, J.; et al. The Design of Strut/TPMS-Based Pore Geometries in Bioceramic Scaffolds Guiding Osteogenesis and Angiogenesis in Bone Regeneration. Mater. Today Bio 2023, 20, 100667. [Google Scholar] [CrossRef] [PubMed]
- Yoo, D.J. Advanced Porous Scaffold Design Using Multi-Void Triply Periodic Minimal Surface Models with High Surface Area to Volume Ratios. Int. J. Precis. Eng. Manuf. 2014, 15, 1657–1666. [Google Scholar] [CrossRef]
- Yan, C.; Hao, L.; Hussein, A.; Young, P. Ti-6Al-4V Triply Periodic Minimal Surface Structures for Bone Implants Fabricated via Selective Laser Melting. J. Mech. Behav. Biomed. Mater. 2015, 51, 61–73. [Google Scholar] [CrossRef]
- Yoo, D.J. Porous Scaffold Design Using the Distance Field and Triply Periodic Minimal Surface Models. Biomaterials 2011, 32, 7741–7754. [Google Scholar] [CrossRef] [PubMed]
- Yoo, D.J. Computer-Aided Porous Scaffold Design for Tissue Engineering Using Triply Periodic Minimal Surfaces. Int. J. Precis. Eng. Manuf. 2011, 12, 61–71. [Google Scholar] [CrossRef]
- Yoo, D. Heterogeneous Minimal Surface Porous Scaffold Design Using the Distance Field and Radial Basis Functions. Med. Eng. Phys. 2012, 34, 625–639. [Google Scholar] [CrossRef]
- Lee, J.-W.; Oh, S.-H.; Jeon, E.; Kim, J.; Park, K. Local Morphology Change of Tpms Structure for the Design of Functionally Graded Porous Media. SSRN 2022, 224, 4229842. [Google Scholar] [CrossRef]
- Yánez, A.; Cuadrado, A.; Martel, O.; Afonso, H.; Monopoli, D. Gyroid Porous Titanium Structures: A Versatile Solution to Be Used as Scaffolds in Bone Defect Reconstruction. Mater. Des. 2018, 140, 21–29. [Google Scholar] [CrossRef]
- What is Finite Element Analysis? Why to do FEA? Available online: https://www.graspengineering.com/hello-world-2/ (accessed on 24 August 2022).
- Mehboob, H.; Ahmad, F.; Tarlochan, F.; Mehboob, A.; Chang, S.H. A Comprehensive Analysis of Bio-Inspired Design of Femoral Stem on Primary and Secondary Stabilities Using Mechanoregulatory Algorithm. Biomech. Model. Mechanobiol. 2020, 19, 2213–2226. [Google Scholar] [CrossRef] [PubMed]
- Du, Y.; Liang, H.; Xie, D.; Mao, N.; Zhao, J.; Tian, Z.; Wang, C.; Shen, L. Finite Element Analysis of Mechanical Behavior, Permeability of Irregular Porous Scaffolds and Lattice-Based Porous Scaffolds. Mater. Res. Express 2019, 6, 105407. [Google Scholar] [CrossRef]
- Lacroix, D.; Planell, J.A.; Prendergast, P.J. Computer-Aided Design and Finite-Element Modelling of Biomaterial Scaffolds for Bone Tissue Engineering. Philos. Trans. R. Soc. A Math. Phys. Eng. Sci. 2009, 367, 1993–2009. [Google Scholar] [CrossRef] [PubMed]
- Eshraghi, S.; Das, S. Micromechanical Finite-Element Modeling and Experimental Characterization of the Compressive Mechanical Properties of Polycaprolactone-Hydroxyapatite Composite Scaffolds Prepared by Selective Laser Sintering for Bone Tissue Engineering. Acta Biomater. 2012, 8, 3138–3143. [Google Scholar] [CrossRef]
- Hawker, M.; Wang, F.; Sala, R.; Regondi, S.; Pugliese, R. Design Data and Finite Element Analysis of 3D Printed Poly(ε-Caprolactone)-Based Lattice Scaffolds: Influence of Type of Unit Cell, Porosity, and Nozzle Diameter on the Mechanical Behavior. Eng 2021, 3, 9–23. [Google Scholar] [CrossRef]
- Schipani, R.; Nolan, D.R.; Lally, C.; Kelly, D.J. Integrating Finite Element Modelling and 3D Printing to Engineer Biomimetic Polymeric Scaffolds for Tissue Engineering. Connect Tissue Res. 2020, 61, 174–189. [Google Scholar] [CrossRef]
- Vozzi, G.; Koc, B.; Moroni, L.; Hendrikson, W.J.; van Blitterswijk, C.A.; Rouwkema, J.; Moroni, L. The Use of Finite Element Analyses to Design and Fabricate Three-Dimensional Scaffolds for Skeletal Tissue Engineering. Front. Bioeng. Biotechnol. 2017, 5, 30. [Google Scholar] [CrossRef]
- Soro, N.; Brassart, L.; Chen, Y.; Veidt, M.; Attar, H.; Dargusch, M.S. Finite Element Analysis of Porous Commercially Pure Titanium for Biomedical Implant Application. Mater. Sci. Eng. A 2018, 725, 43–50. [Google Scholar] [CrossRef]
- Olivares, A.L.; Marsal, È.; Planell, J.A.; Lacroix, D. Finite Element Study of Scaffold Architecture Design and Culture Conditions for Tissue Engineering. Biomaterials 2009, 30, 6142–6149. [Google Scholar] [CrossRef]
- Sun, K.; Li, R.; Li, H.; Fan, M.; Li, H. Analysis and Demonstration of a Scaffold Finite Element Model for Cartilage Tissue Engineering. ACS Omega 2020, 5, 32411–32419. [Google Scholar] [CrossRef]
- Patel, R.; Lu, M.; Diermann, S.H.; Wu, A.; Pettit, A.; Huang, H. Deformation Behavior of Porous PHBV Scaffold in Compression: A Finite Element Analysis Study. J. Mech. Behav. Biomed. Mater. 2019, 96, 1–8. [Google Scholar] [CrossRef] [PubMed]
- Bin Noordin, M.A.; Saad, A.P.B.; Ngadiman, N.H.A.; Mustafa, N.S.; Yusof, N.B.; Ma’aram, A. Finite Element Analysis of Porosity Effects on Mechanical Properties for Tissue Engineering Scaffold. Biointerface Res. Appl. Chem. 2021, 11, 8836–8843. [Google Scholar]
- Kakarla, A.B.; Kong, I.; Guha Nukala, S.; Kong, W. Mechanical Behaviour Evaluation of Porous Scaffold for Tissue-Engineering Applications Using Finite Element Analysis. J. Compos. Sci. 2022, 6, 46. [Google Scholar] [CrossRef]
- Seharing, A.; Azman, A.H.; Abdullah, S. Comparative Analysis between the Mechanical Behaviour of Gradient and Uniform Lattice Structures Using Finite Element Analysis. J. Eng. Sci. Technol. 2019, 14, 2779–2791. [Google Scholar]
- Sahai, N.; Gogoi, M. Computer Aided Designing and Finite Element Analysis for Development of Porous 3D Tissue Scaffold—A Review. Int. J. Biomed. Eng. Technol. 2020, 33, 174–197. [Google Scholar] [CrossRef]
- Soufivand, A.A.; Abolfathi, N.; Hashemi, S.A.; Lee, S.J. Prediction of Mechanical Behavior of 3D Bioprinted Tissue-Engineered Scaffolds Using Finite Element Method (FEM) Analysis. Addit. Manuf. 2020, 33, 101181. [Google Scholar] [CrossRef]
- Quevedo González, F.J.; Nuño, N. Finite Element Modelling Approaches for Well-Ordered Porous Metallic Materials for Orthopaedic Applications: Cost Effectiveness and Geometrical Considerations. Comput. Methods Biomech. Biomed. Engin. 2016, 19, 845–854. [Google Scholar] [CrossRef]
- Hashemi, S.A.; Esmaeili, S.; Ghadiri Nejad, M.; Saber Samandari, S.; Sheikhbahaei, E.; Kordjamshidi, A.; Khandan, A. Micro-Finite Element Model to Investigate the Mechanical Stimuli in Scaffolds Fabricated via Space Holder Technique for Cancellous Bone. Int. J. Adv. Des. Manuf. Technol. 2020, 13, 51–58. [Google Scholar]
- Bagde, A.D.; Kuthe, A.M.; Nagdeve, S.R.; Dahake, S.W.; Sapkal, P.S.; Daronde, S.B.; Lande, N.H.; Sarode, B.D. Geometric Modeling and Finite Element Simulation for Architecture Design of 3D Printed Bio-Ceramic Scaffold Used in Bone Tissue Engineering. J. Indian Inst. Sci. 2019, 99, 361–374. [Google Scholar] [CrossRef]
- Baggi, L.; Cappelloni, I.; di Girolamo, M.; Maceri, F.; Vairo, G. The Influence of Implant Diameter and Length on Stress Distribution of Osseointegrated Implants Related to Crestal Bone Geometry: A Three-Dimensional Finite Element Analysis. J. Prosthet. Dent. 2008, 100, 422–431. [Google Scholar] [CrossRef]
- Idhammad, A.; Abdali, A.; Alaa, N. Computational Simulation of the Bone Remodeling Using the Finite Element Method: An Elastic-Damage Theory for Small Displacements. Theor. Biol. Med. Model. 2013, 10, 32. [Google Scholar] [CrossRef] [PubMed]
- Daver, A.L.I. Mimicking Bone Anisotropic Structure with Modified Gyroid Scaffolds; A Finite Element Analysis. Politek. Derg. 2021, 24, 1637–1646. [Google Scholar]
- Alkaios Bournias Varotsis. Meshing in FEA, CFD & Manufacturing. Available online: https://ntopology.com/blog/meshing-in-fea-cfd-manufacturing/ (accessed on 5 March 2023).
- Finite Element Analysis Convergence and Mesh Independence. Available online: https://www.xceed-eng.com/finite-element-analysis-convergence-and-mesh-independence/ (accessed on 25 August 2023).
- ProtoXYZ. Titanium Grade 5 (Ti6Al4V). Available online: https://protoxyz.com/materials/Metal/Titanium_Grade_5_(Ti6Al4V) (accessed on 27 January 2023).
- Blake Johnson. What are the Options for Simulating Lattices? Available online: https://support.ntopology.com/hc/en-us/articles/360051081633 (accessed on 5 March 2023).
- Zhang, X.Y.; Fang, G.; Xing, L.L.; Liu, W.; Zhou, J. Effect of Porosity Variation Strategy on the Performance of Functionally Graded Ti-6Al-4V Scaffolds for Bone Tissue Engineering. Mater. Des. 2018, 157, 523–538. [Google Scholar] [CrossRef]
- Medori, E. Mechanical Behaviour of Fdm Printed Latice Structures with Potential for Biomedical Applications. Master’s Thesis, Norwegian University of Science and Technology, Trondheim, Norway, 2021. [Google Scholar]
- Ma, S.; Tang, Q.; Han, X.; Feng, Q.; Song, J.; Setchi, R.; Liu, Y.; Liu, Y.; Goulas, A.; Engstrøm, D.S.; et al. Manufacturability, Mechanical Properties, Mass-Transport Properties and Biocompatibility of Triply Periodic Minimal Surface (TPMS) Porous Scaffolds Fabricated by Selective Laser Melting. Mater. Des. 2020, 195, 109034. [Google Scholar] [CrossRef]
- Gibson, I.J.; Ashby, M.F. The Mechanics of Three-Dimensional Cellular Materials. Proc. R. Soc. Lond. A Math. Phys. Sci. 1982, 382, 43–59. [Google Scholar] [CrossRef]
- Zhang, J.; Chen, X.; Sun, Y.; Yang, J.; Chen, R.; Xiong, Y.; Hou, W.; Bai, L. Design of a Biomimetic Graded TPMS Scaffold with Quantitatively Adjustable Pore Size. Mater. Des. 2022, 218, 110665. [Google Scholar] [CrossRef]
- Li, J.; Chen, M.; Fan, X.; Zhou, H. Recent Advances in Bioprinting Techniques: Approaches, Applications and Future Prospects. J. Transl. Med. 2016, 14, 271. [Google Scholar] [CrossRef]
- Barba, D.; Alabort, E.; Reed, R.C. Synthetic Bone: Design by Additive Manufacturing. Acta Biomater. 2019, 97, 637–656. [Google Scholar] [CrossRef]
- Naghavi, S.A.; Tamaddon, M.; Marghoub, A.; Wang, K.; Bahrami Babam-Iri, B.; Hazeli, K.; Xu, W.; Lu, X.; Sun, C.; Wang, L.; et al. Mechanical Characterisation and Numerical Modelling of TPMS-Based Gyroid and Diamond Ti6Al4V Scaffolds for Bone Implants: An Integrated Approach for Translational Consideration. Bioengineering 2022, 2022, 504. [Google Scholar] [CrossRef]
- Verma, R.; Kumar, J.; Singh, N.K.; Rai, S.K.; Kumta, S.; Sehgal, S.; Saxena, K. Low Elastic Modulus and Highly Porous Triply Periodic Minimal Surfaces Architectured Implant for Orthopedic Applications. Proc. Inst. Mech. Eng. Part E J. Process Mech. Eng. 2022, 09544089221111258. [Google Scholar] [CrossRef]
- Verma, R.; Kumar, J.; Singh, N.K.; Rai, S.K.; Saxena, K.K.; Xu, J.; Verma, R.; Kumar, J.; Singh, N.K.; Rai, S.K.; et al. Design and Analysis of Biomedical Scaffolds Using TPMS-Based Porous Structures Inspired from Additive Manufacturing. Coatings 2022, 12, 839. [Google Scholar] [CrossRef]
- Peng, X.; Huang, Q.; Zhang, Y.; Zhang, X.; Shen, T.; Shu, H.; Jin, Z. Elastic Response of Anisotropic Gyroid Cellular Structures under Compression: Parametric Analysis. Mater. Des. 2021, 205, 109706. [Google Scholar] [CrossRef]
- Zaharin, H.A.; Abdul Rani, A.M.; Azam, F.I.; Ginta, T.L.; Sallih, N.; Ahmad, A.; Yunus, N.A.; Zulkifli, T.Z.A. Effect of Unit Cell Type and Pore Size on Porosity and Mechanical Behavior of Additively Manufactured Ti6Al4V Scaffolds. Materials 2018, 11, 2402. [Google Scholar] [CrossRef] [PubMed]
- Nagamoto, H. Yamaha Pairing Topology Optimization with Graded Lattices. Available online: https://ntopology.com/blog/user-spotlight-yamaha-pairing-topology-optimization-with-graded-lattices/ (accessed on 10 March 2023).


| Label | Element Count | Node Count | Edge Count | Vertex Count |
|---|---|---|---|---|
| PS200 | 7,052,136 | 11,570,625 | 9,867,119 | 1,703,506 |
| PS350 | 8,386,979 | 12,702,213 | 10,945,522 | 1,756,691 |
| PS550 | 2,576,201 | 4,442,317 | 3,753,745 | 688,572 |
| PS750 | 1,794,654 | 3,107,398 | 2,623,529 | 483,869 |
| PS1000 | 1,155,452 | 2,032,425 | 1,711,706 | 320,719 |
| Material | Young’s Modulus (E) | Poisson Ratio (ν) | Yield Strength |
|---|---|---|---|
| Titanium Grade 5 (Ti-6Al-4V) | 114 GPa | 0.34 | 883 MPa |
| Label | PS (µm) | SS (µm) | C | N | Surface Area of Scaffold (mm2) | Volume of Scaffold (mm3) | Porosity (%) | Volume Fraction (%) | SA:V (mm−1) |
|---|---|---|---|---|---|---|---|---|---|
| PS200 | 200 | 200 | 0.01 | 13.52 | 1831.62 | 126.09 | 49.56 | 50.44 | 14.53 |
| PS350 | 350 | 200 | −0.62 | 9.90 | 1191.99 | 74.18 | 70.33 | 29.67 | 16.07 |
| PS550 | 550 | 200 | −1.01 | 7.27 | 720.39 | 41.50 | 83.40 | 16.60 | 17.36 |
| PS750 | 750 | 200 | −1.18 | 5.72 | 469.93 | 26.75 | 89.30 | 10.70 | 17.57 |
| PS1000 | 1000 | 200 | −1.30 | 4.54 | 295.11 | 15.56 | 93.78 | 6.22 | 18.97 |
| Pore size ↓, Relative density of the lattice ↑, Volume Fraction ↑ Pore size ↑, Relative density of the lattice ↓, Volume Fraction ↓ |
| Label | Reactive Force (×10−2 N) | Max. Deformation (µm) | Max. Von Mises Stress (GPa) | Strain (µm/m) | Stress (N/m2) | Effective Elastic Modulus (GPa) | Relative Elastic Modulus (×10−3) |
|---|---|---|---|---|---|---|---|
| PS200 | 2.69 | 5.58 | 0.23 | 558.00 | 1075.40 | 1.93 | 16.92 |
| PS350 | 3.03 | 10.90 | 0.35 | 1089.53 | 1212.00 | 1.11 | 9.74 |
| PS550 | 4.35 | 63.35 | 1.34 | 6335.41 | 1740.00 | 0.27 | 2.37 |
| PS750 | 7.91 | 186.34 | 2.21 | 18,633.80 | 3164.00 | 0.17 | 1.49 |
| PS1000 | 9.40 | 725.57 | 6.82 | 72,557.00 | 3760.00 | 0.05 | 0.44 |
Disclaimer/Publisher’s Note: The statements, opinions and data contained in all publications are solely those of the individual author(s) and contributor(s) and not of MDPI and/or the editor(s). MDPI and/or the editor(s) disclaim responsibility for any injury to people or property resulting from any ideas, methods, instructions or products referred to in the content. |
© 2023 by the authors. Licensee MDPI, Basel, Switzerland. This article is an open access article distributed under the terms and conditions of the Creative Commons Attribution (CC BY) license (https://creativecommons.org/licenses/by/4.0/).
Share and Cite
N. Musthafa, H.-S.; Walker, J.; Rahman, T.; Bjørkum, A.; Mustafa, K.; Velauthapillai, D. In-Silico Prediction of Mechanical Behaviour of Uniform Gyroid Scaffolds Affected by Its Design Parameters for Bone Tissue Engineering Applications. Computation 2023, 11, 181. https://doi.org/10.3390/computation11090181
N. Musthafa H-S, Walker J, Rahman T, Bjørkum A, Mustafa K, Velauthapillai D. In-Silico Prediction of Mechanical Behaviour of Uniform Gyroid Scaffolds Affected by Its Design Parameters for Bone Tissue Engineering Applications. Computation. 2023; 11(9):181. https://doi.org/10.3390/computation11090181
Chicago/Turabian StyleN. Musthafa, Haja-Sherief, Jason Walker, Talal Rahman, Alvhild Bjørkum, Kamal Mustafa, and Dhayalan Velauthapillai. 2023. "In-Silico Prediction of Mechanical Behaviour of Uniform Gyroid Scaffolds Affected by Its Design Parameters for Bone Tissue Engineering Applications" Computation 11, no. 9: 181. https://doi.org/10.3390/computation11090181
APA StyleN. Musthafa, H.-S., Walker, J., Rahman, T., Bjørkum, A., Mustafa, K., & Velauthapillai, D. (2023). In-Silico Prediction of Mechanical Behaviour of Uniform Gyroid Scaffolds Affected by Its Design Parameters for Bone Tissue Engineering Applications. Computation, 11(9), 181. https://doi.org/10.3390/computation11090181